1. Introduction
Natural gas hydrates have been found to occur naturally in large quantities on the deep ocean floor and in permafrost regions [
1,
2]. These natural gas hydrates are seen as a potentially vast energy resource, but an economical exploitation method has so far proven elusive [
3]. Nowadays, replacement of CH
4 with CO
2 in natural gas hydrate-bearing sediments is recognized as a promising technology for the simultaneous recovery of natural gas and geological entrapment of CO
2 in hydrate form [
4,
5,
6].
Based on experimental measurements and theoretical calculations, many researchers have proved the feasibility of methane exploitation by CO
2 injection [
7,
8,
9,
10,
11]. For example, Ohgaki
et al. [
7] found the change in Gibbs free energy (Δ
G) for the replacement process of CH
4 in hydrates with CO
2 was negative, which is the first theoretical evidence for the feasibility of CH
4-CO
2 replacement process. Based on the
P-
T phase diagrams of CH
4 and CO
2 hydrate [
4,
6,
8,
9,
10], it can be seen that the equilibrium pressure of CO
2 hydrate is lower than that of CH
4 hydrate when the temperature is lower than 283 K. This indicates that under the same conditions CO
2 hydrate is more stable than CH
4 hydrate. Seo
et al. [
11] found for CH
4/CO
2 gas mixtures, when the molar fraction of CO
2 is higher than 40%, the molar fraction of CO
2 in hydrate phase will be more than 90%. With the decrease of pressure, the concentration of molar fraction of CO
2 and the selectivity of CO
2 to CH
4 will increase. In addition to pure CO
2, flue gas was also used for exploitation of methane. For example, Park
et al. [
12] found the final methane replacement efficiency was ranged from 71.3% to 83.4% with different CO
2/N
2 molar compositions. Recently, Koh
et al. [
13] investigated the replacement process in clay sediments. They found CO
2/N
2 gas mixtures worked better than pure CO
2.
During the gas injection, CH
4 replacement, and CH
4 production processes, we need to know the variations of the geophysical properties of the hydrate reservoir to avoid production problems like geological disasters. It is known that the acoustic wave velocity is an important geophysical property. It can provide the information of the stiffness evolution of hydrate-bearing sediments, which is related to the stability of gas hydrate reservoirs [
14]. For example, compressional wave velocity,
i.e., P-wave velocity (
Vp), could be related to elastic modulus (
M) of the sediment by the following equation [
15]:
where
ρ is the density of the sediment. In our previous work [
16], we have described an apparatus for measuring
Vp of the hydrate bearing sediment and a series of
Vp datasets were obtained for different hydrate saturations. In this work, the stability of hydrate reservoirs during the replacement process of CH
4 with CO
2 is examined by measuring and analyzing the variation of
Vp.
3. Results and Discussion
To investigate the influence of the type of injected gas on the efficiency of CH
4-CO
2 replacement, we prepared four hydrate bearing sediment samples using the same sand with a sand grain diameter range of 0.30 to 0.45 mm and a porosity of 37.8 vol %. Their properties such as the hydrate saturation are close to each other. The experimental conditions for methane hydrate formation and CH
4-CO
2 replacement processes as well as the properties of hydrate-bearing sediment samples were listed in
Table 1.
T1 and
P1 are the initial temperature and pressure at which hydrate-bearing sediment was formed.
T2 and
P2 are temperature and the initial pressure at which the replacement experiment was carried out.
Sw is the initial saturation of water in sediment before hydrate formation, which was defined as the fraction of pore volume occupied by water.
Sh is the saturation of hydrate in the prepared hydrate bearing sediment, which was defined as the fraction of pore volume occupied by hydrate.
is the initial mole number of methane in the hydrate phase before the replacement. As shown in
Table 1,
Sh is close to
Sw in each experiment run, which indicates that most of water was converted into hydrate. As an example, the evolution of temperature and pressure in the formation of hydrate bearing sediment in experiment run 1 was shown in
Figure 2. From it, one can see that gas pressure in reactor decreased with as hydrate formation proceeded. At the beginning stage of hydrate formation, the sediment temperature increased rapidly because the air bath temperature was higher than the initial temperature of the sediment. However, when it reaches the air bath temperature, the sediment temperature remains nearly constant during the long period of hydrate formation. This can be attributed to the reason that hydrate was formed from ice in this work and the heat released in the hydrate formation was much less than that released in the hydrate formation from liquid water.
Figure 2.
The evolvement of system pressure and temperature with the elapsed time during experiment Run 1. A–B, period of hydrate formation; B–C, depressurization above dissociation pressure of methane hydrate; C–D, flooding process of free CH4 with CO2; D–E, beginning stage of the replacement of CH4 with CO2; and E–F, long stable period of replacement.
Gaseous CO2 was used as injected gas in the first two experimental runs, while CO2 + N2 gas mixtures were used in runs 3 and 4. The concentration of N2 in gas mixtures in runs 3 and 4 were 78 mol % and 96 mol %, respectively.
The replacment processes using pure gaseous CO
2 were carried out at two different temperatures, 273.2 K and 277.2 K, respectively, in experimental runs 1 and 2. The corresponding experimental results were given in
Figure 2,
Figure 3,
Figure 4 and
Figure 5.
Figure 2 shows the evolution of the system pressure and temperature with the elapsed time during experiment run 1. One can see there was a sudden decrease of temperature when the free gas pressure decreased (from point B to point C in
Figure 2) because of the Joule-Thomson effect. However, it rebounded in a short time. On the other hand, there was a sudden increase of temperature during the flooding process of free CH
4 with CO
2. This could be attributed to the fact that the flooding CO
2 temperature is higher than that of sediment. Correspondingly, the pressure also increased a little. At the beginning stage of replacement, there was a rapid decrease of pressure, which corresponds to a rapid increase of P-wave velocity as shown in the following
Figure 3. This phenomenon indicates that part of water produced from the dissociation of methane hydrate in flooding process formed hydrate again with CO
2. During the long period of the replacement process, there was no obvious change in temperature. This phenomenon demonstrates the heat released in the formation of CO
2 hydrate is balanced by the heat absorbed in the dissociation of methane hydrate during the replacement process. However, the pressure in the reactor decreased very slowly during the replacement process. This phenomenon might be attributed to the fact that there was interstitial water in the hydrate and it might form hydrate because the pressure is higher than the equilibrium hydrate formation pressure of CO
2.
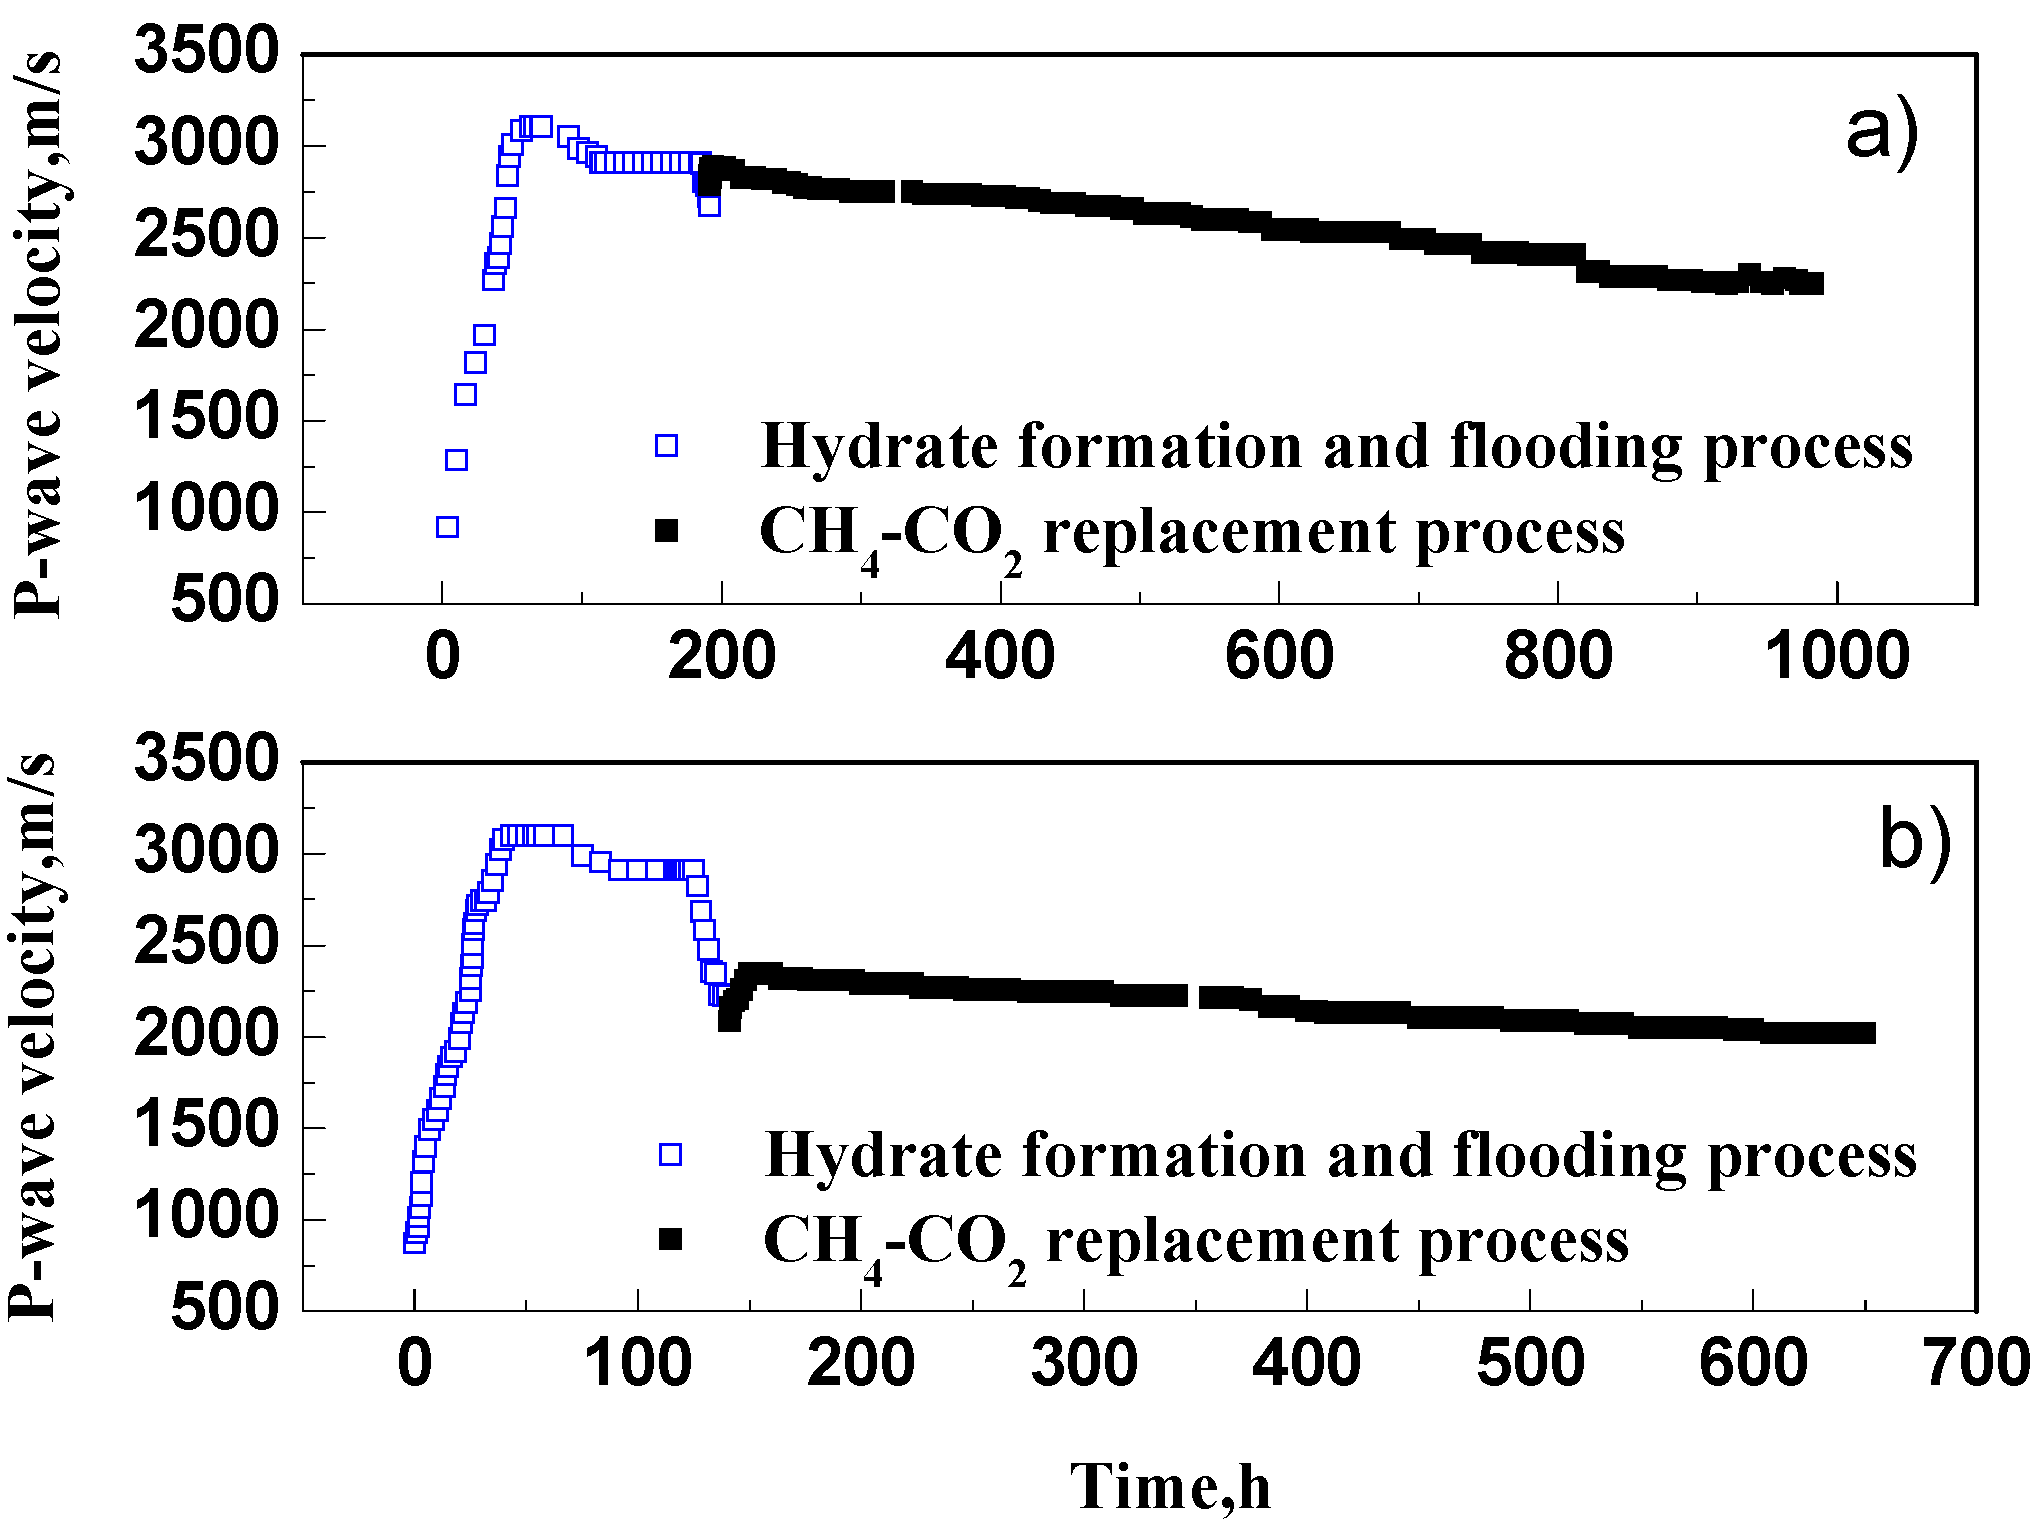
Figure 3.
Variation of P-wave velocity with elapsed time during methane hydrate formation and CH4-CO2 replacement processes. (a) Run1 at 273.2 K and (b) run 2 at 277.2 K.
Figure 3.
Variation of P-wave velocity with elapsed time during methane hydrate formation and CH4-CO2 replacement processes. (a) Run1 at 273.2 K and (b) run 2 at 277.2 K.
Figure 3 shows the variations of P-wave velocity with elapsed time during methane hydrate formation and CH
4-CO
2 replacement processes in experimental runs 1 and 2. As can be seen from
Figure 3, the variations of P-wave velocity have similar trends in the two experimental runs. In the methane hydrate formation stage, P-wave velocity firstly increased to a maximum value, then decreased slightly, and finally tended to be constant in both runs. During the depressurization and flooding process of free methane gas,
i.e., injecting CO
2 from the bottom and releasing gas mixture from the top of the reactor, the P-wave velocity decreased in both runs. This phenomenon demonstrates that the flooding process can lead to the dissociation of methane hydrate. As there was a heating process in run 2 in order to increase temperature of sediment from 273.2 to 277.2 K, more hydrate dissociated and a bigger drop of the P-wave velocity occurred. After the flooding process,
i.e., when CO
2 injection was stopped, the P-wave velocity rebounded slightly. This phenomenon suggests that part of water produced from the dissociation of methane hydrate formed hydrate again with CO
2. For experiment run 1, almost all the loss of the P-wave velocity caused by flooding was recovered in this rebounding process. Although the rebounding strength is larger in run 2, only a small part of the P-wave velocity loss was recovered in run 2 because this loss is too large at higher temperature. In the following long standing CO
2-CH
4 replacement process, the P-wave velocity decreased slowly with elapsed time. This implies a reduction of elastic modulus of hydrate-bearing sediment during CH
4-CO
2 replacement because P-wave velocity (
Vp) could be related to elastic modulus (
M) of the sediment by Equation (1). The replacement rate and efficiency at different times for the experimental runs 1 and 2 were calculated using Equations (8) and (9) and are plotted in
Figure 4 and
Figure 5, respectively.
Figure 4.
Variation of the replacement rate with elapsed time at different replacement temperatures.
Figure 4.
Variation of the replacement rate with elapsed time at different replacement temperatures.
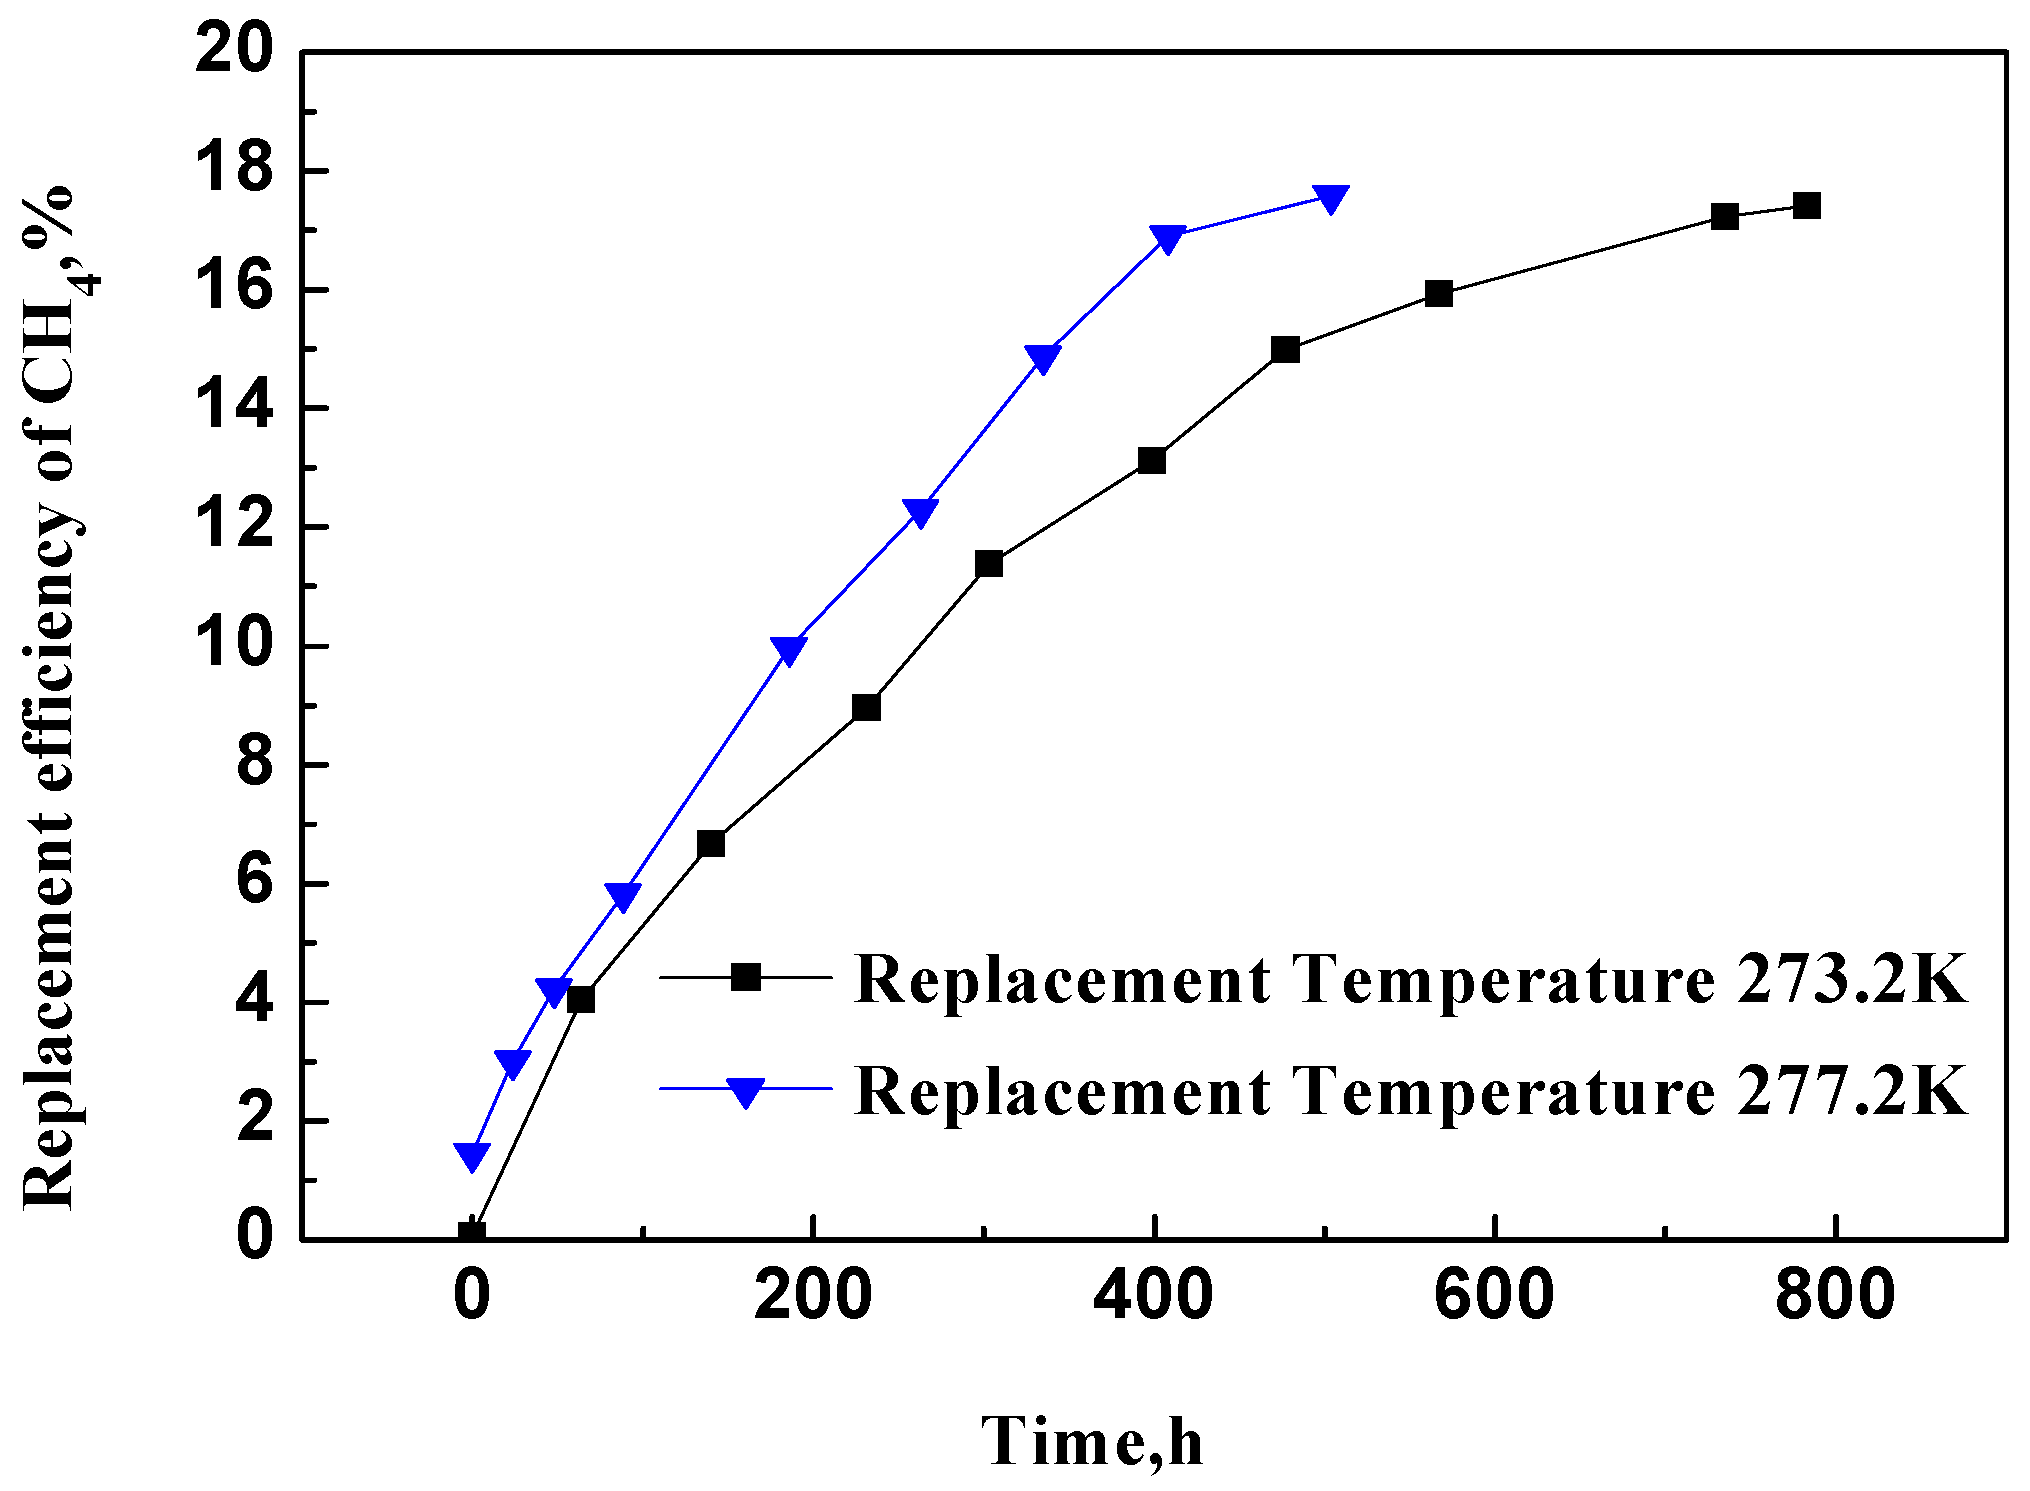
Figure 5.
Replacement efficiency of CH4 with elapsed time during the replacement process at different replacement temperatures.
Figure 5.
Replacement efficiency of CH4 with elapsed time during the replacement process at different replacement temperatures.
From
Figure 4 we can see that replacement rate of methane decreased from 9.3 × 10
−4 h
−1 to 6.9 × 10
−4 h
−1 at 273.2 K, while it decreased from 1.15 × 10
−3 h
−1 to 7.7 × 10
−4 h
−1 at 277.2 K, indicating that the higher the temperature, the higher the rate of the methane replacement. This can be attributed to the fact that the dissociation rate of methane hydrate is higher at higher temperature. Bai
et al. [
17] demonstrated that the CH
4-CO
2 replacement process is composed of two sequential processes,
i.e., the dissociation of methane hydrate and the formation of a CH
4-CO
2 double hydrate. Thus the higher dissociation rate results in a total higher replacement rate. This characteristic of the CH
4-CO
2 replacement process requires that the formed CH
4-CO
2 double hydrate be of enough porosity for dissociated CH
4 molecules to escape and for CO
2 molecules to diffuse into the interface of methane hydrate and CH
4-CO
2 double hydrate. Thus, as the replacement proceeds, the porosity of the hydrate- bearing sediment increased and led to the decrease of P-wave velocity as shown in
Figure 3.
As shown in
Figure 5, although the replacement rate is higher at higher temperature, the influence of temperature on the final replacement efficiency is not obvious. At 273.2 K, the highest efficiency is 17.4% and it is 17.6% at 277.2 K. This conclusion is consistent with that obtained by Qi
et al. [
18] Using a pure water system, they investigated the influence of temperature and pressure on the CO
2 and CH
4 replacement process. Their experimental results show that within a certain range, increasing the replacement temperature can promote the replacement process, but the influence on replacement efficiency is not obvious.
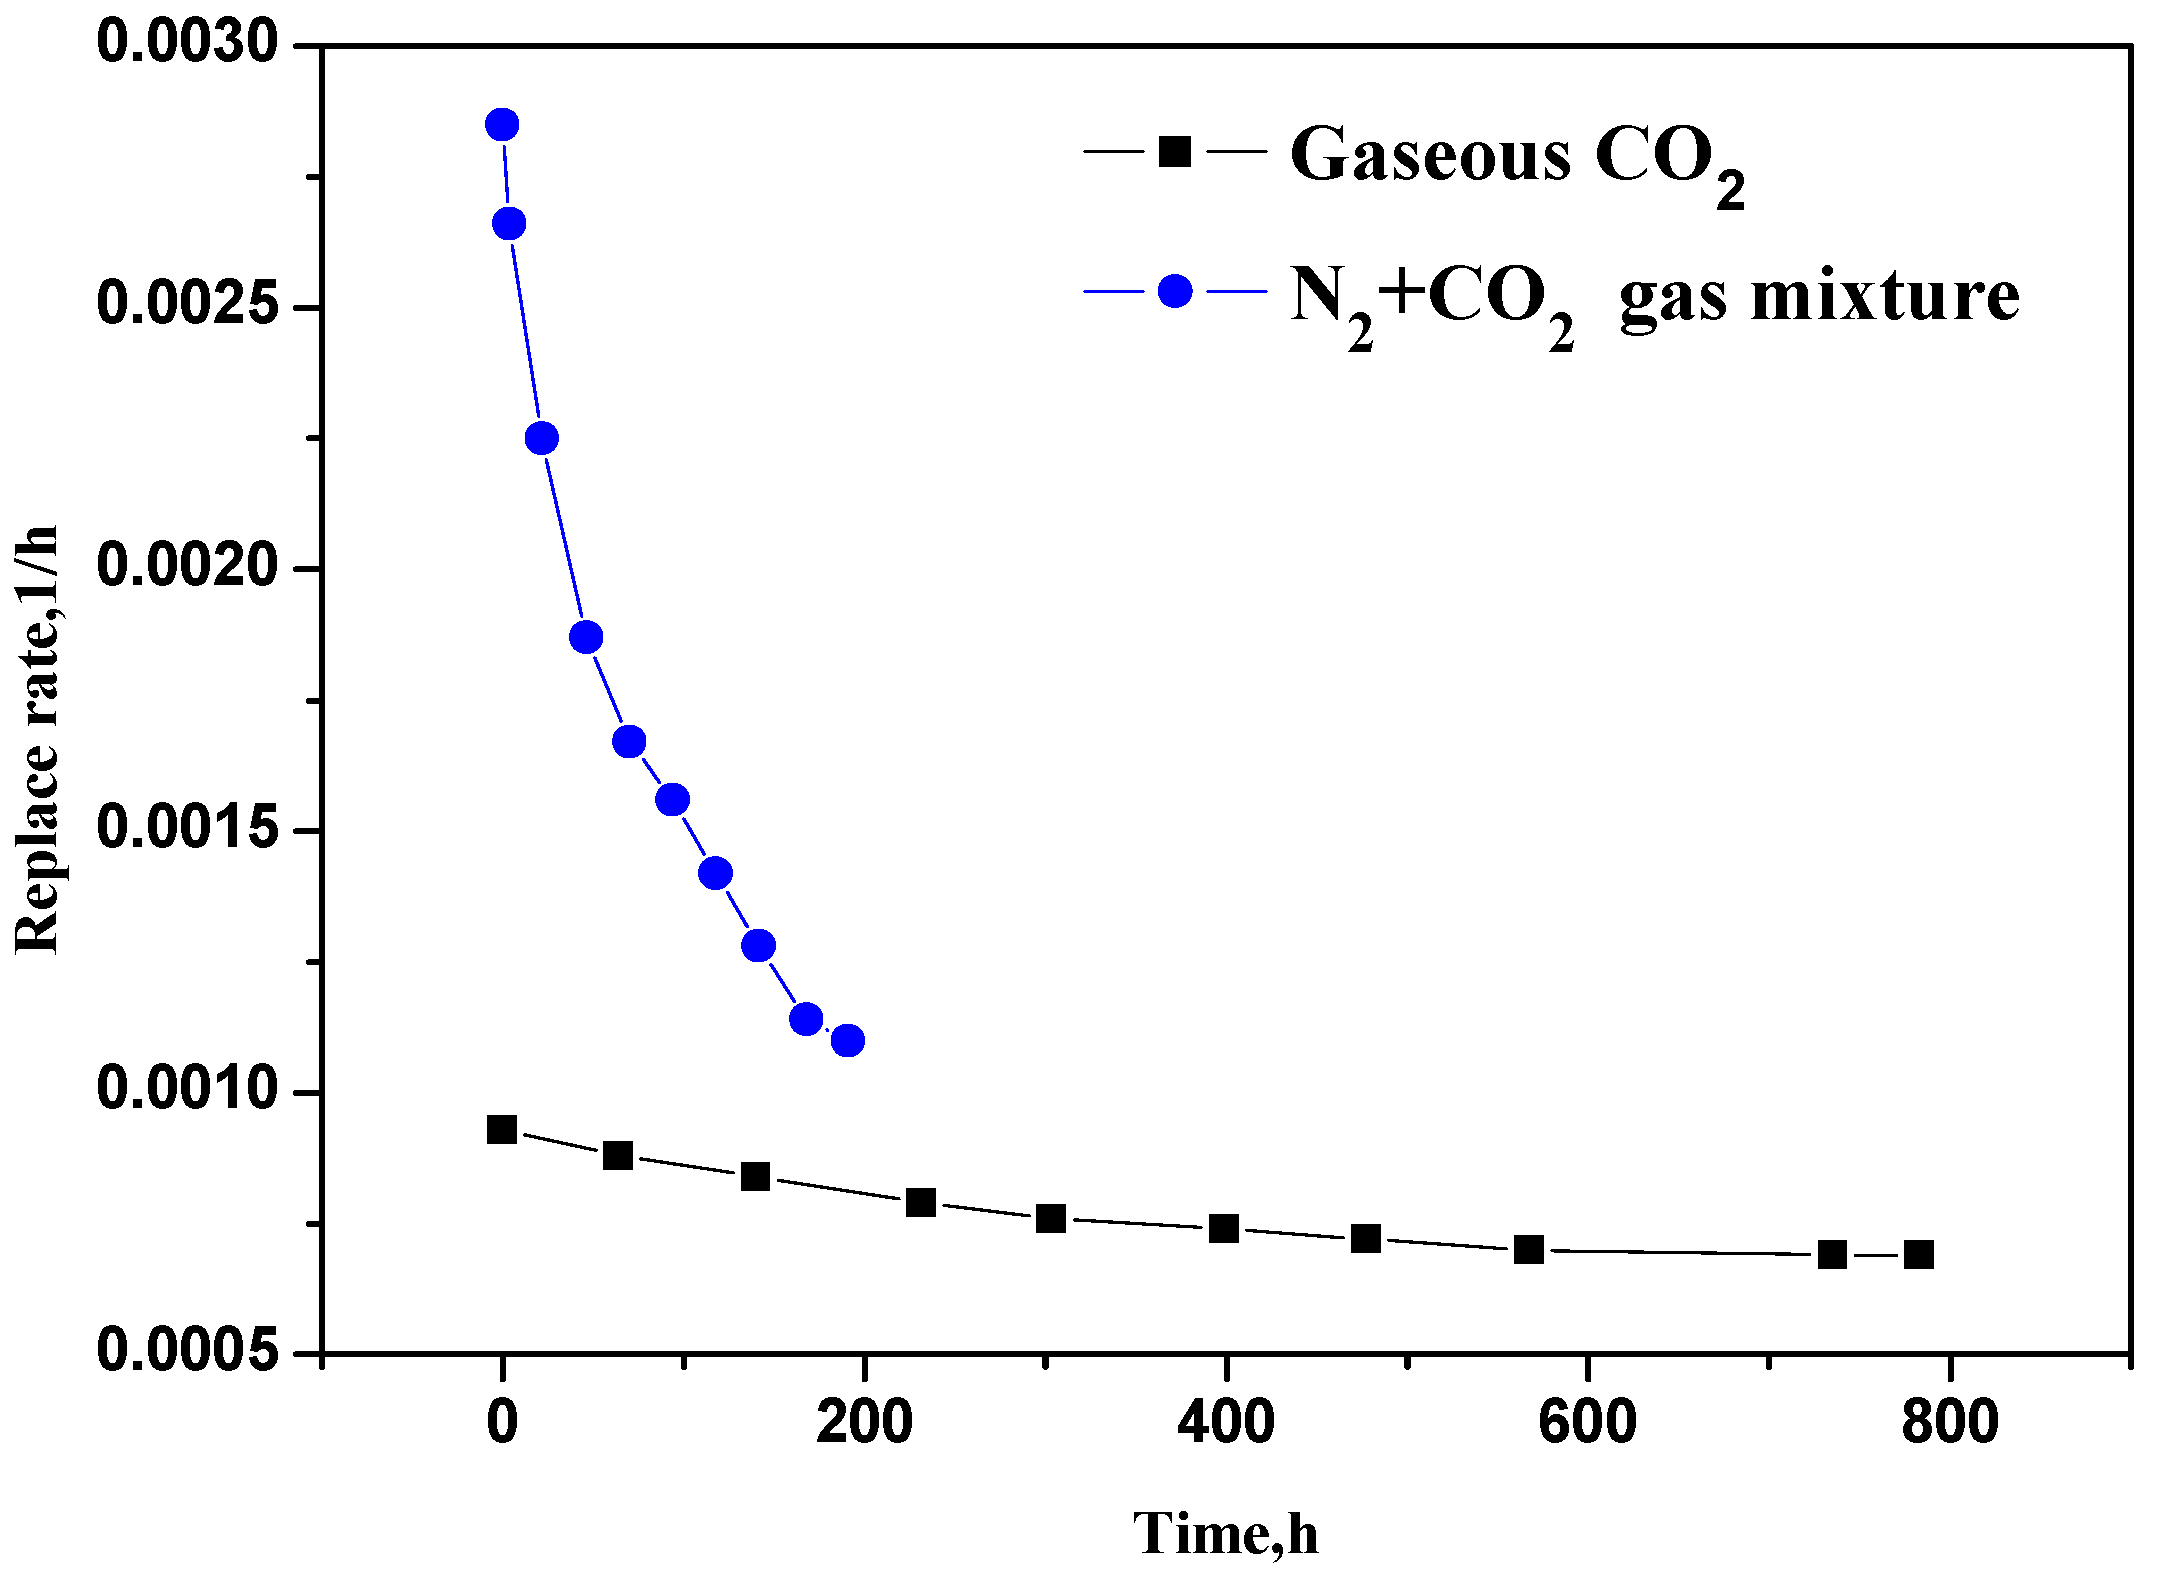
Figure 6,
Figure 7 and
Figure 8 show the comparisons between experimental results of run 1 and those of run 3. As denoted before, pure gaseous CO
2 was used as injected gas in experimental run 1 and CO
2 + N
2 gas mixture with 78 mol % of N
2 was used in run 3.
Figure 6.
Variation of the replacement rate with elapsed time for different replacement gases.
Figure 6.
Variation of the replacement rate with elapsed time for different replacement gases.
Figure 7.
Variation of the replacement efficiency of CH4 with elapsed time for different replacement gases.
Figure 7.
Variation of the replacement efficiency of CH4 with elapsed time for different replacement gases.
Figure 8.
Comparison of variation of P-wave velocity during methane hydrate formation and replacement process using (A) 22 mol % CO2 + 78 mol % N2 and (B) pure gaseous CO2.
Figure 8.
Comparison of variation of P-wave velocity during methane hydrate formation and replacement process using (A) 22 mol % CO2 + 78 mol % N2 and (B) pure gaseous CO2.
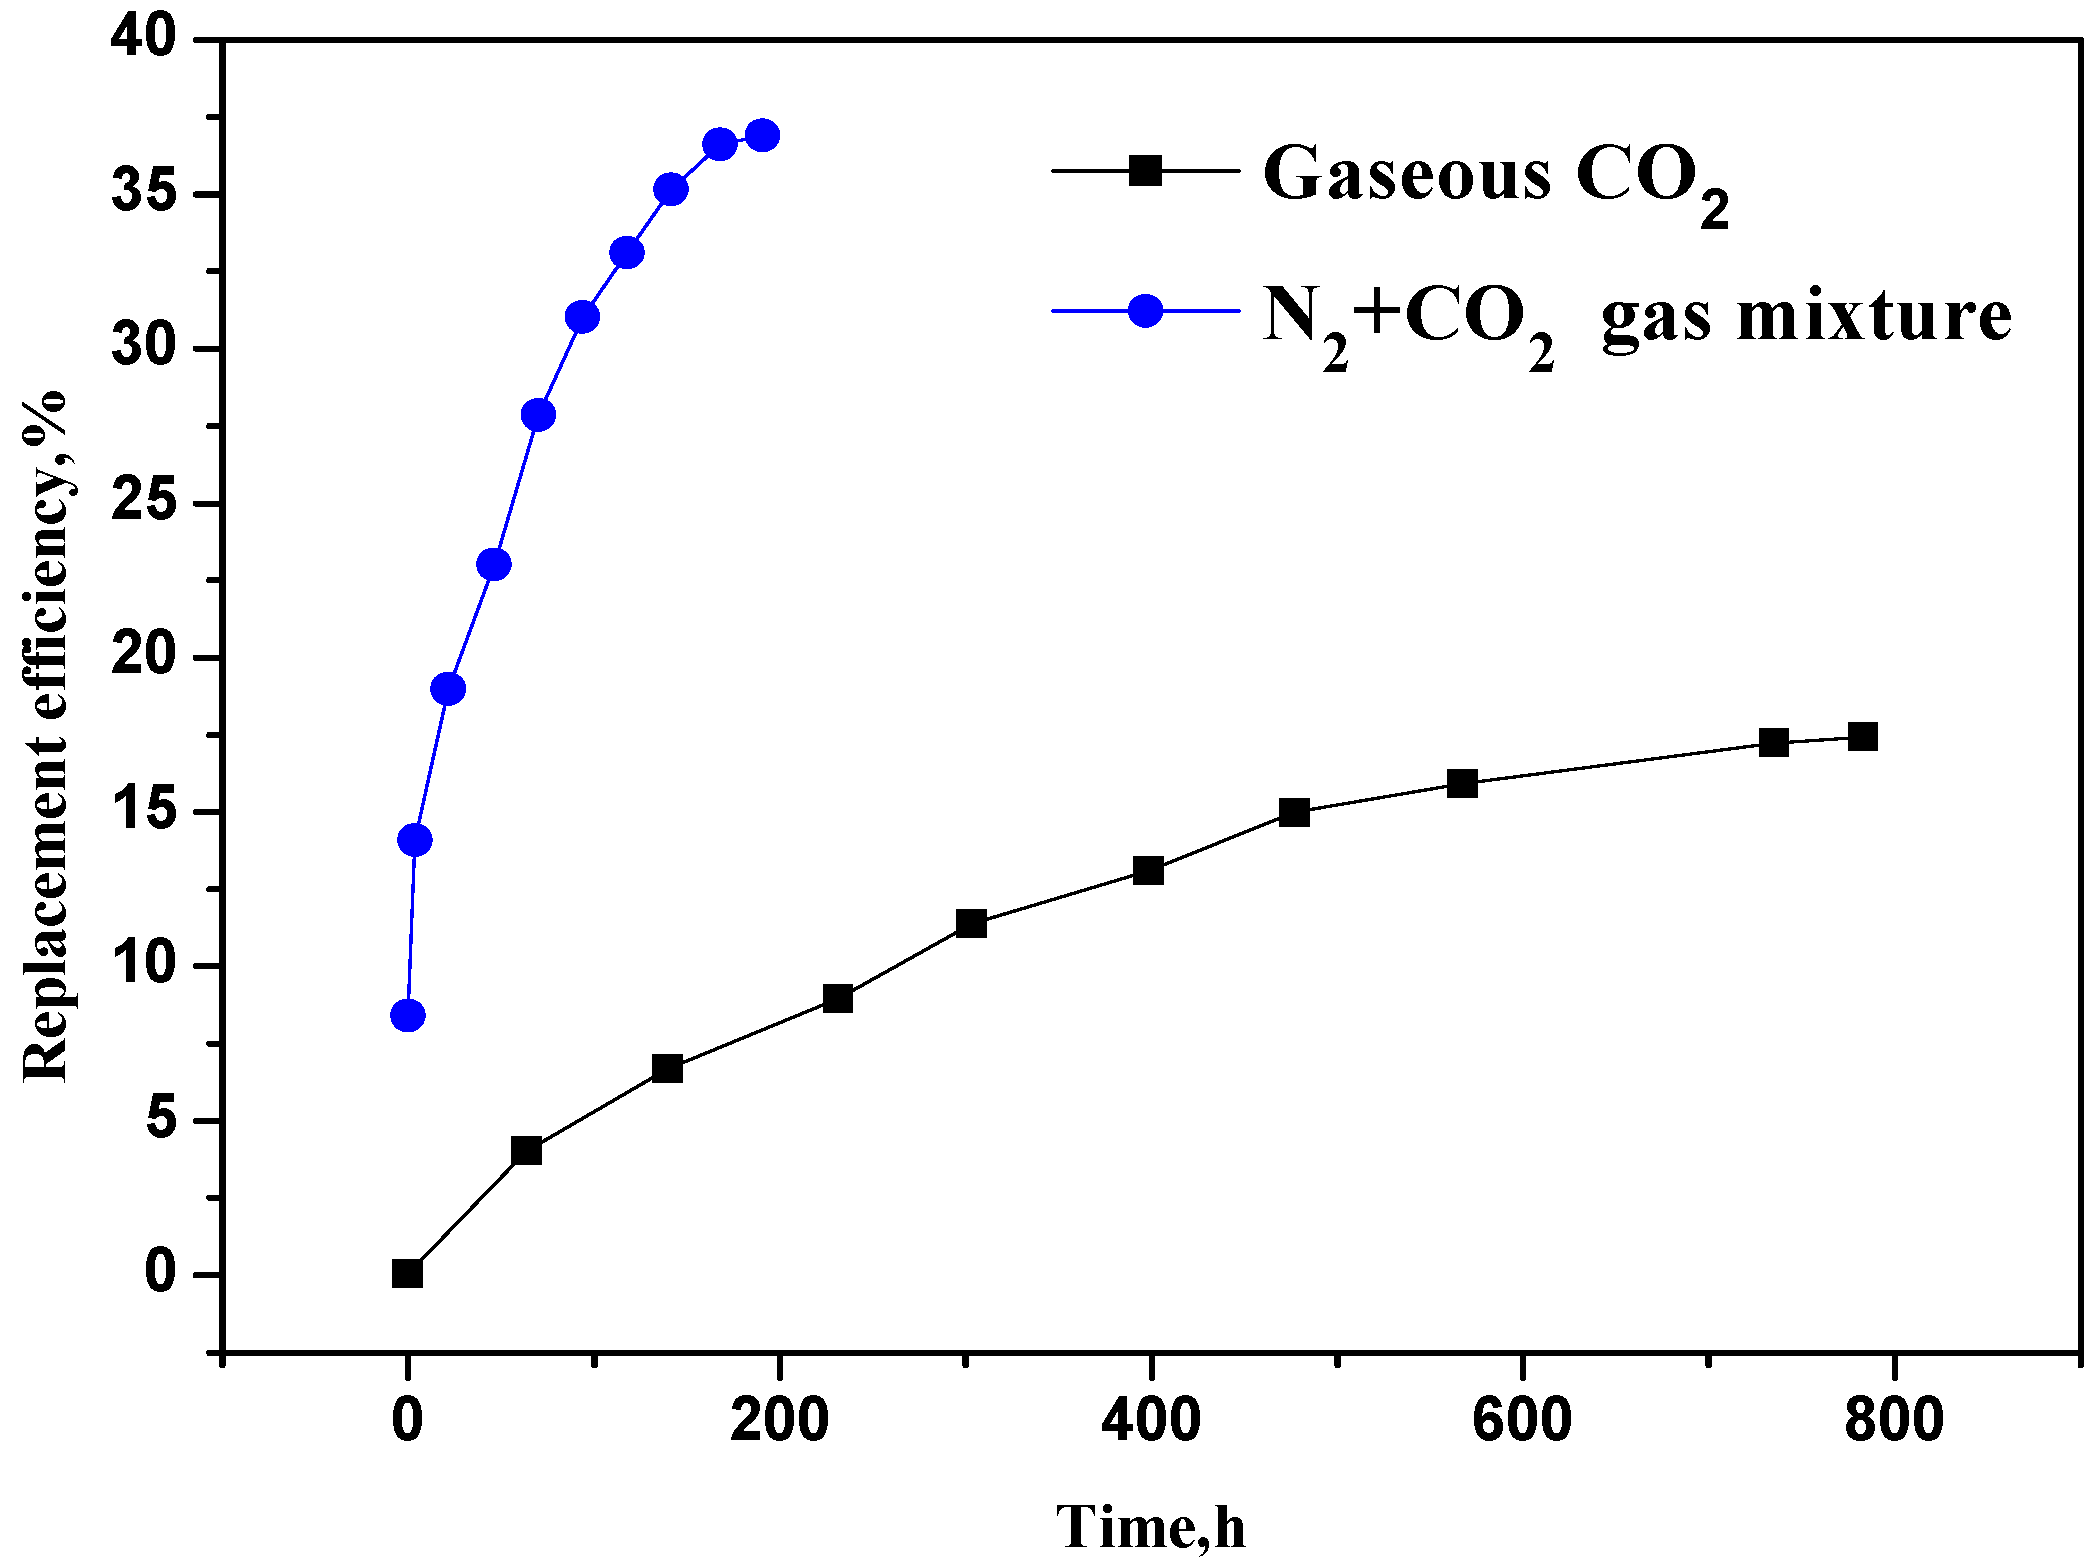
We can see from
Figure 6 and
Figure 7 that when we used a CO
2 + N
2 mixture for the replacement of methane, the replacement rate is much higher than that using pure gaseous CO
2. The highest replacement efficiency reached 36.9% when we used a CO
2 + N
2 mixture, which is much higher than that using pure gaseous CO
2 (17.4%). The reason for this might be that, compared with pure CO
2, the hydrate formation pressure of CO
2 + N
2 gas mixture is much higher at the same temperature. Thus, in the beginning stage, the water produced from the dissociation of methane hydrate could not form hydrate again. Without the coating effect of the re-formed hydrate, the dissociation rate of methane hydrate remains at a high level until the molar fraction of methane in the gas mixture reaches a value at which gas mixture can form hydrate with water. This can be demonstrated by
Figure 8.
Figure 8 shows a comparison of the variation laws of P-wave velocity in experimental runs 1 and 3. One can see that the decrease of the P-wave velocity is much bigger during the flooding period when using CO
2 + N
2 gas mixture, indicating more methane hydrate is dissociated in this case. Additionally, unlike the case using pure CO
2, no rebound of P-wave velocity was observed when the flooding ended, indicating that CO
2 + N
2 gas mixture cannot form hydrate with the dissociated water during the beginning stage of the replacement process. The final P-wave velocity in run 3 is 1554 m/s, which is lower than the values obtained in experimental runs 1 and 2. All these results indicate that when we use CO
2/N
2 gas mixtures for replacing methane, although a higher replacement rate and efficiency could be achieved, the sediment stability decreases to some extent.
In order to further demonstrate the mechanism described above, we performed another experimental run (run 4) for the replacement of methane using a CO
2 + N
2 gas mixture containing only 6 mol % of CO
2. The P-wave velocity profiles obtained in this run are given in
Figure 9.
Figure 9.
Variations of P-wave velocity as a function of elapsed time during methane hydrate formation and replacement process for run 4.
Figure 9.
Variations of P-wave velocity as a function of elapsed time during methane hydrate formation and replacement process for run 4.
From
Figure 9 we can see a big drop of the P-wave velocity, indicating a remarkable dissociation of methane hydrate occurred during the flooding period. More significantly,
Figure 9 shows that the P-wave velocity decreased rapidly during the replacement process. About 2.2 h later, the acoustic signal disappeared completely, indicating that most methane hydrate was dissociated and no hydrate reformed by the gas mixture of CO
2, N
2 and CH
4 because of the high concentration of N
2 in it. This is because the partial pressure of CO
2 and CH
4 in the gas phase is low. The dissociation of hydrate in sediment results in the rapid decrease of the sediment stiffness. The effect of the sediment stiffness on the attenuation of acoustic energy is obvious, so the P-wave velocity decreased quickly. Ultimately we are unable to collect the acoustic signal. The final replacement efficiency in this group of experiment is 67%, which is significantly higher than that in other experimental runs; however, from
Figure 9 we can see that when the mole fraction of N
2 in gas mixture is very high, so the stability of the sediment could not be guaranteed.
Based on the Chen-Guo hydrate model [
19], the CO
2 hydrate equilibrium pressures were calculated to be 1.21 MPa and 1.96 MPa at 273.2 K and 277.2 K, respectively. The initial formation pressures of CO
2 + N
2 double hydrate at 273.2 K were calculated to be 4.91 MPa and 14 MPa for the gas mixtures containing 78 mol % N
2 and 96 mol % N
2, respectively. Thus, it is possible for injected gases to form hydrate in experiment runs 1 to 3 because the replacement pressures, as listed in
Table 1, are higher than their initial hydrate formation pressure. However, it is impossible for injected gas in experiment run 4 to form hydrate as its initial hydrate formation pressure is much higher than the specified replacement pressure of 5.1 MPa. In this case, the replacement process could not occur. What occurred was only the dissociation of methane hydrate because of the low partial pressure in the free gas phase caused by the injection of CO
2 + N
2 gas mixture. For experiment run 3, also part of the water from the dissociation of methane hydrate could also not form hydrate as the concentration of CO
2 in the free gas phase decreased as the replacement proceeds and the initial hydrate formation pressure of the free gas might reach the replacement pressure. Thus, part of the replacement efficiency was contributed by the pure dissociation of methane hydrate in this run. In this case, the saturation of hydrate in the sediment would decrease. That is why the final P-wave velocity was smaller than in those cases (runs 1 and 2) using pure CO
2 in. In order to increase the contribution of pure replacement and maintain the sediment stability, a higher replacement pressure should be adopted.

