How Efficient are Agitators in Biogas Digesters? Determination of the Efficiency of Submersible Motor Mixers and Incline Agitators by Measuring Nutrient Distribution in Full-Scale Agricultural Biogas Digesters

Abstract
:1. Introduction
1.1. General Introduction

1.2. Economic Impact
1.3. Research on Agitation in Biogas Digesters
1.3.1. Effects of Mixing on Biogas Production
1.3.2. New Approaches in Studying Mixing Efficiency
1.4. Conclusions for This Study
- ▪
- Development of an invasive system for spatial resolved sampling in a full-scale biogas digester;
- ▪
- Studying the effect of stirring with different agitator units on nutrient distribution in the biogas digester.
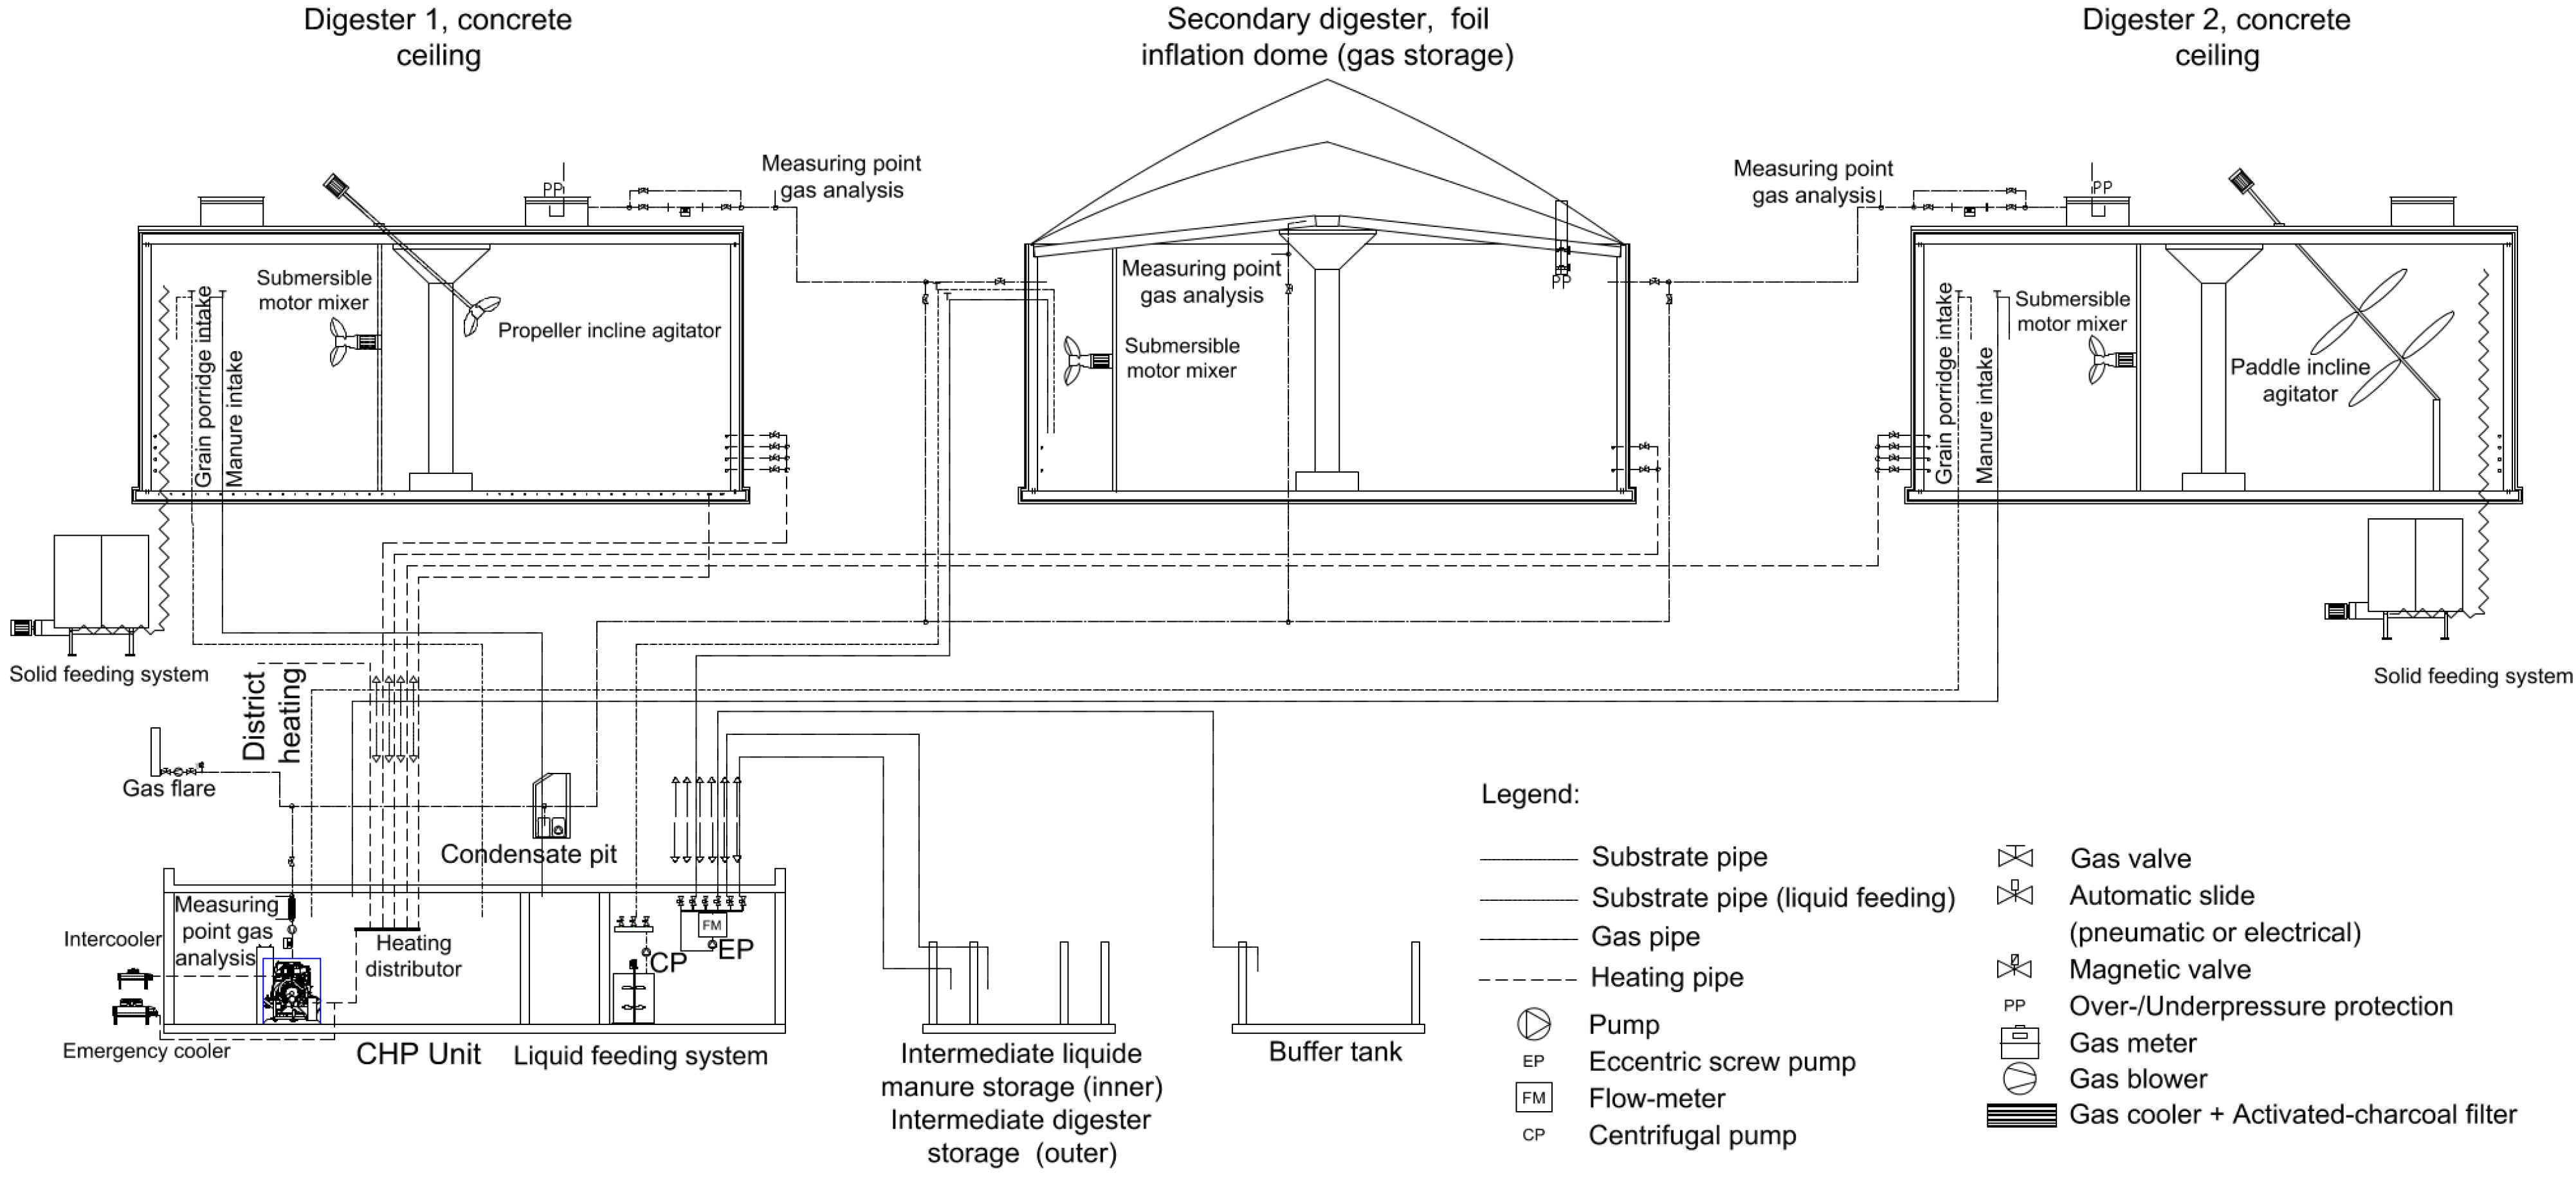
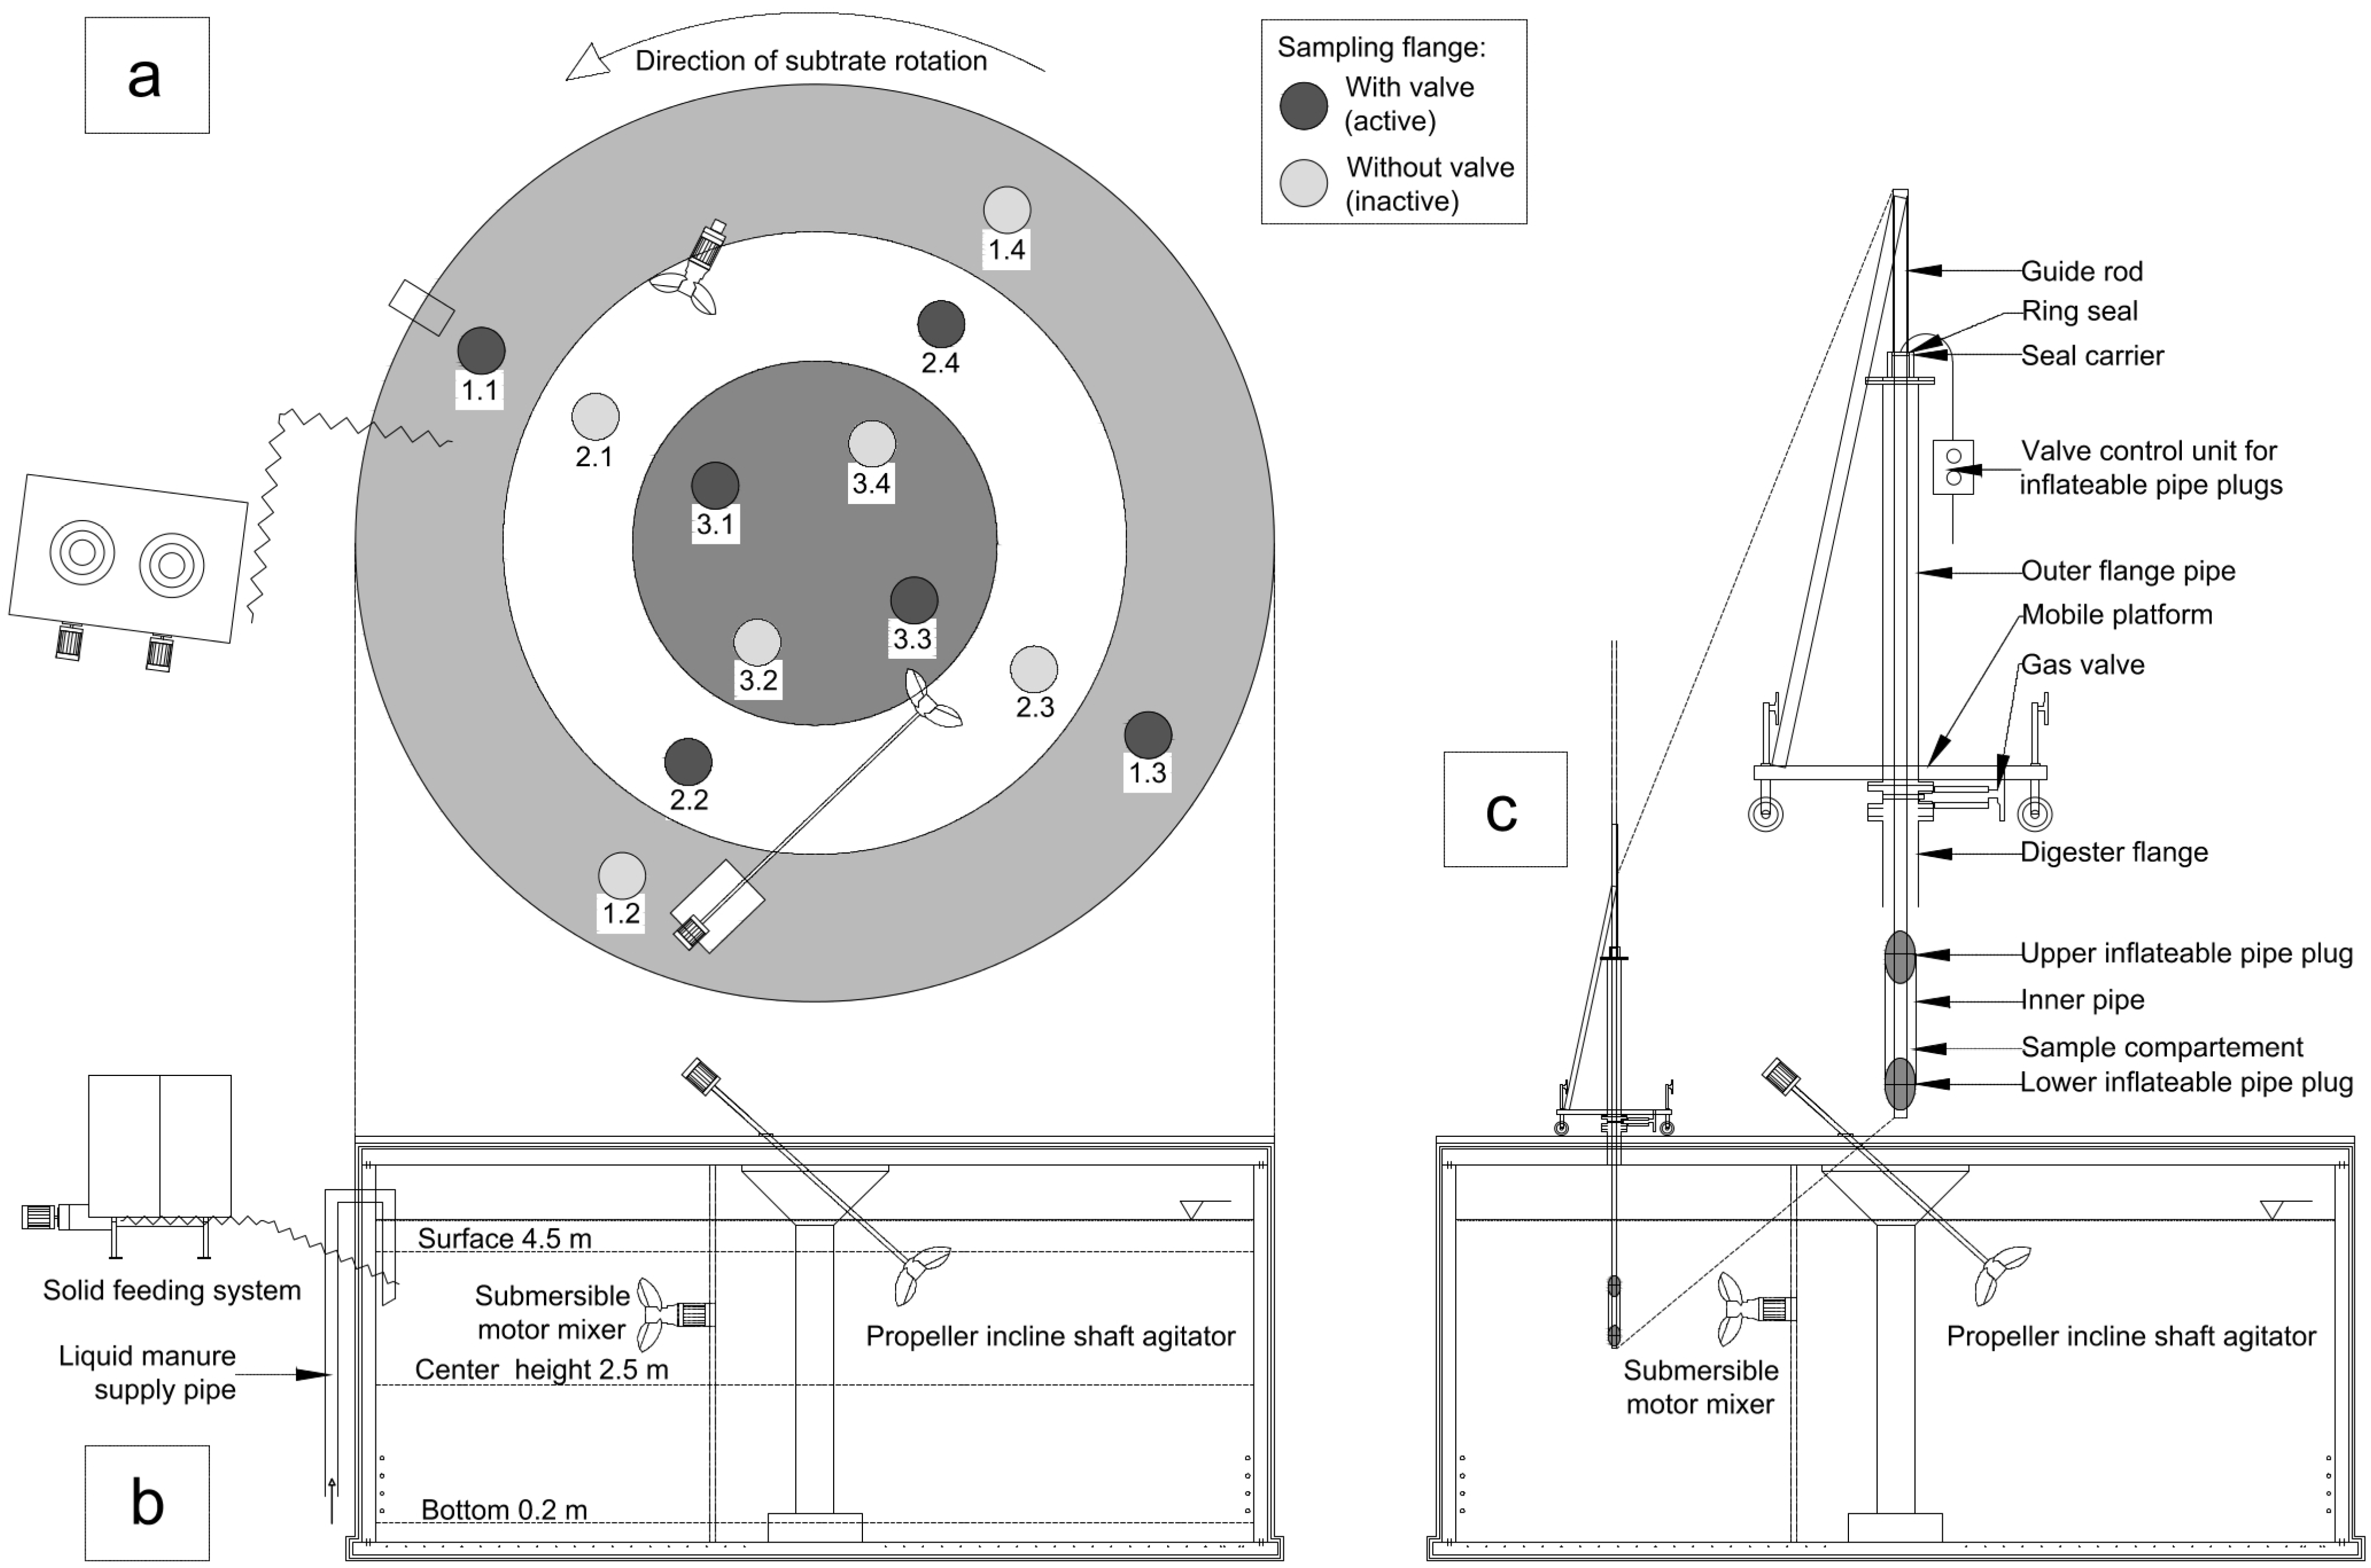
2. Material and Methods


3. Results and Discussion
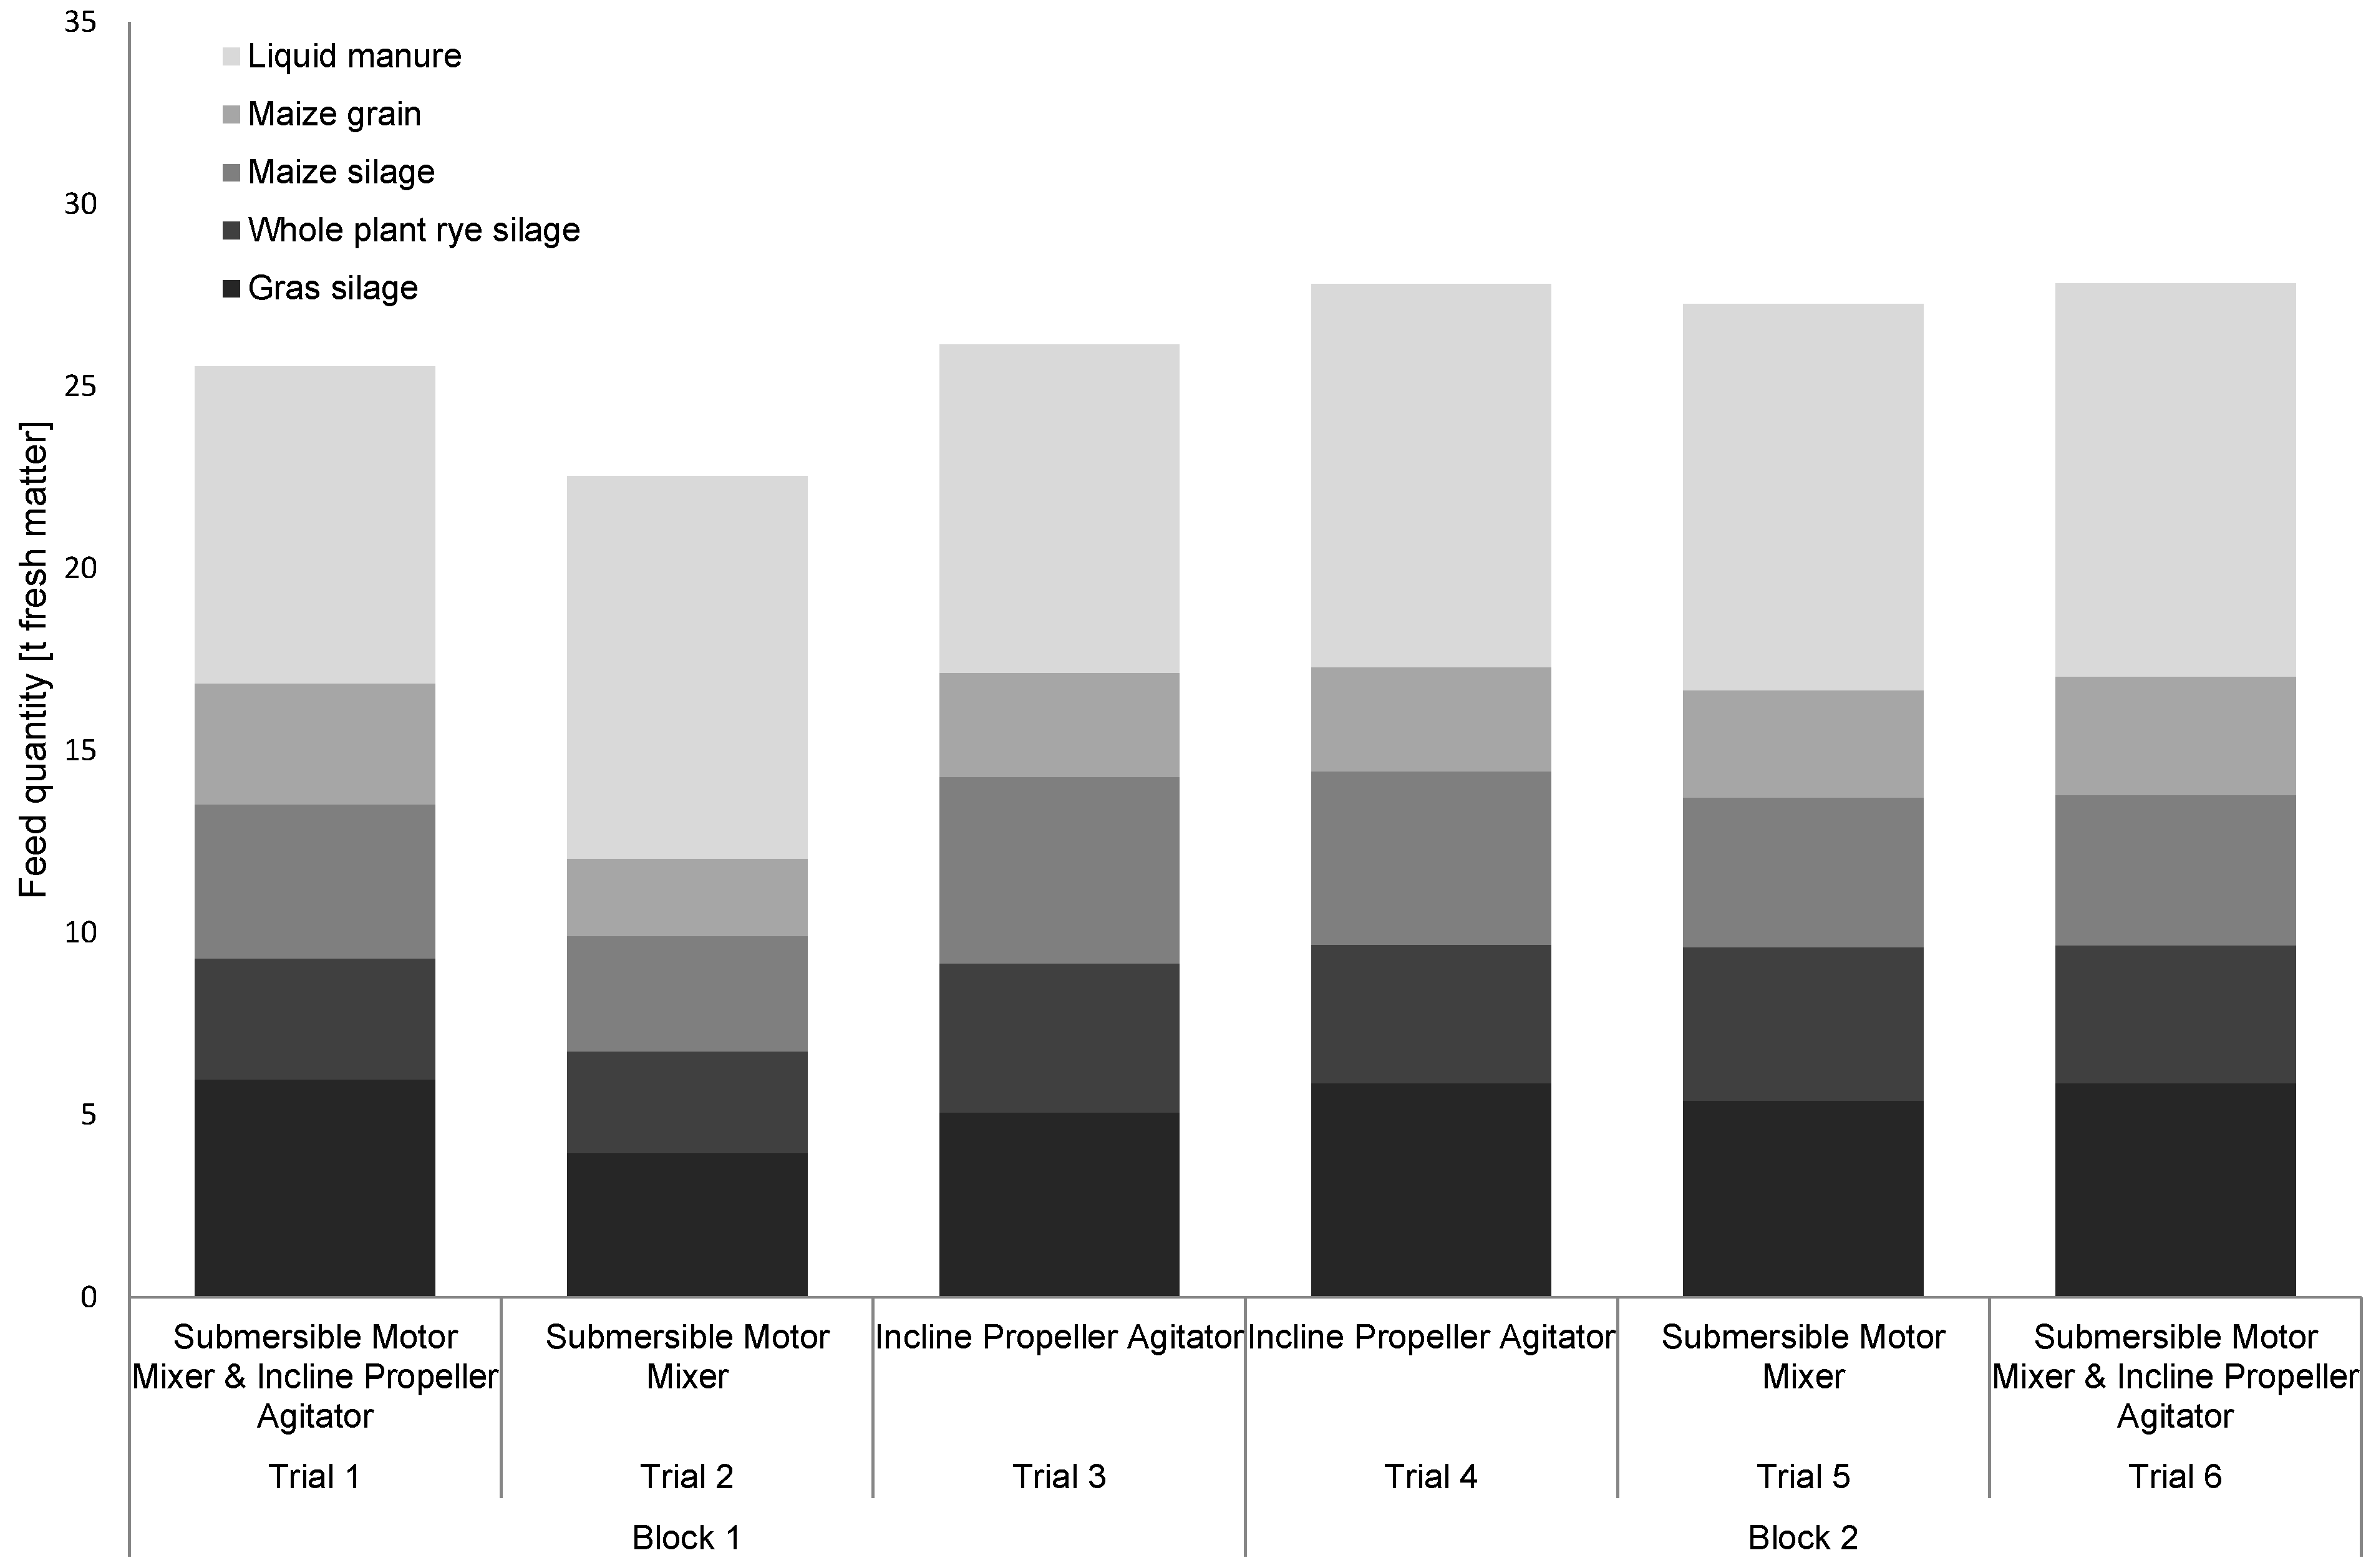
3.1. Feed Intake
3.2. Distribution of DM

| Effect | Degrees of freedom numerator | Degrees of freedom denominator | F-Statistic | Pr > F |
|---|---|---|---|---|
| Block | 1 | 9 | 28.18 | 0.0005 *** |
| Block × Agitator | 2 | 9 | 1.65 | 0.2455 ns |
| Agitator | 2 | 9 | 0.19 | 0.8271 ns |
| Position | 5 | 9 | 1.29 | 0.3481 ns |
| Height | 2 | 44 | 1.38 | 0.2611 ns |
| Position × Height | 10 | 44 | 1.08 | 0.3969 ns |
| Agitator × Position | 10 | 9 | 0.52 | 0.8406 ns |
| Agitator × Height | 4 | 44 | 0.45 | 0.7711 ns |
| Effect | Degrees of freedom numerator | Degrees of freedom denominator | F-Statistic | Pr > F |
|---|---|---|---|---|
| Block | 1 | 19 | 44.05 | <0.0001 *** |
| Block × Agitator | 2 | 19 | 5.21 | 0.0157 * |
| Agitator | 2 | 19 | 0.42 | 0.6600 ns |
| Position | 5 | 19 | 1.70 | 0.1841 ns |
| Height | 2 | 58 | 1.42 | 0.2489 ns |
3.3. Distribution of Acetic Acid
| Effect | Degrees of freedom numerator | Degrees of freedom denominator | F-Statistic | Pr > F |
|---|---|---|---|---|
| Block | 1 | 9 | 7.36 | 0.0239 * |
| Block × Agitator | 2 | 9 | 4.56 | 0.0428 * |
| Agitator | 2 | 11.5 | 10.90 | 0.0022 ** |
| Position | 5 | 11.5 | 4.08 | 0.0226 * |
| Height | 2 | 19 | 5.25 | 0.0153 * |
| Position × Height | 10 | 19.5 | 1.93 | 0.1030 ns |
| Agitator × Position | 10 | 11.3 | 1.98 | 0.1366 ns |
| Agitator × Height | 4 | 20.2 | 0.63 | 0.6434 ns |
| Effect | Degrees of freedom numerator | Degrees of freedom denominator | F-Statistic | Pr > F |
|---|---|---|---|---|
| Block | 1 | 12.7 | 5.73 | 0.0329* |
| Block × Agitator | 2 | 12.7 | 5.92 | 0.0153* |
| Agitator | 2 | 23.9 | 7.18 | 0.0036** |
| Position | 5 | 24.1 | 3.30 | 0.0208* |
| Height | 2 | 28.2 | 4.29 | 0.0236* |
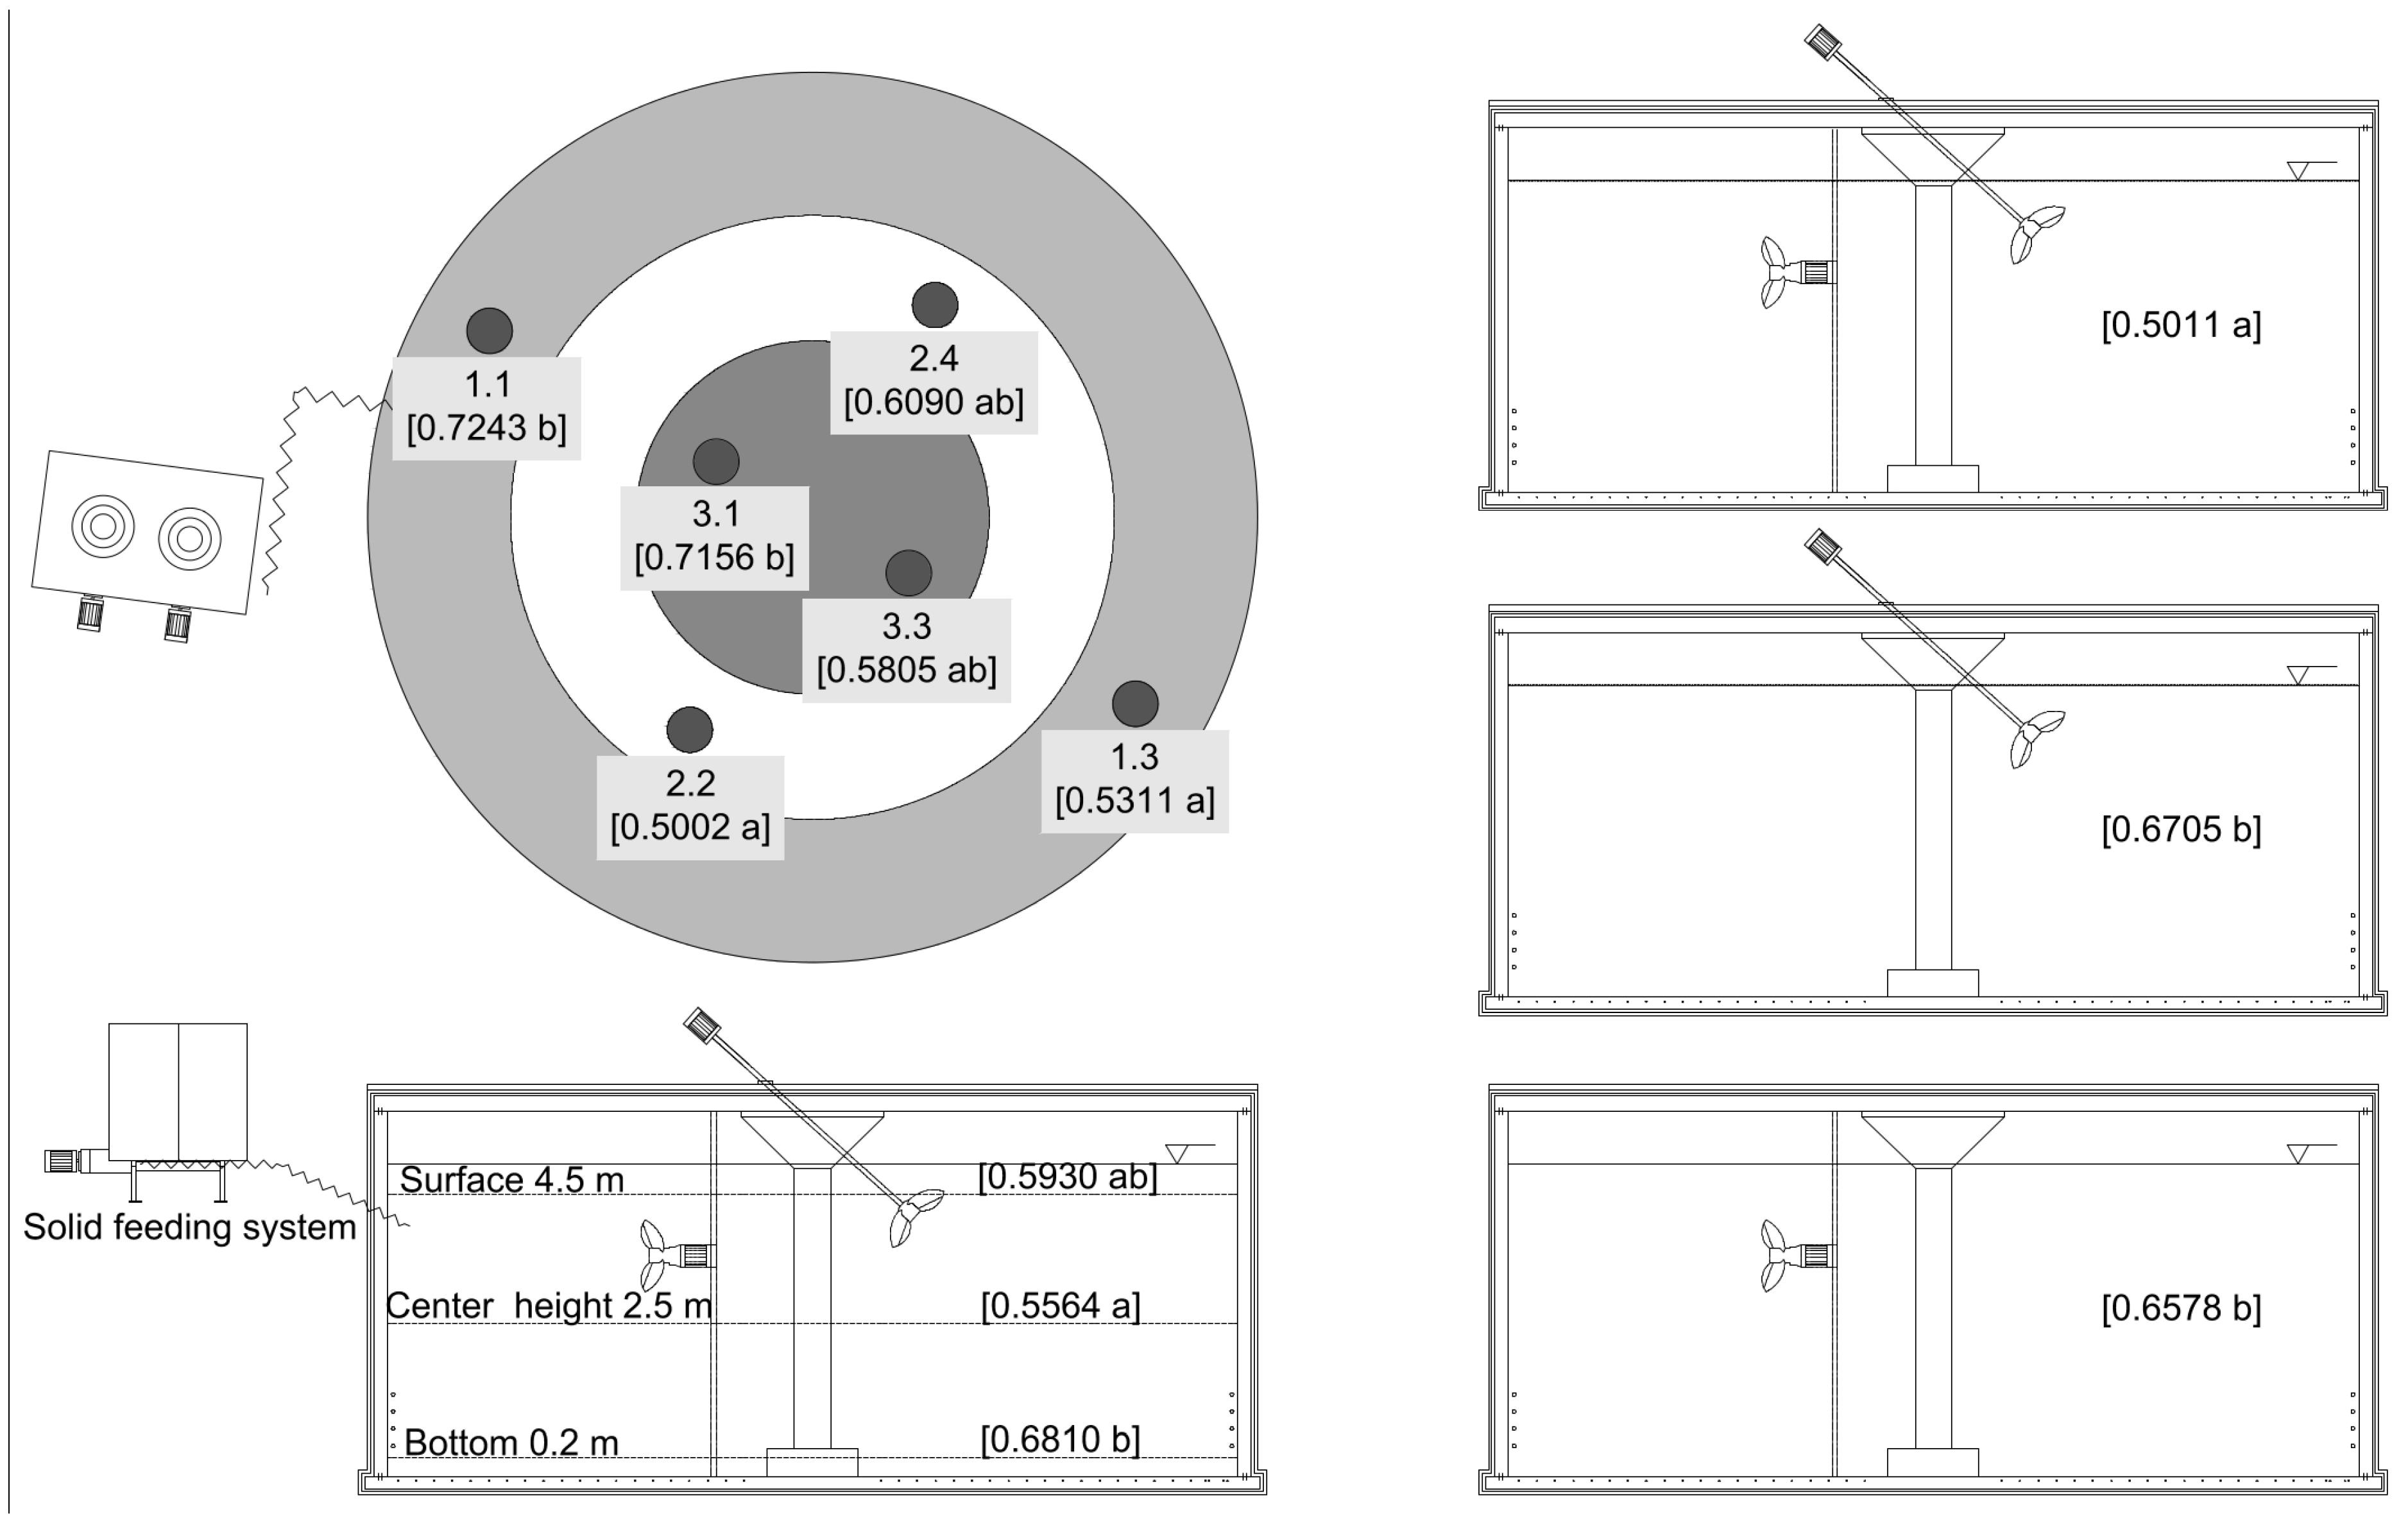
| Effect | Agitator | Position | Height | Estimated means transformed | Mean raw data (g/kg) | Standard error | df | t-value |
|---|---|---|---|---|---|---|---|---|
| Height | - | - | Center | −0.2761 a | 0.5564 | 0.02412 | 43.3 | −11.45 |
| Height | - | - | Surface | −0.2477 ab | 0.5930 | 0.02412 | 43.3 | −10.27 |
| Height | - | - | Bottom | −0.1890 b | 0.6810 | 0.02412 | 43.3 | −7.84 |
| Position | - | 1.1 | - | −0.1500 b | 0.7243 | 0.04126 | 24.1 | −3.63 |
| Position | - | 1.3 | - | −0.3233 a | 0.5311 | 0.04126 | 24.1 | −7.84 |
| Position | - | 2.2 | - | −0.3034 a | 0.5002 | 0.04126 | 24.1 | −7.35 |
| Position | - | 2.4 | - | −0.2501 ab | 0.6090 | 0.04126 | 24.1 | −6.06 |
| Position | - | 3.1 | - | −0.1446 b | 0.7156 | 0.04126 | 24.1 | −3.51 |
| Position | - | 3.3 | - | −0.2544 ab | 0.5805 | 0.04126 | 24.1 | −6.17 |
| Agitator | Incline propeller agitator | - | - | −0.1891 b | 0.6705 | 0.02899 | 24 | −6.52 |
| Agitator | Submersible motor mixer | - | - | −0.1962 b | 0.6578 | 0.02899 | 24 | −6.77 |
| Agitator | Submersible motor mixer & Incline propeller shaft agitator | - | - | −0.3276 a | 0.5011 | 0.02899 | 24 | −11.30 |

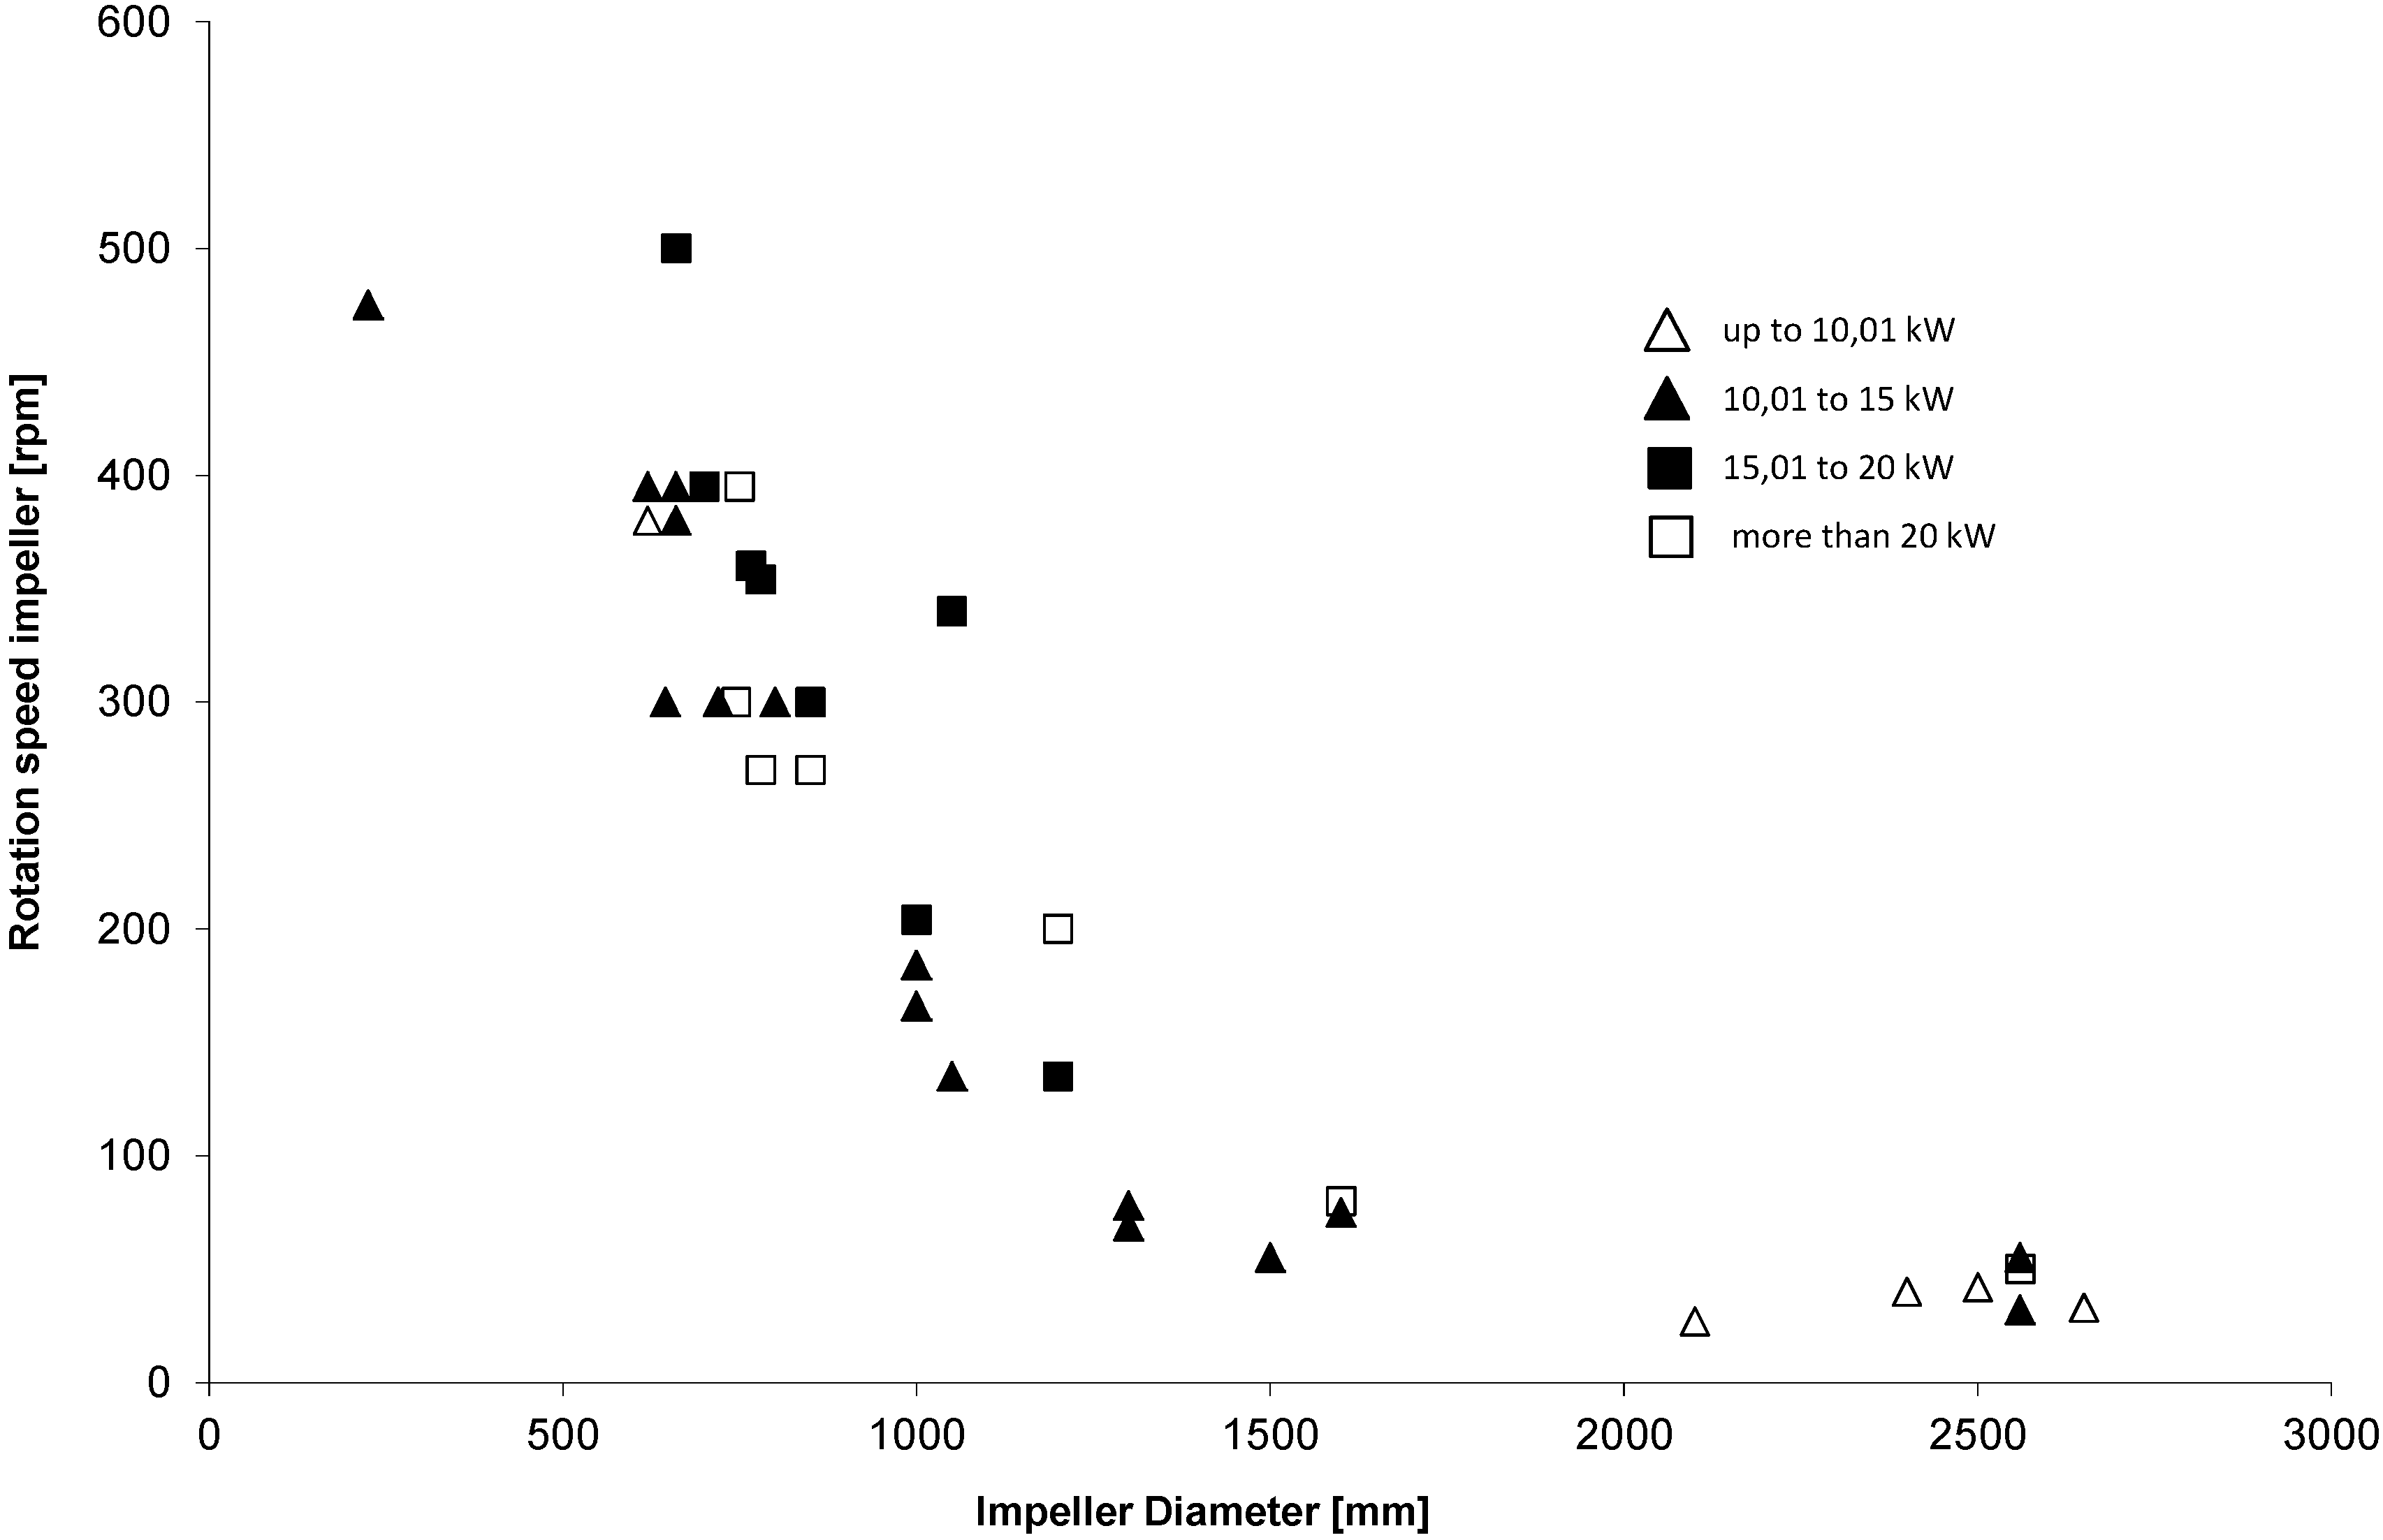
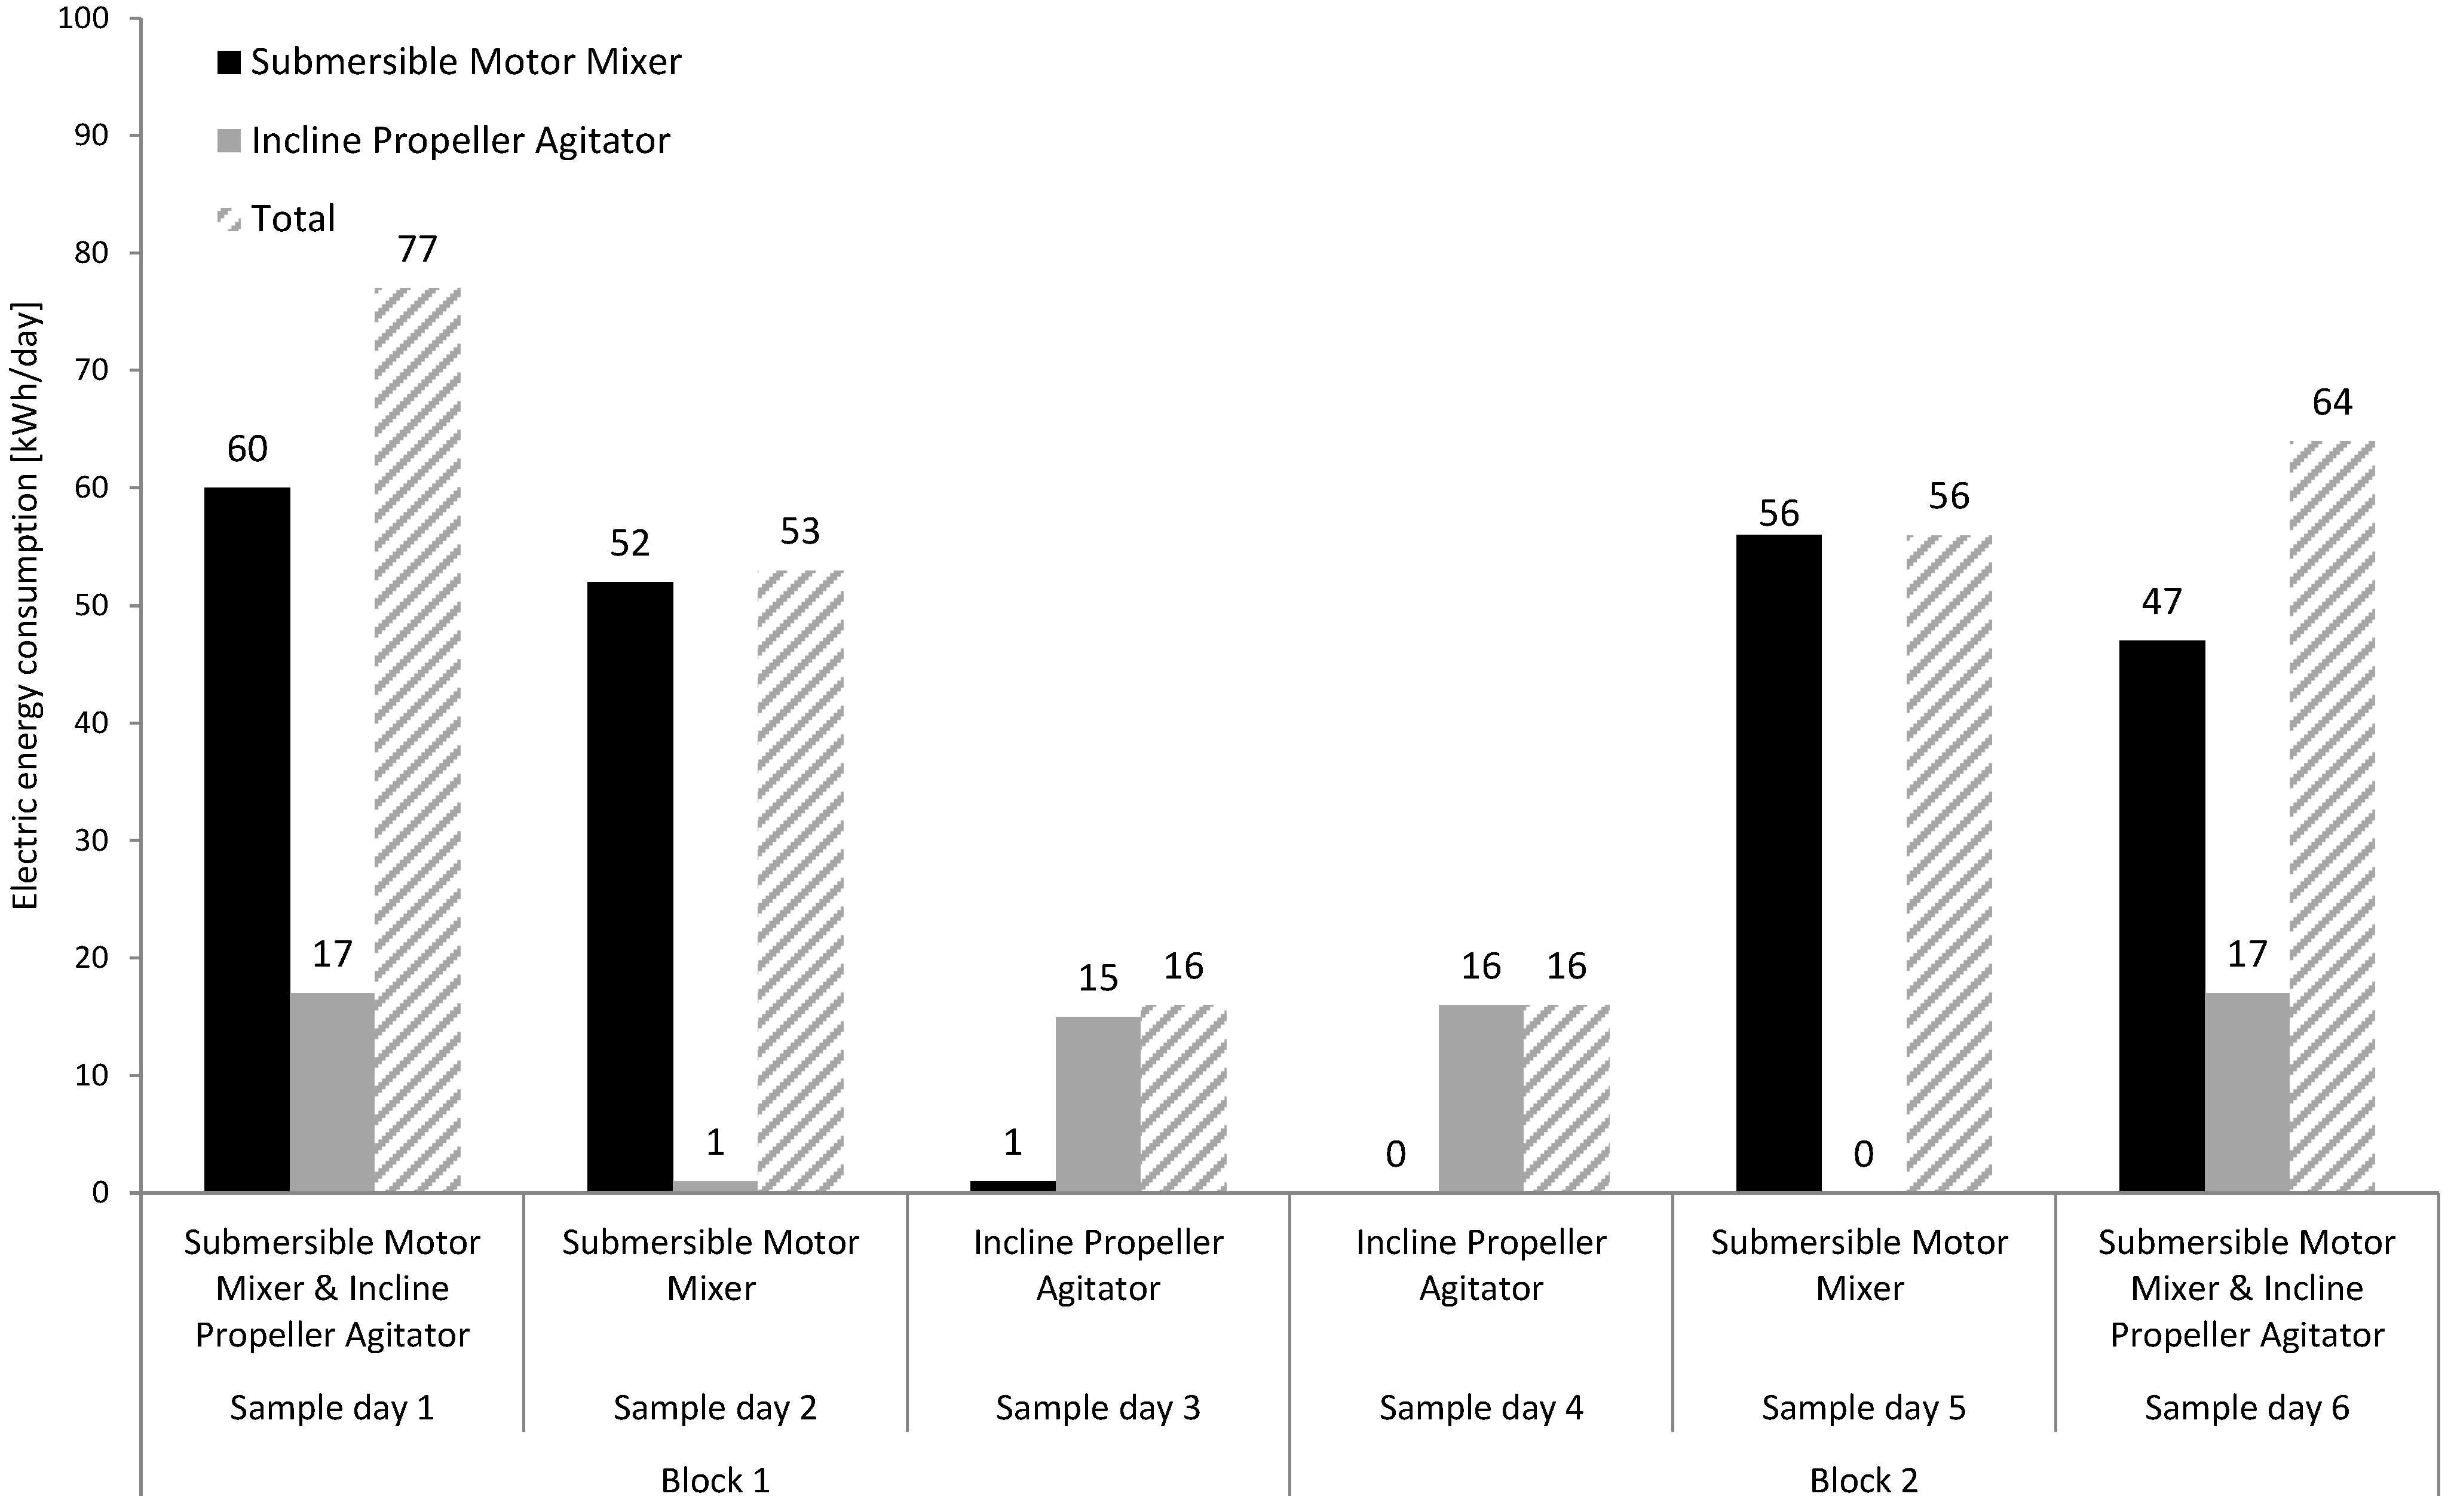
3.4. Electric Energy Consumption of Agitators and Mixing Quality

4. Summary and Conclusions
Acknowledgments
Conflicts of Interest
References
- Gemmeke, B.; Rieger, C.; Weidland, P.; Schröder, J. Biogas-Messprogramm II, 61 Biogasanlagen im Vergleich (in German); Fachagentur Nachwachsende Rohstoffe: Guelzow-Pruezen, Germany, 2009; pp. 1–168. [Google Scholar]
- Abdel-Hadi, M.A.; Abd El-Azeem, S.A.M. Effect of heating, mixing and digester type on biogas production from buffalo dung. Misr J. Agric. Eng. 2008, 25, 1454–1477. [Google Scholar]
- Vesvikar, M.S.; Al-Dahhan, M. Flow pattern visualization in a mimic anaerobic digester using CFD. Biotechnol. Bioeng. 2005, 89, 719–732. [Google Scholar] [CrossRef] [PubMed]
- Hennig, T.; Dudlik, A.; Deerberg, G. Simulation of fluid flow in biogas fermenters. Chem. Ing. Tech. 2011, 83, 331–339. [Google Scholar] [CrossRef]
- Karim, K.; Varma, R.; Vesvikar, M.; Al-Dahhan, M.H. Flow pattern visualization of a simulated digester. Water Res. 2004, 38, 3659–3670. [Google Scholar] [CrossRef] [PubMed]
- Wu, B. CFD prediction of mixing time in anaerobic digesters. Trans. ASABE 2010, 53, 553–563. [Google Scholar] [CrossRef]
- Reinecke, S.; Deutschmann, A.; Jobst, K.; Kryk, H.; Friedrich, E.; Hampel, U. Flow following sensor particles—Validation and macro-mixing analysis in a stirred fermentation vessel with a highly viscous substrate. Biochem. Eng. J. 2012, 69, 159–171. [Google Scholar] [CrossRef]
- Brehmer, M.; Eppinger, T.; Kraume, M. Influence of rheology on the flow pattern in stirred biogas plants. Chem. Ing. Tech. 2012, 84, 2048–2056. [Google Scholar] [CrossRef]
- McCabe, W.L.; Smith, J.C.; Harriott, P. Unit Operations of Chemical Engineering; McGraw-Hill: New York, NY, USA, 2001; pp. 238–285. [Google Scholar]
- Nunhez, J.R.; Cekinski, E.; Joaquim, C.F., Jr.; Fernandes, L.A.G.; Seckler, M.M. Design of a Static Mixer using CFD and Experiments. In Proceedings of the AIChE Annual Meeting, Cincinnati, OH, USA, 30 October–4 November 2005.
- Mixing Mixer Agitator—Biomass Nutrient Mixing. Available online: http://www.renewable-energy-concepts.com/?id=564 (accessed on 30 August 2013).
- Hopfner-Sixt, K.; Amon, T. Monitoring of Agricultural Biogas Plants in Austria—Mixing Technology and Specific Values of Essential Process Parameters. In Proceedings of the 15th European Biomass Conference and Exhibition, Berlin, Germany, 7–11 May 2007; pp. 1718–1728.
- Kissel, R.; Effenberger, M. Empfehlungen für die Auswahl von Rührwerken für Gärbehälter (in German); Biogas Forum Bayern: Freising, Germany, 2010; pp. 1–16. [Google Scholar]
- Weiland, P. Biogas—Ein zukunftsweisender Energieträger (in German). In Erneuerbare Energie in der Land(wirt)schaft; Medenbach, M.C., Ed.; Austernfischer Verlag: Zeven, Germany, 2001; pp. 1–184. [Google Scholar]
- Naegele, H.-J.; Lemmer, A.; Oechsner, H.; Jungbluth, T. Electric energy consumption of the full scale research biogas plant “Unterer Lindenhof”: Results of longterm and full detail measurements. Energies 2012, 5, 5198–5214. [Google Scholar] [CrossRef]
- Der Eigenstromverbrauch von Biogasanlagen und Potenziale zu dessen Reduzierung (in German); Solarenergieförderverein Bayern: München, Germany, 2006.
- Branchenzahlen 2011 und Branchenentwicklung 2012/2013 (in German); German Biogas Association: Freising, Germany, 2012.
- Monteith, H.D.; Stephenson, J.P. Mixing efficiencies in full-scale anaerobic digesters by tracer methods. J. Water Pollut. Control Fed. 1981, 53, 78–84. [Google Scholar]
- Landry, H.; Laguë, C.; Roberge, M. Physical and rheological properties of manure products. Appl. Eng. Agric. 2004, 20, 277–288. [Google Scholar] [CrossRef]
- Chen, Y.R. Rheological properties of sieved beef-cattle manure slurry: Rheological model and effects of temperature and solids concentration. Agric. Wastes 1986, 15, 17–33. [Google Scholar] [CrossRef]
- Wu, B.; Chen, S. CFD simulation of non-Newtonian fluid flow in anaerobic digesters. Biotechnol. Bioeng. 2008, 99, 700–711. [Google Scholar] [CrossRef] [PubMed]
- Springer, P. Effizienzsteigerung bei der Biogasgewinnung durch Langsam Laufende Rührwerke (in German). In Proceedings of the KSB-Biogasanwender Forum, Halle an der Saale, Germany, 30 March 2012.
- Karim, K.; Hoffmann, R.; Klasson, T.; Al-Dahhan, M.H. Anaerobic digestion of animal waste: Waste strength versus impact of mixing. Bioresour. Technol. 2005, 96, 1771–1781. [Google Scholar] [CrossRef] [PubMed]
- Stafford, D.A. The effects of mixing and volatile fatty acid concentrations on anaerobic digester performance. Biomass 1982, 2, 43–55. [Google Scholar] [CrossRef]
- Stroot, P.G.; McMahon, K.D.; Mackie, R.I.; Raskin, L. Anaerobic codigestion of municipal solid waste and biosolids under various mixing conditions—I. Digester performance. Water Res. 2001, 35, 1804–1816. [Google Scholar] [CrossRef] [PubMed]
- Hoffmann, R.A.; Garcia, M.L.; Veskivar, M.; Karim, K.; Al-Dahhan, M.H.; Angenent, L.T. Effect of shear on performance and microbial ecology of continuously stirred anaerobic digesters treating animal manure. Biotechnol. Bioeng. 2008, 100, 38–48. [Google Scholar] [CrossRef] [PubMed]
- Kaparaju, P.; Buendiaa, I.; Ellegaardb, L.; Angelidakiaa, I. Effect of mixing on methane production during thermophilic anaeroboc digestion of manure: Lab-scale and pilot-scale studies. Bioresour. Technol. 2007, 99, 4919–4928. [Google Scholar] [CrossRef] [PubMed]
- Kjellstrand, R. Hydraulic Behaviour in an Activated Sludge Tank from Tracer Test through Hydraulic Modelling to Full-Scale Implementation; University College of Borås: Borås, Sweden, 2006. [Google Scholar]
- Maier, C.; Weichselbaum, W.; Schlerka, M.; Harasek, M. Development of agitation systems in biogas plants: Investigation of mixing characteristics, improvement of energy efficiency and scale-up using CFD. Chem. Eng. Trans. 2010, 21, 1195–1200. [Google Scholar]
- Brehmer, M.; Eppinger, T.; Kraume, M. Fluiddynamik in biogasreaktoren (in German). Fachver. Biogas J. 2012, 3, 76–81. [Google Scholar]
- Jobst, K.; Deutschmann, A.; Friedrich, E. Optimierung von Mischprozessen zur Biogaserzeugung—Ein Beitrag zur Steigerung der Effizienz von Biogasanlagen (in German). In Proceedings of the Innovationskongress Biogas, Hildesheim, Germany, 12–13 May 2011; pp. 267–268.
- Jobst, K. Bewertung von Mischprozessen mittels Prozess-Tomographie (in German). In Proceedings of the KSB Biogasanwender Forum, Halle an der Saale, Germany, 30 March 2012.
- Pohn, S.; Horvath, A.; Kuttner, C.; Maier, C.; Harasek, M. AD-CFD: Entwicklung von Rührwerksystemen mit optimalen Mischverhalten in Biogasanlagen und verringertem Energiebedarf mittels numerischer Strömungssimulation (in German); Impulsprogramm Nachhaltig Wirtschaften: Wien, Austria, 2011. [Google Scholar]
- Vintiloiu, A.; Boxriker, M.; Lemmer, A.; Oechsner, H.; Jungbluth, T. Trace Elements in the Biogas Process: Influence of Different Concentrations and Bioavailability. In Proceedings of the SEE 2012, Bangkok, Thailand, 27–29 February 2012.
- Lemmer, A.; Bekker, M.; Oechsner, H.; Jungbluth, T. Forschungsbiogasanlage “Unterer Lindenhof”. Landtechnik 2008, 63, 80–81. [Google Scholar]
- Naegele, H.-J.; Thomas, B.; Schrade, C.; Lemmer, A.; Oechsner, H.; Jungbluth, T. Influence of maintenance intervals on performance and emissions of a 192 kWel biogas gas Otto CHP unit and results of lubricating oil quality tests—Outcome from a continuous two-year measuring campaign. Energies 2013, 6, 2819–2839. [Google Scholar] [CrossRef]
© 2013 by the authors; licensee MDPI, Basel, Switzerland. This article is an open access article distributed under the terms and conditions of the Creative Commons Attribution license (http://creativecommons.org/licenses/by/3.0/).
Share and Cite
Lemmer, A.; Naegele, H.-J.; Sondermann, J. How Efficient are Agitators in Biogas Digesters? Determination of the Efficiency of Submersible Motor Mixers and Incline Agitators by Measuring Nutrient Distribution in Full-Scale Agricultural Biogas Digesters. Energies 2013, 6, 6255-6273. https://doi.org/10.3390/en6126255
Lemmer A, Naegele H-J, Sondermann J. How Efficient are Agitators in Biogas Digesters? Determination of the Efficiency of Submersible Motor Mixers and Incline Agitators by Measuring Nutrient Distribution in Full-Scale Agricultural Biogas Digesters. Energies. 2013; 6(12):6255-6273. https://doi.org/10.3390/en6126255
Chicago/Turabian StyleLemmer, Andreas, Hans-Joachim Naegele, and Jana Sondermann. 2013. "How Efficient are Agitators in Biogas Digesters? Determination of the Efficiency of Submersible Motor Mixers and Incline Agitators by Measuring Nutrient Distribution in Full-Scale Agricultural Biogas Digesters" Energies 6, no. 12: 6255-6273. https://doi.org/10.3390/en6126255