Article

PAT Design Strategy for Energy Recovery in Water Distribution Networks by Electrical Regulation

by
Armando Carravetta
1,
Giuseppe Del Giudice
1,
Oreste Fecarotta
1,* and
Helena M. Ramos
2
1
Department of Hydraulic, Geotechnical and Environmental Engineering, Università di NapoliFederico II, via Claudio, 21, Napoli 80125, Italy
2
Department of Civil Engineering, Instituto Superior Técnico, Technical University of Lisbon, Avenida Rovisco Pais, 1, Lisboa 1049-01, Portugal
*
Author to whom correspondence should be addressed.
Energies 2013, 6(1), 411-424; https://doi.org/10.3390/en6010411
Submission received: 23 November 2012 / Revised: 8 January 2013 / Accepted: 10 January 2013 / Published: 17 January 2013

Abstract

:
In the management of water distribution networks, large energy savings can be yielded by exploiting the head drop due to the network pressure control strategy, i.e., for leak reductions. Hydropower in small streams is already exploited, but technical solutions combining efficiency and economic convenience are still required. In water distribution networks, an additional design problem comes out from the necessity of ensuring a required head drop under variable operating conditions, i.e., head and discharge variations. Both a hydraulic regulation (HR)—via a series-parallel hydraulic circuit- and an electrical regulation (ER)—via inverter- are feasible solutions. A design procedure for the selection of a production device in a series-parallel hydraulic circuit has been recently proposed. The procedure, named VOS (Variable Operating Strategy), is based on the overall plant efficiency criteria and is applied to a water distribution network where a PAT (pump as a turbine) is used in order to produce energy. In the present paper the VOS design procedure has been extended to the electrical regulation and a comparison between HR and ER efficiency and flexibility within a water distribution network is shown: HR was found more flexible than ER and more efficient. Finally a preliminary economic study has been carried out in order to show the viability of both systems, and a shorter payback period of the electromechanical equipment was found for HR mode.

1. Introduction

A partial reduction of water leakages in urban areas can be achieved by placing control valves to reduce the pipeline water pressure, in order to avoid expensive investments in the rehabilitation of water distribution networks [1,2,3,4,5,6,7]. Therefore, the number of pressure reducing valves currently being used is increasing. The replacement of pressure reducing valves with hydropower devices [8,9] could lead to large energy savings [10]: an available study estimates the available energy in the UK water industry equal to about 17 MW [11].
A large effort has been made to develop small electro-mechanical production devices suitable for small scale power systems. Some studies proposed stand-alone solutions at remote sites, where there are local power requirements in absence of the electrical grid [12,13], while other works investigated the potential of small hydropower in the water industry, figuring out the benefits of an energy strategy [11,14] and the economic feasibility of a small-scale plant [15,16] and raising some technical issues [17,18].
Furthermore, a large number of small scale low head and low discharge hydropower devices has been proposed, e.g., small Pelton and small Francis for pressure flow conditions [19,20,21], crossflow or propeller turbines for free surface flow conditions [22] and some other devices involving small turbines for waves and tides energy production [23,24,25]. Recent studies showed that using a pump as turbine (PAT) and its induction motor as generator can produce substantial capital investment savings [12,26].
Unfortunately, for the variability of discharge and/or head drop, the efficiency of such plants is still limited, but a larger flexibility can be obtained by using a plant modulation [27]. In hydraulic regulation (HR) mode, turbine working conditions are limited in the surrounding of the Best Efficiency Point (BEP) by means of a by-pass conduit and of a pressure reducing valve in series with the turbine. Recent power electronics devices allow to regulate electrical voltage and frequency in order to vary the generator speeds, providing additional flexibility. The use of an electronic inverter substitutes the hydraulic and mechanical control mechanisms of HR. Despite the apparent interest, few papers deal with such electrical regulation (ER) [28].
A hydro-power plant installation scheme is shown in Figure 1 and its PAT operating conditions are shown in Figure 2, both for HR and ER mode. In HR mode, for an available head, H, higher than the head-drop deliverable by the machine, H i T (points to the left of the PAT characteristic curve in Figure 2), the valve in series (A) dissipates the excess pressure. Instead, when the discharge, Q i , is larger (points to the right of the PAT characteristic curve in Figure 2), the PAT would produce a head-drop higher than the available head: in this case the bypass (B valve) is opened to reduce the discharge flowing in the PAT from Q i to Q i T . A variable operating strategy (VOS) design procedure for PAT in HR modulation was recently developed by the authors [29]. This form of regulation implies an effective energy production lower than the maximum based on both available discharges and heads. Conversely, in ER mode the operating speed of the generator is changed to match the load conditions determined by the instant flow discharge and head drop values: namely the PAT characteristic curve is modified to match the available head.
Figure 1. Installation scheme of a PAT with hydraulic or electrical regulation.
Energies 06 00411 g001
Figure 2. PAT operating conditions in hydraulic (left) or electrical (right) regulation mode.
Energies 06 00411 g002
Considering that pressure reducing valves replacement with electromechanical equipment for energy production is cost-effective, and that the dissipation nodes in urban water distribution networks frequently show a large variability in flow rate and head drop [30], the choice between HR or ER is critical. However, to the authors’ knowledge, there is neither design strategy in ER mode nor available criteria for the choice between the two modes.
This lack is overcome by the present paper. VOS has been extended to ER mode and the design strategy has been applied both to HR and ER mode in order to compare the two regulation systems in terms of both overall efficiency and payback period.

2. Energy Recovery in Water Supply Systems

Control valves are placed within the water transmission network in order to face large variations in altitudes or to dissipate any residual head at the end of the pipeline [31]. In all these cases, a limited variability of flow rates and available head drop is observed and traditional hydro-power plants and design criteria can be conveniently used [32].
On the contrary, in water distribution network the water regime presents a large variability, because flow rate and pressure head depend on user demand [14]. The large variability of the hydraulic conditions is shown in Figure 3, where the flow rates (Q) and upstream pressure head ( P H ) values, measured in a pressure reducing valve station of an urban water distribution system in the town of Pompei (Campania region, Italy), are shown for a daily demand pattern, together with the available hydraulic power (P).
Figure 3. Pressure head, flow rate variations and backpressure.
Energies 06 00411 g003
The head drop, and consequently the installed power of the energy recovery plant, may vary depending on the value of the backpressure ( B P ), namely the preset head value downstream the pressure-reducing valve ensuring the optimal pressure distribution in all pipe branches. In Figure 3 the available head, H, is the difference between the pressure-head ( P H ) and the required backpressure ( B P ).
The capital cost of a traditional turbine installation of 0 . 1 MW size ranges between 1000 and 1400 €/kW [15]. The large variability of the water regime within a water distribution networks, together with the low available power could increase the unit costs of traditional turbines up to an estimated value ranged between 2300 and 7500 €/kW [21], because of the miniaturization of the turbine regulation devices. The use of PATs could be an optimal solution in order to reduce both the purchasing and maintenance costs, even if the peak efficiency for a PAT is generally low if compared with a traditional turbine, and the economic convenience of such choice is investigated herein. Variable Operating Strategy (VOS) design procedure has been recently proposed for PAT design in HR mode. A number of straightforward item rules allowed PAT’s selection (impeller diameter and rotational speed) for a given flow-head distribution pattern and optimal network B P , ensuring maximum efficiency of the power plant and a continuous pressure regulation for a PAT installed in a series-parallel configuration.

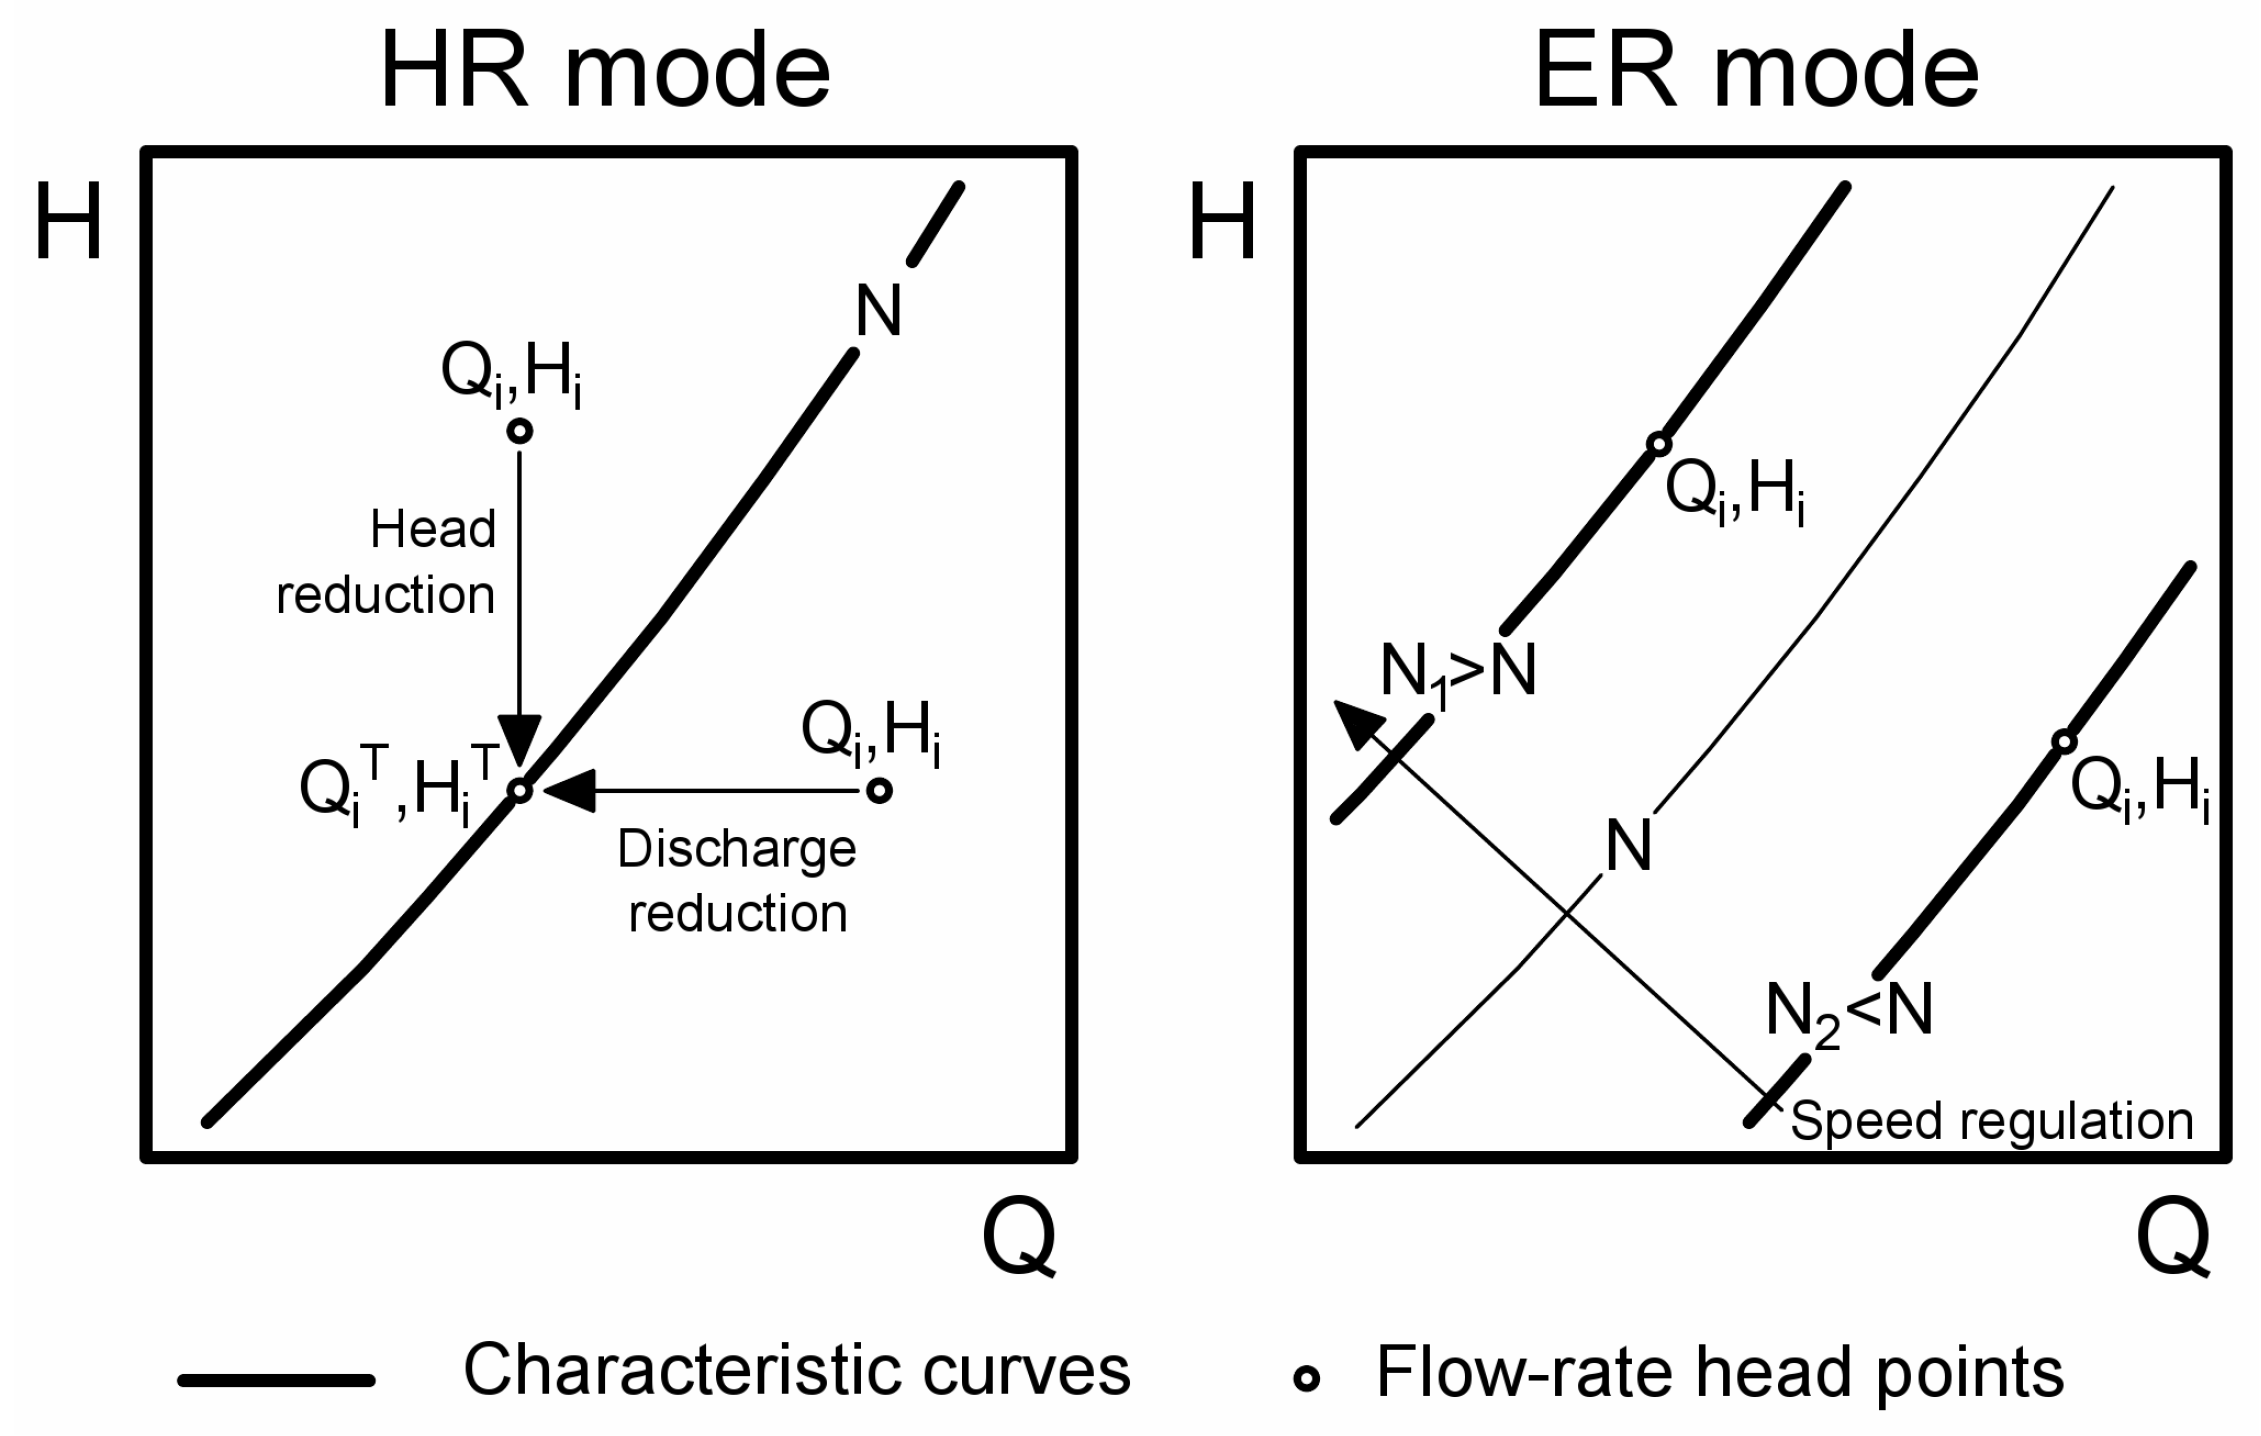
3. Variable Operating Strategy in ER Mode

As a result of the change of the electrical excitation frequency of the generator, the rotating speed of the machine is modified: the rotating speed N [rpm] of an asynchronous generator is related to the number of magnetic pole pairs per phases p and the grid frequency f [Hz] by the following equation:
N = 60 f p
In order to avoid electrical or mechanical damages of the machine, the frequency range generally has to be contained in a specific range. The grid frequency in the EU is 50 Hz and 60 Hz in the US, and all the electric motors and generators are designed to work with these frequencies at a constant velocity, depending on the number of magnetic pole pairs. Therefore, the higher limit of the frequency range needs to be maintained below 60 Hz to avoid rotating speed greater than the design velocity range. The lower limit of the frequency is related to the efficiency of the cooling system: generally such efficiency rapidly decreases with frequency and serious consequences on the generator lifetime could take place. Anyway, a 50 % reduction in electrical excitation frequency with respect to grid frequency can be accepted. Since the behavior of a turbine depends on the rotating speed, a regulation of the machine characteristics can be performed by the frequency regulation. As a result, the characteristic curve of the machine changes and moves on the Q , H plot, depending on the rotating speed. The highest values of net-head correspond to the highest speeds, and when the flow-rate increases the lowest working frequency is required, in order to reduce the generator rotational velocity (Figure 2).
In ER mode, the Variable Operating Strategy [29] has to be modified. A single design parameter is present, namely the impeller diameter. Nevertheless, the procedure is complicated by the variability of the PAT performances with the working speed. Thus, VOS can be described by the following steps:
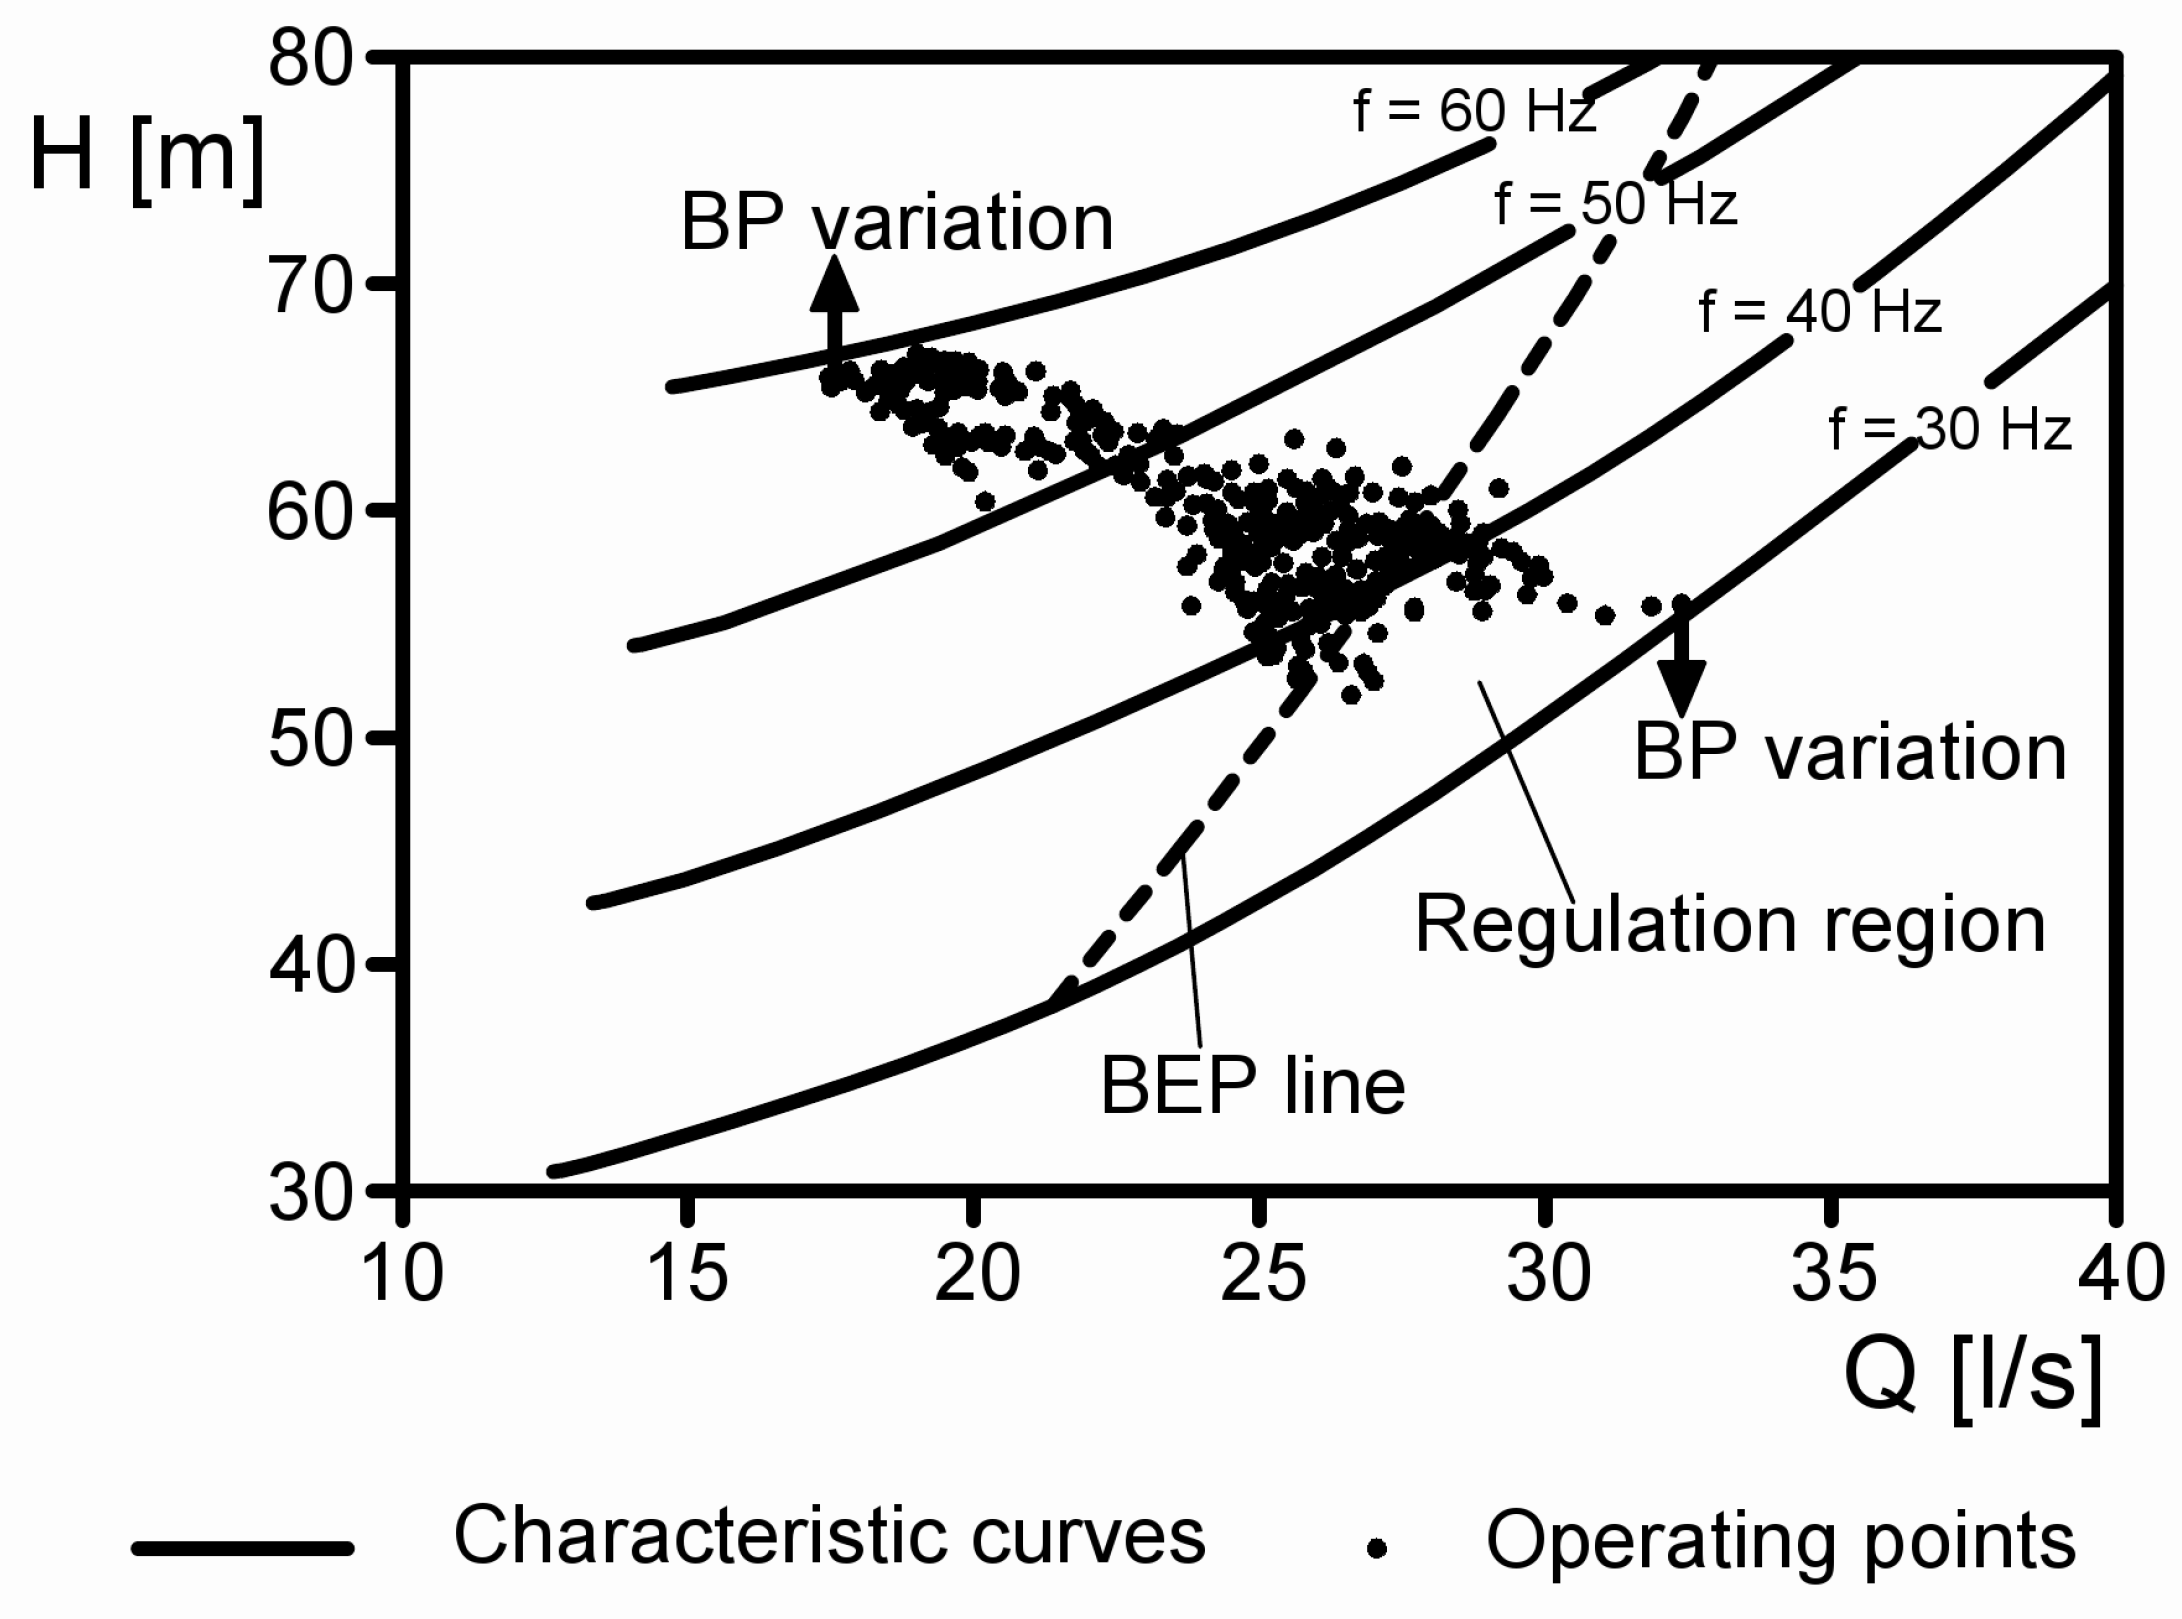
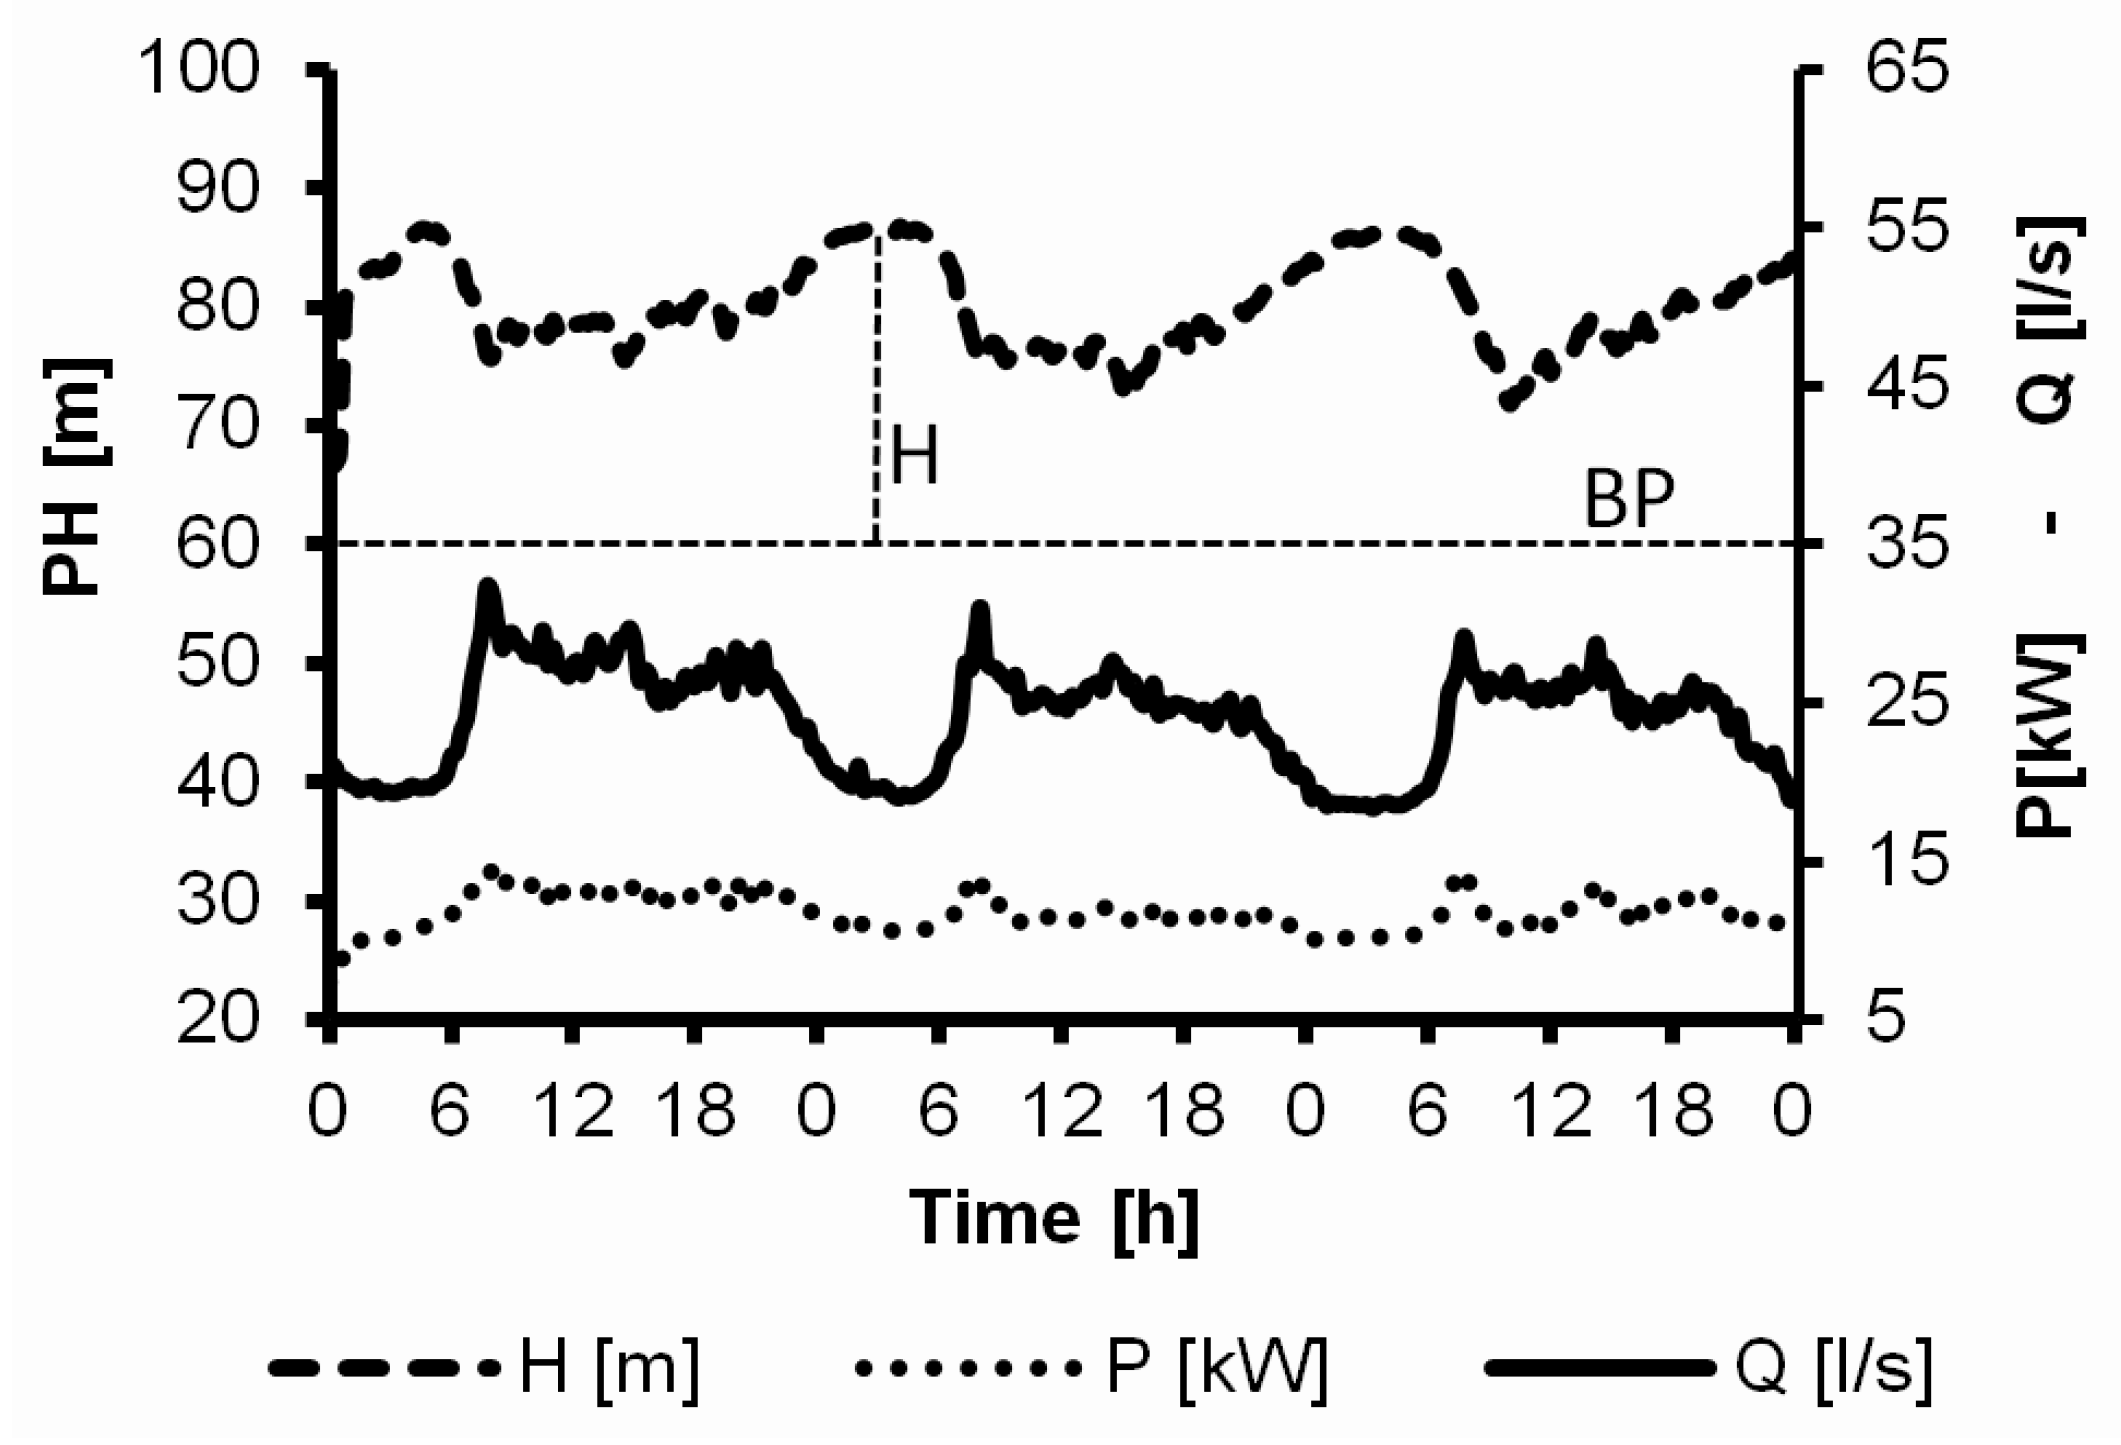
  • a measured pattern of flow-rate and pressure-head conditions ( Q i , H i ) is assigned and the available head is determined based on the required backpressure ( B P ), as in Figure 3;
  • a PAT type is considered (e.g., centrifugal, semi-axial);
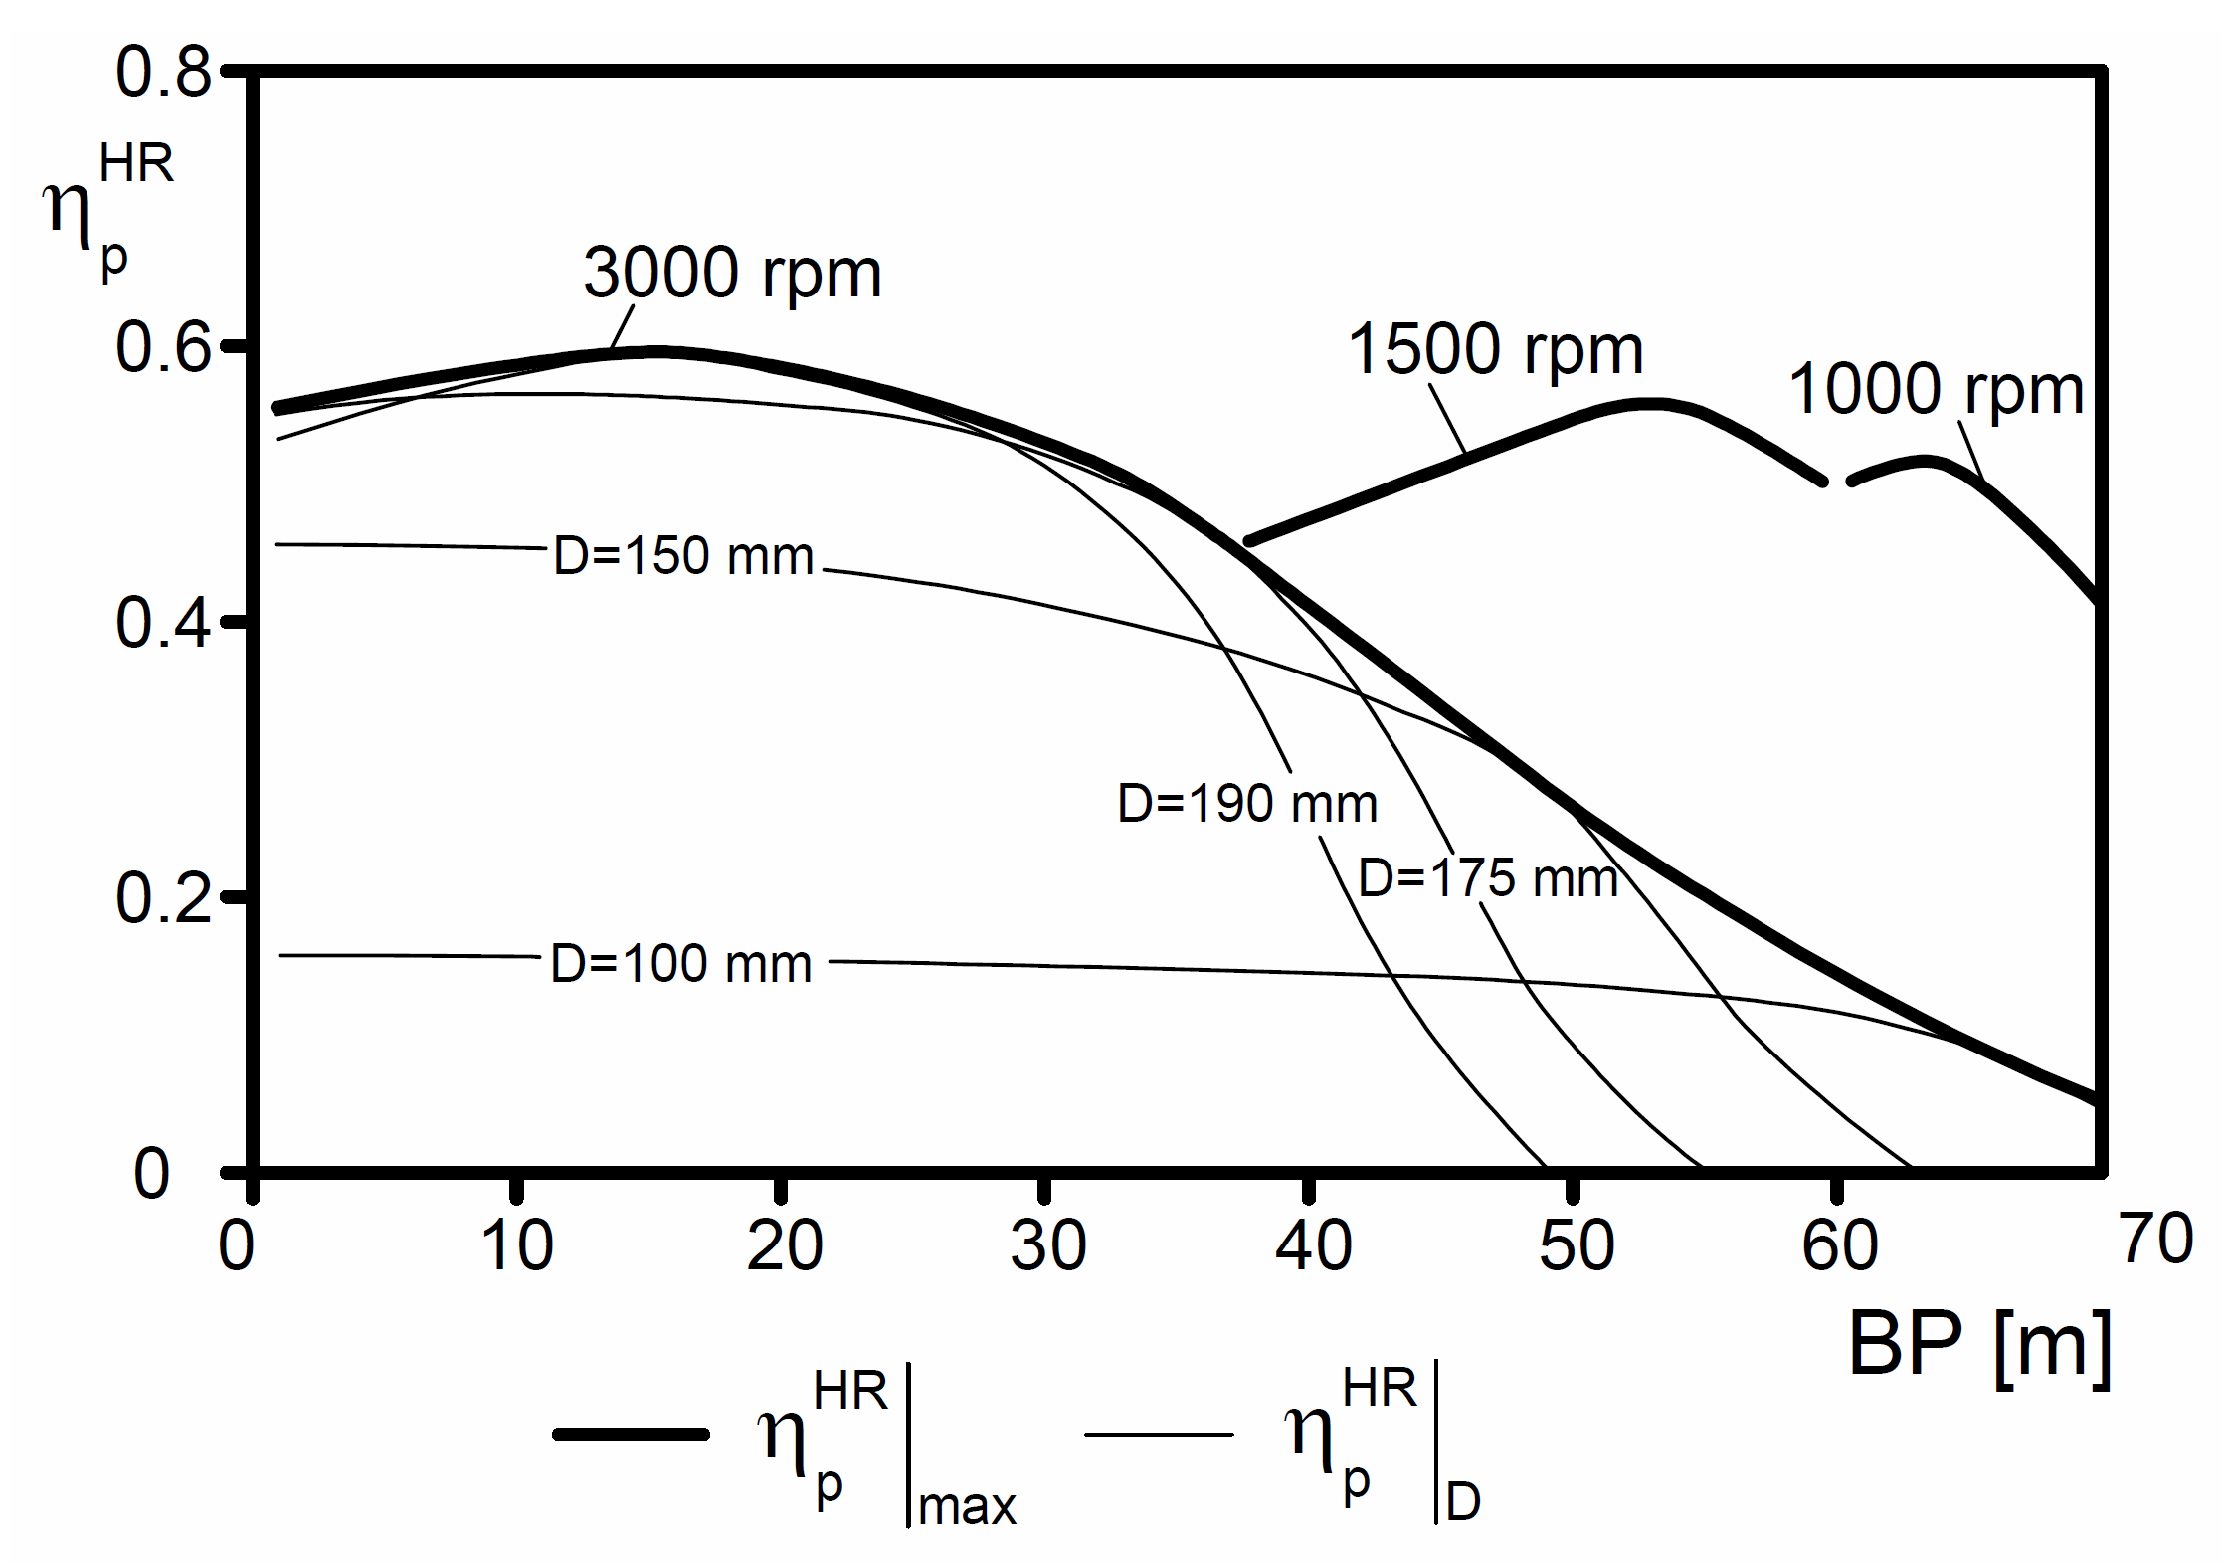
  • a wide set of PAT characteristic curves is considered in the PAT operating region, by changing the number of stages and impeller diameter;
  • for each PAT the rotation speed is changed within the limits of the allowed frequency range;
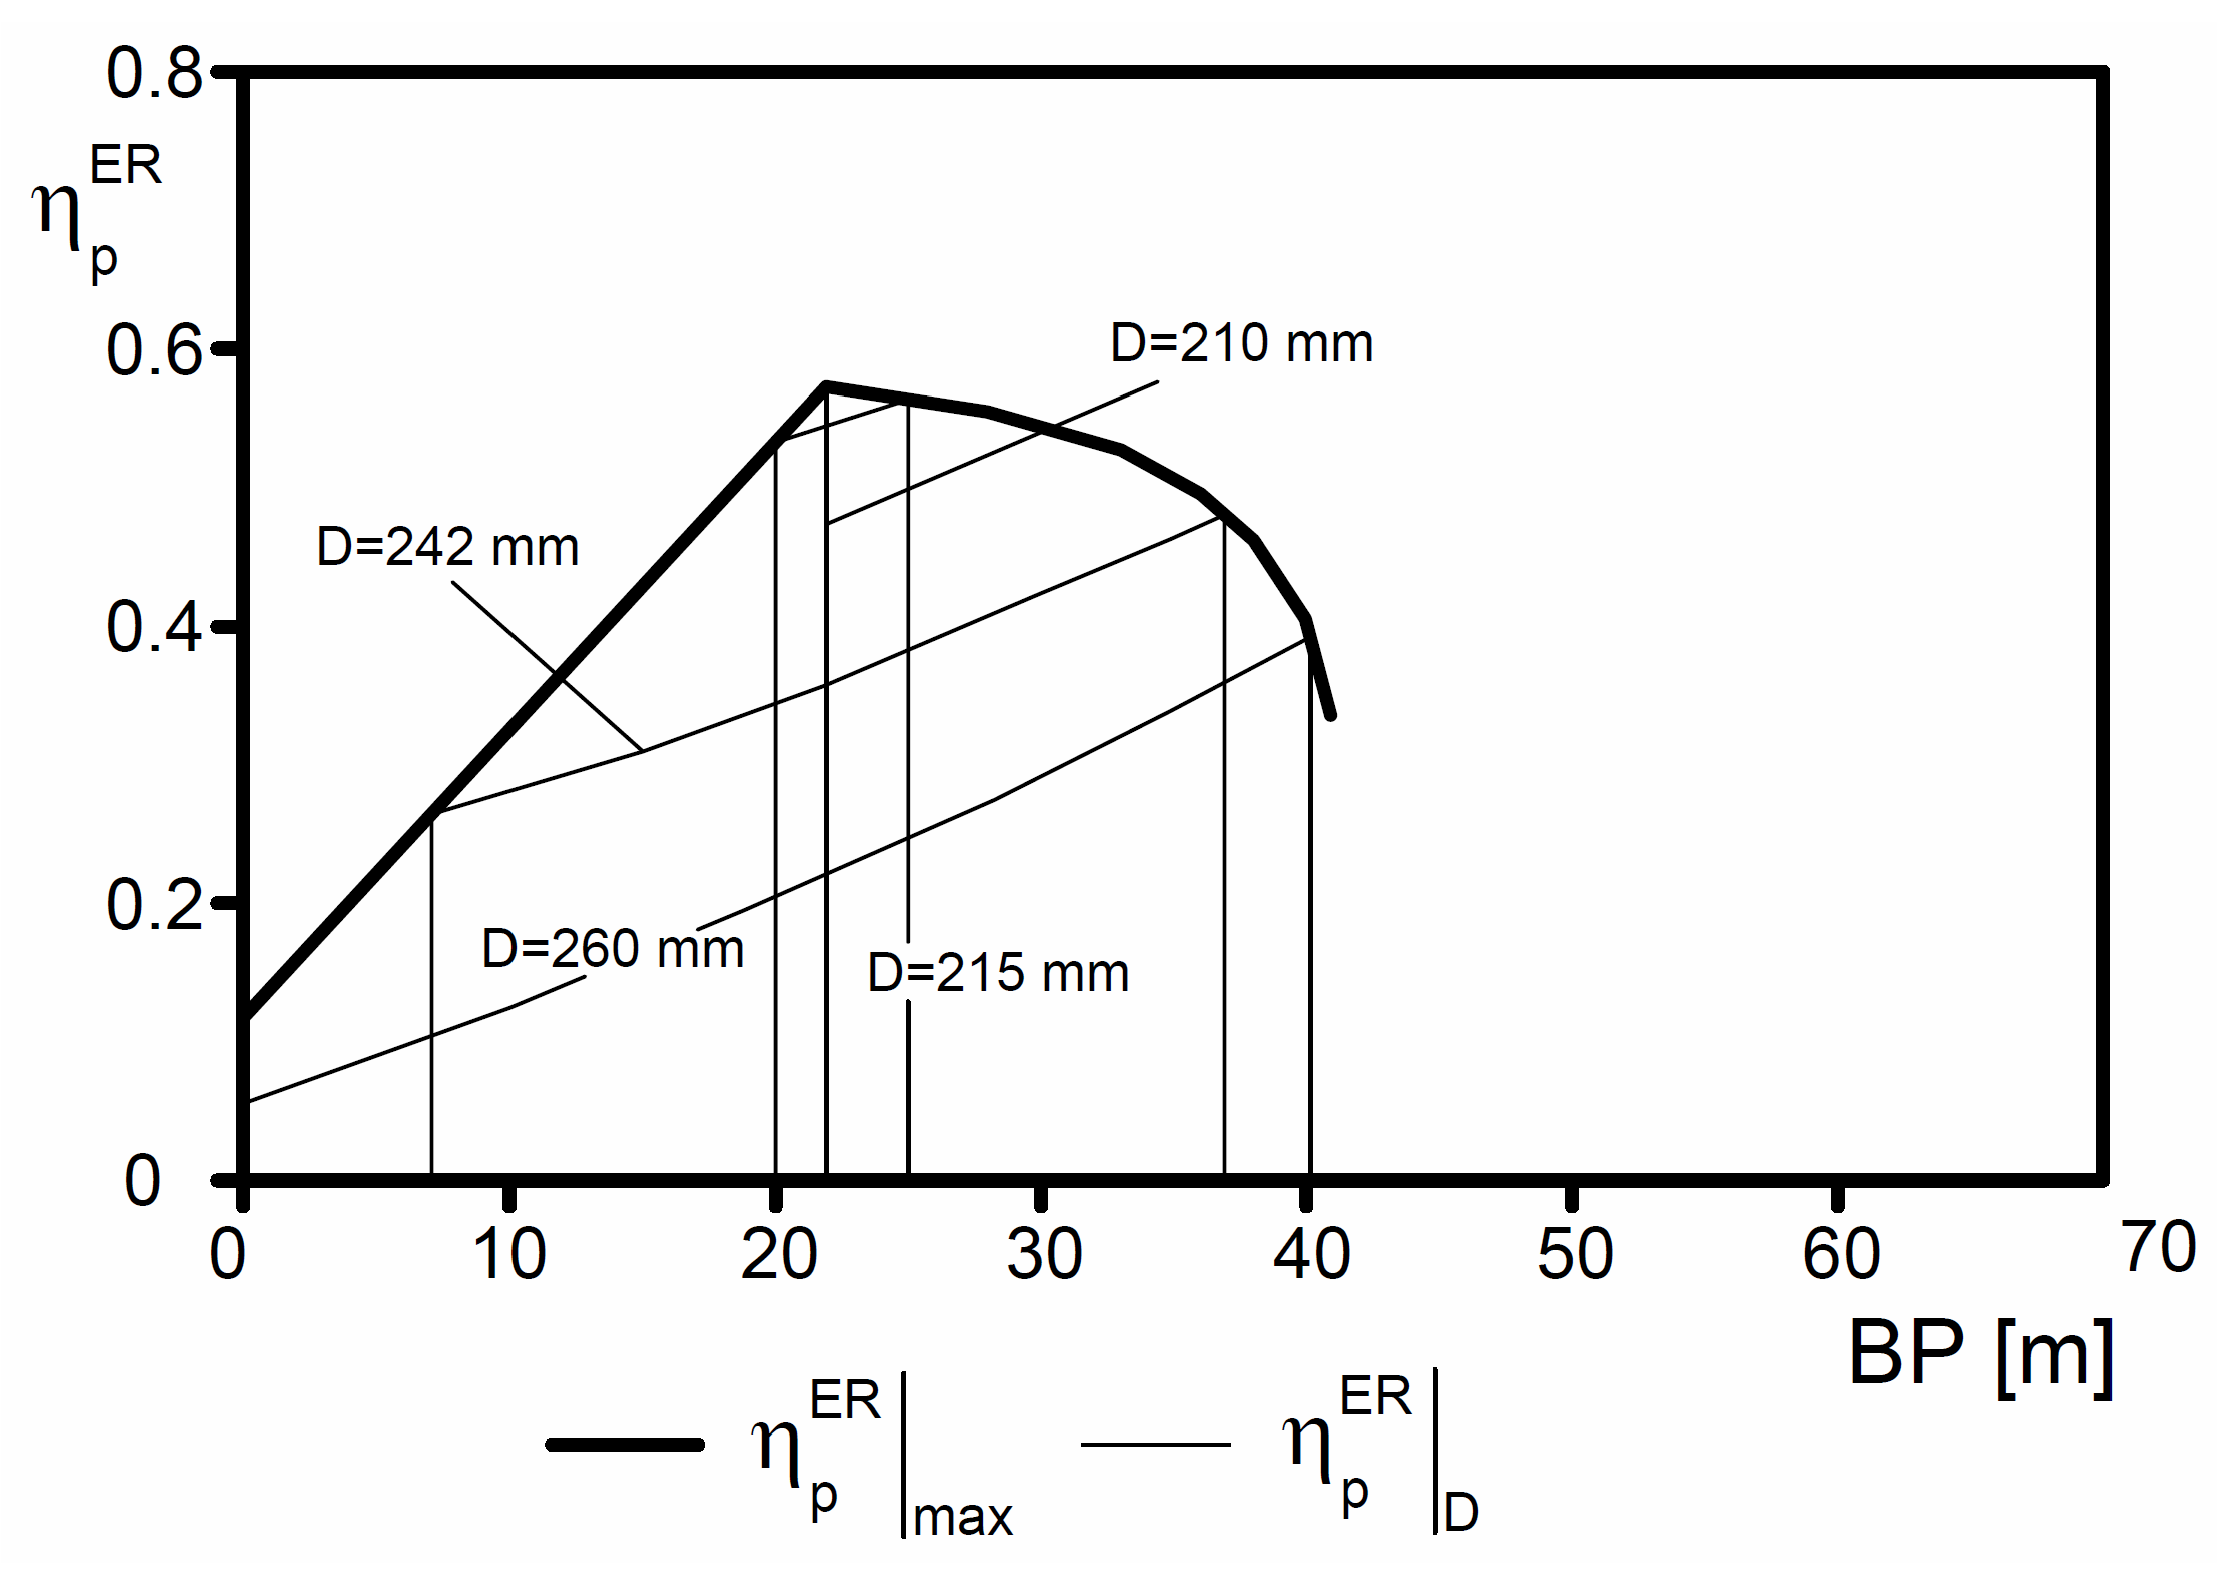
  • for each PAT the overall plant efficiency is calculated by Equation (2);
    η p E R = Σ i = 1 n H i Q i η i T ( f ) Δ t i Σ i = 1 n H i Q i Δ t i
    where Δ t i is the time interval, n the number of points in the operating region and the efficiency η i T is dependent on the induction frequency f, which can be set for each point of the operating region in order to obtain the desired head-drop discharge coordinate;
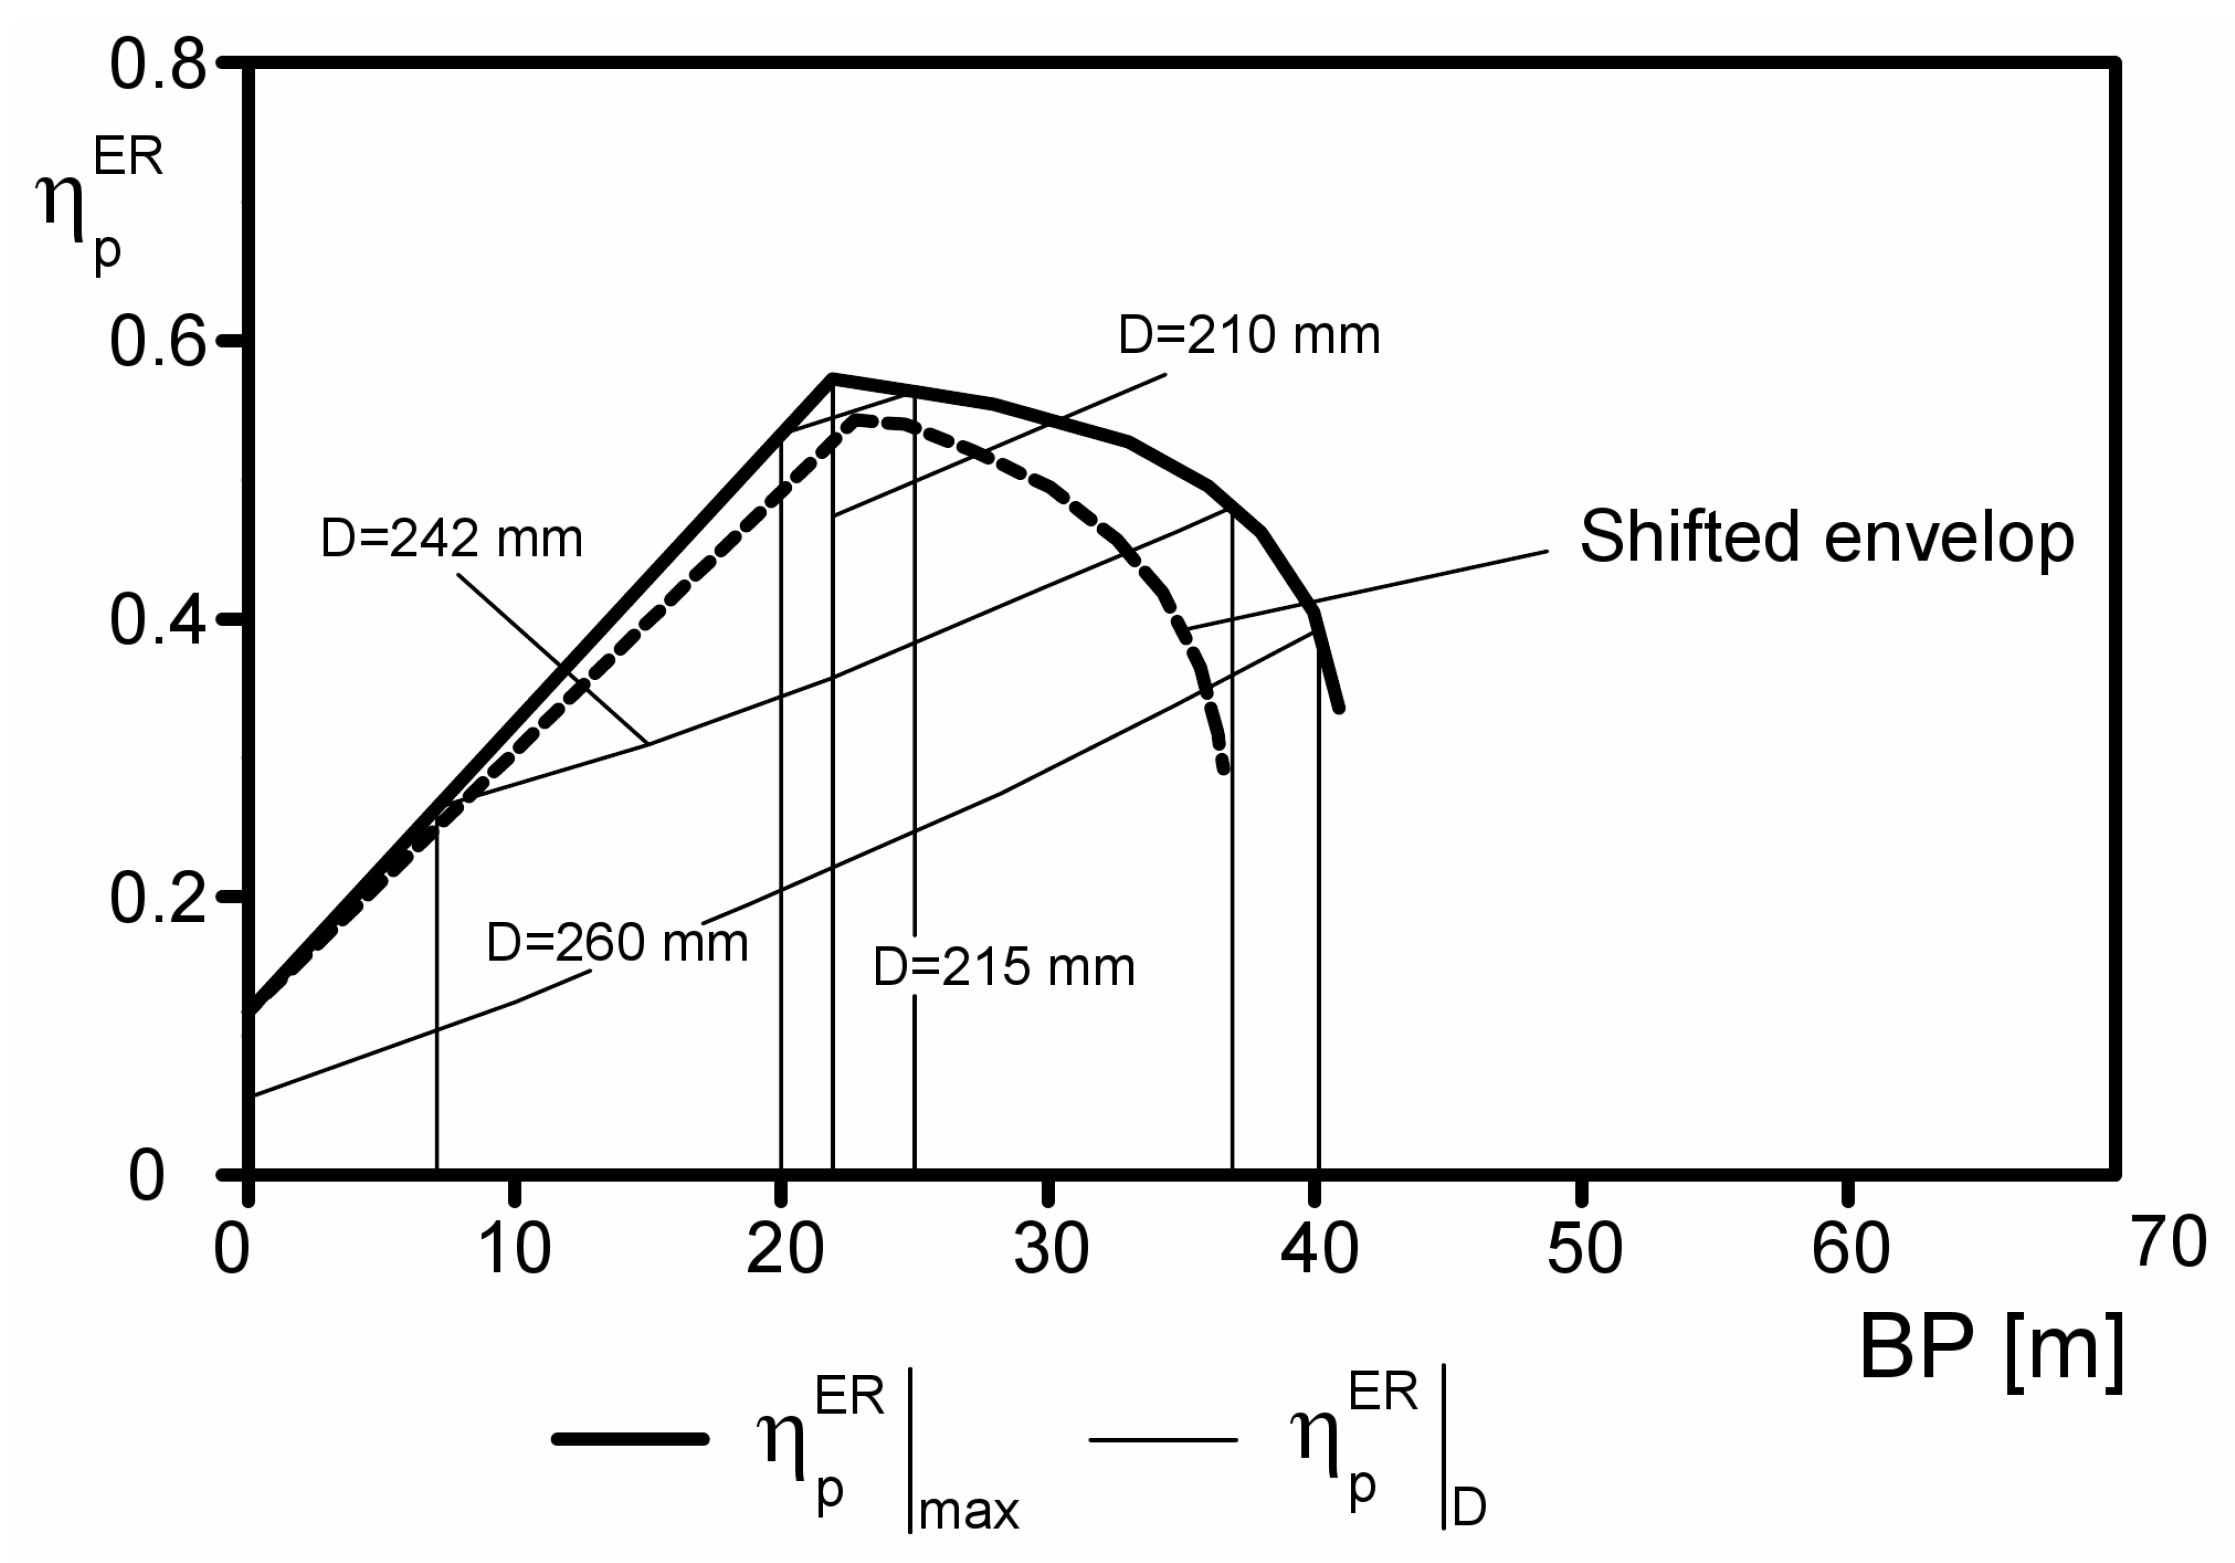
  • the PAT that maximizes the produced energy, i.e., the PAT having the largest η p E R , is considered the optimal design solution;
  • the near-optimal machine is selected from the market and its turbine mode curves are calculated in order to verify the actual efficiency.
In order to perform Steps 3 and 4 the characteristic and efficiency curves for a whole set of PATs are needed. Obviously, such trail curves are not available to technicians and a new approach has been proposed, once a machine type (e.g., centrifugal, semi-axial) is considered and a single reference prototype PAT characteristic curve is available. Such curve can be obtained in three ways: experimentally [33,34,35], by computational fluid dynamics (CFD) [36,37,38] and by any one-dimensional method [17,39,40,41,42,43,44,45]. Each efficiency curve, depending on the discharge, presents a maximum: the corresponding values of discharge and net-head ( Q B T , H B T ) are defined as Best Efficiency Point (BEP). By using the turbomachines affinity law:
N B I N B I I = D I I D I H B I H B I I 1 2 = Q B I I Q B I 1 2 H B I H B I I 3 4 = P B I I P B I 1 2 H B I H B I I 5 4
BEPs ( Q B I I , H B I I ) and produced power at the BEP ( P B I I ) of several similar PATs, with impeller diameter ( D I I ) and rotational speed ( N B I I ) different from the prototype (with superscript I), can be evaluated. Furthermore, by calculating the Suter parameters [46] from the prototype curve (see [29]), the performance curves of the similar PATs [47,48] can be assessed. Finally, the optimal machine features, i.e., the diameter and the rotational speed of the PAT which exhibits the highest overall efficiency, can be identified.
The design procedure has been applied on a centrifugal, single stage, pump, having specific speed N s T = 44 . 0 [rpm, kW], with the data set of Figure 3 in order to evaluate the overall efficiency of the plant. The available head pattern depends on the B P value, since the available head is namely the difference between the pressure head at the hydropower station and the backpressure. The B P is a design parameter, which depends on the downstream network characteristics, and different B P values would produce different different scenarios. In order to deal with several scenarios, the proposed method has been applied for B P s ranged between 0 m and 70 m and for each scenario the best solution, i.e., the optimal machine diameter, has been found.
In Figure 4 the maximum VOS plant efficiency η p E R m a x is plotted versus B P . In the same figure, the efficiency η p E R D of four PAT with different impeller diameter is also plotted. Each curve η p H R D ( B P ) shares with η p H R m a x ( B P ) , only the points where η p H R D ( B P ) = η p H R m a x ( B P ) , i.e., the VOS design solution is equal to D.
Figure 5 shows the working conditions of the design solution obtained for B P = 22 m, where the optimal diameter is 210 mm and the overall plant efficiency is equal to 0 . 57 . The operating points, which are derived from Figure 3, are shown together with the regulation region, which is the region included between the highest and the lowest frequency characteristic curves. The BEP line, which crosses the characteristic curves in their best efficiency points, is also plotted. Such Figure shows a not elastic working condition. Indeed, the value of B P is a design parameter but could vary around the design estimated value—for the modification of the network or the variation of the user demand—and in the working condition of Figure 5 any B P value variation would lead some operating points out of the regulation region.
Figure 4. Efficiency variability of different machines with ER.
Energies 06 00411 g004
Figure 5. Regulation region and operating points for B P = 22 m and D = 210 m m .
Energies 06 00411 g005
Furthermore, as shown in Figure 4, for a B P value greater than 41 m the electric regulation becomes impossible, since none of the simulated machines presents a regulation region that contains all the operating points, and ER cannot ensure the required B P values in all operating conditions.
Thus, in order to make the electrical regulated system more elastic, a Δ = 10 % possible variation of backpressure should be taken into account in the machine selection process: for example, for a B P value of 22 m, the designer should choose a machine that can work also with backpressure values between 19 . 8 m and 26 . 4 m, i.e., a 215 mm diameter with a maximum efficiency of 54 % . If a Δ = 10 % possible variation is considered for each scenario, a shifted envelope curve will result with an efficiency decreasing, as shown in Figure 6. Thus, the maximum BP reduces up to 37 m, and the maximum efficiency becomes 54 . 4 % , with an efficiency average reduction of 16 . 3 % .
In Table 1 the diameter resulting from such design procedure are reported, as well as the maximum obtainable efficiency, depending on the B P value.
Figure 6. Efficiency variability of different machines with ER—modification of the VOS solution.
Energies 06 00411 g006
Table 1. VOS in ER mode results.
B P [ m ] D [ m m ] η p H R | m a x
102380.31
152300.40
202200.50
232160.54
252190.54
302320.49
352510.40
372700.28
40--

4. Comparison between HR and ER Efficiencies and System Flexibility

As a comparison, VOS has been applied in HR mode, following the procedure indicated in [29], for the same dataset (Figure 3) and B P values. These results are reported in Table 2: for each B P value, PAT design values and the overall plant efficiency are reported. In Figure 7 the maximum VOS plant efficiency η p H R m a x is plotted versus B P for three rotational speeds together with the efficiency η p H R D of four PAT with different impeller diameter rotating at N = 3000 rpm. From VOS calculation appears that in HR mode the same PAT type with different impeller diameters is a design solution for all considered B P values. Overall VOS efficiency represents reliable input data for economical evaluations on the payback period of the two modulation systems and for the final project choice.
The comparison of Tables Table 1 and Table 2 shows that the efficiency of the HR mode is higher for all the values of backpressure. The two efficiencies are similar for values of BP ranged between 23 and 37 m. This is a quite surprising result because in ER mode there is no hydraulic power leakage in the bypass or in the valve. The quite small values of efficiency in ER mode are justified by the low hydraulic efficiency of the PAT in a large number of operating points: the characteristic curve matches the operating points but these conditions are too far from BEP to have an acceptable efficiency value (see the BEP line of Figure 3).
Table 2. VOS in HR mode results.
B P [ m ] D [ m m ] N [ r p m ] η p H R | m a x
1018630000.59
1519030000.59
2019130000.59
2518730000.56
3018130000.53
3517630000.48
4020830000.47
4521915000.51
5023215000.54
5523715000.55
6022110000.50
Figure 7. Efficiency variability of different machines with HR.
Energies 06 00411 g007
Network flow conditions cannot be always assumed as true values. Sometimes BP values can result from network modeling, or BP may vary in time for changes in water demand. In these cases, PAT efficiency will vary: once the optimal diameter of the machine has been chosen, a backpressure modification influences the efficiency of the plant. Figure 7 shows the curves that relate the global efficiency with the backpressure for several diameters machines rotating at 3000 r p m , together with the envelope curve. It is important to emphasize that any B P variation from the design value would produce an efficiency change.
The efficiency variability with the backpressure, namely the system flexibility, is therefore an important design parameter: the more slowly the global efficiency will vary with B P variations around the design B P , the more flexible the hydro power systems will be. In Table 3 the dependency of plant overall efficiency with 10 % B P variation is reported. This table shows that the HR is generally more efficient and more flexible than ER. The flexibility of the ER method is higher only in two cases, for a positive variation of the two highest backpressure values.
Table 3. Flexibility of the hydropower plant—comparison between HR mode and ER mode.
% variation of η p H R % variation of η p E R
B P [ m ] design η p H R - 10 % B P + 10 % B P design η p E R - 10 % B P + 10 % B P
100.586−0.4850.3870.305−2.3492.244
200.5851.045−1.4920.502−2.4182.246
300.5313.356−5.2850.488−4.4974.126
350.4846.405−12.7910.403−8.4737.450

5. Economic Feasibility

With reference to Tables Table 1 and Table 2 a comparison between the economic viability of both ER and HR modes has been made. Based on the market values of the involved devices and the produced energy, the payback period of the electro-mechanical equipment has been evaluated for the same scenarios of Table 3. The produced energy cost has been considered equal to 0 . 20 €/kWh, as it is the average value for the renewable produced energy in Italy. The PAT cost ( C P A T ) has been evaluated based on the BEP power of the machine ( P B ), dependent on the machine diameter according to Equation (3), considering 230 €/kW as unit cost. The motor/generator cost ( C g e n ) has been evaluated based on the maximum power output of each scenario ( P m a x ), assuming 115 €/kW as unit cost. Moreover, in HR mode the cost of the two pressure reducing valves ( C v a l v e ) should be added, assuming 2500 € each, which is the average cost for the 150 mm pipe diameter, while in the ER mode the inverter cost ( C i n v ) should be taken into account. Such cost has been considered dependent on the generator power, and consequently on the maximum produced power of the plant, with a unit cost of 200 €/kW. All these costs, which are derived from the average market values, are shown in Table 4, together with the average daily energy production (ADEP) and the daily income; as a result, the payback period is shown in the last line of the table. The costs of the civil works and maintenance have not been considered since they are comparable for both cases (HR and ER).
These results show that the payback period of the electro-mechanical equipment ( P P e m e ) of a hydropower system in a water distribution network in HR mode is shorter than in ER mode and for all the B P values it is close to one year. The payback period of the whole hydropower system could be much longer due to both the civil work and maintenance operation costs.
Table 4. Business plan and economic viability for HR and ER mode.
B P [ m ] 10203035
ModeHRERHRERHRERHRER
D [mm]186238191220181232176251
η p [−]0.5860.3050.5850.5020.5310.4880.4840.403
P B  [kW]8.4929.129.6919.657.4125.636.4437.99
P m a x  [kW]12.7912.2910.8611.927.979.786.718.51
C P A T  [€]19536698223045201704589514818738
C g e n  [€]14711414124813729161125772978
C i n v  [€]-2459-2385-1957-1701
C v a l v e  [€]5000-5000-5000-5000-
C t o t  [€]8423105708478827776208977725311418
ADEP [kWh/day]266.30139.92146.13123.84159.67147.6284.5970.49
Daily income [€/day]53.2627.9829.2324.7731.9329.5216.9214.10
P P e m e [days]158378290334238304428810

6. Conclusions

The exploitation of the available net head, which would be dissipated in pressure reducing valves, which are largely used due to the network pressure control strategy against leakage occurrence, would ensure large energy savings to water industries. Technical solutions combining the efficiency and economical convenience are highly desired in water industry, and electro-mechanical production devices based on either an hydraulic regulation (HR)—via a series-parallel hydraulic circuit- or an electrical regulation (ER)—via inverter- are feasible solutions in order to replace pressure reducing valves and recover energy. A Variable Operating Strategy (VOS) is applied to a water distribution network where a PAT (pump as turbine) is used and the flow-head demand pattern is given. Several scenarios with different imposed backpressure values have been simulated. The described procedure allows to select the appropriate PAT geometry both for HR and ER installations. Furthermore, a comparison between HR and ER is shown: the produced energy is not negligible in both cases and HR is generally more efficient than ER. The two modes have been compared in terms of system flexibility. The HR mode exhibits a larger efficiency when the working conditions are different from the design values, due to any demand pattern variation. Finally, the payback period of the electro-mechanical equipment has been evaluated. The results show that the HR mode is generally more convenient than the ER mode.

Acknowledgements

The authors would like to thank Caprari company and Lauro Antipodi for having provided the technical data of the machine and the PAT unit costs. The authors would also like to thank RACI company and Enrico Righi for having provided the unit costs of piping.

References

  1. Vairavamoorthy, K.; Lumbers, J. Leakage reduction in water distribution systems: Optimal valve control. J. Hydraul. Eng. 1998, 124(11), 1146–1154. [Google Scholar] [CrossRef]
  2. Tucciarelli, T.; Criminisi, A.; Termini, D. Leak analysis in pipeline systems by means of optimal valve regulation. J. Hydraul. Eng. 1999, 125(3), 277–285. [Google Scholar] [CrossRef]
  3. Almandoz, J.; Cabrera, E.; Arregui, F.; Cabrera, E.; Cobacho, R. Leakage assessment through water distribution network simulation. J. Water Res. Plan. 2005, 131(6), 458–466. [Google Scholar] [CrossRef]
  4. Araujo, L.; Ramos, H.; Coelho, S. Pressure control for leakage minimisation in water distribution systems management. Water Res. Manag. 2006, 20(1), 133–149. [Google Scholar] [CrossRef]
  5. Walsky, T.; Bezts, W.; Posluzny, E.; Weir, M.; Withman, B. Modeling leakage reduction through pressure control. J. Am. Water Work. Assoc. 2006, 98(4), 148–155. [Google Scholar]
  6. Prescott, S.; Ulanicki, B. Improved control of pressure reducing valves in water distribution networks. J. Hydraul. Eng. 2008, 134(1), 56–65. [Google Scholar] [CrossRef]
  7. Nazif, S.; Karamouz, M.; Tabesh, M.; Moridi, A. Pressure management model for urban water distribution networks. Water Res. Manag. 2010, 24, 437–458. [Google Scholar] [CrossRef]
  8. Carravetta, A.; Giugni, M. Functionality factors in the management and rehabilitation of water networks. In Management of Water Networks. Proceedings of the Conference Efficient Management of Water Networks. Design and Rehabilitation Techniques; Franchini, B., Ed.; Franco Angeli: Milano, Italy, 2009. [Google Scholar]
  9. Gonçalves, F.; Costa, L.; Ramos, H. ANN for hybrid energy system evaluation: Methodology and WSS case study. Water Res. Manag. 2011, 25, 2295–2317. [Google Scholar] [CrossRef]
  10. Filion, Y.; MacLean, H.; Karney, B. Life cycle energy analysis of a water distribution system. J. Infrastruct. Syst. 2004, 10(3), 120–130. [Google Scholar] [CrossRef]
  11. Zakkour, P.; M.R., G.; Gochin, R.; Lester, J. Developing a sustainable energy strategy for a water utility. Part II: A review of potential technologies and approaches. J. Environ. Manag. 2002, 66, 115–125. [Google Scholar] [CrossRef]
  12. Arriaga, M. Pump as turbine—A pico-hydro alternative in Lao People’s Democratic Republic. Renew. Energy 2010, 35, 1109–1115. [Google Scholar] [CrossRef]
  13. Williams, A.; Smith, P.; Bird, C.; Howard, M. Pumps as turbines and induction motors as generators for energy recovery in water supply systems. Water Environ. J. 1998, 12, 175–178. [Google Scholar] [CrossRef]
  14. Fontana, N.; Giugni, M.; Portolano, D. Losses reduction and energy production in water-distribution networks. J. Water Res. Plan. 2012, 138(3), 237–244. [Google Scholar] [CrossRef]
  15. McNabola, A.; Coughlan, P.; Williams, A. The Technical and Economic Feasibility of Energy Recovery in Water Supply Networks. In Proceedings of International Conference on Renewable Energy and Power Quality, Las Palmas de Gran Canaria, Spain, 13–15 April 2011.
  16. Corcoran, L.; McNabola, A.; Coughlan, P. Energy Recovery Potential of the Dublin Region Water Supply Network. In Proceedings of World Congress on Water, Climate and Energy, Dublin, Ireland, 13–18 May 2012.
  17. Williams, A. The turbine performance of centrifugal pumps: A comparison of predictione methods. J. Power Energy 1994, 208, 59–66. [Google Scholar] [CrossRef]
  18. Ramos, H.; Covas, D.; Araujo, L.; Mello, M. Available energy assessment in water supply systems. In Proceedings of XXXI International Association for Hydro-Environment Engineering and Research Congress, Seoul, Korea, 11–16 September 2005.
  19. Gaius-Obaseki, T. Hydropower opportunities in the water industry. Int. J. Environ. Sci. 2010, 1(3), 392–402. [Google Scholar]
  20. Khurana, S.; Kumar, A. Small hydro power—A review. Int. J .Therm. Technol. 2011, 1(1), 107–110. [Google Scholar]
  21. Paish, O. Small hydro power: Technology and current status. Renew. Sustain. Energy Rev. 2002, 6(6), 537–556. [Google Scholar] [CrossRef]
  22. Sopian, K.; Razak, J. Pico Hydro: Clean Power From Small Streams. In Proceedings of the 3rd World Scientific and Engineering Academy and Society International Conference on Renewable Energy Sources, Tenerife, Spain, 1–3 July 2009.
  23. Johnston, C.; Pratt, D.; Clarke, J.; Grant, A. A techno-economic analysis of tidal energy technology. Renew. Energy 2012, in press. [Google Scholar] [CrossRef]
  24. Boccotti, P. On a new wave energy absorber. Ocean. Eng. 2003, 30(9), 1191–1200. [Google Scholar] [CrossRef]
  25. Buccino, M.; Banfi, D.; Vicinanza, D.; Calabrese, M.; del Giudice, G.; Carravetta, A. Non Breaking wave forces at the front face of seawave slotcone generators. Energies 2012, 5(11), 4779–4803. [Google Scholar] [CrossRef]
  26. Ramos, H.; Mello, M.; De, P. Clean power in water supply systems as a sustainable solution: From planning to practical implementation. Water Sci. Technol. 2010, 10(1), 39–49. [Google Scholar] [CrossRef]
  27. Nautiyal, H.; Varun; Kumar, A. Reverse running pumps analytical, experimental and computational study: A review. Renew. Sustain. Energy Rev. 2010, 14, 2059–2067. [Google Scholar] [CrossRef]
  28. Joshi, S.; Holloway, A.; Chang, L.; Kojabadi, H. Development of a Stand Alone Micro-Hydro System using Pump as Turbine Technology for Low Head Sites in Remote Areas. In Proceedings of 20th International Power System Conference, Tehran, Iran, 14–16 November 2005.
  29. Carravetta, A.; Del Giudice, G.; Fecarotta, O.; Ramos, H. Energy production in water distribution networks: A PAT design strategy. Water Res. Manag. 2012, 26, 3947–3959. [Google Scholar] [CrossRef]
  30. Karadirek, I.; Kara, S.; Yilmaz, G.; Muhammetoglu, A.; Muhammetoglu, H. Implementation of hydraulic modelling for water-loss reduction through pressure management. Water Res. Manag. 2012, 26(9), 2555–2568. [Google Scholar] [CrossRef]
  31. Liberatore, S.; Sechi, G. Location and calibration of valves in water distribution networks using a scatter-search meta-heuristic approach. Water Res. Manag. 2009, 23, 1479–1495. [Google Scholar] [CrossRef]
  32. Afshar, A.; Jemaa, F.; Marino, M. Optimization of hydropower plant integration in water supply system. J. Water Res. Plan. 1990, 116(5), 665–675. [Google Scholar] [CrossRef]
  33. Gantar, M. Propeller, Pump running as turbines. In Proceedings of Conference on Hydraulic Machinery, Ljubljana, Yugoslavia, 13–15 September 1988.
  34. Fernandez, J.; Blanco, E.; Parrondo, J.; Stickland, M.; Scanlon, T. Performance of a centrifugal pump running in inverse mode. J. Power Energy 2004, 218(4), 265–271. [Google Scholar] [CrossRef] [Green Version]
  35. Derakhshan, S.; Nourbakhsh, A. Experimental study of characteristic curves of centrifugal pumps working as turbines in different specific speeds. Exp. Therm. Fluid. Sci. 2008, 32, 800–807. [Google Scholar] [CrossRef]
  36. Rodrigues, A.; Singh, P.; Williams, A.; Nestmann, F.; Lai, E. Hydraulic analysis of a pump as a turbine with CFD and experimental data. In Proceedings of IMechE Seminar, Computational Fluid Dynamics for Fluid Machinery, London, UK, 18 November 2003.
  37. Natanasabapathi, S.; Kshirsagar, J. Pump as Turbine: An Experience with CFX-5.6. In Proceedings of International ANSYS Conference, Pittsburgh, PA, USA, 24–26 May 2004.
  38. Carravetta, A.; Fecarotta, O.; Ramos, H. Numerical simulation on Pump As Turbine: Mesh reliability and performance concerns. In Proceedings of International Conference on Clean Electrical Power, Ischia, Italy, 14–16 June 2011.
  39. Stepanoff, A. Centrifugal and Axial Flow Pumps; John Wiley: New York, NY, USA, 1957. [Google Scholar]
  40. Childs, S. Convert pumps to turbines and recover HP. Hydrocarb. Process. Pet. Refin. 1962, 41(10), 173–174. [Google Scholar]
  41. Hanckock, J. Centrifugal Pump or Water Turbine. Pipe Line News 1963, 25–27. [Google Scholar]
  42. Grover, K. Conversion of Pumps to Turbines; GSA Inter Corp., Katonah: New York, NY, USA, 1980. [Google Scholar]
  43. Sharma, K. Small Hydroelectric Projects—Use of Centrifugal Pumps as Turbines; Kirloskar Electric Co.: Bangalore, India, 1985. [Google Scholar]
  44. Schmiedl, E. Serien-Kreiselpumpen im Turbinenbetrieb; Pumpentagung: Karlsruhe, Germany, 1988; Chapter A6. [Google Scholar]
  45. Alatorre-Frenk, C.; Thomas, T. The pumps as turbines approach to small hydropower. In Proceedings of World Congress on Renewable Energy, Reading, UK, 23–28 September 1990.
  46. Suter, P. Representation of pump characteristics for calculation of water hammer. Sulzer. Technol. Rev. 1966, 4, 45–48. [Google Scholar]
  47. Ramos, H.; Almeida, A. Dynamic orifice model on waterhammer analysis of high or medium heads of small hydropower plants. J. Hydraul. Res. 2001, 39(4), 429–436. [Google Scholar] [CrossRef]
  48. Ramos, H.; Almeida, A. Parametric analysis of water-hammer effects in small hydro schemes. J. Hydraul. Eng. 2002, 128(7), 1–8. [Google Scholar] [CrossRef]

