Article

World Energy Balance Outlook and OPEC Production Capacity: Implications for Global Oil Security

1
Department of Civil and Environmental Engineering, Michigan Technological University, 1400 Townsend Dr, Houghton, MI 49931, USA
2
Department of Civil, Environmental and Construction Engineering, University of Central Florida, 4000 Central Florida Blvd, Orlando, FL 32816, USA
3
Department of Civil and Environmental Engineering, University of California-Davis, One Shields Ave, Davis, CA 95616, USA
4
Encon Systems UK Ltd., 4 Charter House Mulgrave Rd, Sutton Surrey, SM2 6LB, UK
*
Author to whom correspondence should be addressed.
Energies 2012, 5(8), 2626-2651; https://doi.org/10.3390/en5082626
Submission received: 12 June 2012 / Revised: 13 July 2012 / Accepted: 17 July 2012 / Published: 25 July 2012

Abstract

:
The imbalance between energy resource availability, demand, and production capacity, coupled with inherent economic and environmental uncertainties make strategic energy resources planning, management, and decision-making a challenging process. In this paper, a descriptive approach has been taken to synthesize the world’s energy portfolio and the global energy balance outlook in order to provide insights into the role of Organization of Petroleum Exporting Countries (OPEC) in maintaining “stability” and “balance” of the world’s energy market. This synthesis illustrates that in the absence of stringent policies, i.e., if historical trends of the global energy production and consumption hold into the future, it is unlikely that non-conventional liquid fuels and renewable energy sources will play a dominant role in meeting global energy demand by 2030. This should be a source of major global concern as the world may be unprepared for an ultimate shift to other energy sources when the imminent peak oil production is reached. OPEC’s potential to impact the supply and price of oil could enable this organization to act as a facilitator or a barrier for energy transition policies, and to play a key role in the global energy security through cooperative or non-cooperative strategies. It is argued that, as the global energy portfolio becomes more balanced in the long run, OPEC may change its typical high oil price strategies to drive the market prices to lower equilibria, making alternative energy sources less competitive. Alternatively, OPEC can contribute to a cooperative portfolio management approach to help mitigate the gradually emerging energy crisis and global warming, facilitating a less turbulent energy transition path while there is time.

1. Introduction

Annually, humans use a large amount of energy to sustain and improve the standard of living around the globe. For example, the world’s consumption of non-renewable fossil fuels such as coal, oil, and gas was over 10,000 million tonnes of oil equivalent (4.19 × 10¹⁴ Joules) in 2007 [1]. The imbalance between global energy resource availability, demand, and production poses a great challenge to decision-makers in the energy sector. Furthermore, the depletion of oil and gas reserves in developed countries coupled with rapidly increasing demand for energy in developing countries may create new threats to international energy security system in the future. Recent energy surveys reveal that it may take decades before renewable energy sources will be able to play a major part in stabilizing global energy markets [2,3,
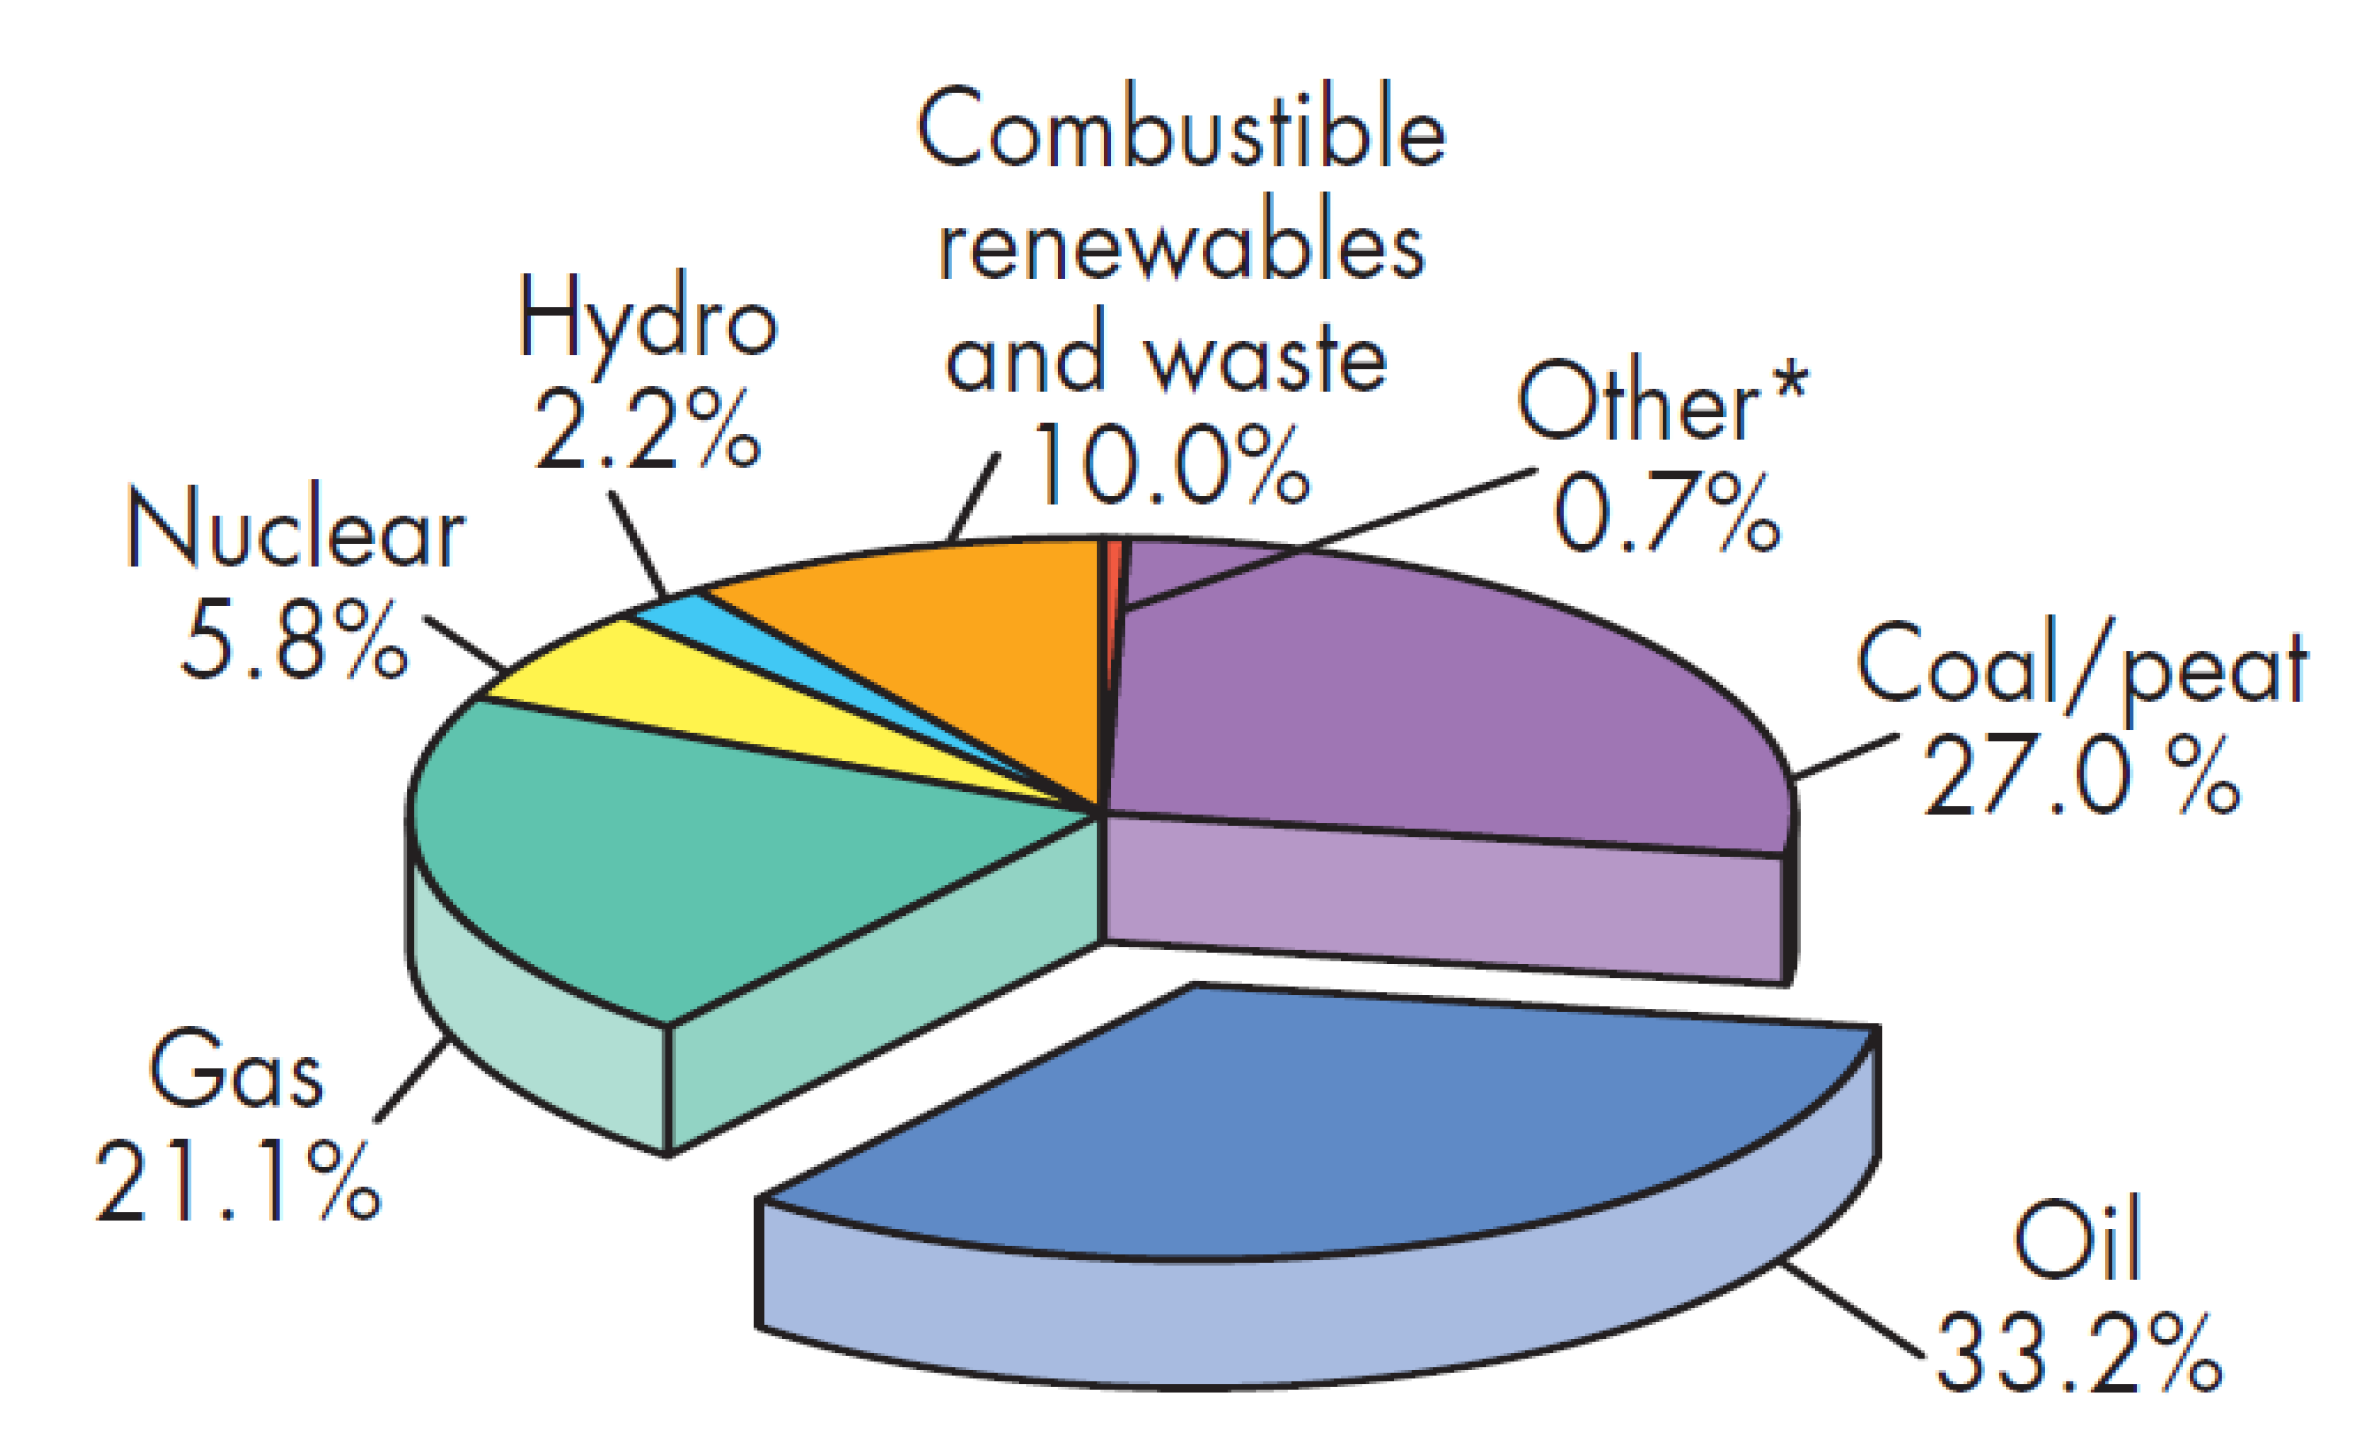
4]. Although the consumption of renewable energy sources has grown significantly over the past decades, their contribution to meeting global primary energy demand in 2008 was only about 13%, which is far less than fossil fuels’ share of about 81% [5]. Hence, while research and development initiatives focusing on renewable sources of energy are currently receiving increasing attention and financial support, fossil fuels are still the most essential element of the world energy portfolio [6]. In particular, petroleum remains to be an important non-renewable energy resource and a key driver of economic systems in both developing and developed countries [7].
If the historical trends of energy demand and consumption are projected into the future, fossil fuels may continue to dominate the energy market, and even an increase in the consumption of oil may be expected [8]. However, strong sociopolitical will and economic incentives to implement stringent policies for mitigating the climate change by promoting the consumption of alternative energies can decrease the dominance of oil in the future global energy mix. Nonetheless, it should be recognized that there is no panacea for the global energy crisis as the widely proposed and advocated alternative sources of energy are not without drawbacks [9]. For example, production of industrial bio-fuels requires allocation of considerable amounts of natural resources such as land and water, and may potentially impact food production and climate change in negative ways [10,11,12,13]. Likewise, wind energy and hydropower depend upon availability of suitable locations while solar energy is intermittent and, currently, expensive [14,15]. Moreover, the need for large capital investments and concerns about proper handling of radioactive waste detracts from the favorability of nuclear energy [16]. Resolving these concerns is a precursor for a more balanced global energy mix.
Growing energy insecurity and climate change are two key concerns at the heart of the International Energy Agency’s World Energy Outlook report [17]. It is critical to address reliability and sustainability challenges lying ahead of the world’s energy supply and management systems. Recent incidences of nuclear power plant failure under harsh natural disasters in Japan are creating a new wave of anti-nuclear power movements in Europe, as well as in other parts of the world [18]. Furthermore, the heightened safety and security concerns are adding to the uncertainty about the role of nuclear power in the future. In addition, the large body of evidence for anthropogenic climate change indicates the need for devising insightful strategies to provide a framework for integrated management of energy sector to facilitate the transition from fossil fuels to cleaner energy sources. In this regard, it is necessary to synthesize the role of non-renewable and renewable energy sources in the future energy landscape.
Of all energy sources, oil has the highest demand, giving it a unique position as the price-setter for global energy markets. Oil markets have occasionally experienced unpredicted price fluctuations, triggering adverse impacts on economic growth at regional and global scales. Ample oil resources of Organization of Petroleum Exporting Countries (OPEC) enable it to affect the supply and price of oil. OPEC oversees supply and pricing of a significant share of the global oil resources by coordinating and unifying the petroleum policies of twelve major oil producing countries that, as of 2010, hold more than 40% of the world’s crude oil production [19]. The vast production capacity of OPEC, including its active and spare capacities, could thus be utilized as a practical means of impacting the price of oil. Historically, OPEC has played an active part in providing relatively reliable and efficient supply of energy to global markets, while safeguarding the economic interests of its individual member countries and the organization as a whole to a relatively good extent. Meanwhile, the power of a few nationalized oil companies plays a crucial role in the energy market and more specifically in the oil market. Thus, some have blamed the OPEC’s power and impact on the market security [20,21] as mismanagement, and internal conflicts of the few oil exporters are deemed to destabilize the world energy market [22].
The objective of this paper is to investigate different perspectives on the role of OPEC’s future oil production levels in the global energy mix to draw insights for the global energy security. To this end, we have used historical data, as well as projections from such sources as British Petroleum (BP), International Energy Agency (IEA), the United States’ Energy Information Administration (EIA), and OPEC to provide an overview of the global energy portfolio. Furthermore, we provide a synthetic image of the future global energy balance by describing the trends in the evolution of production capacity of different components of the global energy portfolio. We have discussed the global oil outlooks to illustrate the implications of OPEC’s oil production decisions for the global energy security. Finally, the role of OPEC’s oil reserves and production capacity in maintaining stability, balance, and security of the world’s energy markets, as well as the implications of its production strategies for the global energy transition are highlighted.

2. World Energy Outlook

The world’s energy portfolio is mainly comprised of fossil fuels, nuclear energy, and renewable sources, including hydropower, bio-fuels, solar energy, wind energy, and other types of renewables, each with positive and negative attributes such as availability, affordability, and environmental impacts (e.g., carbon footprint, water footprint, ecological footprints, and land use). The production capacity for many renewable sources is expanding rapidly, partly due to gradually shifting energy policies that attempt to mitigate human-induced environmental changes. This section describes different components of the world energy portfolio, illustrating the historical and projected share of each energy source in world energy balance.

2.1. Oil and Natural Gas Liquid

Oil and natural gas liquid (NGL) are two essential components of the world energy portfolio that are markedly critical for industrial, technological, and socio-economic growth of nations. Oil and NGL continuously drive international competition among major consuming nations seeking ways and means of securing sufficient energy for improving their socio-economic and technological status. Brandt [23] compared the ability of different models (e.g., linear and bell-shaped curves) to characterize historical oil production on regional, national, and multinational scales in hindsight, and demonstrated that projection of the total amount of the ultimately recoverable oil is a challenging task. The Hubbert linearization model estimates the ultimately recoverable resource to be 2,600 billion barrels, for all conventional liquid fuels combined [24]. As of 2010, the amount of world’s proven oil and NGL is estimated at about 1,380 billion barrels of oil equivalent [1]. This figure is expected to increase as continuous explorations result in securing more crude oil and NGL resources, in an effort to respond to increasing global demand. Figure 1 shows historical trend of oil and NGL consumption. The data demonstrate a steady growth in oil and NGL consumption with occasional fluctuations such as in early 1980’s, and most recently, in late 2000’s.
Figure 1. Historical trend of world’s oil and NGL consumption (Source of data: BP [1]).
Energies 05 02626 g001
The geographical distribution of the world’s proven crude oil and NGL resources are quite heterogeneous. For example, the proven crude oil and NGL shares of Middle Eastern countries is greater than that of all other countries of the world combined. While more than half of the world’s proven crude oil and NGL is found in Middle East, production of oil and NGL in this area approximately amounts to 30% of total global production, about 9% of which is consumed locally. By contrast, the United States, Europe, and China consume more than half of the world’s produced oil and NGL. Figure 2 illustrates the global distribution of world’s proven crude oil and NGL reserves, production, and consumption at the end of 2010.
Figure 2. Continental/regional distribution of world’s proven crude oil and NGL reserves, annual production, and annual consumption in 2010 in billion barrels (bbl) and trillion cubic meters (tcm) (Source of data: BP [1]).
Energies 05 02626 g002

2.2. Non-Conventional Liquid and Gas Sources

Non-conventional liquid energy sources include shale oil, gas-to-liquids (GTL), coal-to-liquids (CTL), extra heavy oil, oil sands, and biofuels. As the conventional liquid resources become less affordable, the popularity of non-conventional liquid resources increases in the energy markets, and their economic efficiency is expected to improve under high oil price projections. However, with the current state of technology, the production process for these sources is generally less efficient and has more environmental problems than conventional liquids. The current and projected annual global non-conventional liquid fuel production (Figure 3) suggest that production of non-conventional liquid fuels, excluding biofuels which are discussed separately, is projected to increase significantly [25]. In particular, oil sands, extra heavy oil, and coal-to-liquids are expected to dominate the non-conventional liquid fuel mix.
Natural gas will play a central role in meeting the world’s energy needs for the next few years. Growth in demand for gas far surpasses that for the other fossil fuels due to its more favorable environmental and practical attributes, and constraints on developing low-carbon energy technologies. The recent development of the non-conventional gas sources has transformed the outlook of the world gas market. In the United States, for example, over a third of the increase in gas production comes from non-conventional sources such as shale gas, coal-bed methane, and tight gas [26]. The new technology of drilling, which increases productivity and lowers production costs, has significantly increased the U.S. supply of gas and, consequently, led to lower gas prices [8]. In spite of potential obstacles to the development of these non-conventional resources, such as requiring large volumes of water, higher drilling costs, the environmental impacts, and the distance from existing pipeline infrastructure, the global gas supply from these resources has been estimated to nearly double in the next twenty years [8,25]. The reduced demand due to decreased imports of the U.S. and possibly other member countries of the Organisation for Economic Co-operation and Development (OECD) could lead to less connectivity between regional markets, resulting in decreased gas prices. This potential increase in the gas supply, which significantly affects the energy market structure because of the linkage between oil and gas prices, can be an important factor for OPEC in the next few years. Figure 4 shows the current and projected annual global non-conventional gas production.
Figure 3. Historical and projected annual global non-conventional liquid fuel production in million barrels per day (Mb/day) excluding biofuels (Source of data: EIA [25]).
Energies 05 02626 g003
Figure 4. Current and projected annual global non-conventional gas. (trillion cubic feet (tcf)) (Source of data: EIA [25]).
Energies 05 02626 g004

2.3. Coal

Coal is an abundant energy source in many areas of the world (Table 1). Coal is extensively used in various industrial processes such as steel and aluminum industry, and cement production. Figure 5 displays the evolution of world’s coal production and consumption over the past three decades. The global amount of proven coal reserves is approximately 861,000 million tonnes [3]. In many countries, a significant share of total coal consumption (e.g., 94% in South Africa, 93% in Poland, and 81% in China) is used for producing electricity [17]. The USA, the Russian Federation, and China collectively hold about 60% of global coal reserves. During the past decade, the consumption of coal outpaced other types of non-renewable energy sources with an average annual growth of 4.9% [3]. Global consumption of coal is projected to grow by 60% by 2030, over 50% of which is due to increased demand by power generation sectors in China and India [8]. In fact, a plentiful supply of indigenous coal has enabled China and India to use this resource as an affordable primary energy source for their rapidly growing economies. It is worth noting that coal, in its conventional way of use, is one of the most polluting energy sources, especially in terms of greenhouse gas (GHG) emission [27].
Table 1. Continental/regional share of proven coal reserves, annual production, and annual consumption in 2008 (Source of data: WEC [3]).
Continent/RegionReserveProductionConsumption
Africa3.68%3.79%2.77%
North America28.49%16.94%17.95%
South America1.45%1.30%0.72%
Asia26.51%56.82%61.18%
Europe30.78%15.14%15.50%
Middle East0.14%0.04%0.26%
Oceania8.94%5.97%1.61%
Total (Mtoe)421,9003,4703,470
Figure 5. Historical trend of world’s coal production/consumption (Source of data: BP [1]).
Energies 05 02626 g005

2.4. Nuclear Energy

Nuclear energy has been considered by some as a suitable candidate for substituting fossil fuels since it has become a well-established low-carbon emission technology, capable of meeting large-scale electricity demand [28,29,30]. Figure 6 shows the global and regional trend of nuclear energy production. The OECD countries and former Soviet Union produce majority of the world’s nuclear energy. Nuclear energy production grew rapidly from early 1970s until early 1980s when it experienced a step-like increase in production. Global nuclear energy production has continued to grow after the peak of production expansion in the mid-1980s with minor occasional decreases, although the increase has somewhat slowed down in the 2000s, and the decrease in production in OECD countries has become more apparent towards late 2000s.
Figure 6. Global and regional evolution of world’s nuclear energy production (Source: IEA Key World Energy Statistics© OECD/International Energy Agency 2010a, page 16 [5]).
Energies 05 02626 g006
Proponents of this energy advocate that it can be efficiently and reliably produced from a plentiful supply of uranium worldwide, reducing vulnerability of nuclear-generated power to fossil fuel price fluctuations [29]. Given the increasing concern about anthropogenic climate warming, nuclear energy is deemed to play a growing role in the global energy mix in the future [30]. IEA projects that the world’s share of nuclear-generated electricity will grow by, approximately, 13% by 2030—a 46 GW increase over 368 GW in 2005. Furthermore, IEA’s projection for a scenario of rigorous technological advancement, enforcement of policies favoring low-carbon emission energy use, and additional investment in the nuclear energy sector show about 40% growth over 2005 levels. This growth may contribute to nearly 10% of the avoided carbon emissions in 2030 [31]. However, it is necessary to address a number of issues in order to implement a robust nuclear energy plan at the strategic and project level. Construction of nuclear power plants requires a large amount of capital, making it difficult for the private sector to invest in nuclear energy [32]. Thus, in addition to technological and technical considerations, the implementation of nuclear energy programs will require a top-down approach founded on governmental policies to reduce investment risks or incentivize investment and address public concerns at local, national, and international scales about the safety of nuclear power plants and disposal of radioactive waste [28,30,32].

2.5. Hydropower

As a cheap, flexible, and relatively clean (with low GHG emissions) energy source [33], hydropower is used as a source of energy by more than 160 countries, and currently supplies about 16% of the world’s electricity production, which approximately amounts to 775 Mtoe. Figure 7 shows the historical trend of global and regional hydroelectricity production. The slight growth in hydroelectricity production in OECD member countries, represented by a nearly flat line, denotes that stable hydropower generation capacity has largely been exploited in these countries. The same holds true for non-OECD European countries and former Soviet Union. The global growth in hydroelectricity production is chiefly due to increasing production in China, Latin America, Africa, and Asia excluding the Middle East. Middle Eastern hydropower production comprises a very small proportion of global production. While hydropower production capacity is expanding in North America and Europe, the bulk of capacity expansion is occurring in the developing countries. China and India, in particular, may see hydropower as a potential source of energy that can decrease their reliance on fossil fuels. However, it is unlikely that increased hydropower production in these two countries can contribute significantly to meeting the energy needs for which fossil fuels are currently used.
Figure 7. Global and regional evolution of world’s hydropower production (Source: IEA Key World Energy Statistics© OECD/International Energy Agency 2010a, page 18 [5]).
Energies 05 02626 g007

2.6. Biofuels

Anthropogenic alteration of natural processes such as climate change is raising concerns about sustainability of existing energy resources available to humans. Biofuels are viewed by many as a suitable renewable energy source, which can be used as a sustainable alternative for fossil fuels in the primary energy mix, especially in transportation and electricity generation sectors [34]. As shown in Figure 8, production of biofuels has grown steadily over the past decade, albeit more rapidly in the mid-, and to a lesser extent, late 2000’s [1]. Advocates of biofuels attribute a host of benefits to this energy source, including improving local energy security and trade balances, opportunities for socio-economic development in rural areas, and providing a sustainable context for producing energy using waste and residues. As of 2010, biomass resources comprise about 10% of annual primary energy consumption worldwide [3].
Figure 8. Global distribution of biofuel production over the period 2000–2010 (Source of data: BP [1]).
Energies 05 02626 g008
Comprehensive and systematic investigation of biofuels’ potential for substituting fossil fuels seems necessary before they can ground substantial changes in energy policies at national and international scales [12,13]. Two key factors constraining the use of biomass for producing biofuels are natural resources availability and choice of energy crops [3]. Land and water availability alongside changes in food demand may impose limits over biomass production. Furthermore, the choice of energy crop species that can be planted in a given geographic area will determine the biomass yield, which is critical for viability of biomass production projects. In particular, land use change for biofuel production has raised concern in regards to the production and price of food [35]. The resulting land use change can have considerable impacts on the carbon balance of a biofuel, and can increase GHG emissions, as compared to regular gasoline [11,35]. Additionally, the high water demand of biofuels has been a source of concern for other researchers [36]. Second generation feedstocks (woody crops) have been demonstrated to be superior to first generation feedstocks (e.g., sugar, starch, and vegetable oils) due to their lower effective cost and natural resource impacts [37]. The noted concerns and opportunities suggest that local and global biofuel production capacities, and implications for mitigation of GHG emissions, and changing climatic conditions need to be better understood before the biofuels’ long-term share in the global energy portfolio can be projected realistically [12,38].

2.7. Wind Power

Wind energy is free of the typical constraints limiting other types of energy as it is available in vast geographical extents across the globe. Some researchers have provided striking estimates of wind power potential for accommodating the entire global electricity consumption [39]. For example, in Europe the off-shore wind power generated within 30 kilometers from the coastline is estimated to be sufficient for meeting electricity needs of the whole European Union [3]. The world’s actual cumulative installation of wind turbine capacity is illustrated in Figure 9. Global wind power generation capacity grew rapidly in the late 1990’s, nearly doubling every three and half years. The growth was even faster in the early 2000’s, making it one of the fastest growing energy generation technologies. While increasing environmental awareness is part of the reason for rapid growth of wind energy generation capacity in the developed world, this energy source is of interest to developing countries as well, especially in areas with high average wind speed where electricity is urgently needed [3]. It is thus plausible to expect that the wind power production will continue to grow as the debates over climate change and energy policies gradually shift towards use of cleaner energies.
Figure 9. World’s cumulative installed wind power capacity (Source of data: BP [1]).
Energies 05 02626 g009

2.8. Solar Energy

Solar energy is another example of widely available renewable energy source whose share in the global energy balance will grow over the next few decades. Most recently, in one sunny spring-day of 2012, Germany supplied 50% of its electricity production from solar panels [40]. Data from IEA Photovoltaic Power Systems Program (2011) demonstrate that throughout the 2000s, the solar energy production capacity of the 28 countries that are participating in the IEA Photovoltaic Power Systems Program (PVPS) has increased very rapidly (Figure 10) [41]. As of 2011, the electricity generation capacity using solar energy in PVPS countries amounts, approximately, to 35 GW. Although a very small share of the total electricity produced, this amount of electricity production is over fifty times larger than that of 2000, demonstrating the fact that solar energy production has probably grown faster than any other method of energy production [41]. At the end of 2011, about 5 GW of electricity was generated in the rest of the world utilizing solar energy, mostly in developing countries, including China [1]. While solar energy production capacity is growing worldwide, it is difficult to envision the contribution of this energy source to become comparable to fossil fuels in foreseeable future.
The renewable energy mix comprises hydropower, biofuels, wind power, solar energy, and other renewable energy sources including wave energy, tidal energy, and geothermal energy, among others. As of 2011, hydropower is the most significant renewable energy contributor to global electricity production [11]. Figure 11 presents global evolution of renewable energy use over the past decade, excluding hydropower consumption, as reported in BP Statistical Review of World Energy in 2011 [1]. The figure illustrates the conspicuous growth of renewable energy use. To put the numbers of this figure in perspective, consumption of renewable energies in 2008 was about 13% of the world’s total primary energy use, demonstrating the fact that renewables, although important, currently have a small contribution to the world’s energy balance. Figure 12 portrays the breakdown of contribution from various components of world energy portfolio to total primary energy consumption in 2008, illustrating the dominance of fossil fuels [5].
Figure 10. Photovoltaic countries cumulative installed solar power capacity (Source of data: BP [1]).
Energies 05 02626 g010
Figure 11. World’s cumulative consumption of renewables excluding hydropower (Source of data: BP [1]).
Energies 05 02626 g011
Figure 12. Shares of different energy sources in total primary energy consumption in 2008 (Source: IEA Key World Energy Statistics© OECD/International Energy Agency 2010a, page 6 [5]).
Energies 05 02626 g012

3. OPEC and World Energy Outlook

Bentley et al. [42] provided a review of energy and socio-economic data sources, modeling approaches, and assumptions for several contemporary forecasts of the global oil supply. They identified two main classes of forecasts, i.e., peak forecasts and quasi-linear forecasts. The peak forecasts anticipate the peak of oil production to occur by 2030 after which point the global production of oil will decline, whereas the quasi-linear forecasts anticipate that global oil production will continue to rise in response to demand or it will plateau around the year 2030 [42]. The peak oil forecasts are essentially based on the finiteness of oil arising from physical limits on feasible extraction rates. Counterarguments to these forecasts have been made based on the inaccuracy of previous peaking forecasts, adequacy of proven global reserves for sufficient production, and discovery of new reserves [43]. Although some of these arguments like potential room for expansion of proven reserves appear legitimate despite the uncertainties regarding investment decisions [43], Jakobsson et al. [44] challenge these arguments’ scientific rigor, demonstrating that they are “unconvincing on both theoretical and empirical grounds.” While the outcome of the quasi-linear analyses can be questioned and critiqued on several physical, socio-economic, and political grounds, like any other projection, they nonetheless provide plausible projections for future energy mix, which have important implications for the global energy security.
The quasi-linear and peak oil projections have, respectively, provided high and low oil production forecasts [45]. These forecasts range from 39.3 Mb/day to 105.2 Mb/day, the majority of which are larger than the median 91.45, and a significant number are in the range of 60–80 Mb/day. The projections of oil production by 2030 from such sources as EIA, IEA, and OPEC are on the higher end of the forecasts whereas other sources including LBST, Campbell, Peak Oil Consulting, and Uppsala University’s Global Energy Systems Group provide peak forecasts in the lower range [45]. Table 2 summarizes key assumptions and projected attributes for these examples of global oil production reference forecasts for 2030.
Table 2. Examples of global oil production reference forecasts summarizing the range of key assumptions and projected attributes for 2030 (adapted and updated from Sorrell et al. [45]).
ForecastForecast sourceKey assumptions Key projected attributes
High productionIEA, EIA, and OPECUltimate recoverable resource: 3,345–3,577 billion barrels
Average annual economic growth rate: 3.1%–3.5%
Average annual global population growth: 0.9%–1.0%
Average oil price: US $ 106–123
Average Production or supply: 96.5–105.7 Mb/day
Average decline rate: 4%–8.5%
Low productionLSBT, Campbell, Peak Oil Consulting, Uppsala Global Energy Systems GroupUltimate recoverable resource: 1840–3150 billion barrelsAverage Production: 39.3–75 Mb/day
Average Post-peak average decline rate: 2%–4.5%
Source of data: IEA [5], EIA [25], OPEC [46], Bentley et al. [42], and Sorrell et al. [45].
It is particularly worthwhile to investigate the dynamics of the global energy portfolio under high oil production projections due to high demand for this energy source coupled with crucial dependence of member countries of OPEC on oil production as their primary means of generating revenues. The reinforcing feedback mechanism between the need of both buyers and sellers to trade oil is a difficult challenge to overcome in order to move towards a more balanced global energy mix. For this reason, a number of energy perspectives from the high-oil production forecasts have been discussed in the present synthesis to draw insights for the global energy outlook, as well as the role of OPEC in the future oil production and supply in an oil-dominated future. Understandably, these energy outlooks are not exhaustively representative of what will actually happen in the future. Rather, they represent the probable future energy scenarios based on certain assumptions and conditions. We have discussed the projections from EIA in greater detail as they characterize a wide range of possible global oil outlooks under a variety of price and production scenarios.
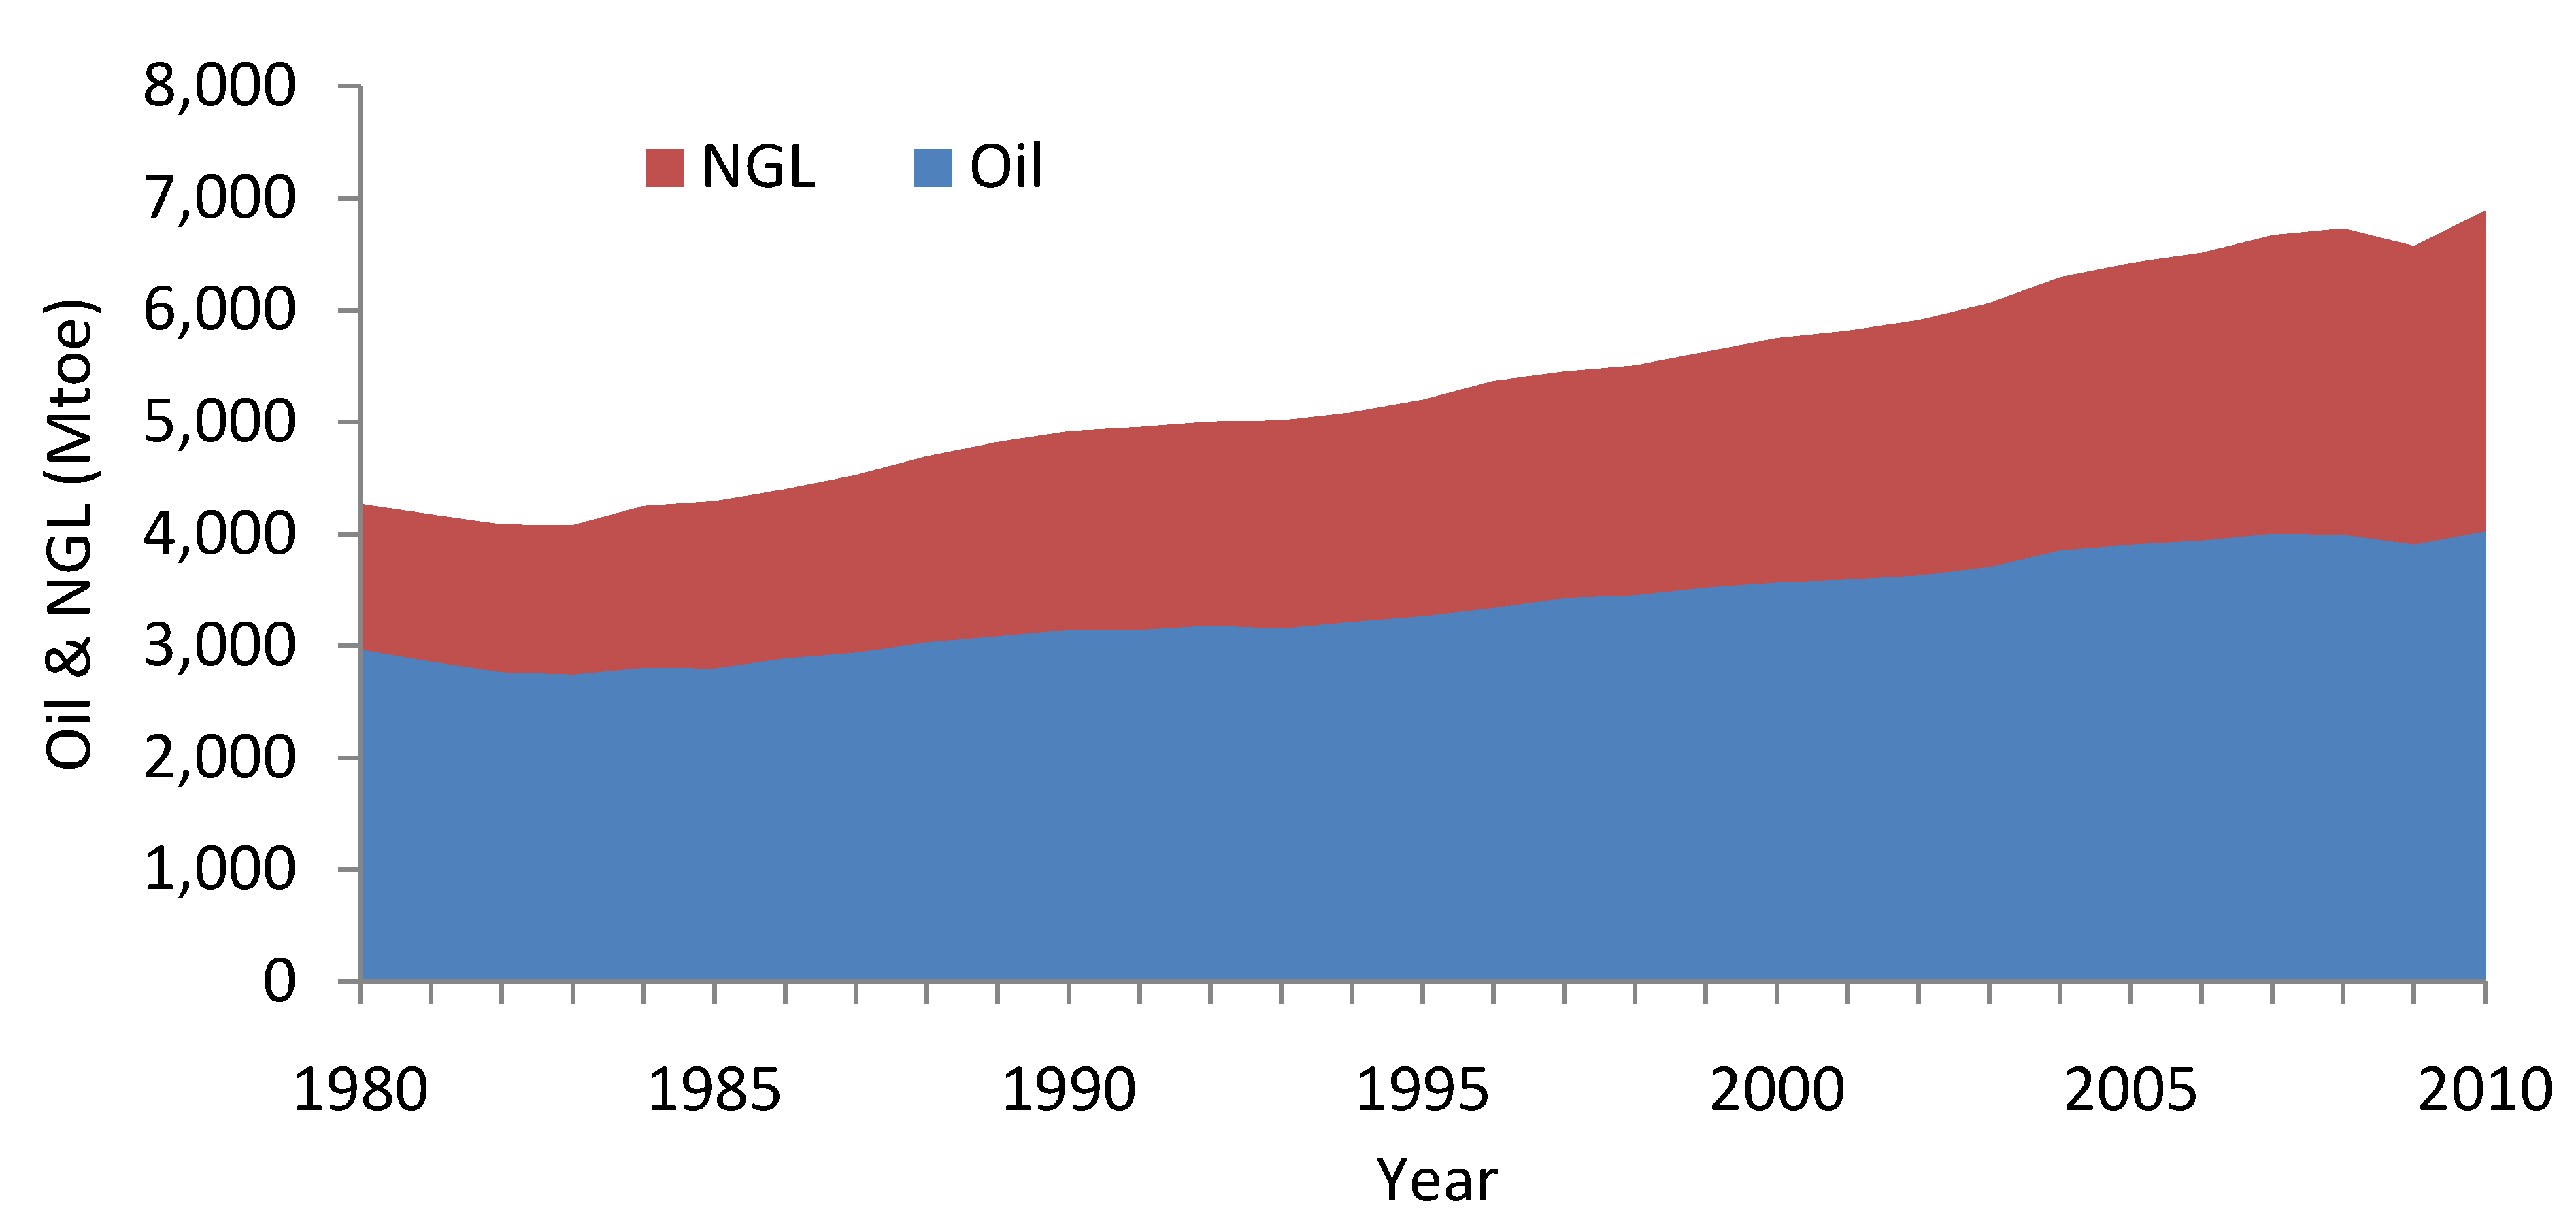
The IEA has estimated that fossil fuels will account for more than three quarters of the overall increase in energy use between 2007 and 2030 [8]. Based on the reference scenario of IEA’s projection, if the global energy policies remain unchanged, the world will increasingly rely on large-scale supplies of oil and NGL sources and their share in the world energy portfolio will likely increase from 57% in 2002 to approximately 60% in 2030 [8]. Continued reliance on oil and NGL may potentially translate into an increase of about 70% in the global demand within the next two decades. These projections further reveal that, even if governments decide to adopt low GHG emission policies, the total global demand for oil and NGL may only decrease by about 10% and 11%, respectively [8]. In order for this reduction to actually take place alternative energy sources should be introduced in an economically and technologically viable fashion while complying with prescribed low GHG emission targets.
The reference case for the OPEC’s own projections assumes that world population will maintain an increasing trend, reaching 8.3 billion by 2030, about 95% of which will be population increase in developing countries [46]. Notwithstanding the significant variability in regional economic growth (e.g., China and India), the reference case assumes that on average the global economy will grow steadily at 3.5% per year within the timeframe of 2010–2030 [46]. Furthermore, despite efforts to account for energy policy changes set forth by governments, this factor will likely be responsible for large uncertainties in projected energy demands. In particular, it is difficult to envision a robust global consensus with regard to GHG emission reduction policies. Although it is anticipated that extensive investment on renewables will increase the share of low-emission energies, under OPEC’s reference case scenario fossil fuels will likely comprise over 80% of the world’s energy mix by 2030 [46].
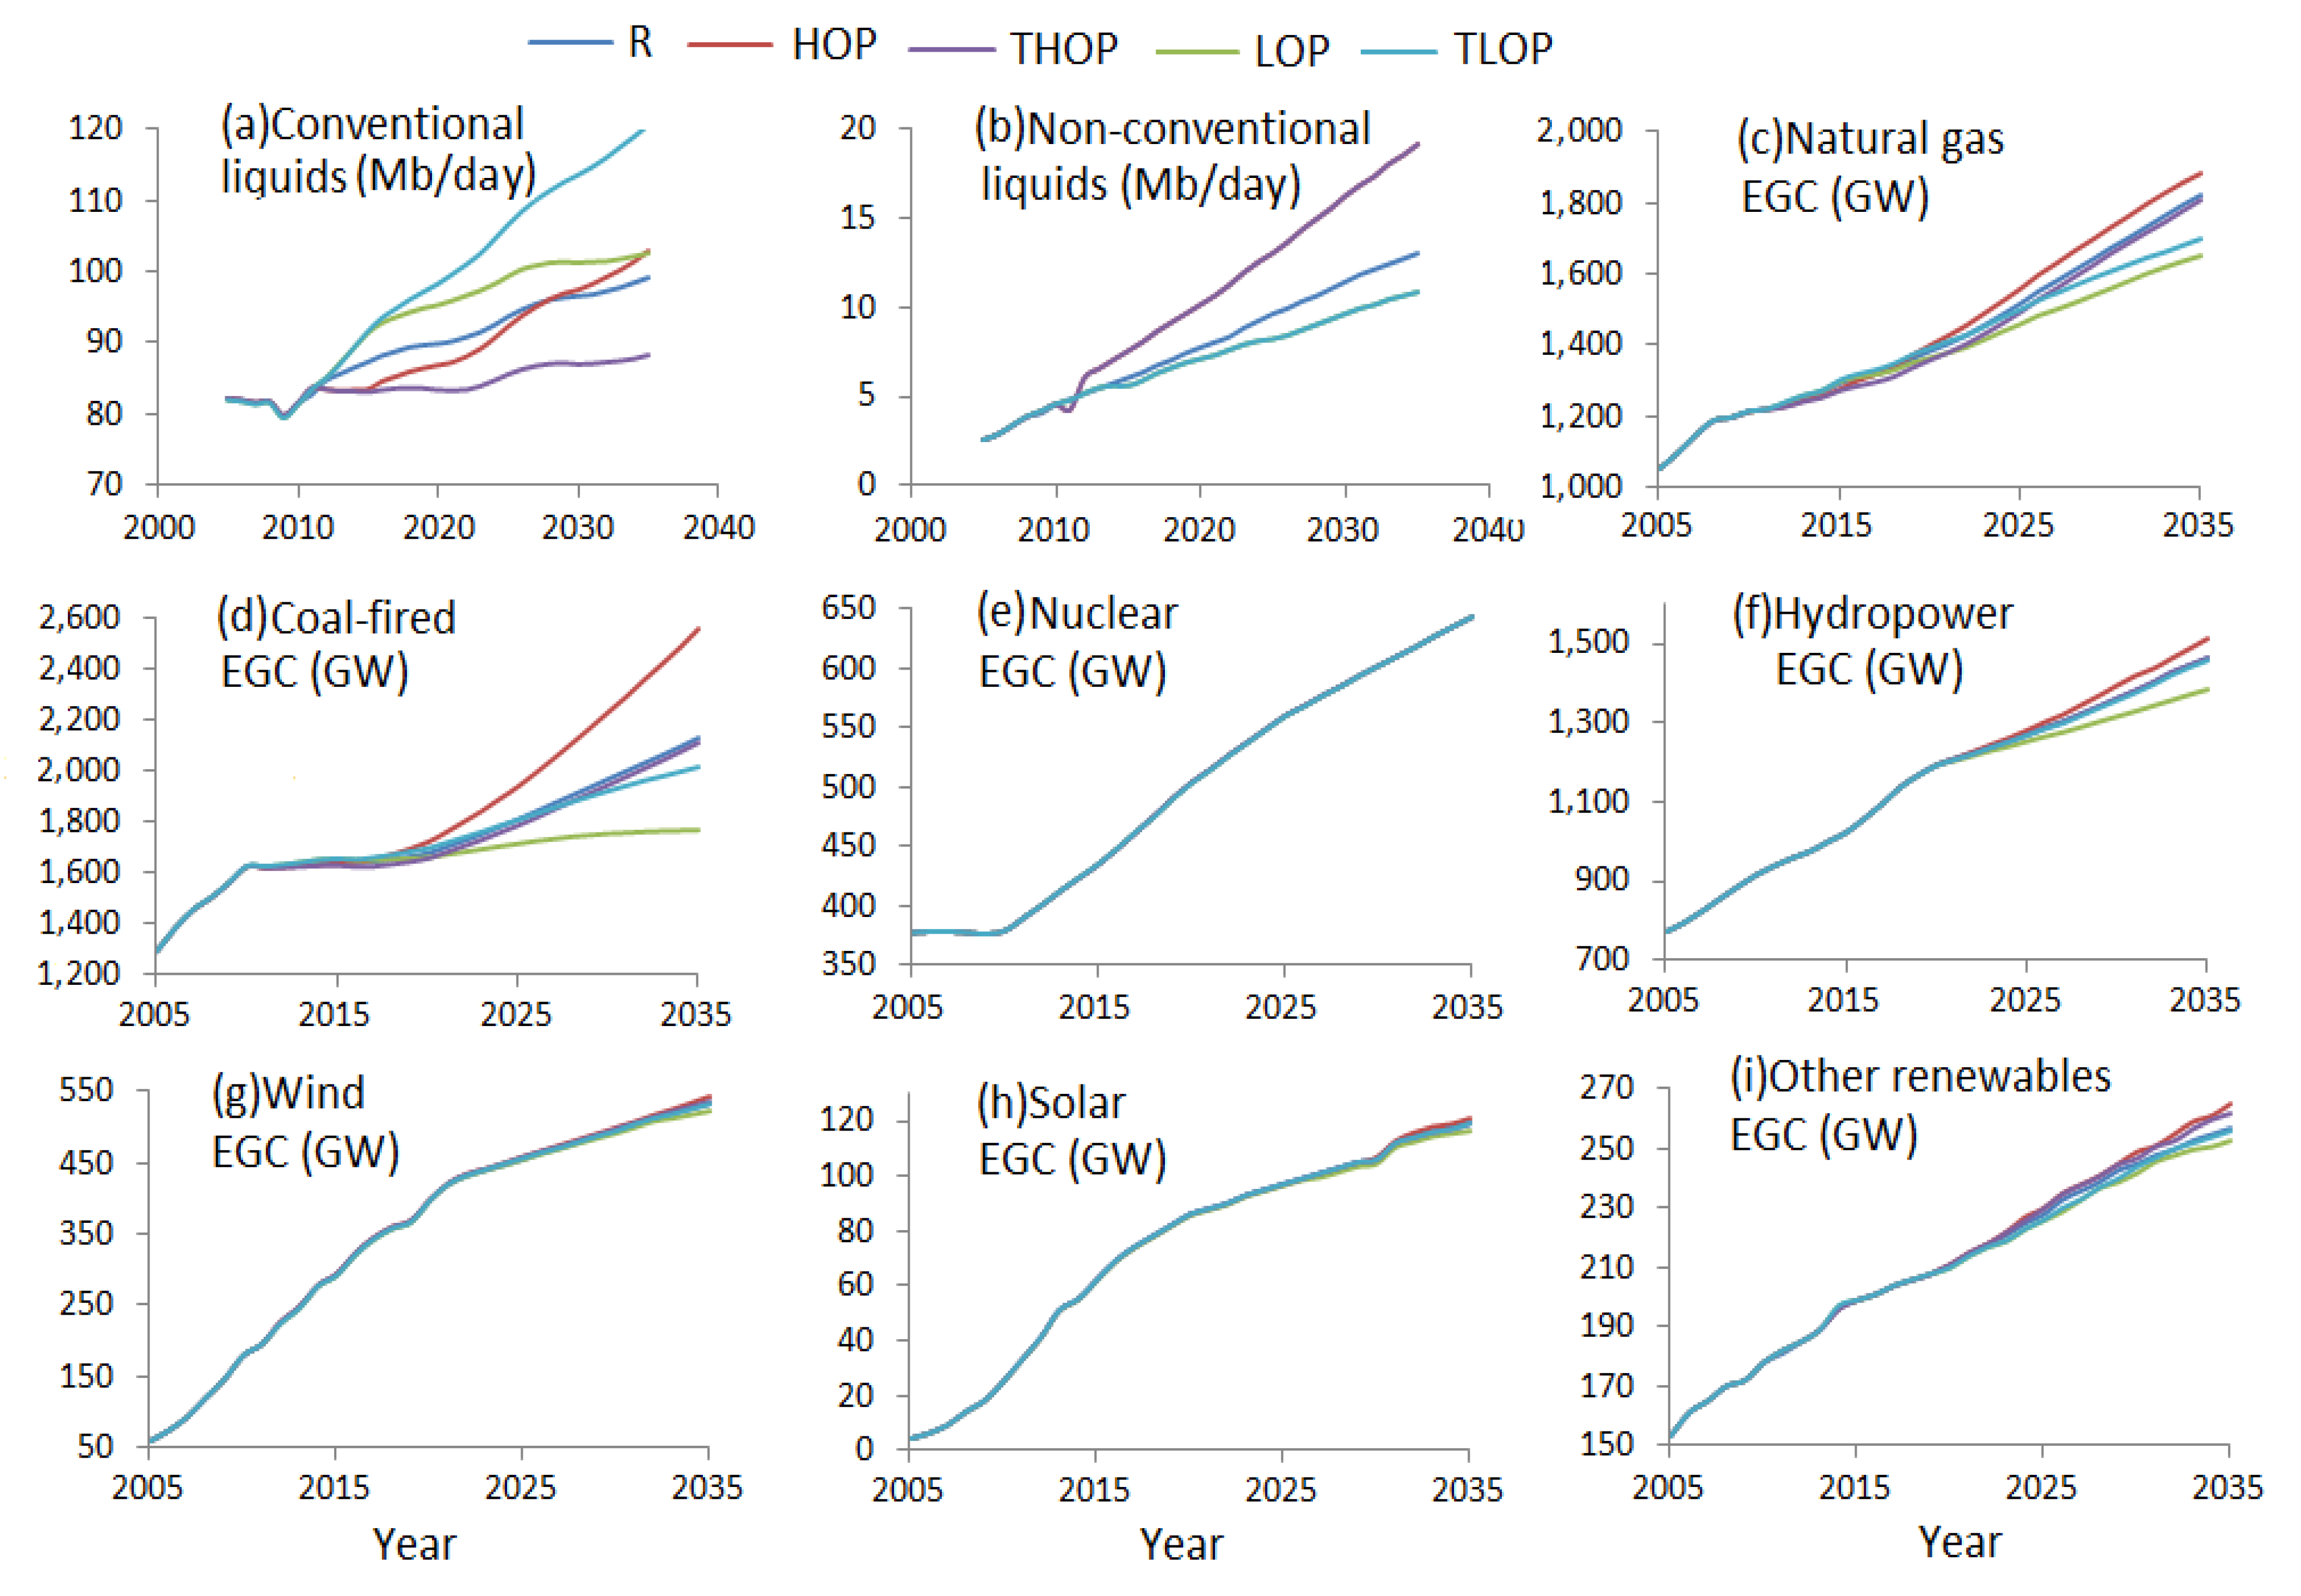
Figure 13 illustrates the EIA’s projected trends in the production of different energy sources. In the reference scenario, which is the business-as-usual trend estimate, projections are developed based on the current technologies and regulations, regardless of the future policies and legislations that affect energy markets. The high oil price scenario characterizes increase in demand driven by higher economic growth of non-OECD countries accompanied by a decrease in oil production. The traditional high oil price scenario associates the high oil price with the decrease in oil supply by OPEC countries. Similarly, low oil price scenario relates the low oil price to the increase in the oil supply accompanied by a decrease in the oil demand. Finally, the traditional low oil price scenario assumes low oil prices will be associated with the increase in oil supply by OPEC countries. While the projected share of different energy sources varies under different scenarios, overall, the energy production from all sources is expected to grow by 2035. Oil is projected to remain the backbone of the global energy mix, especially under low oil price scenarios, which poses a challenge for non-conventional liquid fuels to become economically competitive (
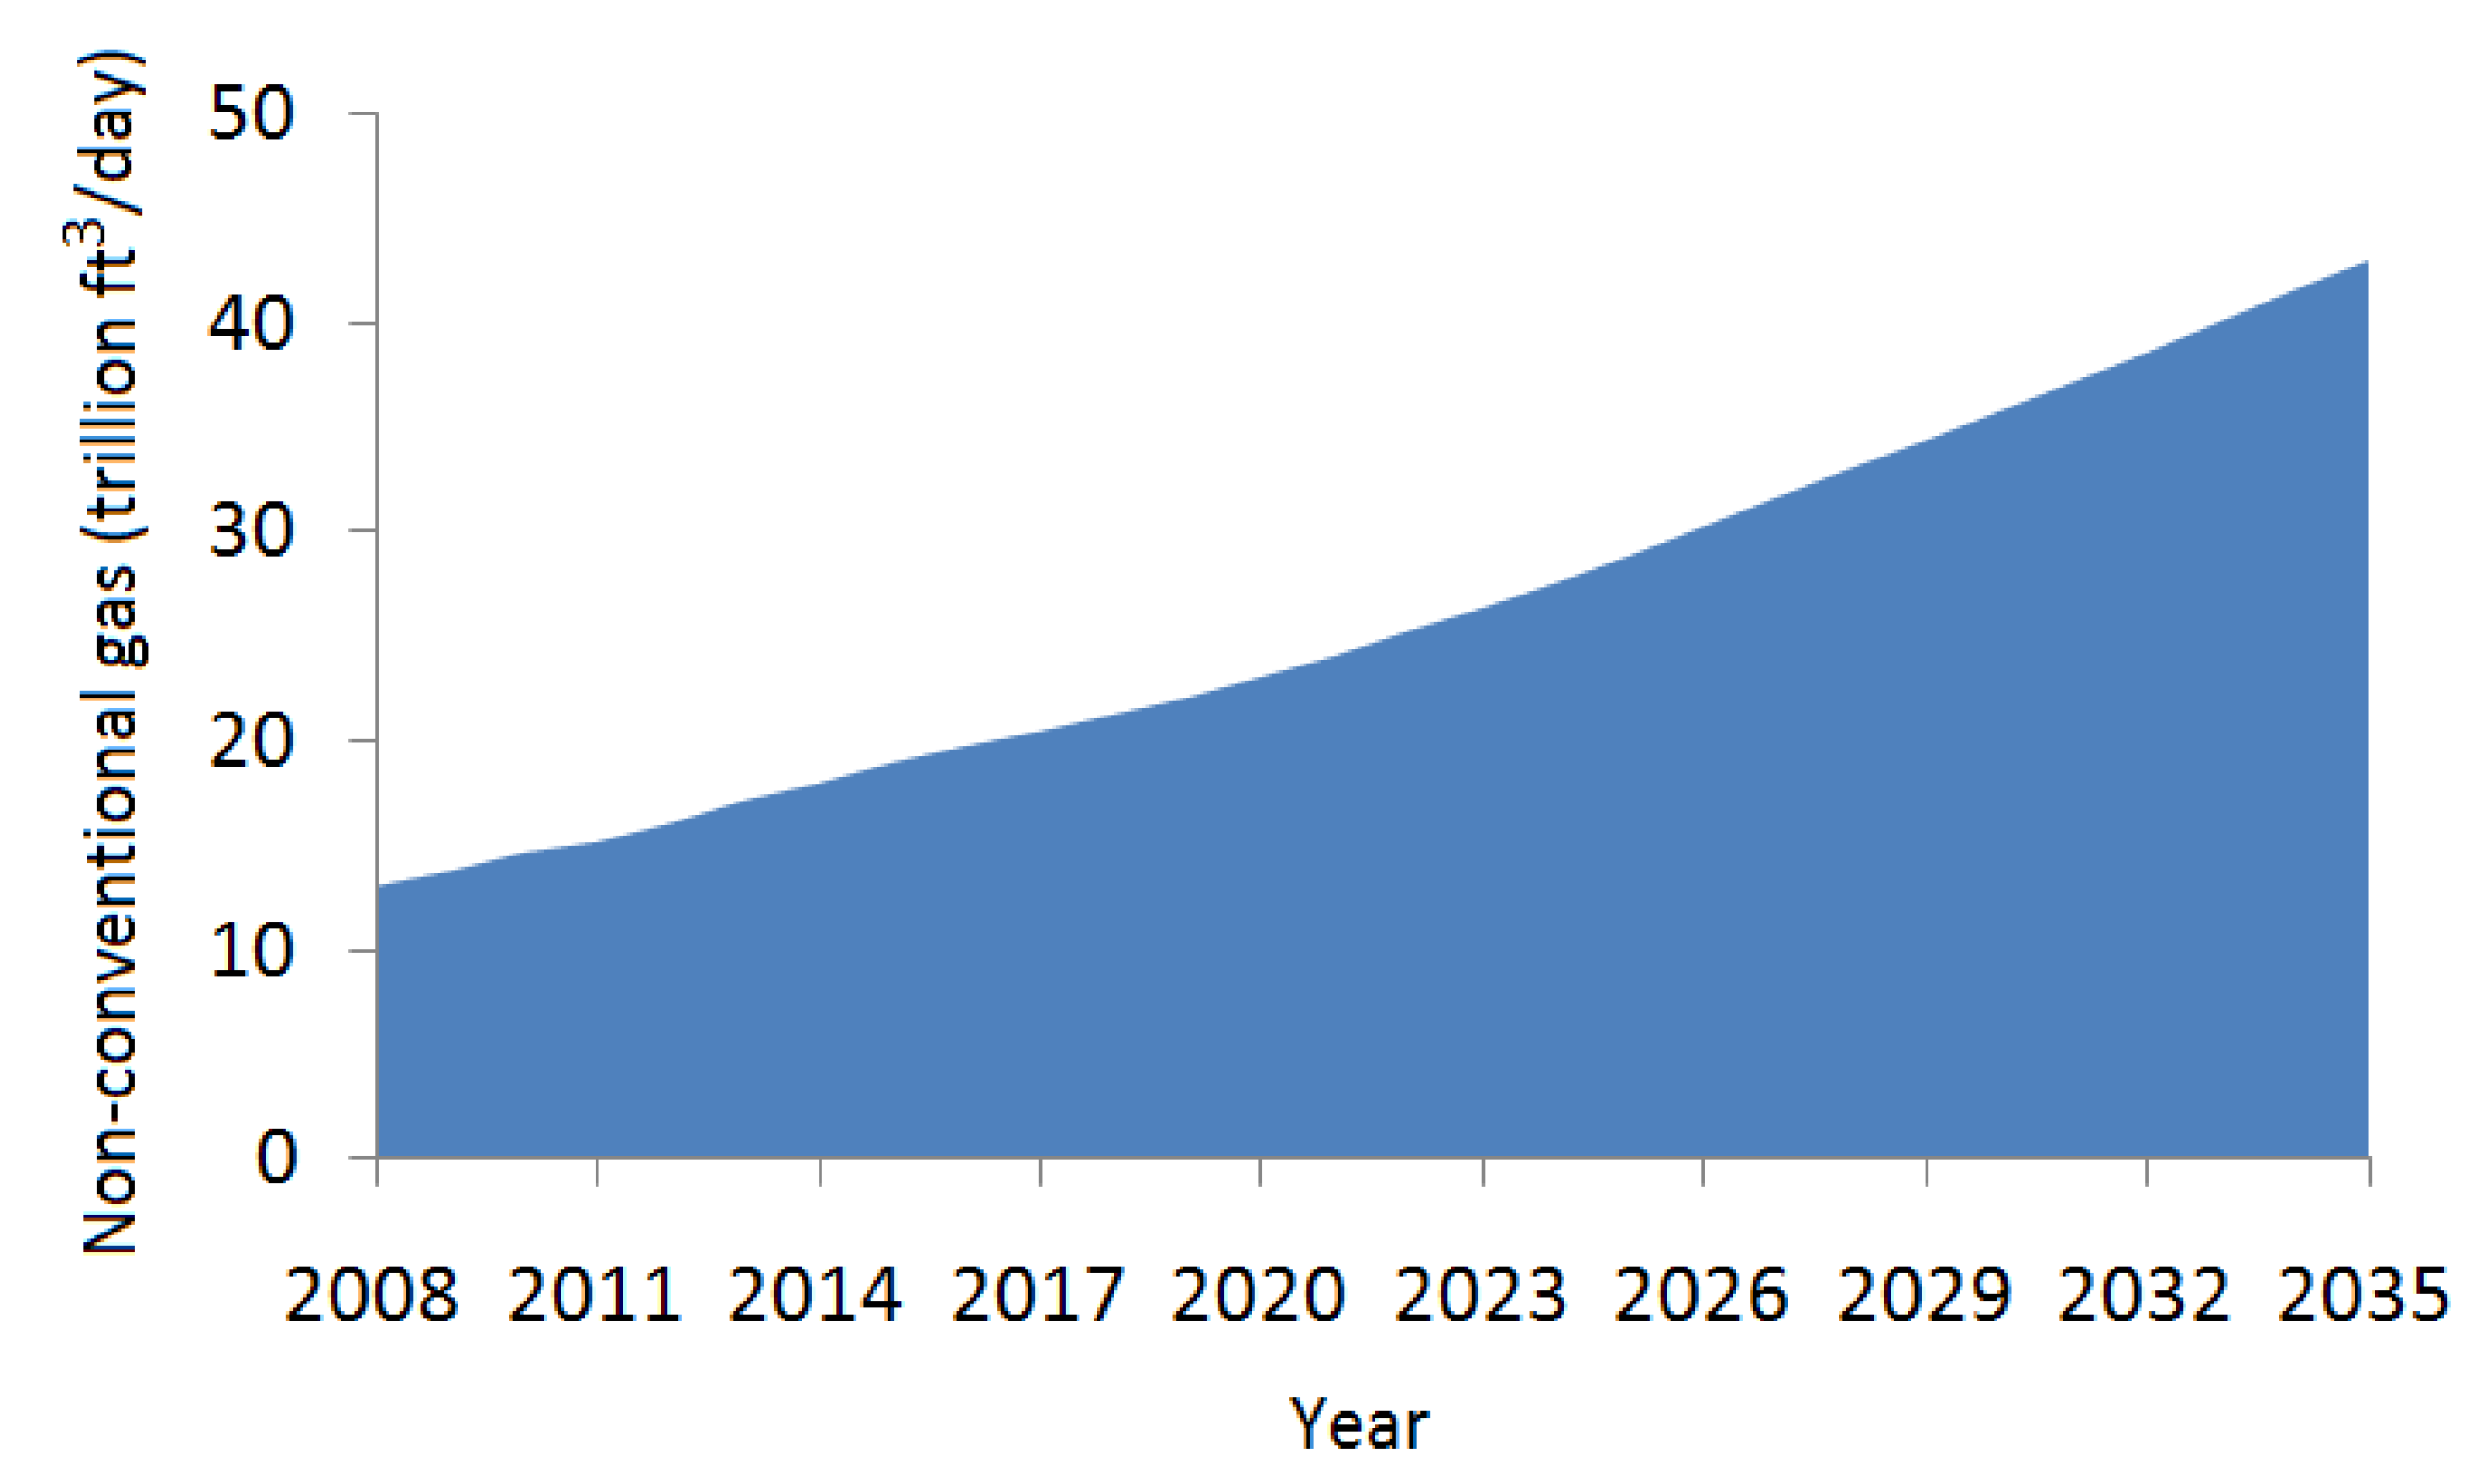
Figure 13a). The economic incentives and energy security concerns are likely to boost the production of non-conventional liquid fuels (Figure 13b). As shown in Figure 13c–f similar long-term trends are projected for the electricity generation capacity from natural gas, coal-fired sources, and hydropower, except the electricity generation capacity for coal-fired sources is expected to plateau under the low oil price scenario. The nuclear sources appear to be insensitive to different scenarios (Figure 13e). Furthermore, the growth trend for wind power, solar energy, and other renewables are similar, and they become more competitive under high oil price scenarios (Figure 13g–i).
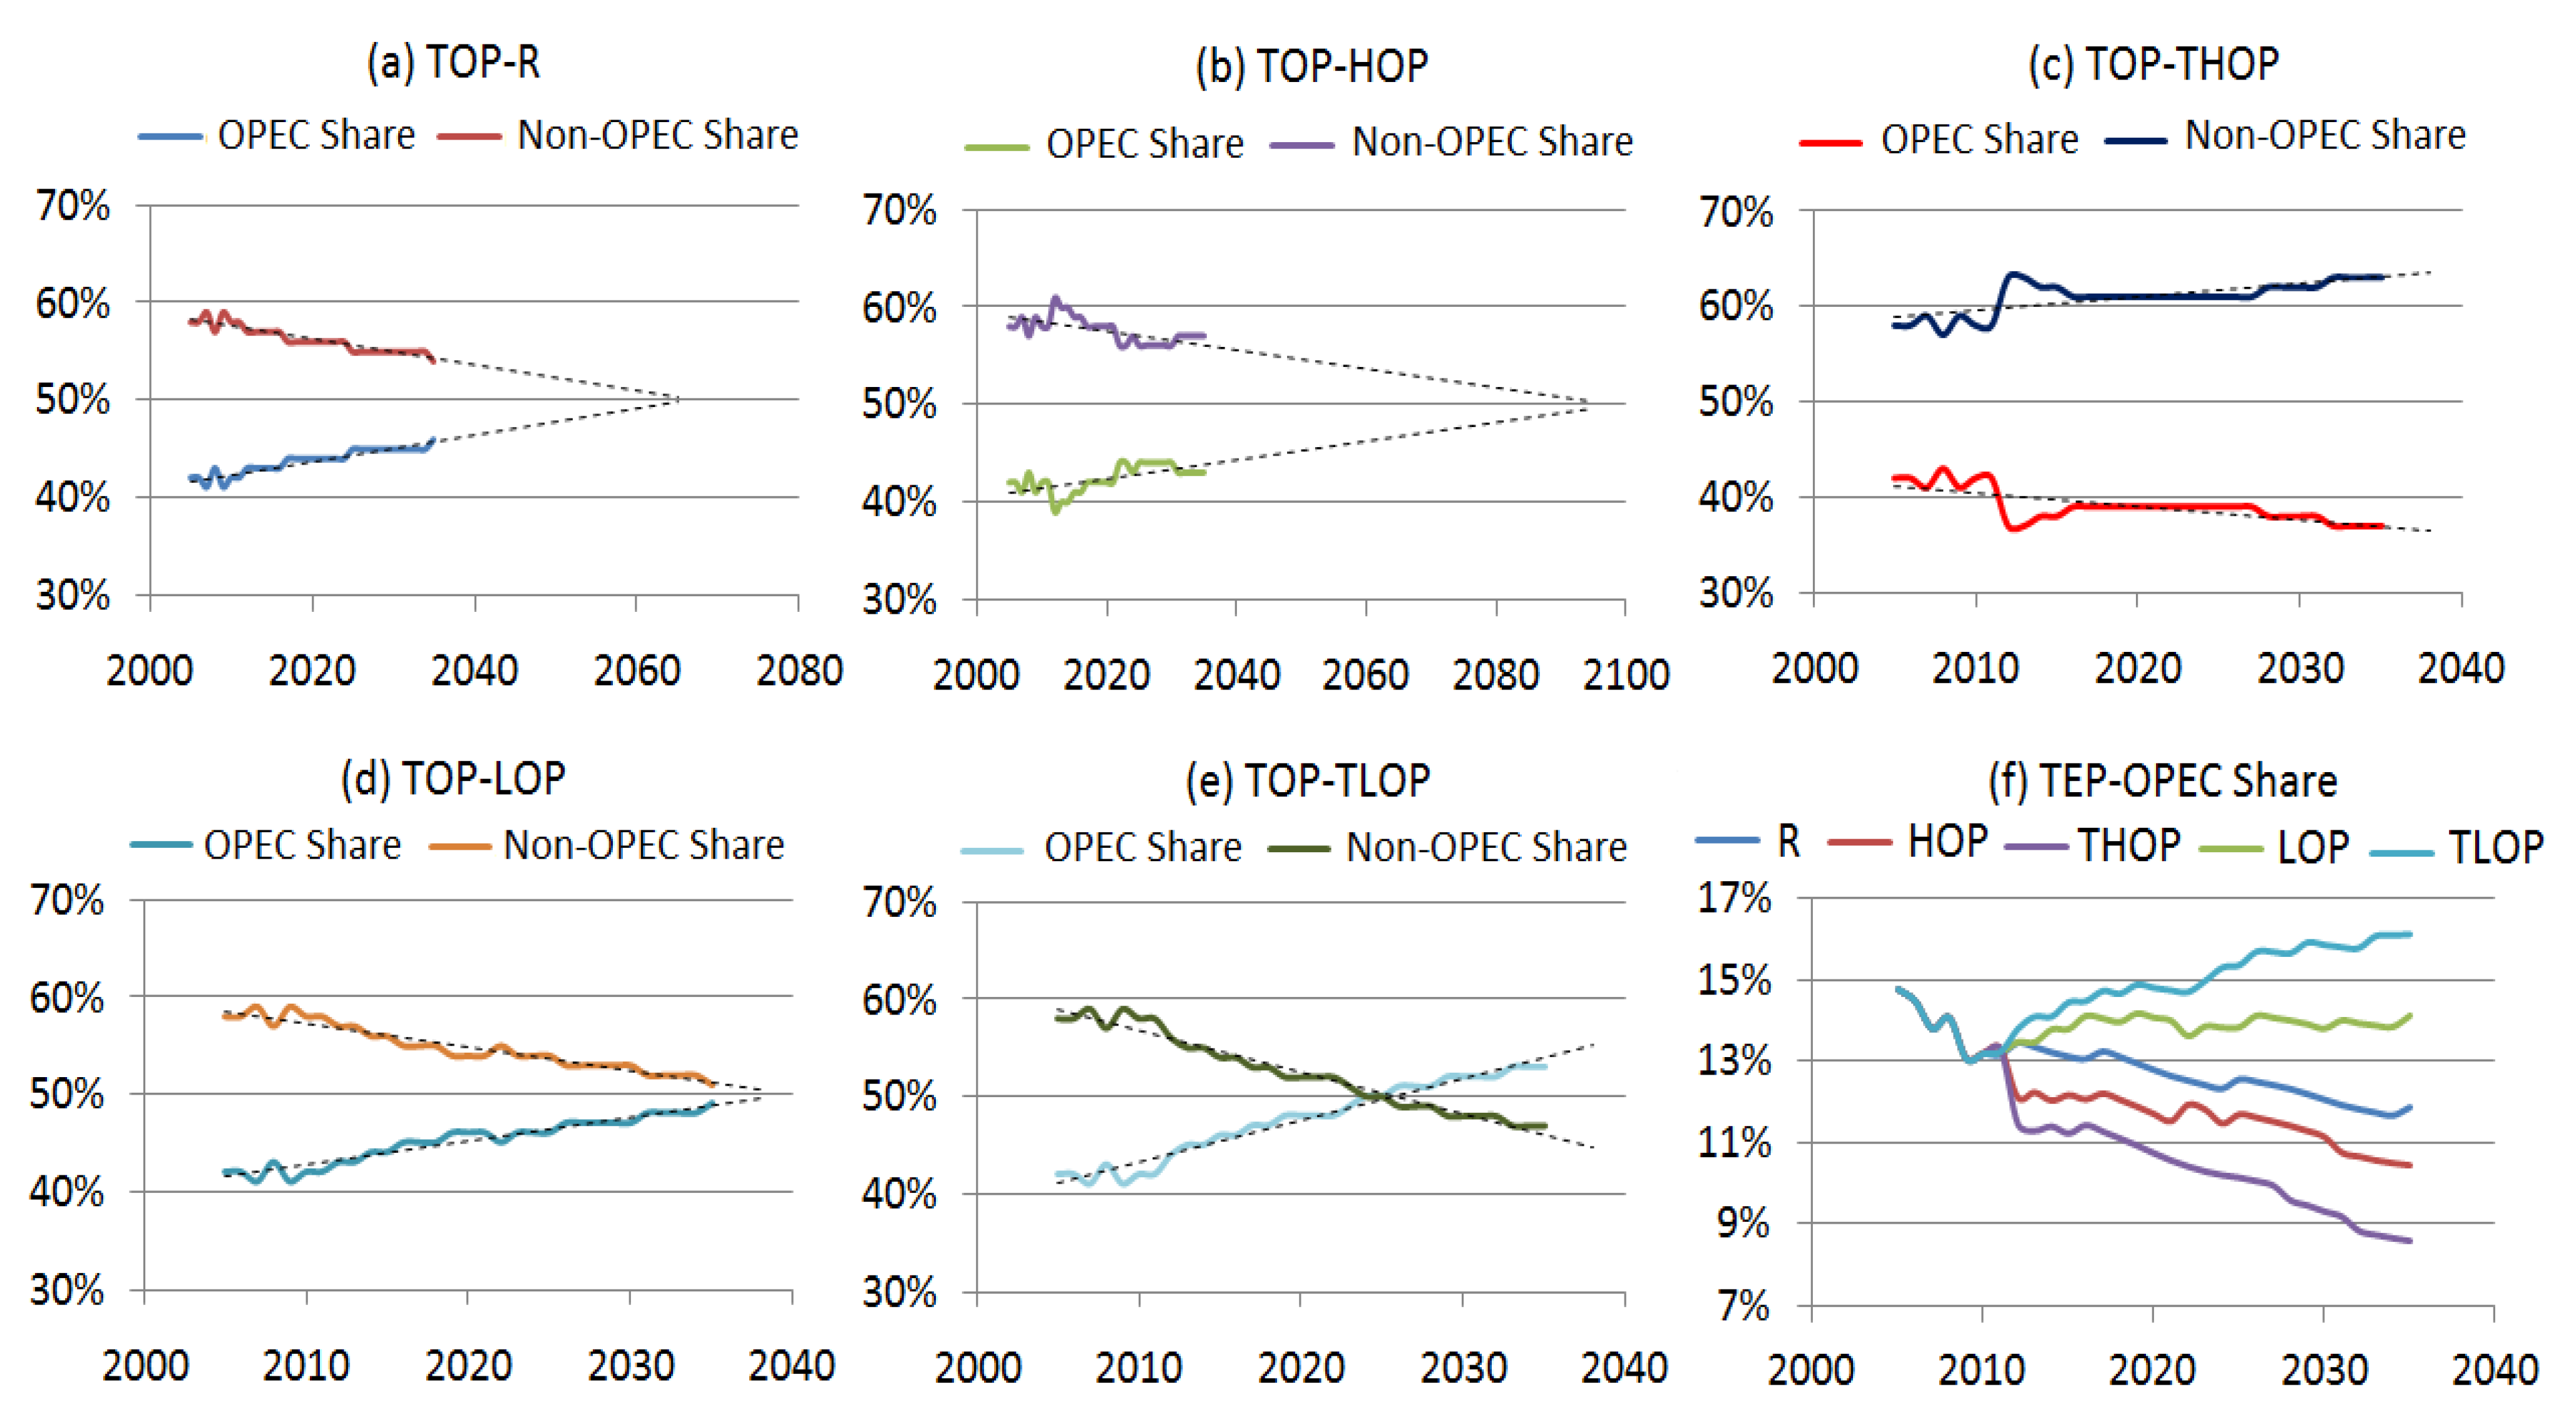
Figure 14 shows the EIA’s projections of OPEC and non-OPEC world’s total oil production. Under the reference scenario, the OPEC’s share of oil production increases by 4% over the period of 2005–2035 (Figure 14a). If this growth rate holds into the future, OPEC will become the dominant oil producer by 2065. Figure 14b shows the OPEC and non-OPEC oil production assuming high oil price scenario over the mentioned period. Based on this scenario, the share of OPEC from total oil production increases over time, but the growth rate will be slower than that in the reference case. Under traditional high oil price scenario, OPEC will never dominate the oil market in the future due to a decreasing trend over the study period (Figure 14c). However, the traditional high oil price scenario is less likely to happen due to the oil dependent economies of the OPEC member countries, as well as the decreased market share of the oil produced by OPEC based on this scenario.
A low oil price scenario, on the other hand, portray a more powerful role for OPEC in the future energy markets. Based on the low oil price scenario, OPEC’s contribution to oil production increases by 7% over the period of 2005–2035 (Figure 14d). Continuation of this trend can make OPEC the dominant oil supplier by 2038. Likewise, OPEC’s share increases by 11% based on the traditional low oil price scenario and OPEC becomes the dominant oil supplier by 2026 (Figure 14e). Although the share of oil in the global energy markets is decreasing due to emerging policies addressing climate change and depleting fossil fuel reserves, even under the worst case scenario (traditional high oil price scenario), the oil produced by OPEC appears to be an important component of the global energy mix, contributing to at least 10% of the total energy supply in the next two decades (Figure 14f).
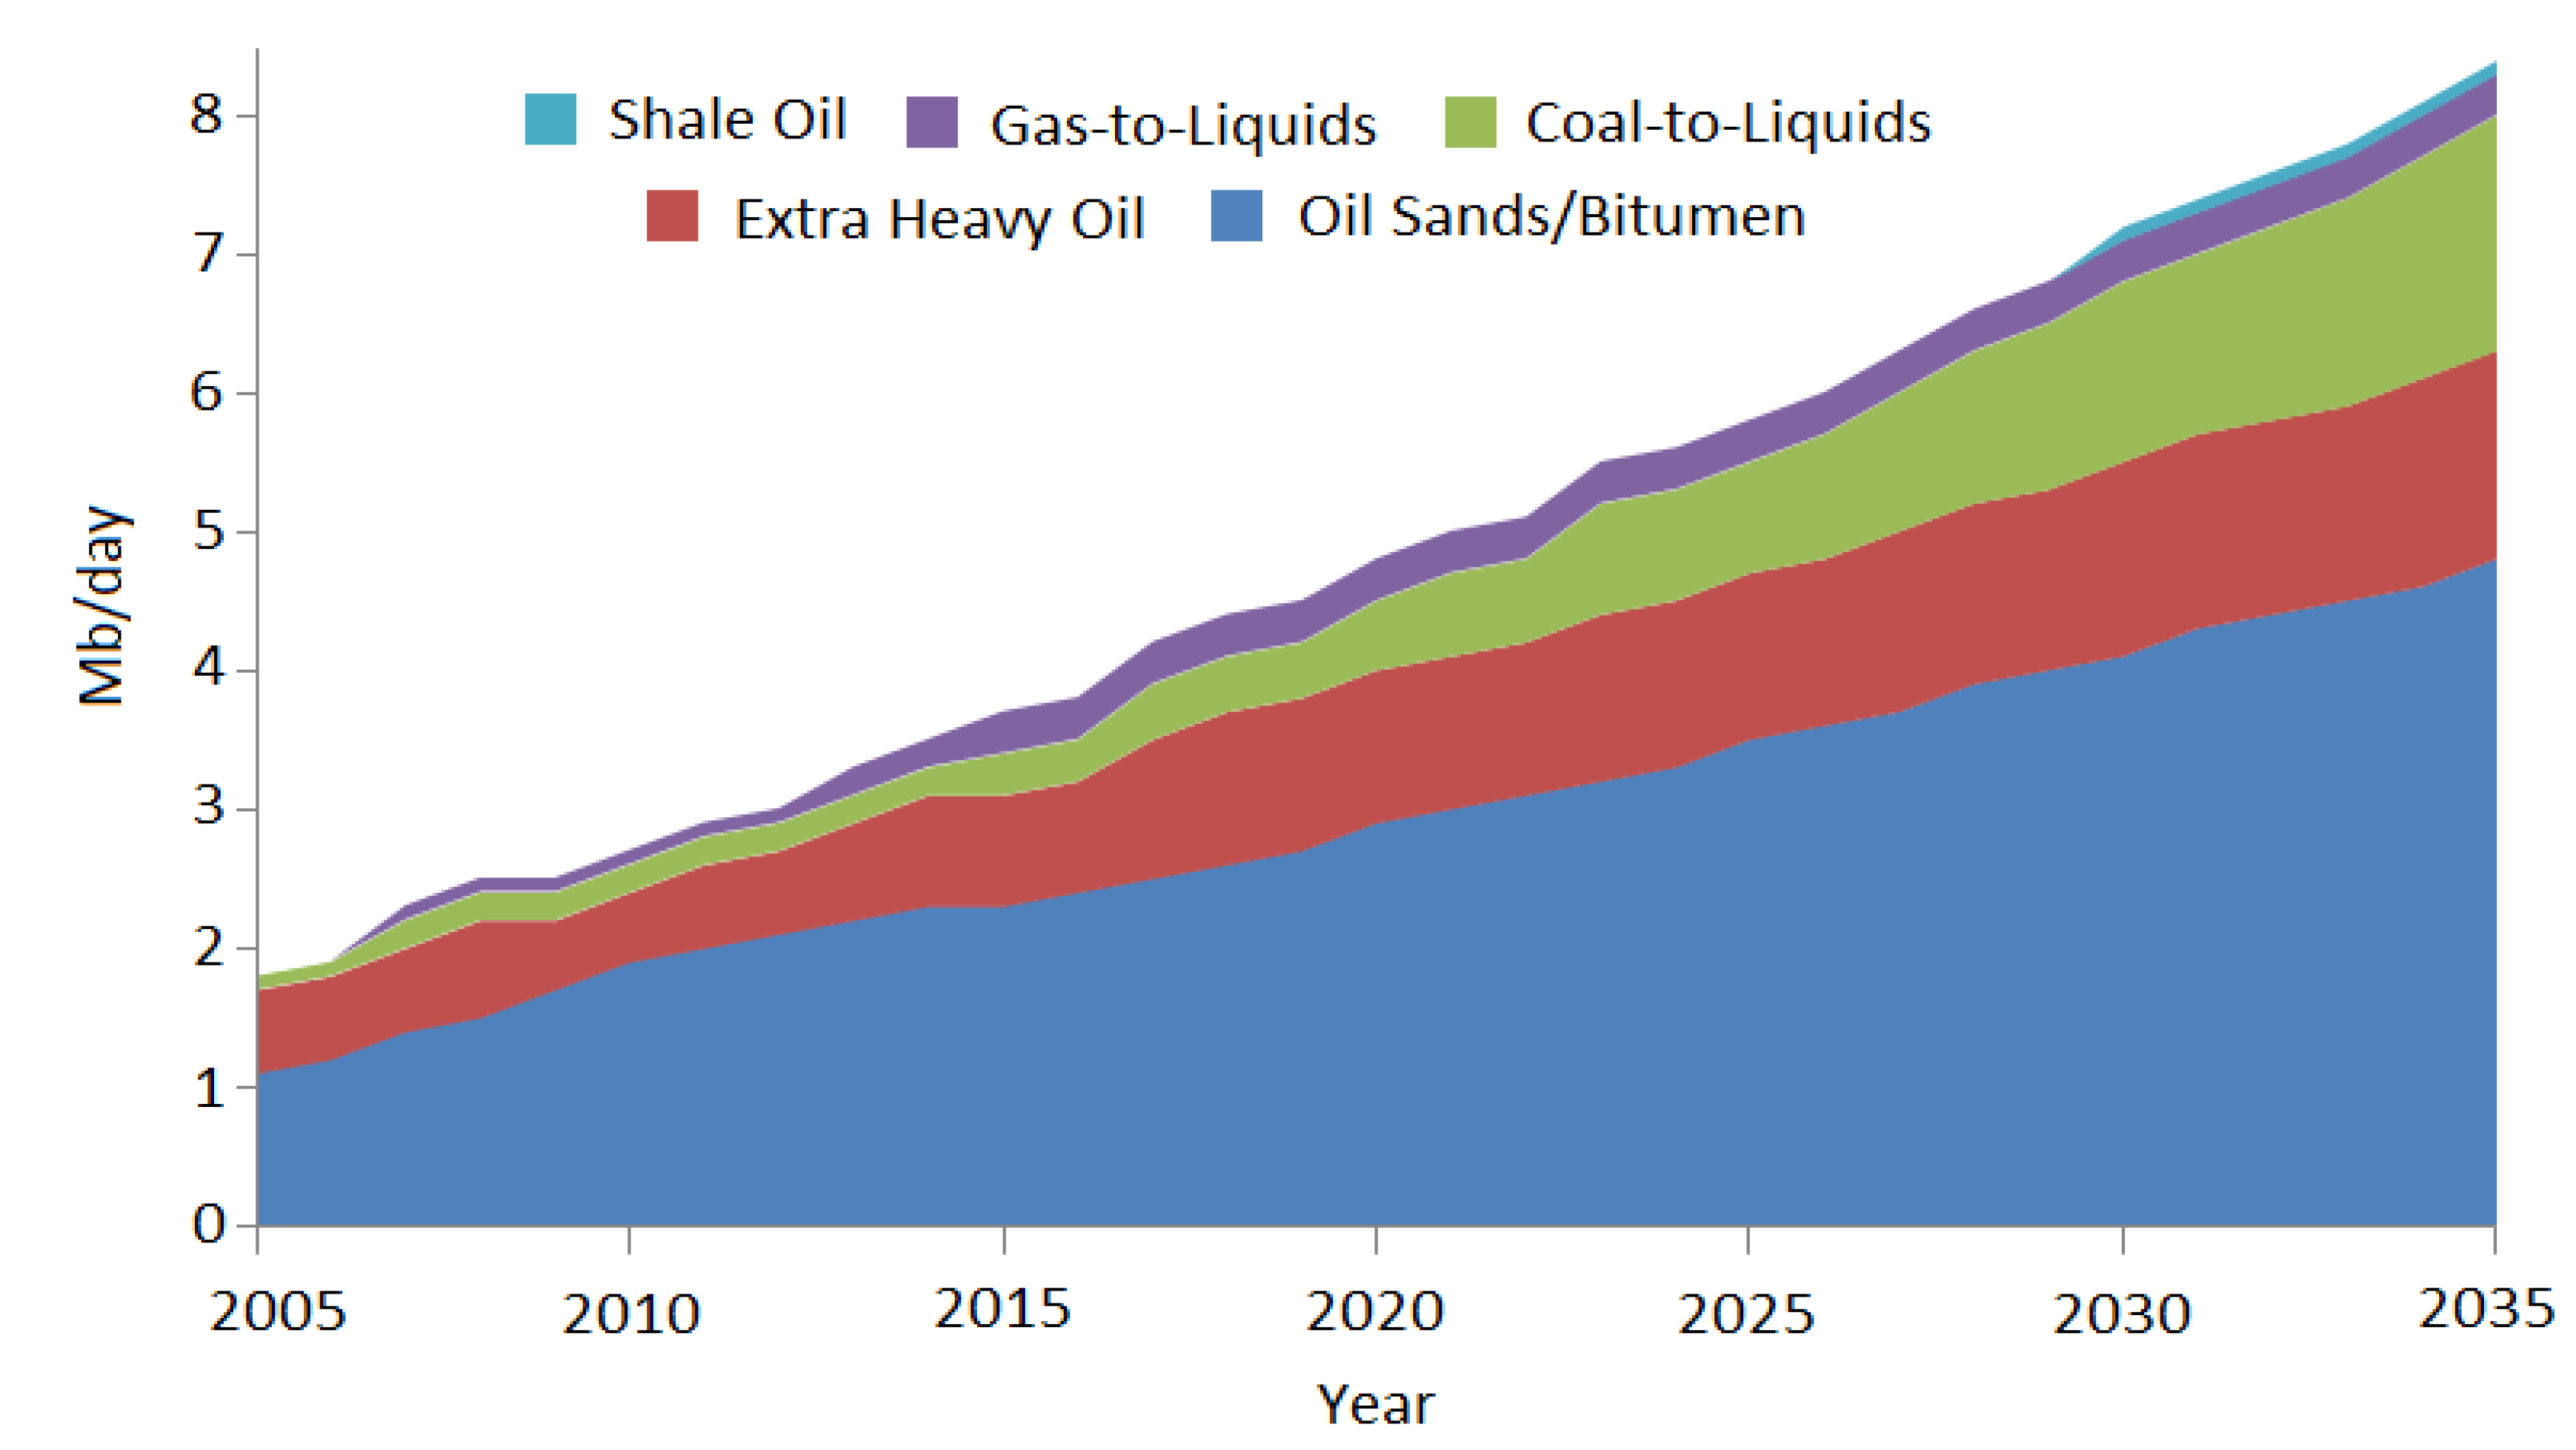
In general, the non-conventional liquid fuels including biofuels become more competitive under the high oil price scenario, which may result in decreasing demand for oil in the long run and eventually, diminishing its share in the global market share. However, the scenarios of rapid expansion of the non-conventional liquid fuel production might not be effective in the short-run as they require extensive institutional and technological change in transportation and industrial sectors [47,48]. Under the EIA’s reference scenario, the share of non-conventional liquid resources to the total liquid production will be increasing from 3% to 12% over the period of 2005–2035, implying the significant role of these resources in the global energy mix. However, the environmental impacts of producing energy from non-conventional liquid resources as well as the investment restrictions may become an obstacle to the further development of these sources, especially for the Canada’s oil sands and Venezuela’s extra-heavy oil projects.
Figure 13. Projected share of different energy sources in terms of liquid fuel production (Mb/day) and electricity generation capacity (EGC) (GW) by 2035 under EIA’s scenarios: (a) reference (R); (b) high oil price (HOP); (c) traditional high oil price (THOP); (d) low oil price (LOP); and (e) traditional low oil price (TLOP) (source of data: EIA [25]).
Energies 05 02626 g013
Figure 14. EIA’s projections of the world’s share of total oil production (TOP) and total energy production (TEP) under different scenarios: (a) reference (R); (b) high oil price (HOP); (c) traditional high oil price (THOP); (d) low oil price (LOP); and (e) traditional low oil price (TLOP) (Source of data: EIA [25]).
Energies 05 02626 g014
The dichotomous debate on the global energy outlook is replete with contrasting views to the perspectives of EIA, IEA, and OPEC regarding the global oil outlook [49,50,51]. A recent synthesis of peak oil production by Sorrell et al. [52] concludes that the peak of oil production is very likely to occur by 2030. Some researchers, in fact, caution that the world’s peak oil production may already have passed [53] or the production may be in a plateau state [48]. A direct link between the peak oil literature and the global energy outlook is the dire need for advancement of alternative energy sources along with institutional and infrastructural reforms in the global energy management. The high oil production scenarios are not compatible with the potential climate change mitigation policies. As was illustrated in Section 2, non-conventional liquid fuels and renewable energy sources are gaining increasing significance in the global energy mix, and transition from a fossil-fuel-based mix to a more balanced portfolio is only a matter of time. However, the existing interdependencies between an oil-dominated world and socio-economic and geopolitical stability are a critical fact, affecting the timeframe of the energy transition era [54,55]. Decisions of major oil producing organizations like OPEC can impact the timing and turbulence of the energy transition.

4. OPEC’s Oil Reserves and Production Capacity: Implications for Oil Security

OPEC’s ample energy resources provide an opportunity for employing stabilizing measures on the oil market. For instance, OPEC’s production restraints coupled with growing demand for oil resulted in a significant increase in oil price toward the end of 2010 [1]. 
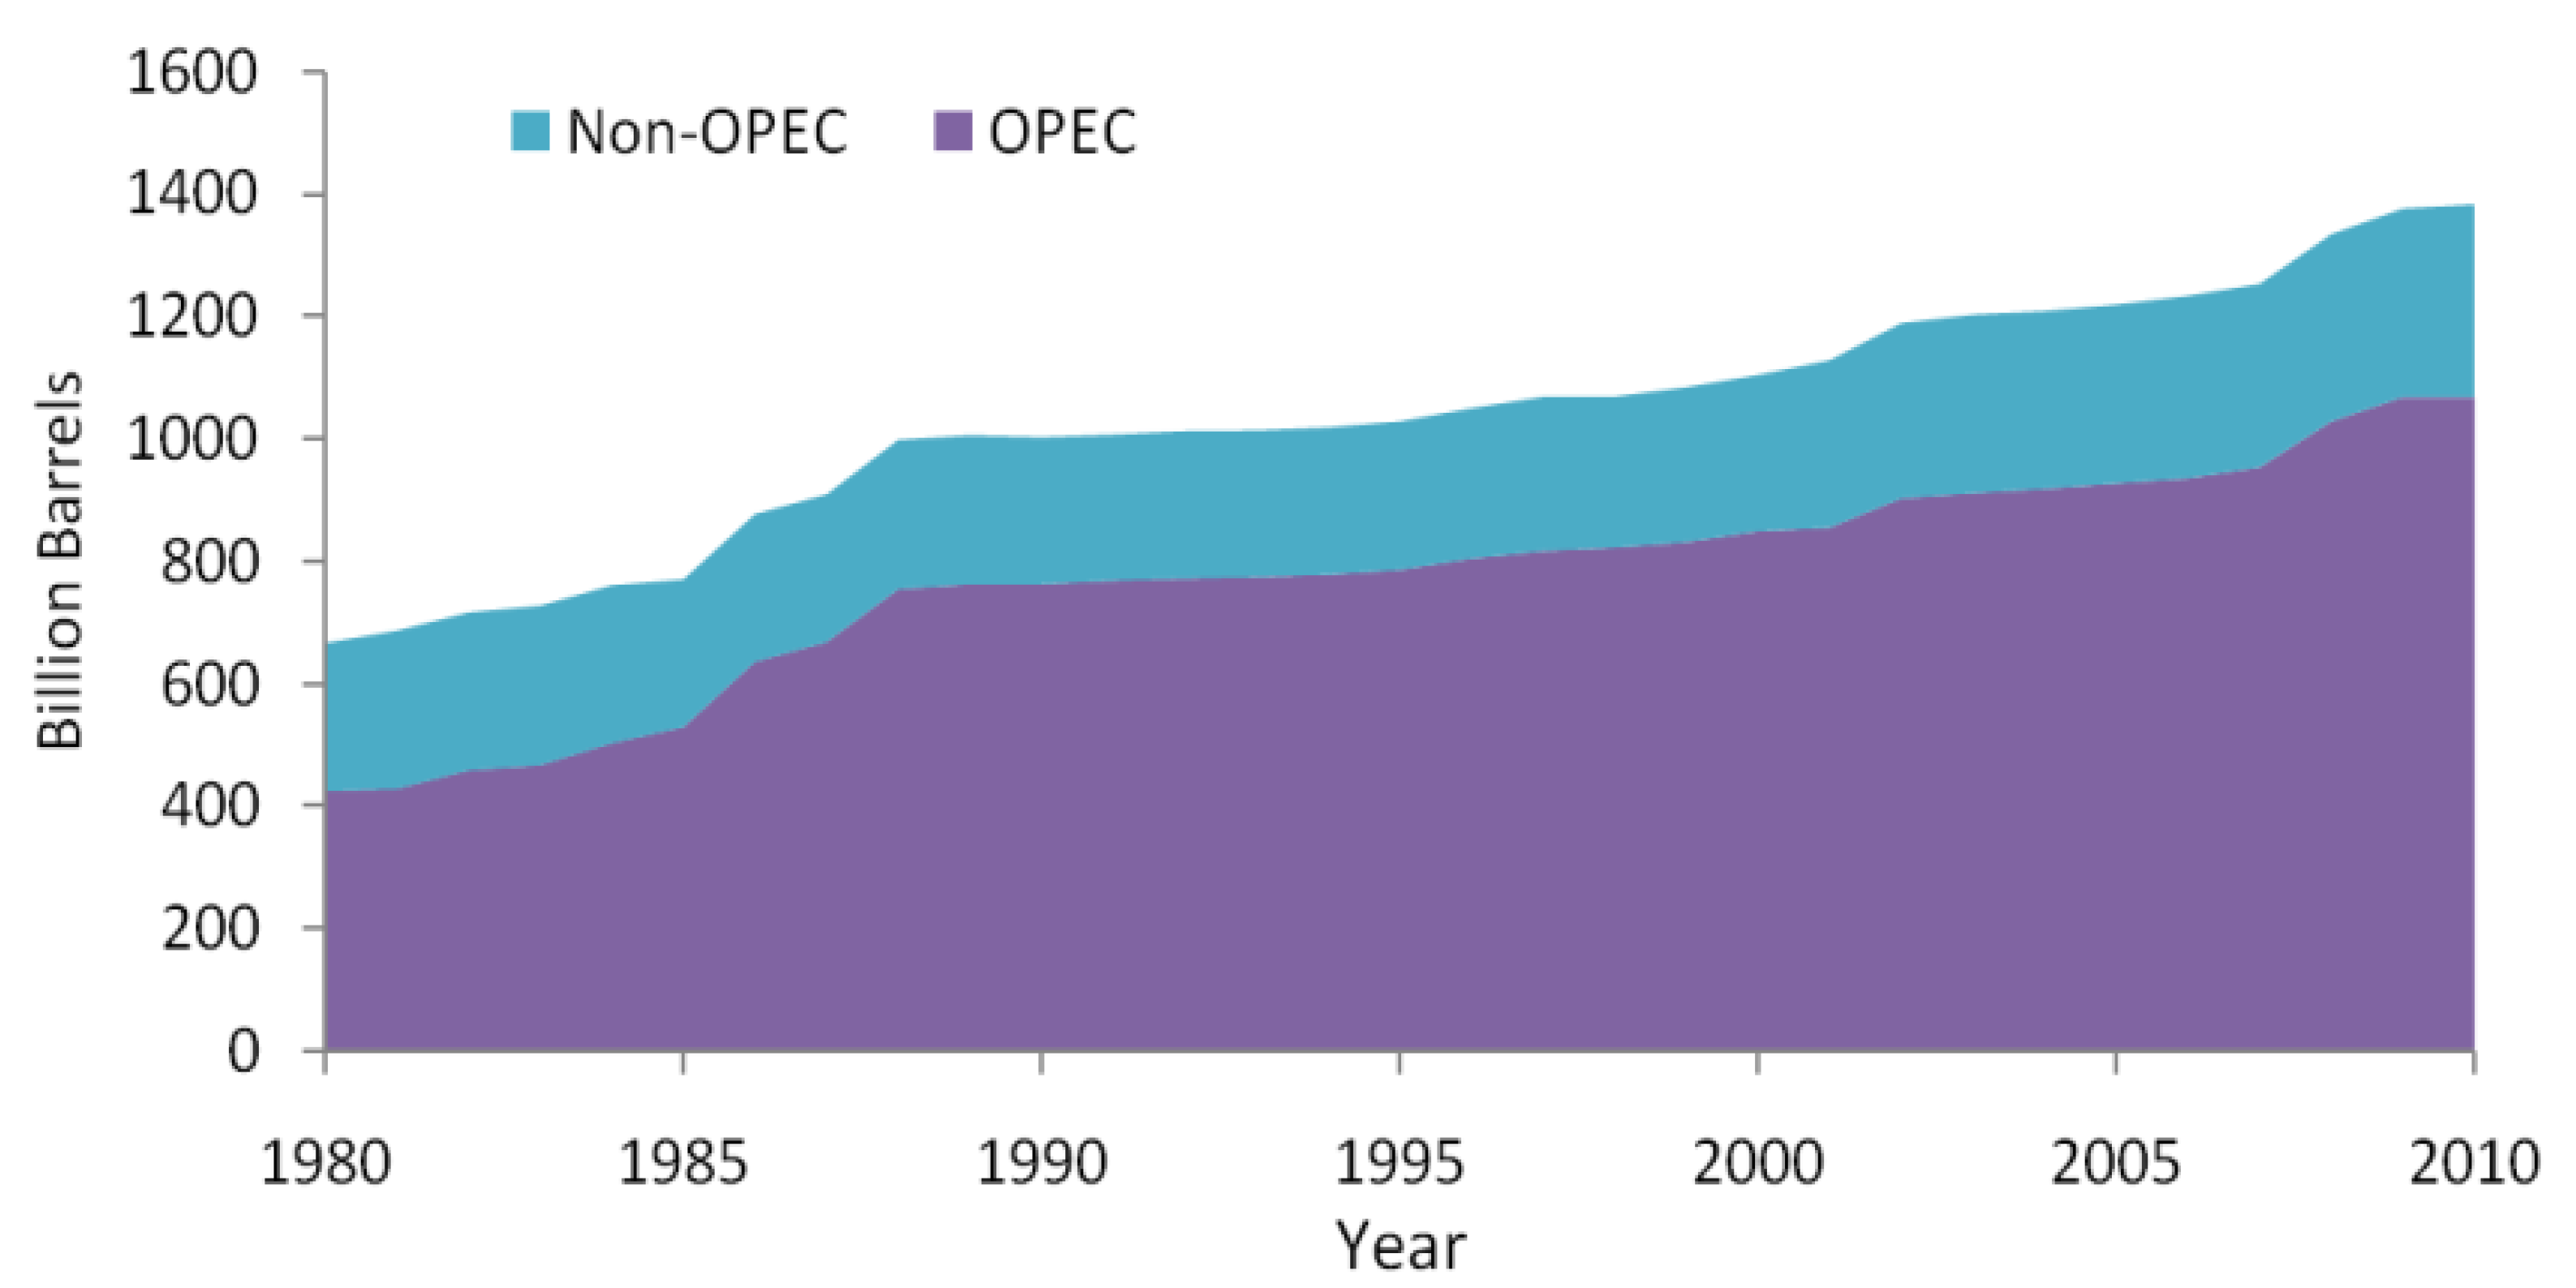
Figure 15 presents historical trend of OPEC and non-OPEC proven oil and NGL reserves using data from BP Statistical Review of World Energy [1]. This figure illustrates that OPEC member states collectively possess more than 80% of the world’s proven oil and NGL reserves. Also, Figure 15 shows that nearly all supply shocks are generated by OPEC’s production. Based on EIA’s reference scenario, OPEC’s oil production would need to be increased by about 25% over the current production levels if OPEC were to maintain its share in the global oil markets in 2030 [25]. In the current synthesis, we treat OPEC as one large energy producing unit, which will have a unified strategy about the global energy decisions. The intra-OPEC dynamics and disputes regarding the logistics of future oil production in response to increasing consumption are thus assumed to have marginal impact on OPEC’s production level as a whole. OPEC members’ investment in maintaining and/or expanding their oil infrastructure will be an indicator of which country will have the potential to act as the marginal supplier of the additional oil, which has important implications for the global energy security given the geopolitical volatility of the Middle East.
Figure 15. Historical trend of OPEC and non-OPEC proven oil and NGL reserves (Source of data: BP [1]).
Energies 05 02626 g015
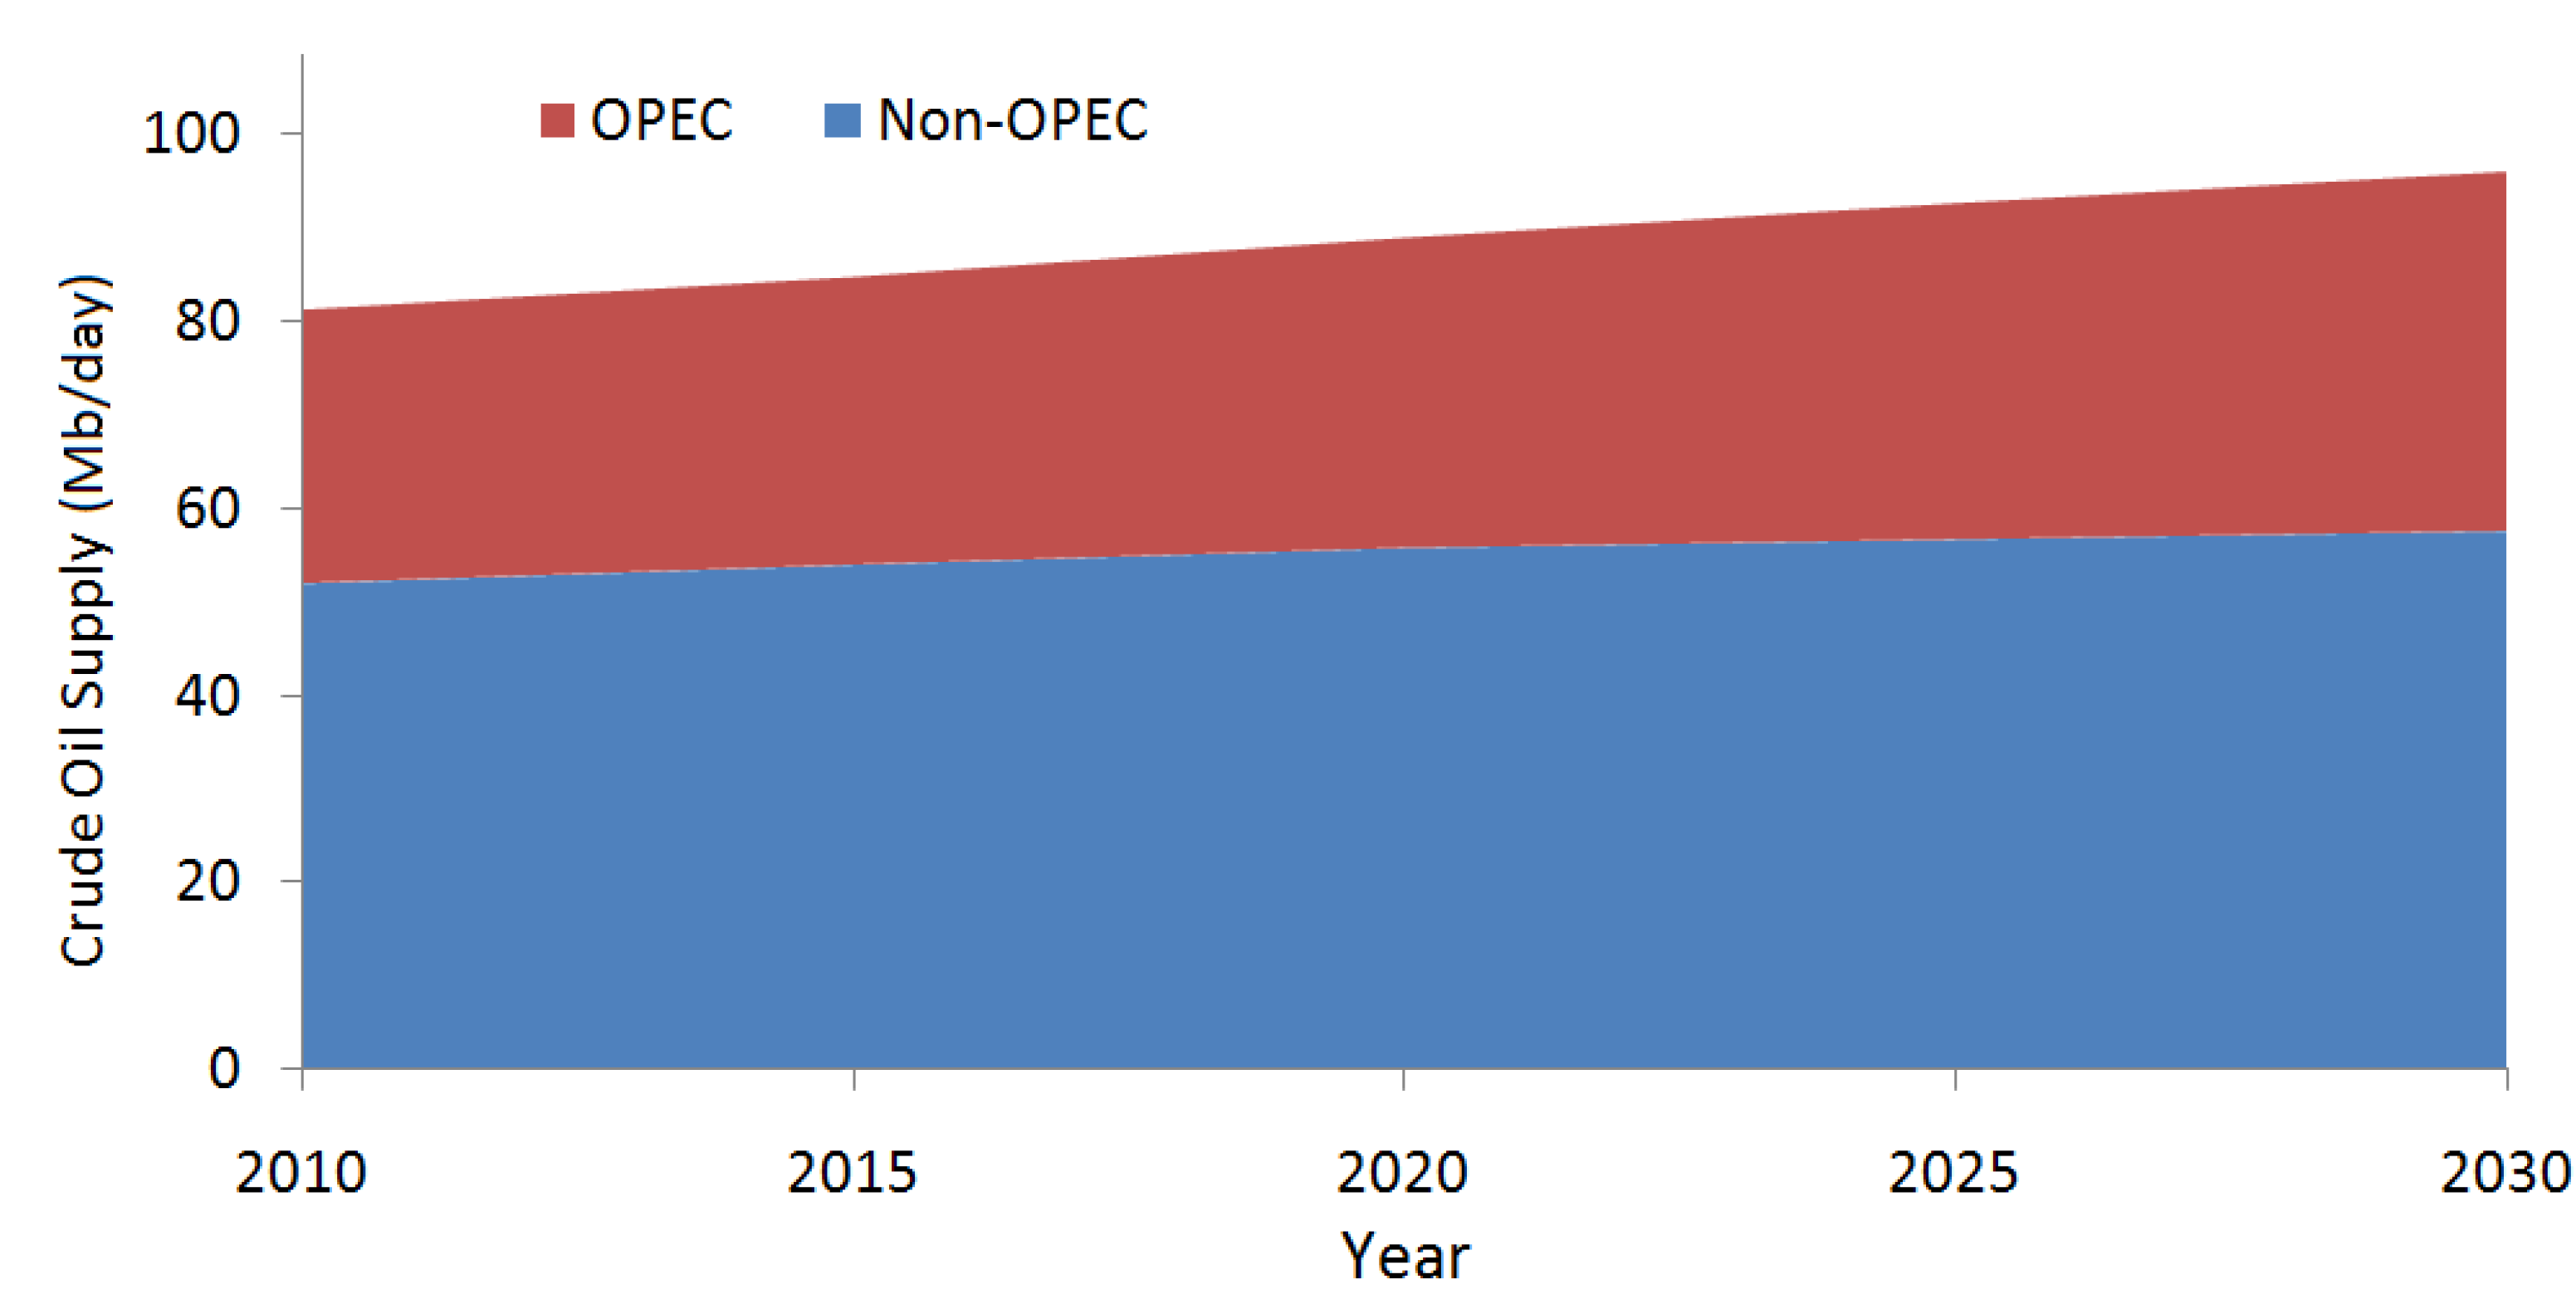
OPEC has extensive potentials to help meet the rising global oil demand by 2030. Figure 16 shows the OPEC and non-OPEC projected contributions to global oil markets [19]. The global demand for oil may rise from over 80 Mb/day to approximately 105 Mb/day by 2030. The economic recovery following the recent global economic recession will potentially create a heightened growth in oil demand in the medium-term. In the long-run, throughout the period of 2010–2030, the net average annual oil demand is expected to increase by about 0.9% annually due to significant growth in demand from rapidly expanding economies such as China and India, which will likely compensate for declining oil demand from member countries of OECD.
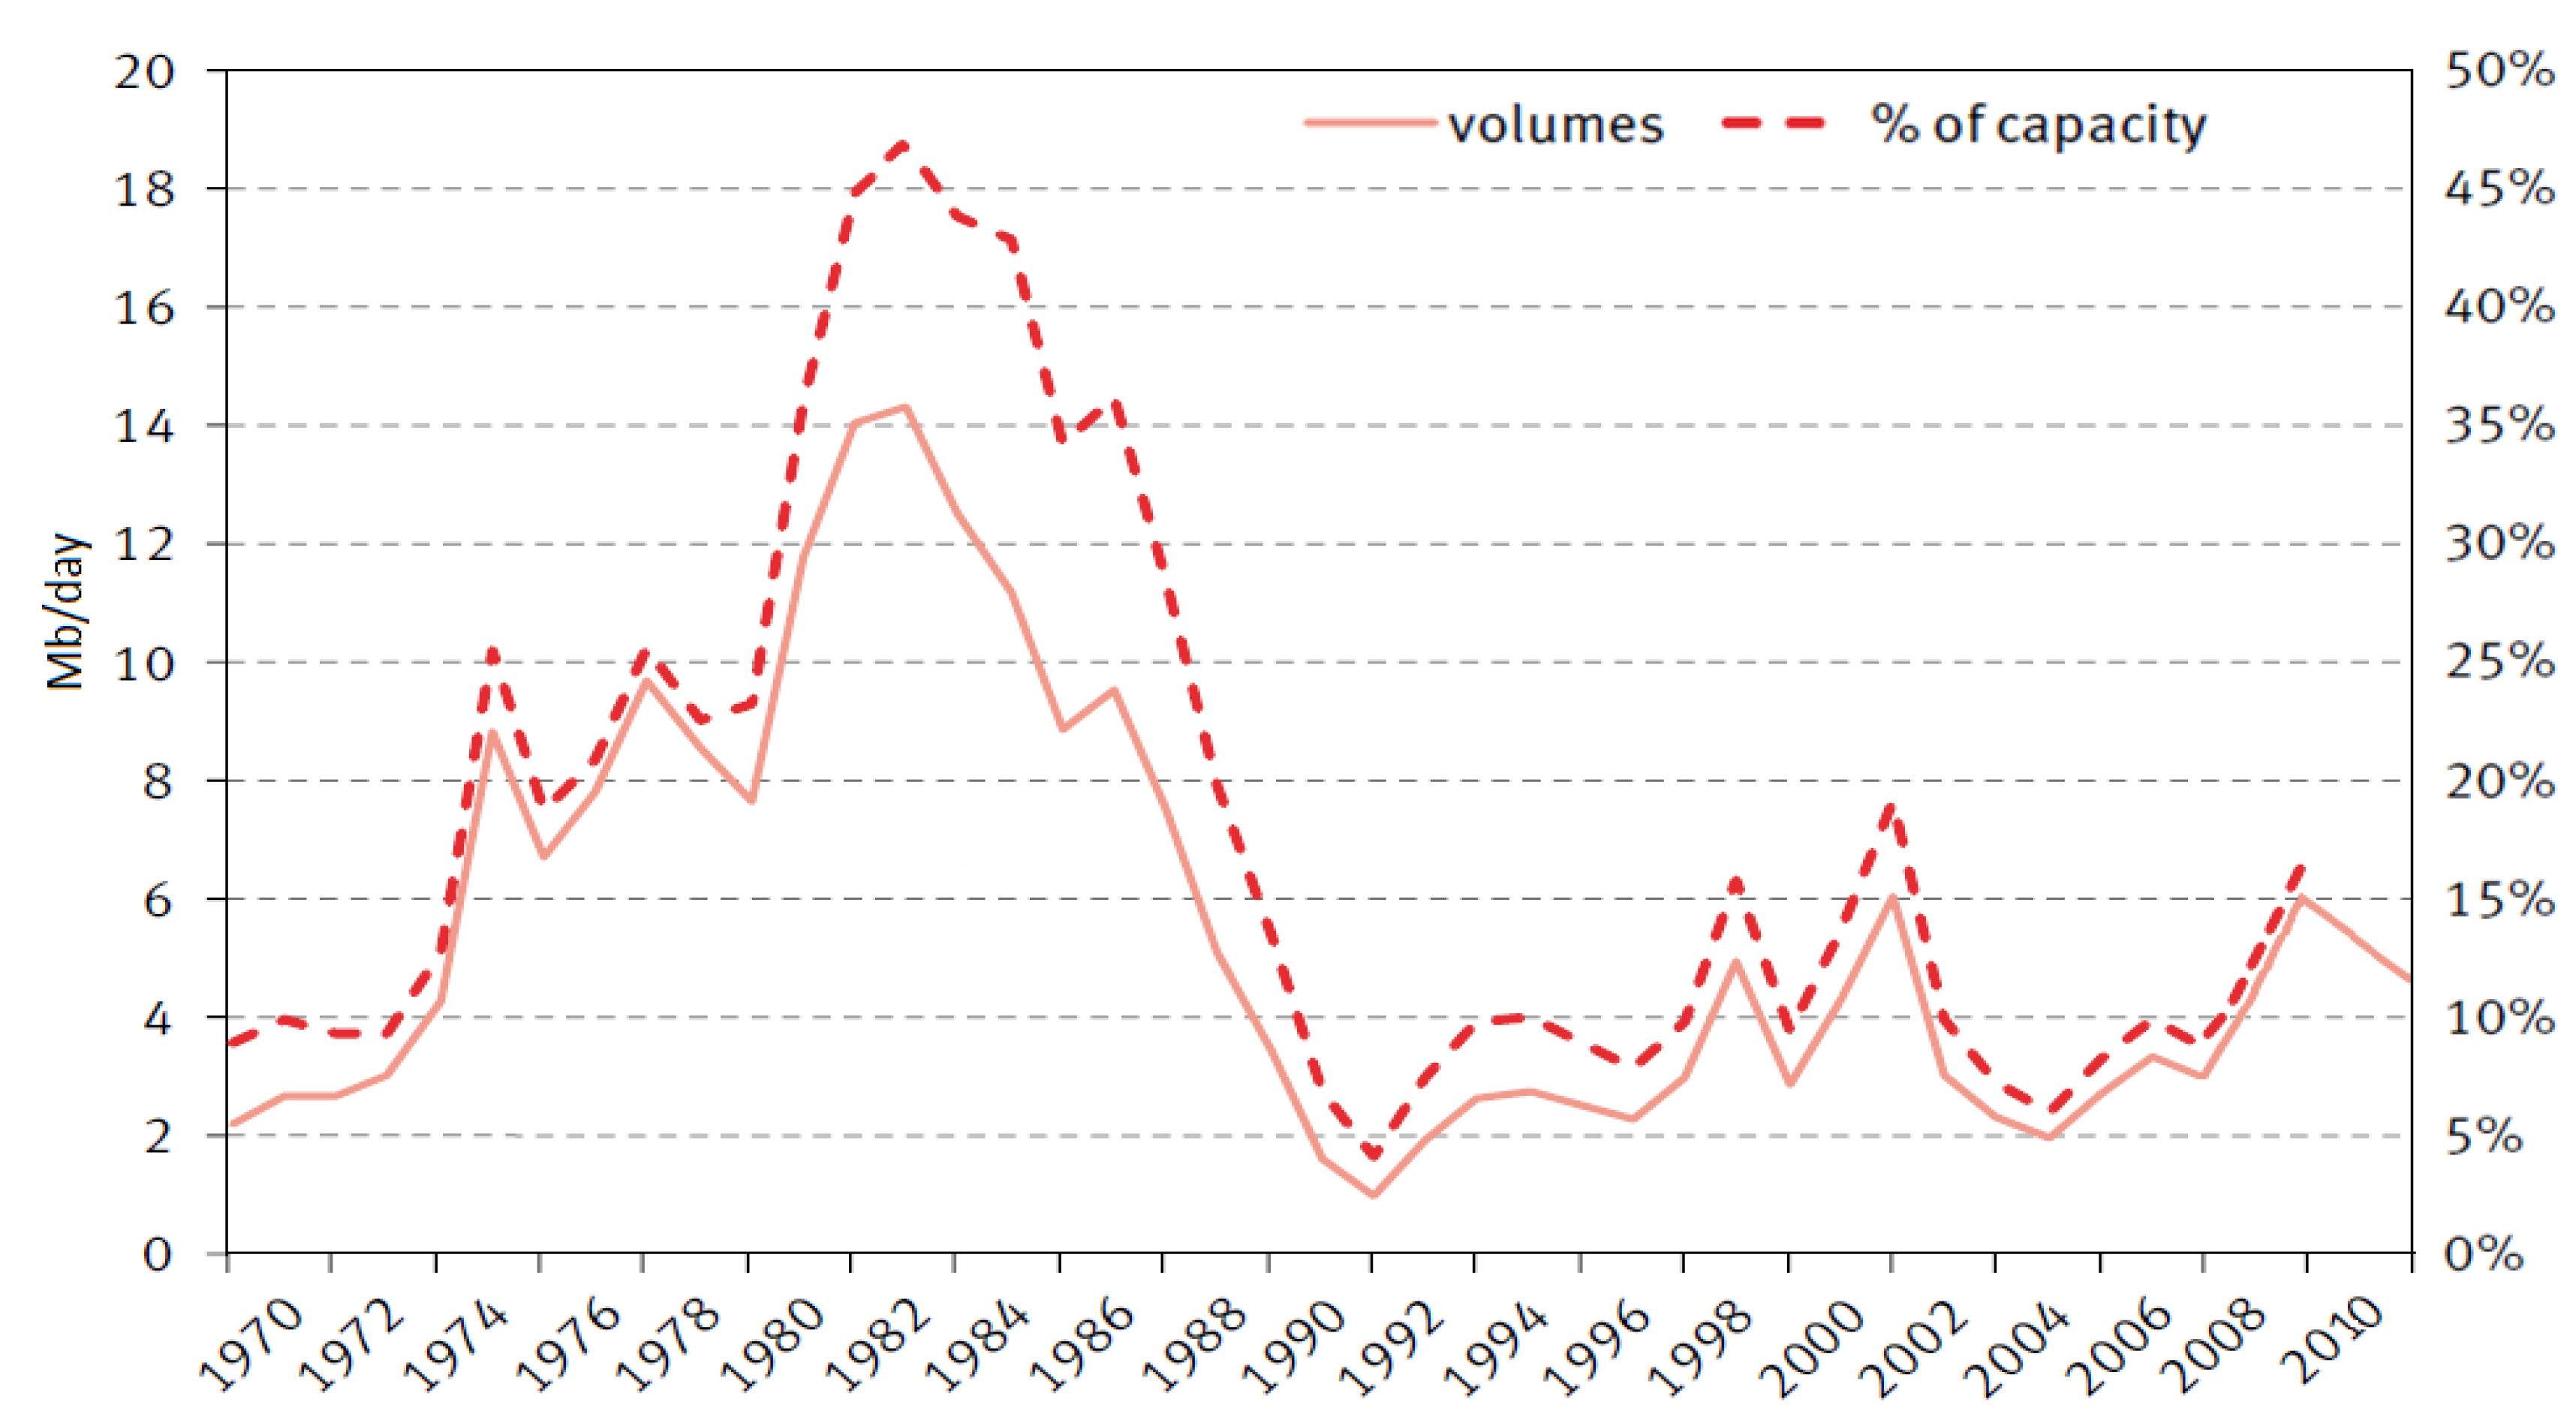
Projected trends of energy demand provide insights into oil supply management and production capacity expansion, which can guide capital investments in oil and NGL sectors. Figure 17 shows OPEC’s spare production capacity over the past four decades. The figure displays historical trends of production and spare production capacity. It is worth noting that the largest discrepancy between OPEC’s oil production and available production capacity occurred in early 1980s, when OPEC was unable to use approximately half of its available production capacity. This was an artifact of over-investment in capacity expansion coupled with declining global oil demand, likely due to the price increase associated with the Iran-Iraq war [21,22].
Figure 16. OPEC and non-OPEC crude oil supply by 2030 (Source of data: OPEC [19]).
Energies 05 02626 g016
Figure 17. OPEC’s spare production capacity (Source: OPEC World Oil Outlook© OPEC Secretariat, 2010, p. 140 [46], data for 2010 and 2011 from OPEC, 2011 [56]).
Energies 05 02626 g017
OPEC’s current and projected medium-term crude oil production capacity and supply are shown in Figure 18. The figure illustrates that in medium-term OPEC can take advantage of spare crude oil production capacity to help meet the rising demand while stabilizing the price. The figure also portrays OPEC’s potential production capacity growth over the period of 2009–2014. The critical importance of retaining reasonable spare capacity was manifested in the 2000’s when economic recovery after the global financial crisis drove an increase in the oil demand by more than 20% between 2002 and 2008 during which time OPEC’s spare capacity fell to about 3 Mb/day. In order for OPEC to maintain its key role in global fossil fuel supply system, as a reliable producer, it is necessary to expand production capacity at rates comparable to increase in global oil and NGL demand–a task that is inherently subject to great uncertainties such as potential geopolitical instabilities, investment risks, and future prices, among others.
Figure 18. OPEC’s medium-term crude oil capacity and supply (source: OPEC World Oil Outlook© OPEC Secretariat, 2010, p. 70 [46]).
Energies 05 02626 g018
As the world approaches the peak of oil production, the energy management sectors and political governments will need to choose between non-cooperative and cooperative management strategies. The global oil market is characterized by interaction of international competition and cooperation that can jeopardize or improve energy security in the face of a terminal decline in oil production. Individual countries will react differently to the problem of the global oil peak.
Friedrichs [57] synthesized historical evidences to hypothesize that while some countries will adopt socio-economic adaptation to alleviate peak oil crisis, others may practice predatory militarism or totalitarian retrenchment. Overly large price fluctuations in the past have triggered detrimental economic instability affecting nearly all stakeholders, signifying the need for appropriate mechanisms to avoid price swings [58]. If the future looks like the past, OPEC will not only maintain its importance as a key player in the global energy market, but it may also gain further significance due to increasing demand in the face of limited resources. It follows from this argument that if a serious and practical action plan to facilitate the energy transition is not employed in the lead time before the pinnacle of the energy crisis, the transition era will be a long and tortuous path, and the realization of a unified front to mitigate climate change will only be pushed further into the future.
OPEC’s future production and supply strategies will depend on which global energy outlook scenario unfolds. From a historical standpoint, OPEC has used two main strategies to influence global energy prices, i.e., “shutting in” available production capacity, and growth restriction by limiting capacity development in terms of infrastructure and resource exploration [59]. The noted strategies have been aimed mostly at maintaining high prices to the extent that OPEC has been described by some as a bureaucratic oil cartel [60]. If the EIA’s low oil price and traditional low oil price scenarios happen, OPEC will become the dominant oil supplier to the global markets by 2035 (Figure 14f). However, the accuracy of the reported OPEC reserves has been questioned as these reserves have been increasing significantly over time without reflecting changes due to continuous production [61].
Whether OPEC’s reserves are indeed overstated or not cannot be corroborated externally. That being said, our current synthesis of world energy outlook suggests that, in the long-run, OPEC may shift its strategies towards intensifying the development of infrastructural capacity. This strategy shift will occur either willingly and deliberately due to increased demand, or it will happen unwillingly and mandatorily to avoid potential loss of market share to alternative energies. It has been estimated that a sustained annual growth of about 10% would be needed for the non-conventional liquid fuels to attenuate the peak oil [62]. The additional capacity will allow OPEC to increase the oil supply in order to push the oil prices to lower equilibrium prices to make the non-conventional liquid fuels and alternative renewables less competitive. The low oil price strategy may pose physical risks to the global energy supply as rapid post-peak decline rates may make it difficult for non-conventional sources to come on-stream in significant capacity in a timely fashion.
On the other hand, OPEC can contribute to market stability and energy security by promoting constructive communication with major oil consumers, as well as by collaboration with producers of renewable energies to identify the least turbulent paths for global energy transition while finding opportunities to minimize global socio-economic consequences [46,63]. As global demand for oil increases in medium- and long-terms, the world’s reliance on OPEC’s proven reserves and production capacity is expected to increase [7]. In the absence of strategic reasons (e.g., competition with non-conventional liquid fuels and renewables), it would be plausible to envision that OPEC’s crude oil supply will grow moderately, decreasing the effectiveness of the GHG reduction efforts. In fact, OPEC estimates upstream investment requirements, excluding additional infrastructure, to be approximately $575 billion in 2009 U.S. dollars [46]. The profitability of oil investments will depend largely on timing of investments and security of demand, as well as dynamics of market share for other sources of energy.
While climate change mitigation policies such as carbon tax and/or pricing, and R&D investment in renewable energy development can increase the long-term energy security for oil-importing countries, these policies can dramatically reduce the demand for fossil fuels which will reduce the vital revenues for oil-exporting countries. Furthermore, the dependency of the existing economies in the developed world on fossil fuels is a barrier to an abrupt shift to renewable energy sources as the renewables mostly contribute to the energy production in the form of electricity, while transportation and industrial sectors are highly dependent on the fossil fuels, especially on oil. As such, the global energy policy to mitigate climate change can significantly impact the industry and stability of energy markets [64,65], which may be part of the reason why the political powers are seemingly lethargic in reaching a global consensus to facilitate the energy transition and adoption of aggressive climate warming mitigation policies.

5. Caveats

The above discussions of OPEC’s oil production strategies apply to the period prior to and during the peak of oil production when OPEC will attempt to prolong its dominance over the global primary energy mix. A number of issues remain unaddressed, which can provide direction for future research to improve understanding of the complexities of the energy transition era, generating insights for timely adaptation and cooperative solutions. Our synthesis of the global energy outlook and energy security does not go beyond an overview of low oil production and peak oil projections. The potential significant decline in the oil production due to the effects of aggressive global policies for mitigating climate change and shifting to cleaner energies is an important issue that deserves further investigations. Moreover, the end of oil age may ultimately entail large depletion rates and significant declines in demand due to a chaotic oil market before a more balanced energy mix is realized. It is timely and important to investigate the consequences of a crash in oil demand after peak oil production and the implications thereof for the global energy security. In much the same way, it is necessary to characterize the impacts of the declining oil revenues on stability of oil-exporting countries, as well as on functionality of the socio-economic processes in the oil-importing nations. Of particular interest would be to modify the assumption of OPEC’s unified oil production strategy as one major oil producing unit, and to analyze the potential impacts of internal conflicts within OPEC.

6. Conclusions

The global energy portfolio comprises a mix of well-established non-renewable fossil fuels, nuclear energy, and rapidly growing renewable energies. The primary energy consumption is currently dominated by fossil fuels, especially by oil. The present synthesis of the world energy balance outlook suggests that, under current policies and legislations, i.e., if historical energy production and consumption trends hold into the future, the world will continue to rely on fossil fuels as the main source of meeting its primary energy needs by 2030. The world should be increasingly concerned about the implications and consequences of an oil-dominated future for the global energy security and efforts to mitigate climate warming. The decisions as to timing and extent of capacity expansion, as well as profitability of future oil production and trade are subject to substantial uncertainty. The transition to alternative energy sources is ultimately inevitable due to physical resource limits coupled with the need for enforcement of stringent low GHG energy policies, as well as potential geopolitical instabilities, constraining the global supply and competitiveness of oil.
OPEC has the potential to dominate the global oil market in the next a few decades, enabling this organization to facilitate or hinder the energy transition policies. This will also allow OPEC to play a key role in the global energy security through cooperative or non-cooperative strategies. OPEC’s supply strategies and production levels can impact the price of oil, which can affect the timing and manner in which the transition will occur. OPEC can utilize its spare crude oil production capacity to help meet the rising demand while stabilizing the price in medium-term. In the long-run, sufficient capital-investment to expand oil production capacity can temporarily improve the global energy security at the expense of exacerbating the global warming. In order to maintain its share in the global energy markets, OPEC may adopt a non-cooperative strategy by driving market prices to lower levels to make the energy production from other sources less competitive. Alternatively, OPEC can contribute to market stability and energy security through a cooperative portfolio management approach that takes advantage of constructive communication with major oil consumers and producers of renewable energies. This approach can help identify opportunities for stabilizing the oil market and contributing to a less turbulent energy transition path, which can benefit all parties through facilitating adaptation to the impending energy crisis within the available lead time.

Acknowledgement

The authors are grateful to three anonymous reviewers for their constructive and insightful comments.

References

  1. British Petroleum (BP). BP Statistical Review of World Energy 2011; BP: London, UK, 2011; Available online: http://www.bp.com/sectionbodycopy.do?categoryId=7500&contentId =7068481 (accessed on 27 October 2011).
  2. Jacobsson, S.; Johnson, A. The diffusion of renewable energy technology: An analytical framework and key issues for research. Energy Policy 2000, 28, 625–640. [Google Scholar] [CrossRef]
  3. World Energy Council (WEC). 2010 Survey of Energy Resources; WEC: London, UK, 2010; Available online: http://www.worldenergy.org/publications/3040.asp (accessed on 5 September 2011).
  4. Höök, M.; Li, J.; Johansson, K.; Snowden, S. Growth rates of global energy systems and future outlooks. Nat. Resour. Res. 2012, 21, 21–41. [Google Scholar] [CrossRef]
  5. International Energy Agency (IEA). 2010 Key World Energy Statistics; IEA: Paris, France, 2010. [Google Scholar]
  6. International Energy Agency (IEA). World Energy Outlook 2004; IEA: Paris, France, 2004; Available online: http://www.worldenergyoutlook.org/media/weowebsite/2008-1994/WEO2004.pdf (accessed on 23 October 2011).
  7. International Energy Agency (IEA). World Energy Outlook 2007; IEA: Paris, France, 2007; Available online: http://www.worldenergyoutlook.org/media/weowebsite/2008-1994/WEO_2007.pdf (accessed on 16 January 2012).
  8. International Energy Agency (IEA). World Energy Outlook 2009; IEA: Paris, France, 2009; Available online: http://www.worldenergyoutlook.org/media/weowebsite/2009/WEO2009.pdf (accessed on 23 October 2011).
  9. Turner, J.A. A realizable renewable energy future. Science 1999, 285, 687–689. [Google Scholar] [CrossRef] [PubMed]
  10. Puppán, D. Environmental evaluation of biofuels. Period. Polytech. Soc. Manag. Sci. 2002, 10, 95–116. [Google Scholar]
  11. Searchinger, T.; Heimlich, R.; Houghton, R.A.; Dong, F.; Elobeid, A.; Fabiosa, J.; Tokgoz, S.; Hayes, D.; Yu, T.-H. Use of U.S. croplands for biofuels increases greenhouse gases through emissions from land-use change. Science 2008, 319, 1238–1240. [Google Scholar] [CrossRef] [PubMed]
  12. Madani, K.; Rouhani, O.M.; Pournazeri, S.; Moradi, M.; Sheikhmohammady, M. Can We Rely on Renewable Energy Sources to Overcome Global Warming? In Proceedings of the 2011 World Environmental and Water Resources Congress, ASCE, Palm Springs, CA, USA, 22–26 May 2011; pp. 3319–3326.
  13. Hadian, S.; Madani, K.; Rowney, C.; Mokhtari, S. Toward More Efficient Global Warming Policy Solutions: The Necessity for Multi-Criteria Selection of Energy Sources. In Proceedings of the 2012 World Environmental and Water Resources Congress, ASCE, Albuquerque, NM, USA, 22–26 May 2011; pp. 2884–2892.
  14. Owen, A.D. Renewable energy: Externality costs as market barriers. Energy Policy 2006, 34, 632–642. [Google Scholar] [CrossRef]
  15. Cosijns, L.; D’haeseleer, W. European Sustainable Electricity: Comprehensive Analysis of Future European Demand and Generation of European Electricity and its Security of Supply. Final Technical Report. 2007. Available online: http://www.EUSUSTEL.be (accessed on 26 June 2011).
  16. Morone, J.G.; Woodhouse, E.J. The Demise of Nuclear Energy? Lessons for Democratic Control of Technology; Yale University Press: New Haven, CT, USA, 1989. [Google Scholar]
  17. International Energy Agency (IEA). World Energy Outlook 2008; IEA: Paris, France, 2008; Available online: http://www.worldenergyoutlook.org/media/weowebsite/2008-1994/WEO2008.pdf (accessed on 26 October 2011).
  18. Jorant, C. The implications of Fukushima: The European perspective. Bull. Atomic Sci. 2011, 67, 14–17. [Google Scholar] [CrossRef]
  19. Organization of the Petroleum Exporting Countries (OPEC). OPEC Annual Statistical Bulletin, 2010/2011 Edition; OPEC: Vienna, Austria, 2010; ISSN 0475-0608; Available online: http://www.opec.org/opec_web/en/publications/202.htm (accessed on 20 October 2011).
  20. Greene, D.L. Measuring energy security: Can the United States achieve oil independence? Energy Policy 2010, 38, 1614–1621. [Google Scholar] [CrossRef]
  21. WTRG Economics Homepage. Available online: http://www.wtrg.com/prices.htm (accessed on 21 March 2011).
  22. Borenstein, S. Cost, Conflict and Climate: U.S. Challenges in the World Oil Market. Center for the Study of Energy Markets Working Paper No. 177. 2008. Available online: http://www.ucei.berkeley.edu/PDF/csemwp177.pdf (accessed on 10 October 2011).
  23. Brandt, A.R. Testing Hubbert. Energy Policy 2007, 35, 3074–3088. [Google Scholar] [CrossRef]
  24. Carlson, W.B. World oil production via Hubbert Linearization of production and normalizations of production. Energy Sources Part B Econ. Plan. Policy 2012, 7, 162–168. [Google Scholar] [CrossRef]
  25. U.S. Energy Information Administration (EIA). International Energy Outlook 2011; EIA: Washington, DC, USA, 2011. Available online: http://www.eia.gov/oiaf/aeo/tablebrowser/ (accessed on 26 May 2012).
  26. International Energy Agency (IEA). World Energy Outlook 2010; IEA: Paris, France, 2010; Available online: http://www.worldenergyoutlook.org/media/weo2010.pdf (accessed on 26 January 2012).
  27. Böhringer, C.; Rosendahl, K.E. Green Serves the Dirtiest: On the Interaction between Black and Green Quotas; Discussion Paper No. 581; Statistics Norway, Research Department: Oslo, Norway, 2009; Available online: http://www.ssb.no/publikasjoner/pdf/dp581.pdf (accessed on 25 September 2011).
  28. Deutch, J.; Moniz, E.; Ansolabehere, S.; Driscoll, M.; Gray, P.; Holdren, J.; Joskow, P.; Lester, R.; Todreas, N. Update of the MIT 2003 Future of Nuclear Power: An MIT Interdisciplinary Study; Massachusetts Institute of Technology: Cambridge, MA, USA, 2009; Available online: http://web.mit.edu/nuclearpower/ (accessed on 22 May 2012).
  29. Duffey, R.B. Sustainable futures using nuclear energy. Prog. Nuclear Energy 2005, 47, 535–543. [Google Scholar] [CrossRef]
  30. Vaillancourt, K.; Labriet, M.; Loulou, R.; Waaub, J.P. The role of nuclear energy in long-term climate scenarios: An analysis with the world-times model. Energy Policy 2008, 36, 2296–2307. [Google Scholar] [CrossRef]
  31. International Energy Agency (IEA). World Energy Outlook 2006; IEAL: Paris, France, 2006; Available online: http://www.worldenergyoutlook.org/media/weowebsite/2008-1994/WEO2006.pdf (accessed on 29 October 2011).
  32. Roques, F.; Newbery, D.; Nuttall, W.; de Neufville, R.; Connors, S. Nuclear power: A hedge against uncertain gas and carbon prices? Available online: http://www.dspace.cam.ac.uk/bitstream/1810/131607/1/eprg0509.pdf (accessed on 25 July 2012).
  33. Madani, K.; Lund, J.R. Modeling California’s high-elevation hydropower systems in energy units. Water Resour. Res. 2009, 45. [Google Scholar] [CrossRef]
  34. McKendry, P. Energy production from biomass (part 1): Overview of biomass. Bioresour. Technol. 2002, 83, 37–46. [Google Scholar] [CrossRef] [PubMed]
  35. Kløverpris, J.; Wenzel, H.; Nielsen, P.H. Life cycle inventory modelling of land induced by crop consumption. Part 1: Conceptual analysis and methodological proposal. Int. J. Life Cycle Assess. 2008, 13, 13–21. [Google Scholar]
  36. Gerbens-Leenes, P.W.; Hoekstra, A.Y.; van der Meer, T. The water footprint of energy from biomass: A quantitative assessment and consequences of an increasing share of bio-energy in energy supply. Ecol. Econ. 2009, 68, 1052–1060. [Google Scholar] [CrossRef]
  37. Bartle, J.R.; Abadi, A. Toward sustainable production of second generation bioenergy feedstocks. Energy Fuels 2010, 24, 2–9. [Google Scholar] [CrossRef]
  38. Kim, S.; Dale, B.; Jenkins, R. Life cycle assessment of corn grain and corn stover in the United States. Int. J. Life Cycle Assess. 2009, 14, 160–174. [Google Scholar] [CrossRef]
  39. Archer, C.L.; Jacobson, M.Z. Evaluation of global wind power. J. Geophys. Res. 2005, 110. [Google Scholar] [CrossRef]
  40. Reuters. Germany Sets New Solar Power Record, Institute Says. Available online: http://www.reuters.com/article/2012/05/26/us-climate-germany-solar-idUSBRE84P0FI20120526 (accessed on 9 June 2012).
  41. International Energy Agency (IEA). Trends in Photovoltaic Applications: Survey Report of Selected IEA Countries between 1992 and 2010; Photovoltaic Power Systems Program, IEA: Paris, France, 2011. [Google Scholar]
  42. Bentley, R.W.; Miller, R.G.; Wheeler, S.; Boyle, G. Comparison of Global Oil Supply Forecasts. In UKERC Review of Evidence on Global Oil Depletion; Technical Report 7; UK Energy Research Centre: London, UK, 2009. [Google Scholar]
  43. Sorrell, S.; Speirs, J.; Bentley, R.; Miller, R.; Thompson, E. Shaping the global oil peak: A review of the evidence on field sizes, reserve growth, decline rates and depletion rates. Energy 2012, 37, 709–724. [Google Scholar] [CrossRef]
  44. Jakobsson, K.; Bentley, R.; Söderbergh, B.; Aleklett, K. The end of cheap oil: Bottom-up economic and geologic modeling of aggregate oil production curves. Energy Policy 2012, 41, 860–870. [Google Scholar] [CrossRef]
  45. Sorrell, S.; Miller, R.; Bentley, R.; Speirs, J. Oil futures: A comparison of global supply forecasts. Energy Policy 2010, 38, 4990–5003. [Google Scholar] [CrossRef]
  46. Organization of the Petroleum Exporting Countries (OPEC). World Oil Outlook; OPEC: Vienna, Austria, 2010; ISBN 978-3-9502722-1-5. Available online: http://www.opec.org/opec_web/static_files_project/media/downloads/publications/WOO_2010.pdf (accessed on 15 September 2011).
  47. Söderbergh, B.; Robelius, F.; Aleklett, K. A crash program scenario for the Canadian oil sands industry. Energy Policy 2007, 35, 1931–1947. [Google Scholar] [CrossRef]
  48. Hughes, L.; Rudolph, J. Future world oil production: Growth, plateau, or peak? Curr. Opin. Environ. Sustain. 2011, 3, 225–234. [Google Scholar] [CrossRef]
  49. Bentley, R.W. Global oil & gas depletion: An overview. Energy Policy 2002, 30, 189–205. [Google Scholar] [CrossRef]
  50. Hirsch, R.L. The inevitable peaking of world oil production. Atl. Counc. Bull. 2005, XVI, 1–9. [Google Scholar]
  51. Tsoskounoglou, M.; Ayerides, G.; Tritopoulou, E. The end of cheap oil: Current status and prospects. Energy Policy 2008, 36, 3797–3806. [Google Scholar]
  52. Sorrell, S.; Speirs, J.; Bentley, R.; Brandt, A.; Miller, R. Global oil depletion: A review of the evidence. Energy Policy 2010, 38, 5290–5295. [Google Scholar] [CrossRef]
  53. Aleklett, K.; Höök, M.; Jakobsson, K.; Lardelli, M.; Snowden, S.; Söderbergh, B. The peak of the oil age: Reviewing the reference scenario world oil outlook in IEA World Energy Outlook 2008. Energy Policy 2010, 38, 1398–1414. [Google Scholar] [CrossRef]
  54. Fantazzini, D.; Höök, M.; Angelantoni, A. Global oil risks in the early 21st century. Energy Policy 2011, 39, 7865–7873. [Google Scholar] [CrossRef] [Green Version]
  55. Tverberg, G.E. Oil supply limits and the continuing financial crisis. Energy 2011, 37, 27–34. [Google Scholar] [CrossRef]
  56. Organization of the Petroleum Exporting Countries (OPEC). World Oil Outlook; OPEC: Vienna, Austria, 2011; ISBN 978-3-9502722-1-5. Available online: http://www.opec.org/opec_web/static_files_project/media/downloads/publications/WOO_2011.pdf (accessed on 2 June 2012).
  57. Friedrichs, J. Global energy crunch: How different parts of the world would react to a peak oil scenario. Energy Policy 2010, 38, 4562–4569. [Google Scholar] [CrossRef]
  58. Gately, D. A ten-year retrospective: OPEC and the world oil market. J. Econ. Lit. 1984, 22, 1100–1114. [Google Scholar]
  59. Smith, J.L. World oil: Market or mayhem? J. Econ. Perspect. 2009, 23, 145–164. [Google Scholar] [CrossRef]
  60. Smith, J.L. Inscrutable OPEC? Behavioral tests of the cartel hypothesis. Energy J. 2005, 26, 51–82. [Google Scholar]
  61. Simmons, M.R. Twilight in the desert: The coming Saudi oil shock and the world economy. Wiley: New York, NY, USA, 2005. [Google Scholar]
  62. De Castro, C.; Miguel, L.J.; Mediavilla, M. The role of non conventional oil in the attenuation of peak oil. Energy Policy 2009, 37, 1825–1833. [Google Scholar] [CrossRef]
  63. Dees, S.; Karadeloglou, P.; Kaufmann, R.K.; Sanchez, M. Modelling the world oil market, assessment of a quarterly econometric model. Energy Policy 2007, 35, 178–191. [Google Scholar] [CrossRef]
  64. Gerlagh, R. A climate-change policy induced shift from innovations in carbon-energy production to carbon-energy savings. Energy Econ. 2008, 30, 425–448. [Google Scholar] [CrossRef]
  65. Morrow, W.; Gallagher, K.; Collantes, G.; Lee, H. Analysis of policies to reduce oil consumption and greenhouse-gas emissions from the US transportation section. Energy Policy 2010, 38, 1305–1320. [Google Scholar] [CrossRef]

