1. Introduction
The Velenje Coal Mine (VCM) in Velenje (Slovenia) is one of the largest and most modern underground thick layer coal extraction mines in Europe. Mechanized extraction of coal by the use of the long wall method was developed by VCM and it is protected by a patent [
1]. The process of obtaining coal, due to thick layers of lignite, which reach a peak of 160 m, is specific and can be classified as a Best Available Technology (BAT) process. The company is leading the innovation activity and has an integrated system for continuous improvement. In spite of that, the VCM is aware that today a company that is not energy efficient, cannot be commercially successful. The cost of energy consumed at the VCM is approximately 4 million Euros per year [
2]. To reduce these costs we take certain measures to enable savings. In order to track the power consumption of district heating, drinking water, compressed air and electricity we began to use a monitoring system called “Central System for Regulation of Energy” (CSRE) in July 2010.
2. Methods
The VCM needs, beside a reliable and quality energy supply, also a suitable tool for the efficient management of energy. As [
3] demonstrates, the larger and more complex the industrial process and more so when item bodies different energy sources, the harder it is to control, if energy consumption is within the acceptable limits.
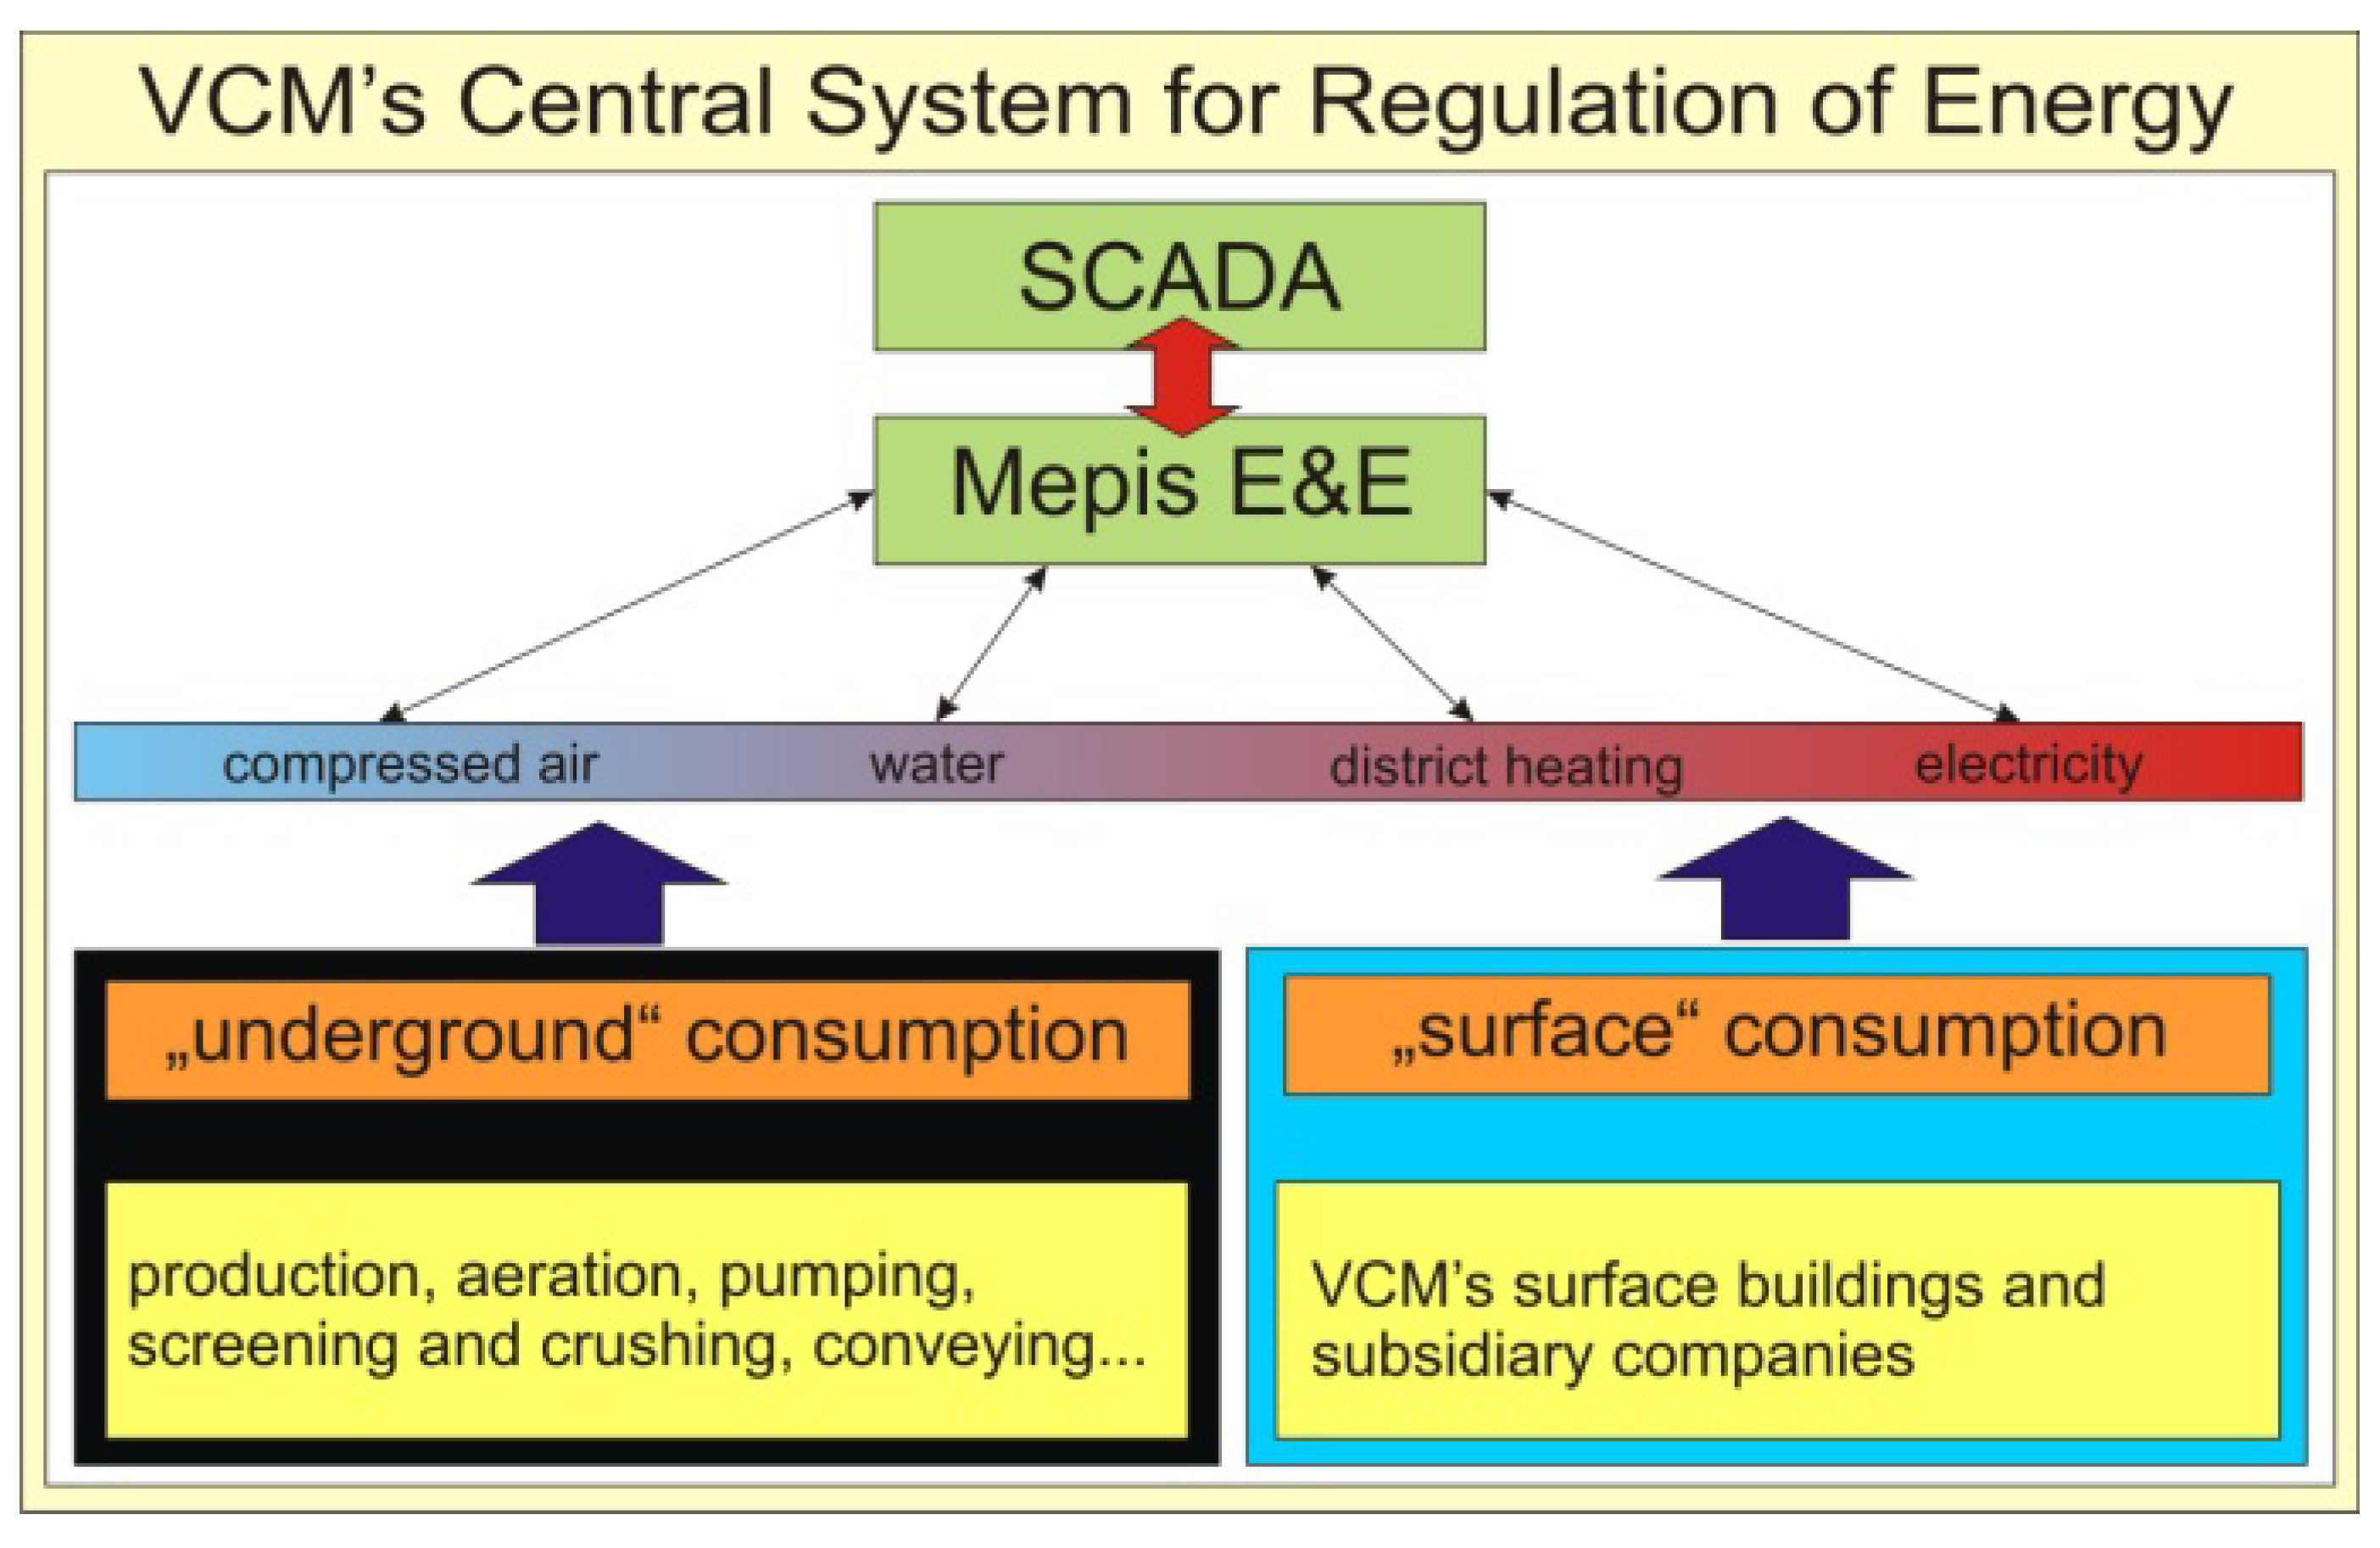
To meet our needs we have introduced CSRE, which enables remote monitoring, management, monitoring of the energy consumption and easy integration of additional energy systems. The CSRE software consists of a Supervisory Control and Data Acquisition (SCADA) [
4] and a manufacturing Mepis E & E information system [
5] (
Figure 1). The SCADA system operates at an operational level and is used to capture the different parameters and values in several places, including remote one and further for displaying them in real time [
6].
Figure 2 shows a basic graphical SCADA interface and
Figure 3 the graphical interface for controlling the climate.
The Mepis E & E Production Information System is a modular and configurable software product that covers the following functionalities [
5]:
- ▪
Operational planning and grading,
- ▪
Quality management,
- ▪
Better control over the use of energy resources ("real time" monitoring),
- ▪
Increased energy efficiency,
- ▪
Reduced environmental pollution,
- ▪
An effective tool for developing an active energy policy,
- ▪
Online Analytical Processing (OLAP) and Reporting,
- ▪
Energy savings,
- ▪
Lower costs.
Figure 1.
Schematic representation of CSRE structure and monitored energy sources by location and users.
Figure 1.
Schematic representation of CSRE structure and monitored energy sources by location and users.
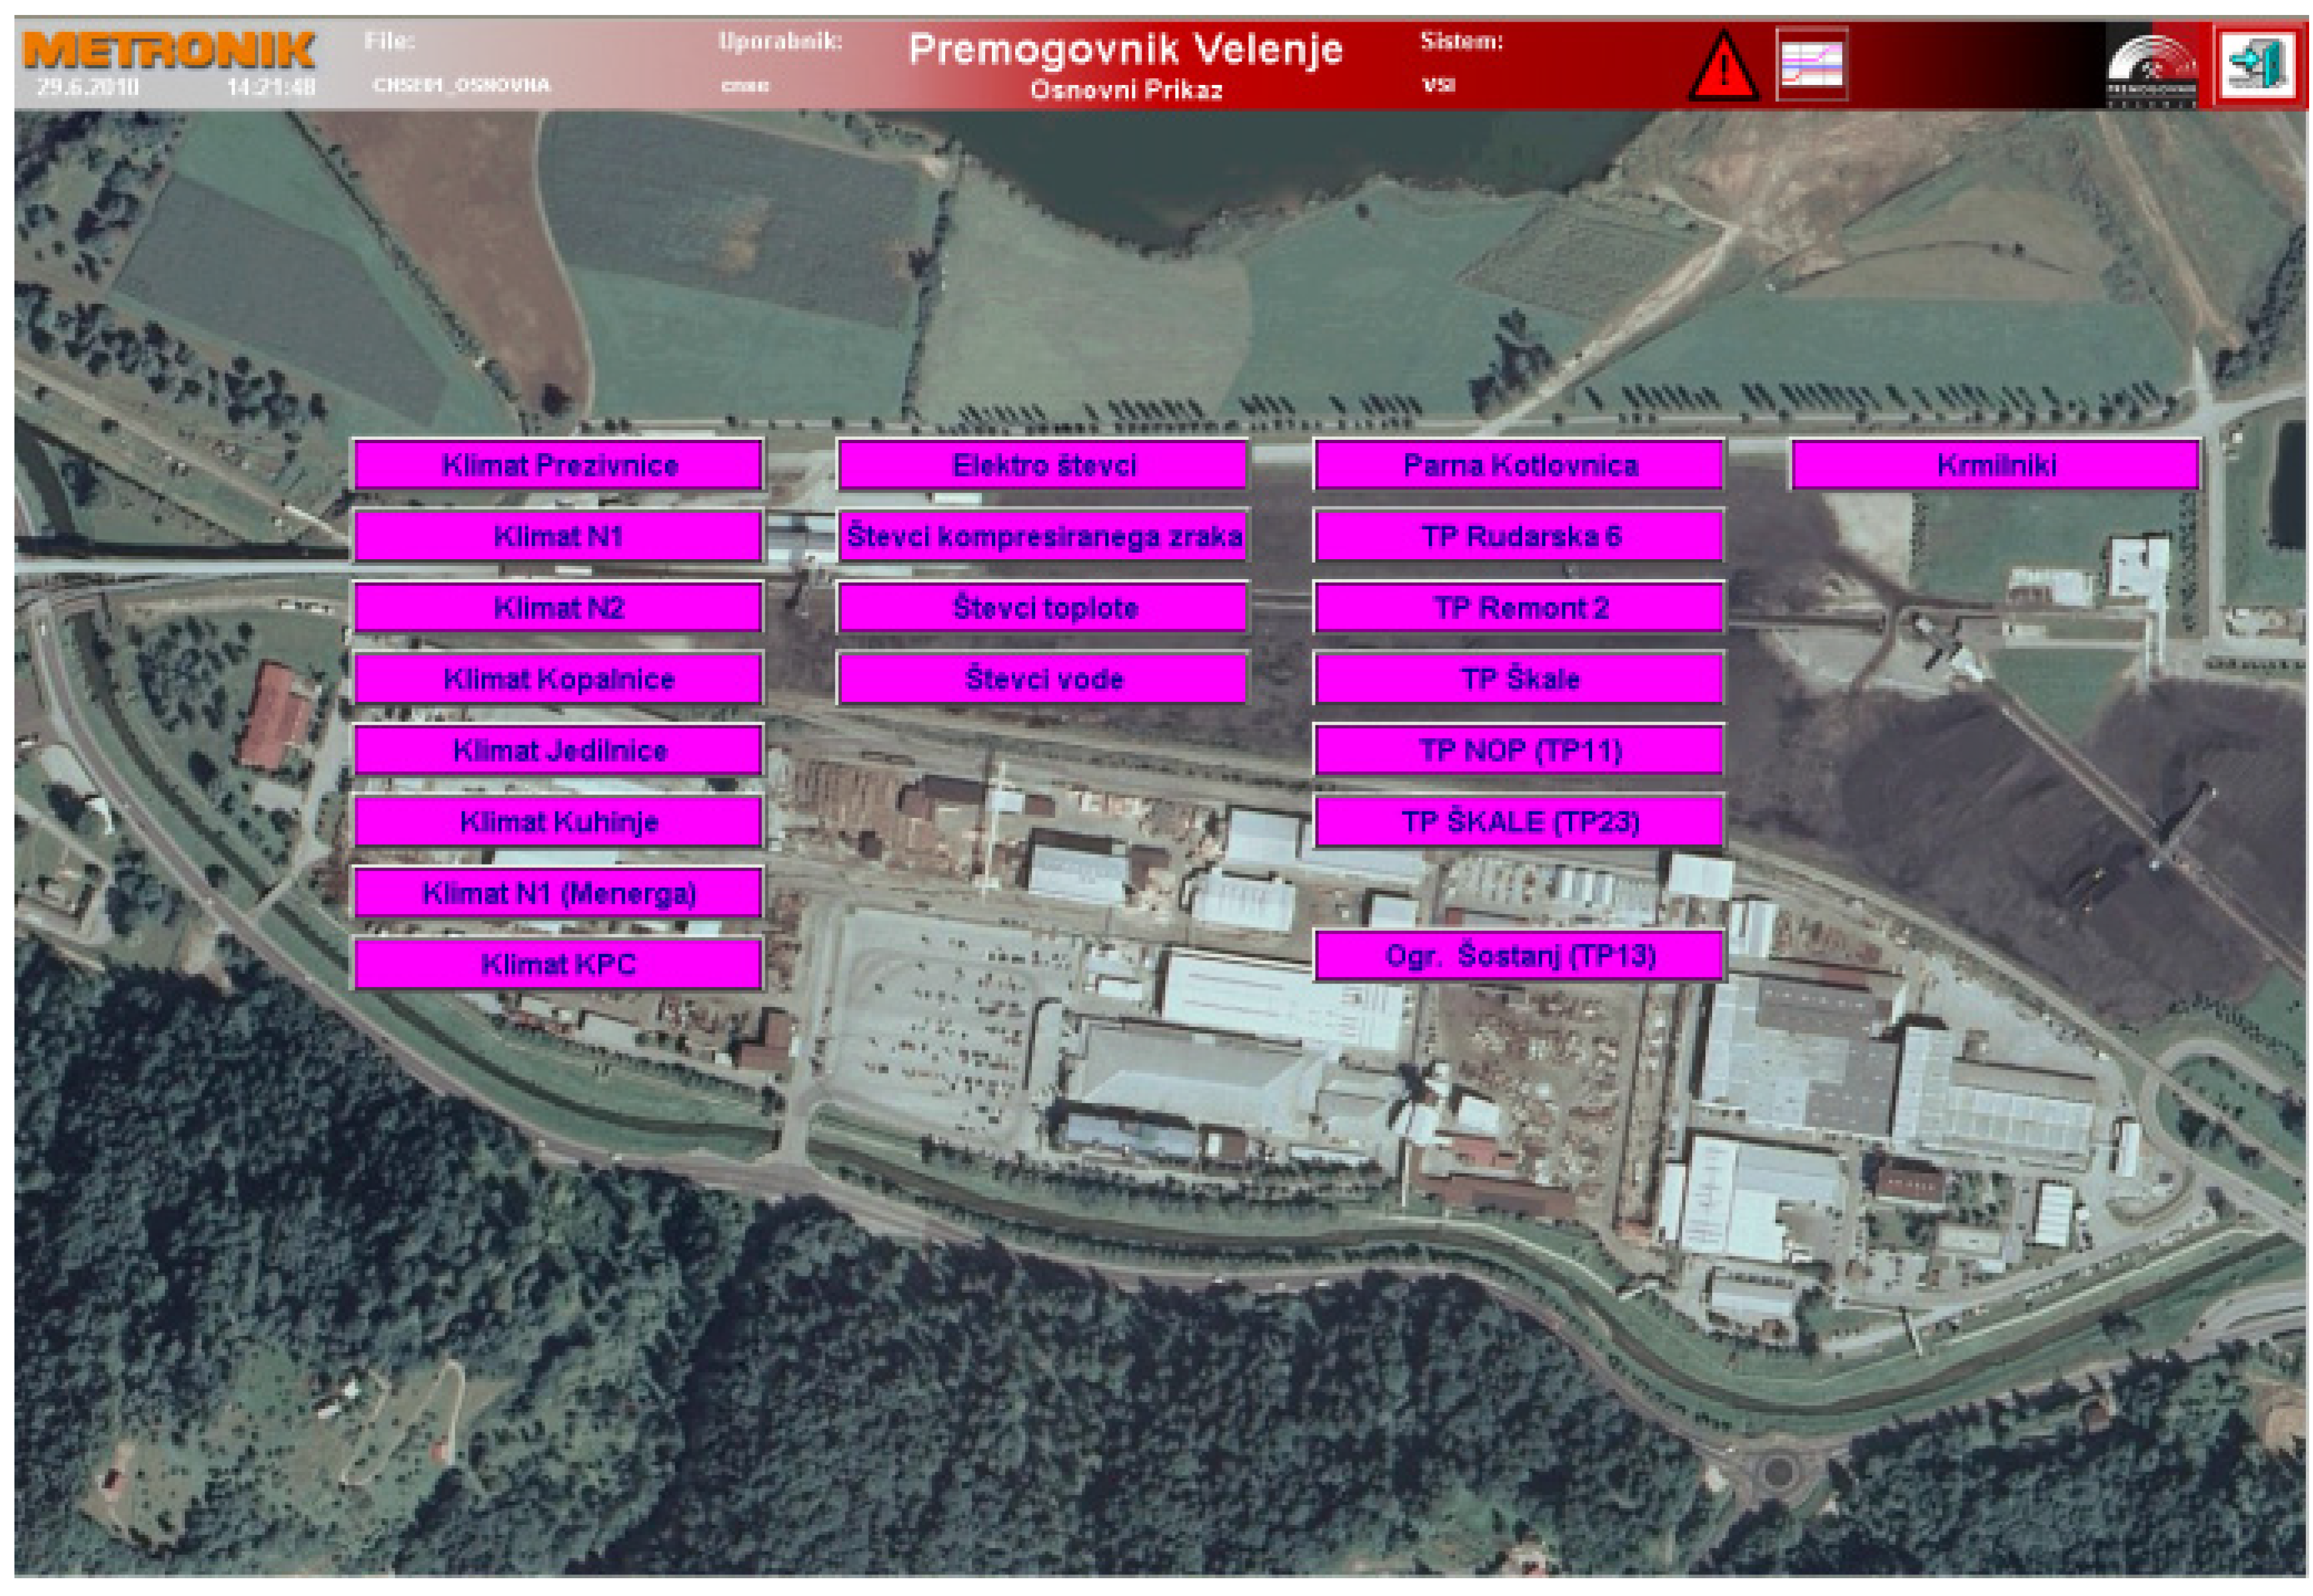
Figure 2.
Basic graphical SCADA interface of Velenje Coal Mine’s CSRE system.
Figure 2.
Basic graphical SCADA interface of Velenje Coal Mine’s CSRE system.
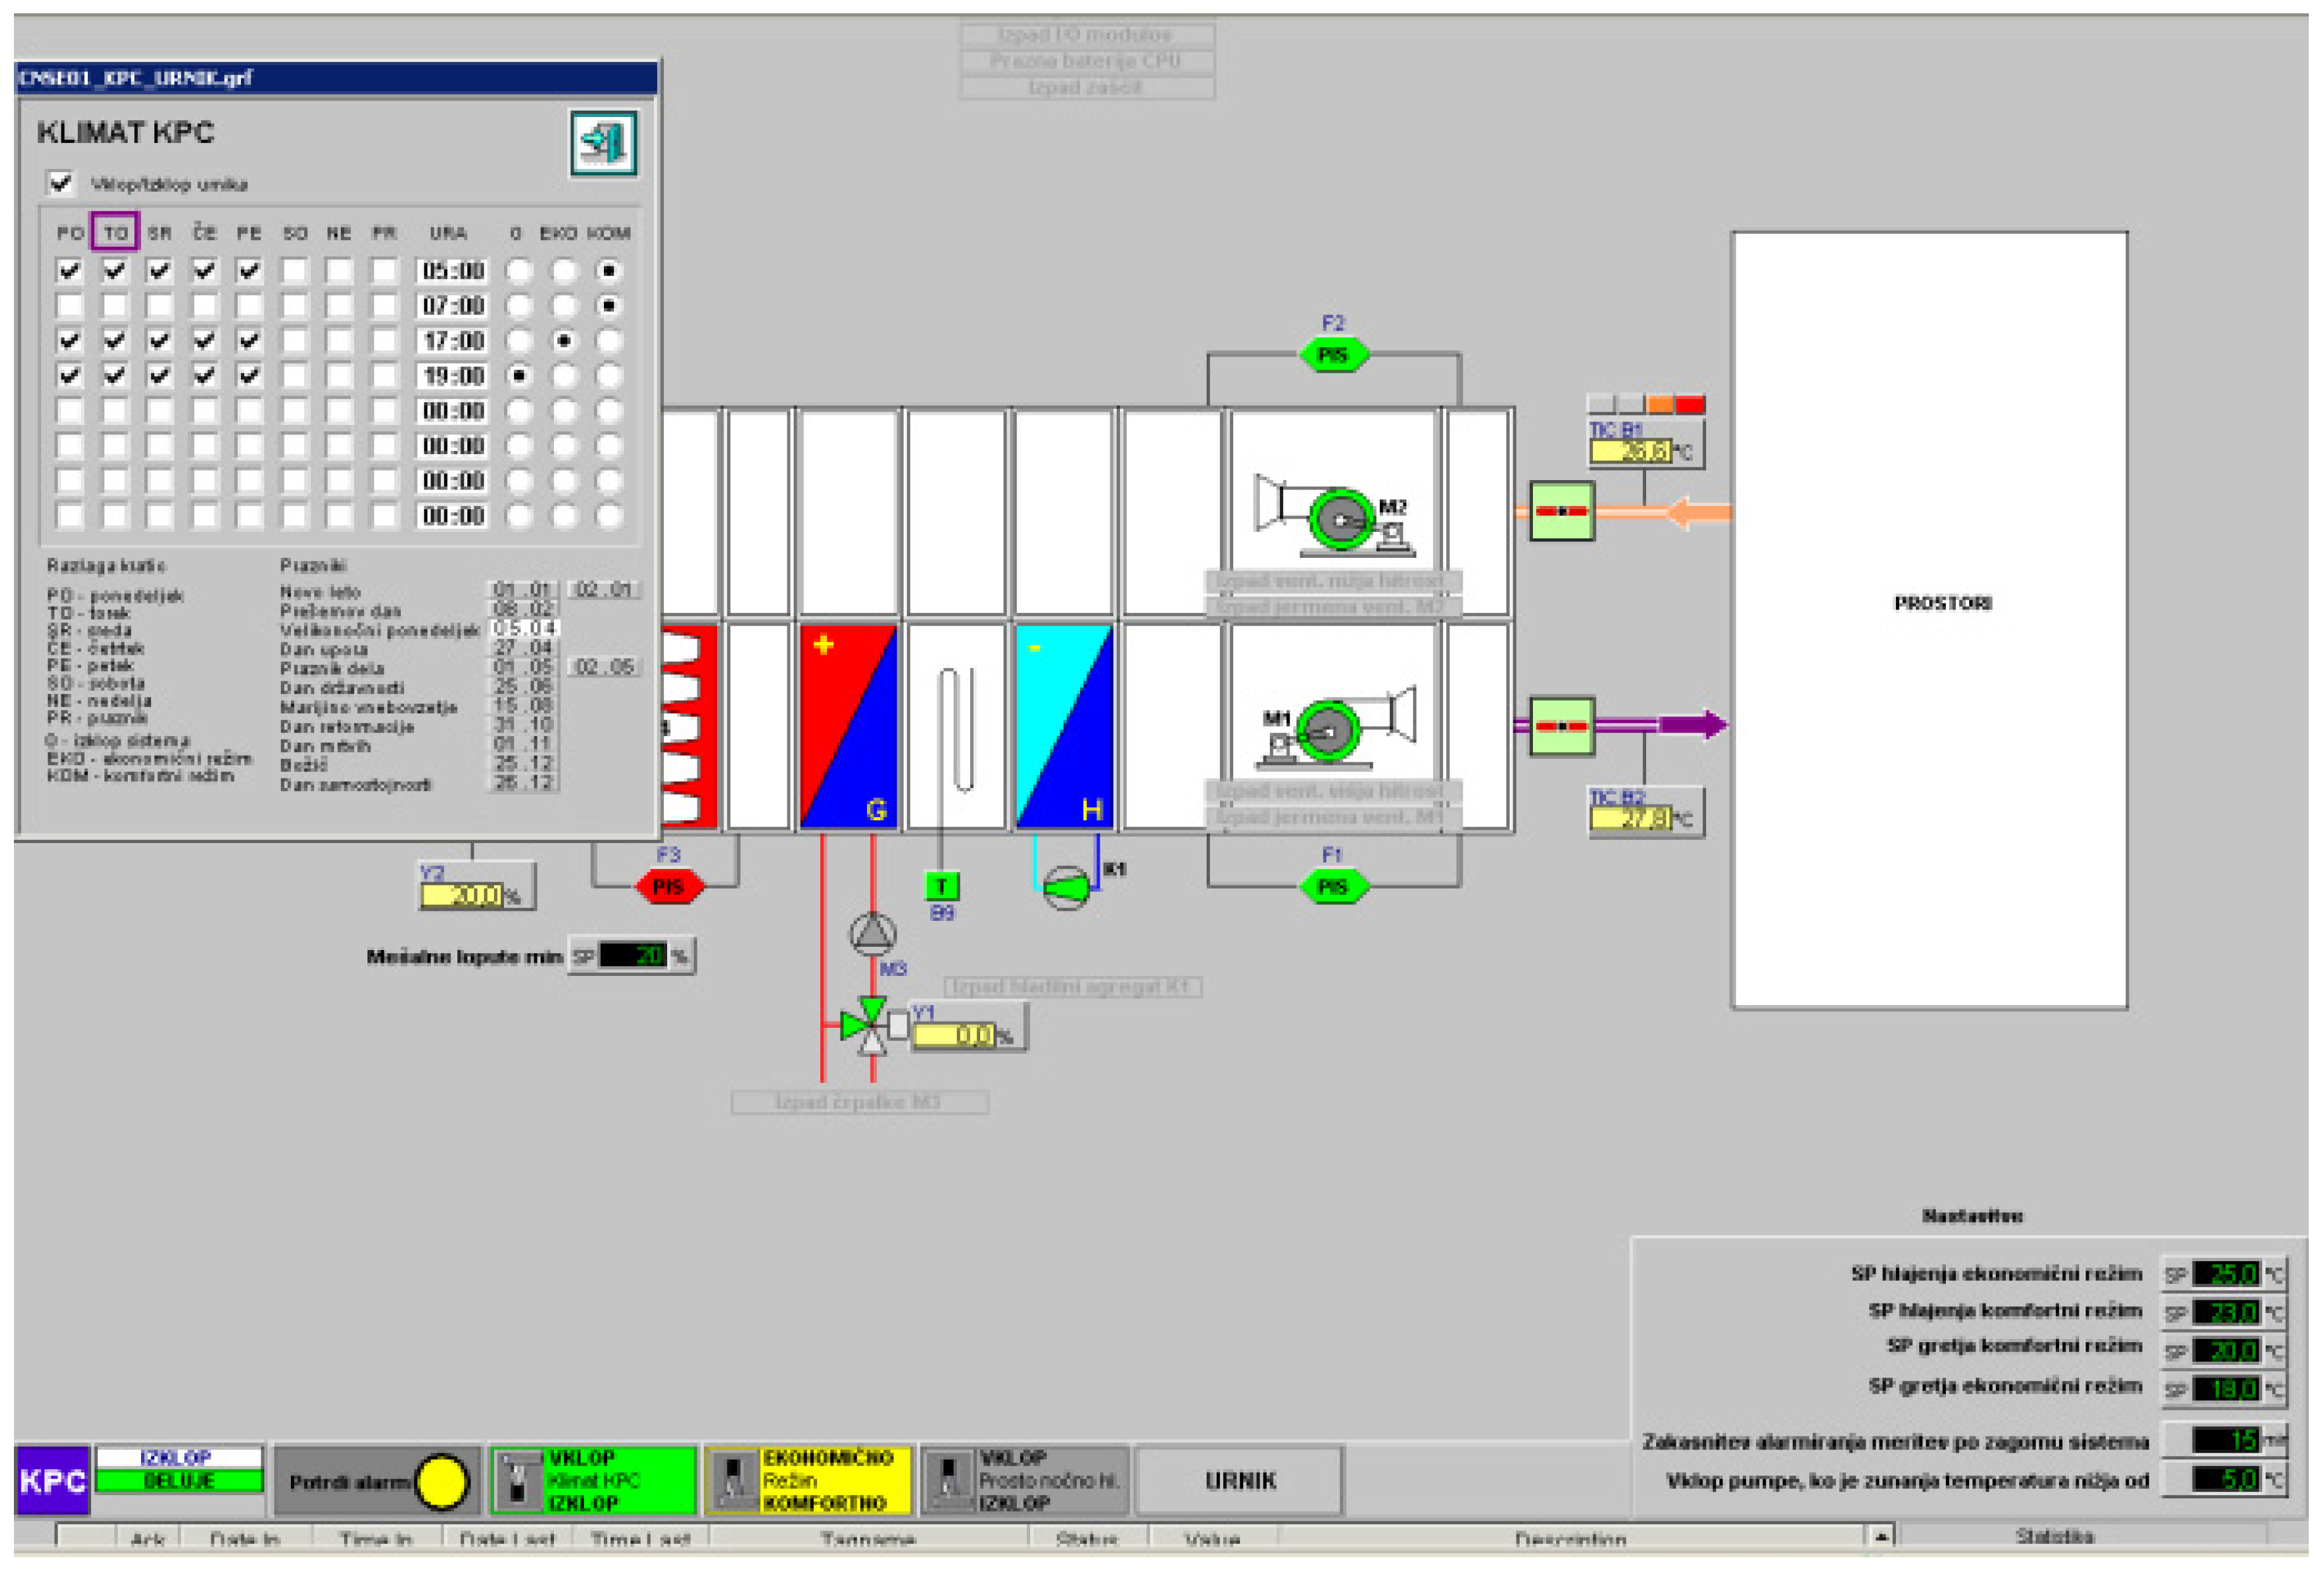
Figure 3.
SCADA Real-time information about climate control in graphical form.
Figure 3.
SCADA Real-time information about climate control in graphical form.
Figure 4 shows a basic graphical Mepis E&E interface.
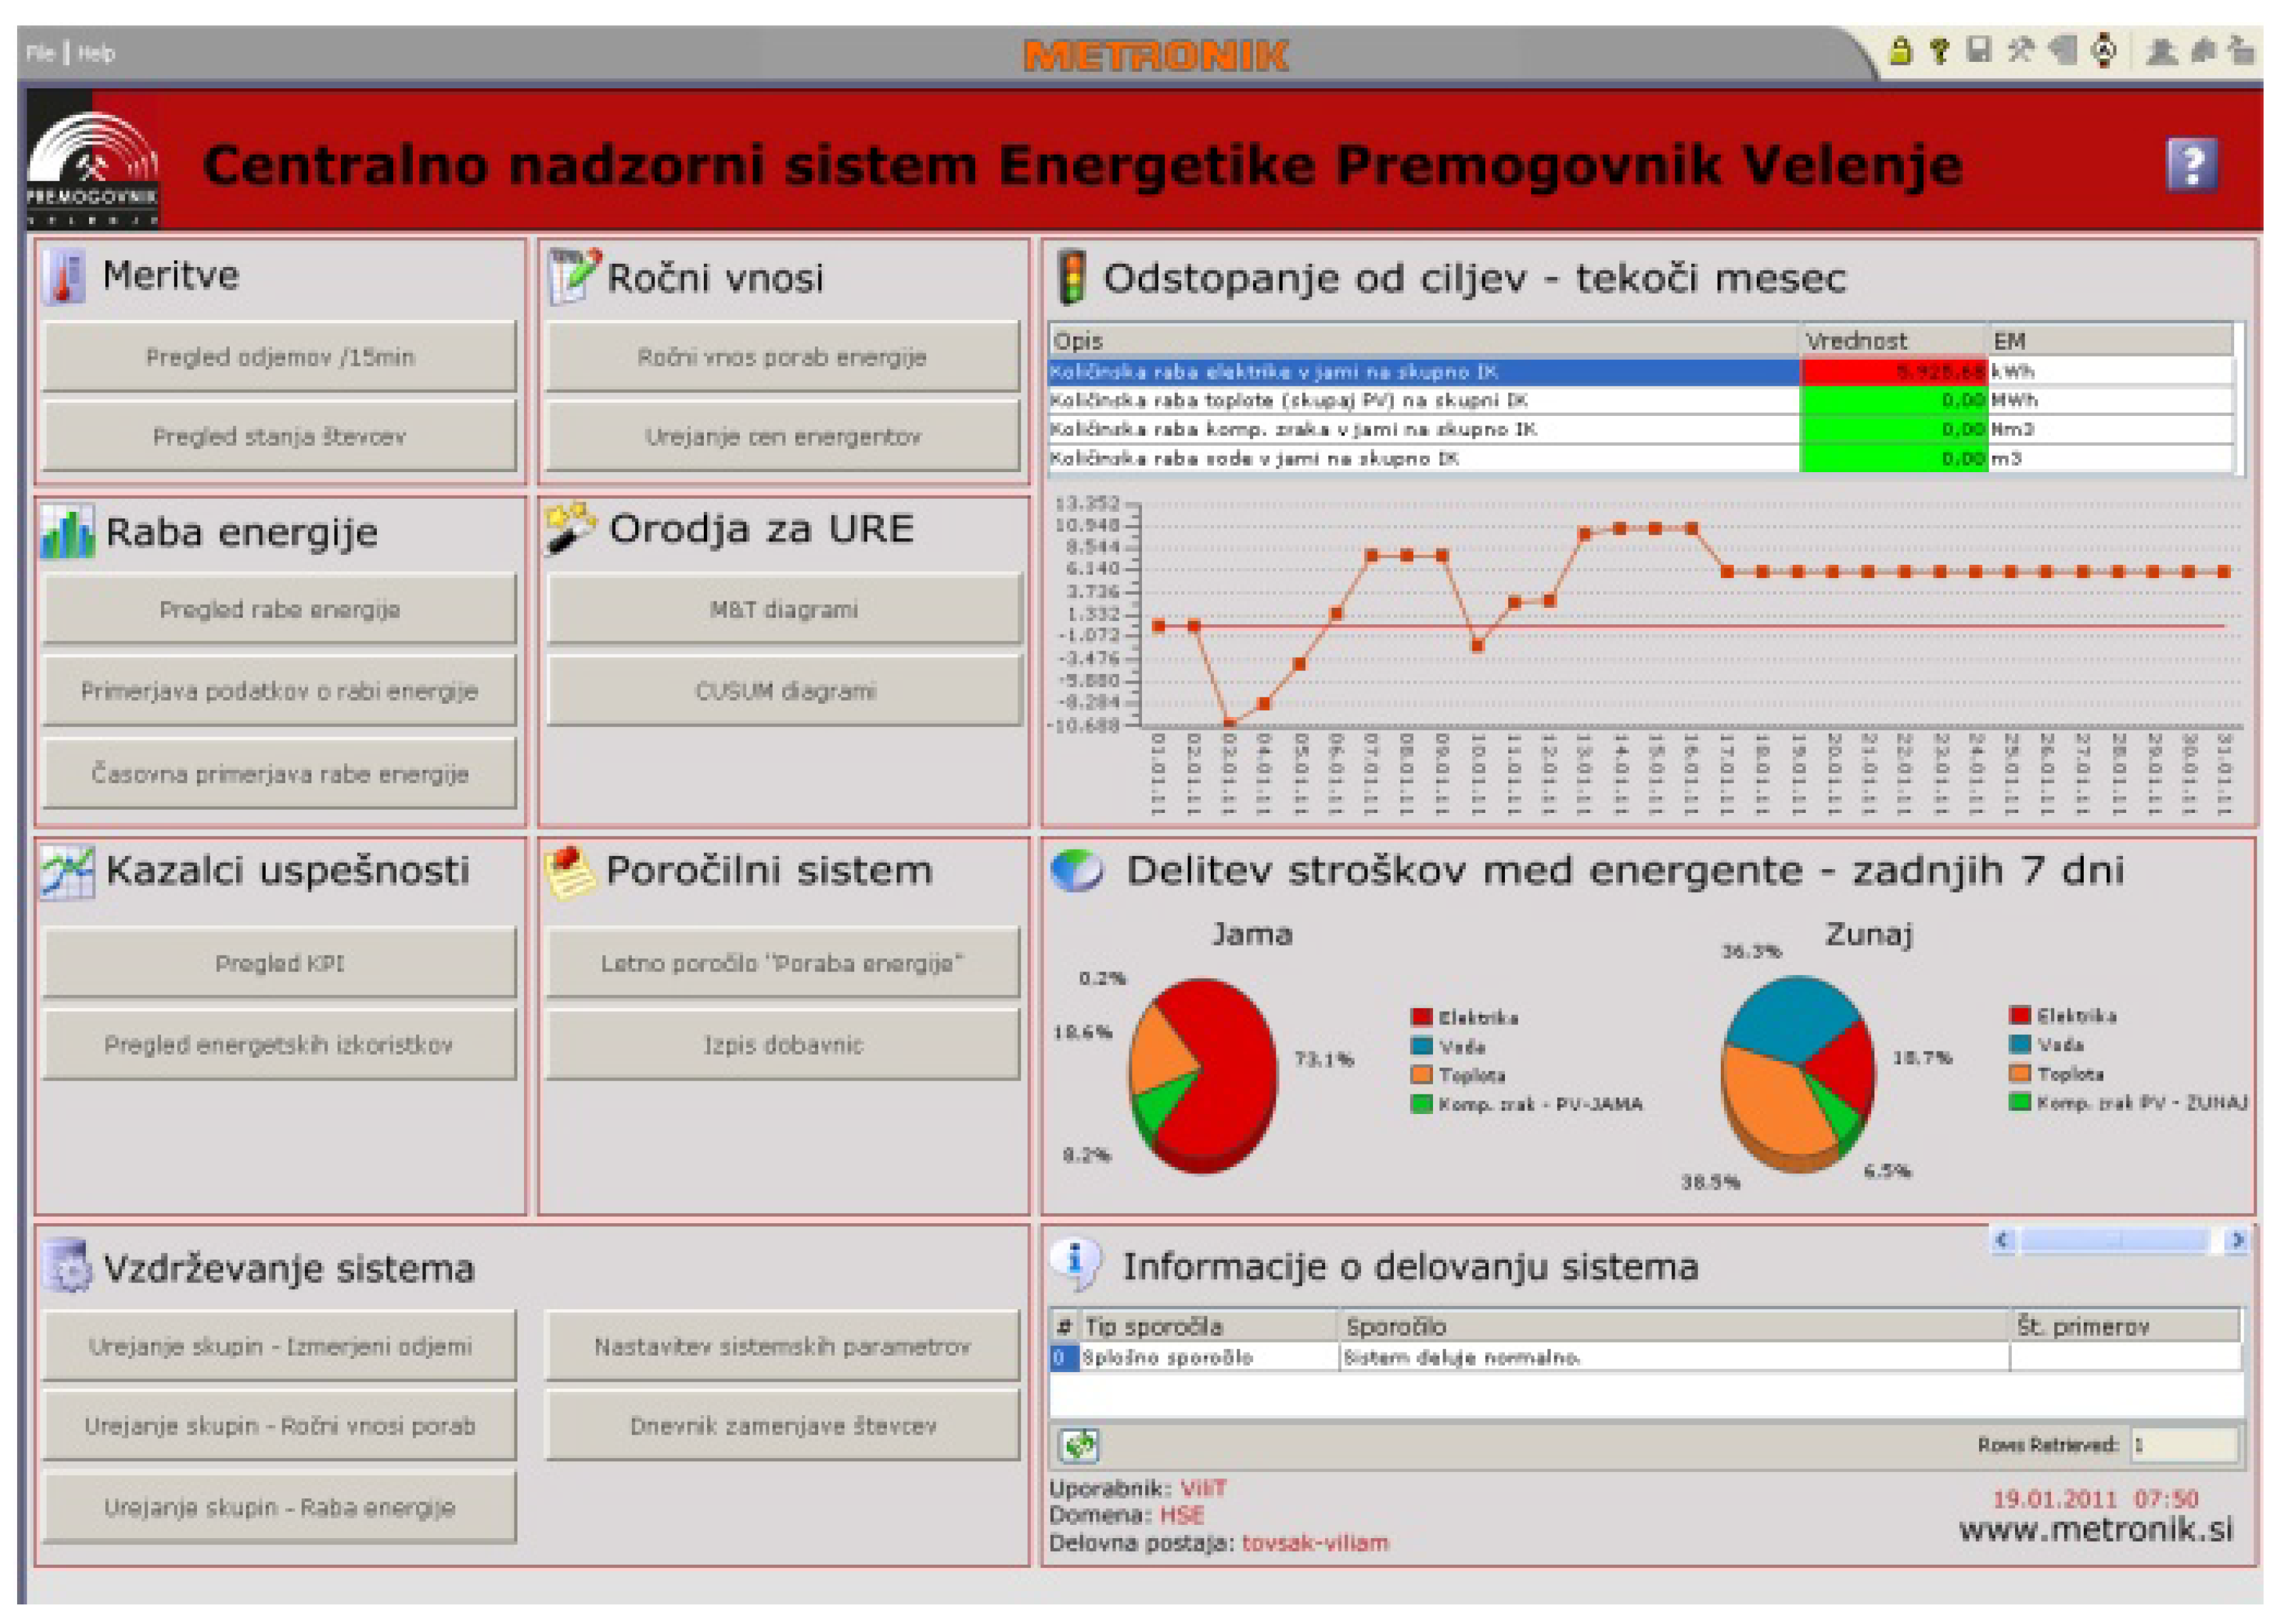
Figure 4.
Basic graphical Mepis E&E interface of Velenje Coal Mine’s CSRE system.
Figure 4.
Basic graphical Mepis E&E interface of Velenje Coal Mine’s CSRE system.
By using CSRE distribution and energy consumption can be followed every 15 min, separately for each of the technological process, as shown in
Figure 1. In this manner consumption of electricity and compressed air for each location in the mine and on the surface is known, further use of drinking water in the mine (in the case of triad water supply shortfalls) and on the surface and district heat consumed are also known. The original system was connected to 154 sensors: 67 electricity meters, 18 heat meters, 61 meters for drinking water and eight meters for compressed air and then extended with 10 additional electricity meters in 2011. Mepis E & E allows the calculation and display of energy consumption for any arbitrary period of time and comparison between different parameters and consumers (
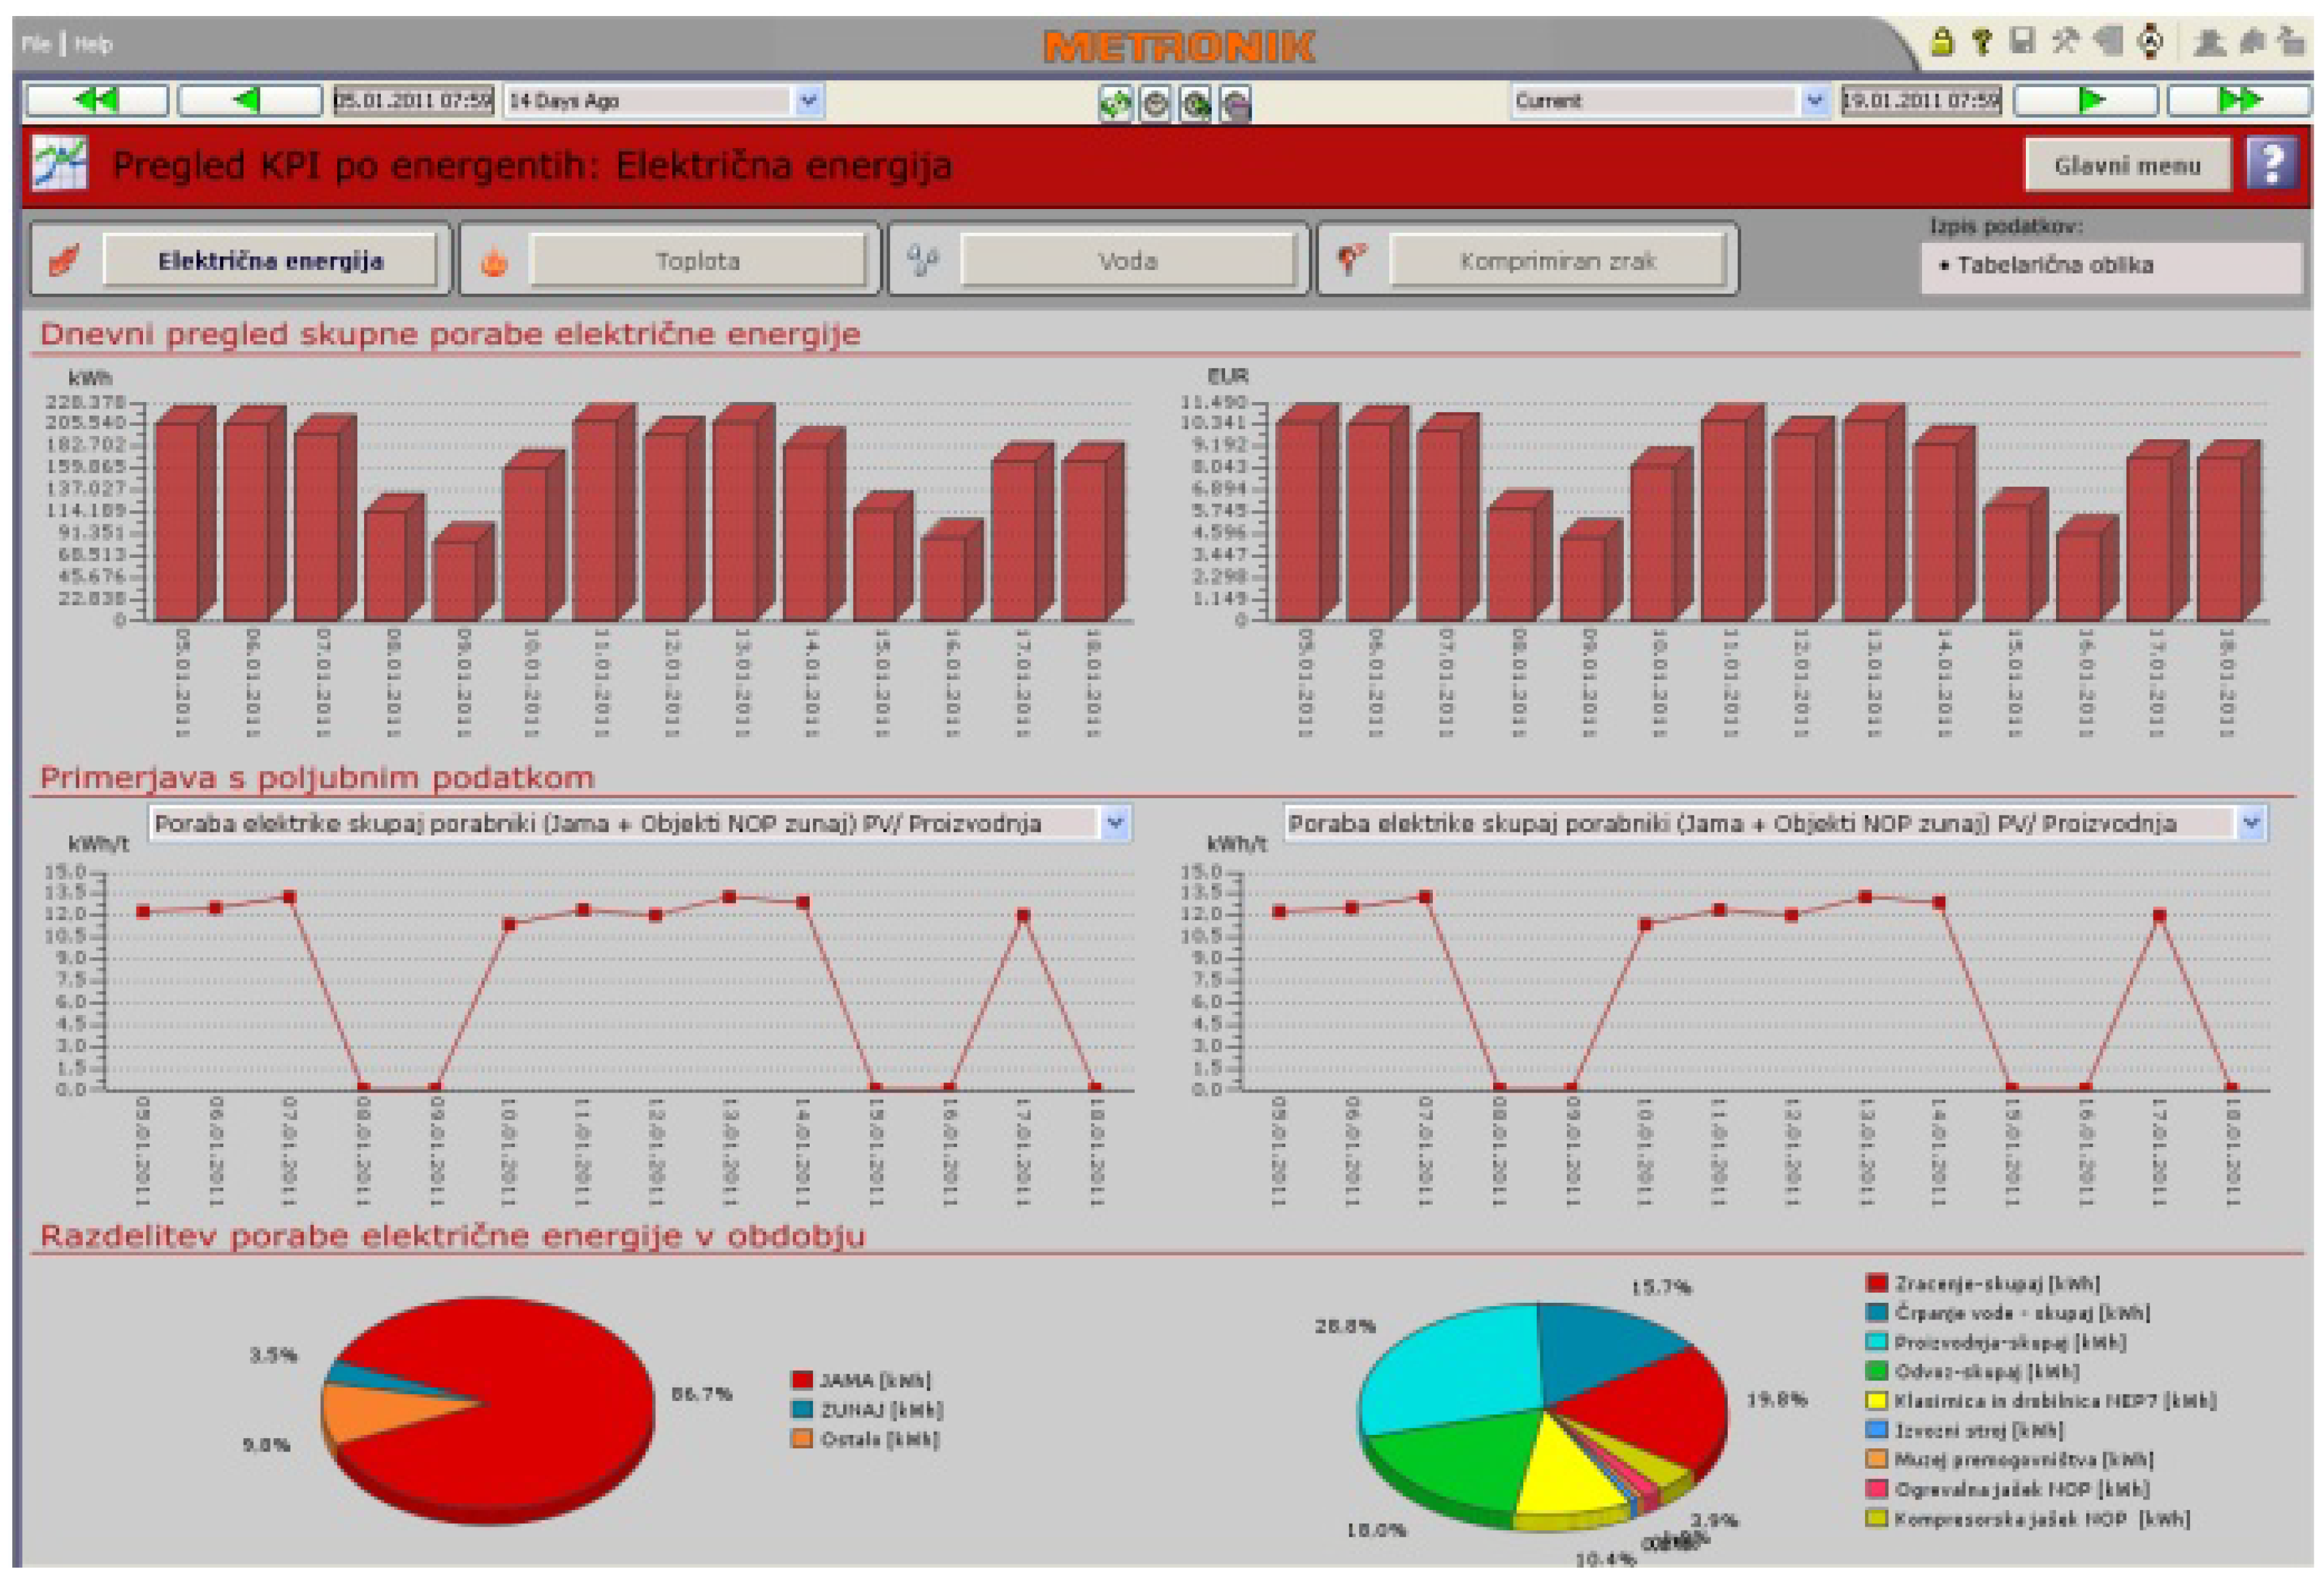
Figure 5). Energy efficiency is monitored and evaluated through key performance indicators, which are calculated as the ratio of consumed quantity of appointed energy sources in the two comparative periods.
Figure 5.
Graphical energy consumption interface in CSRE.
Figure 5.
Graphical energy consumption interface in CSRE.
3. Results and Discussion
Annually the VCM uses approximately 74,000 MWh of energy for the production of coal and supporting processes [
7].
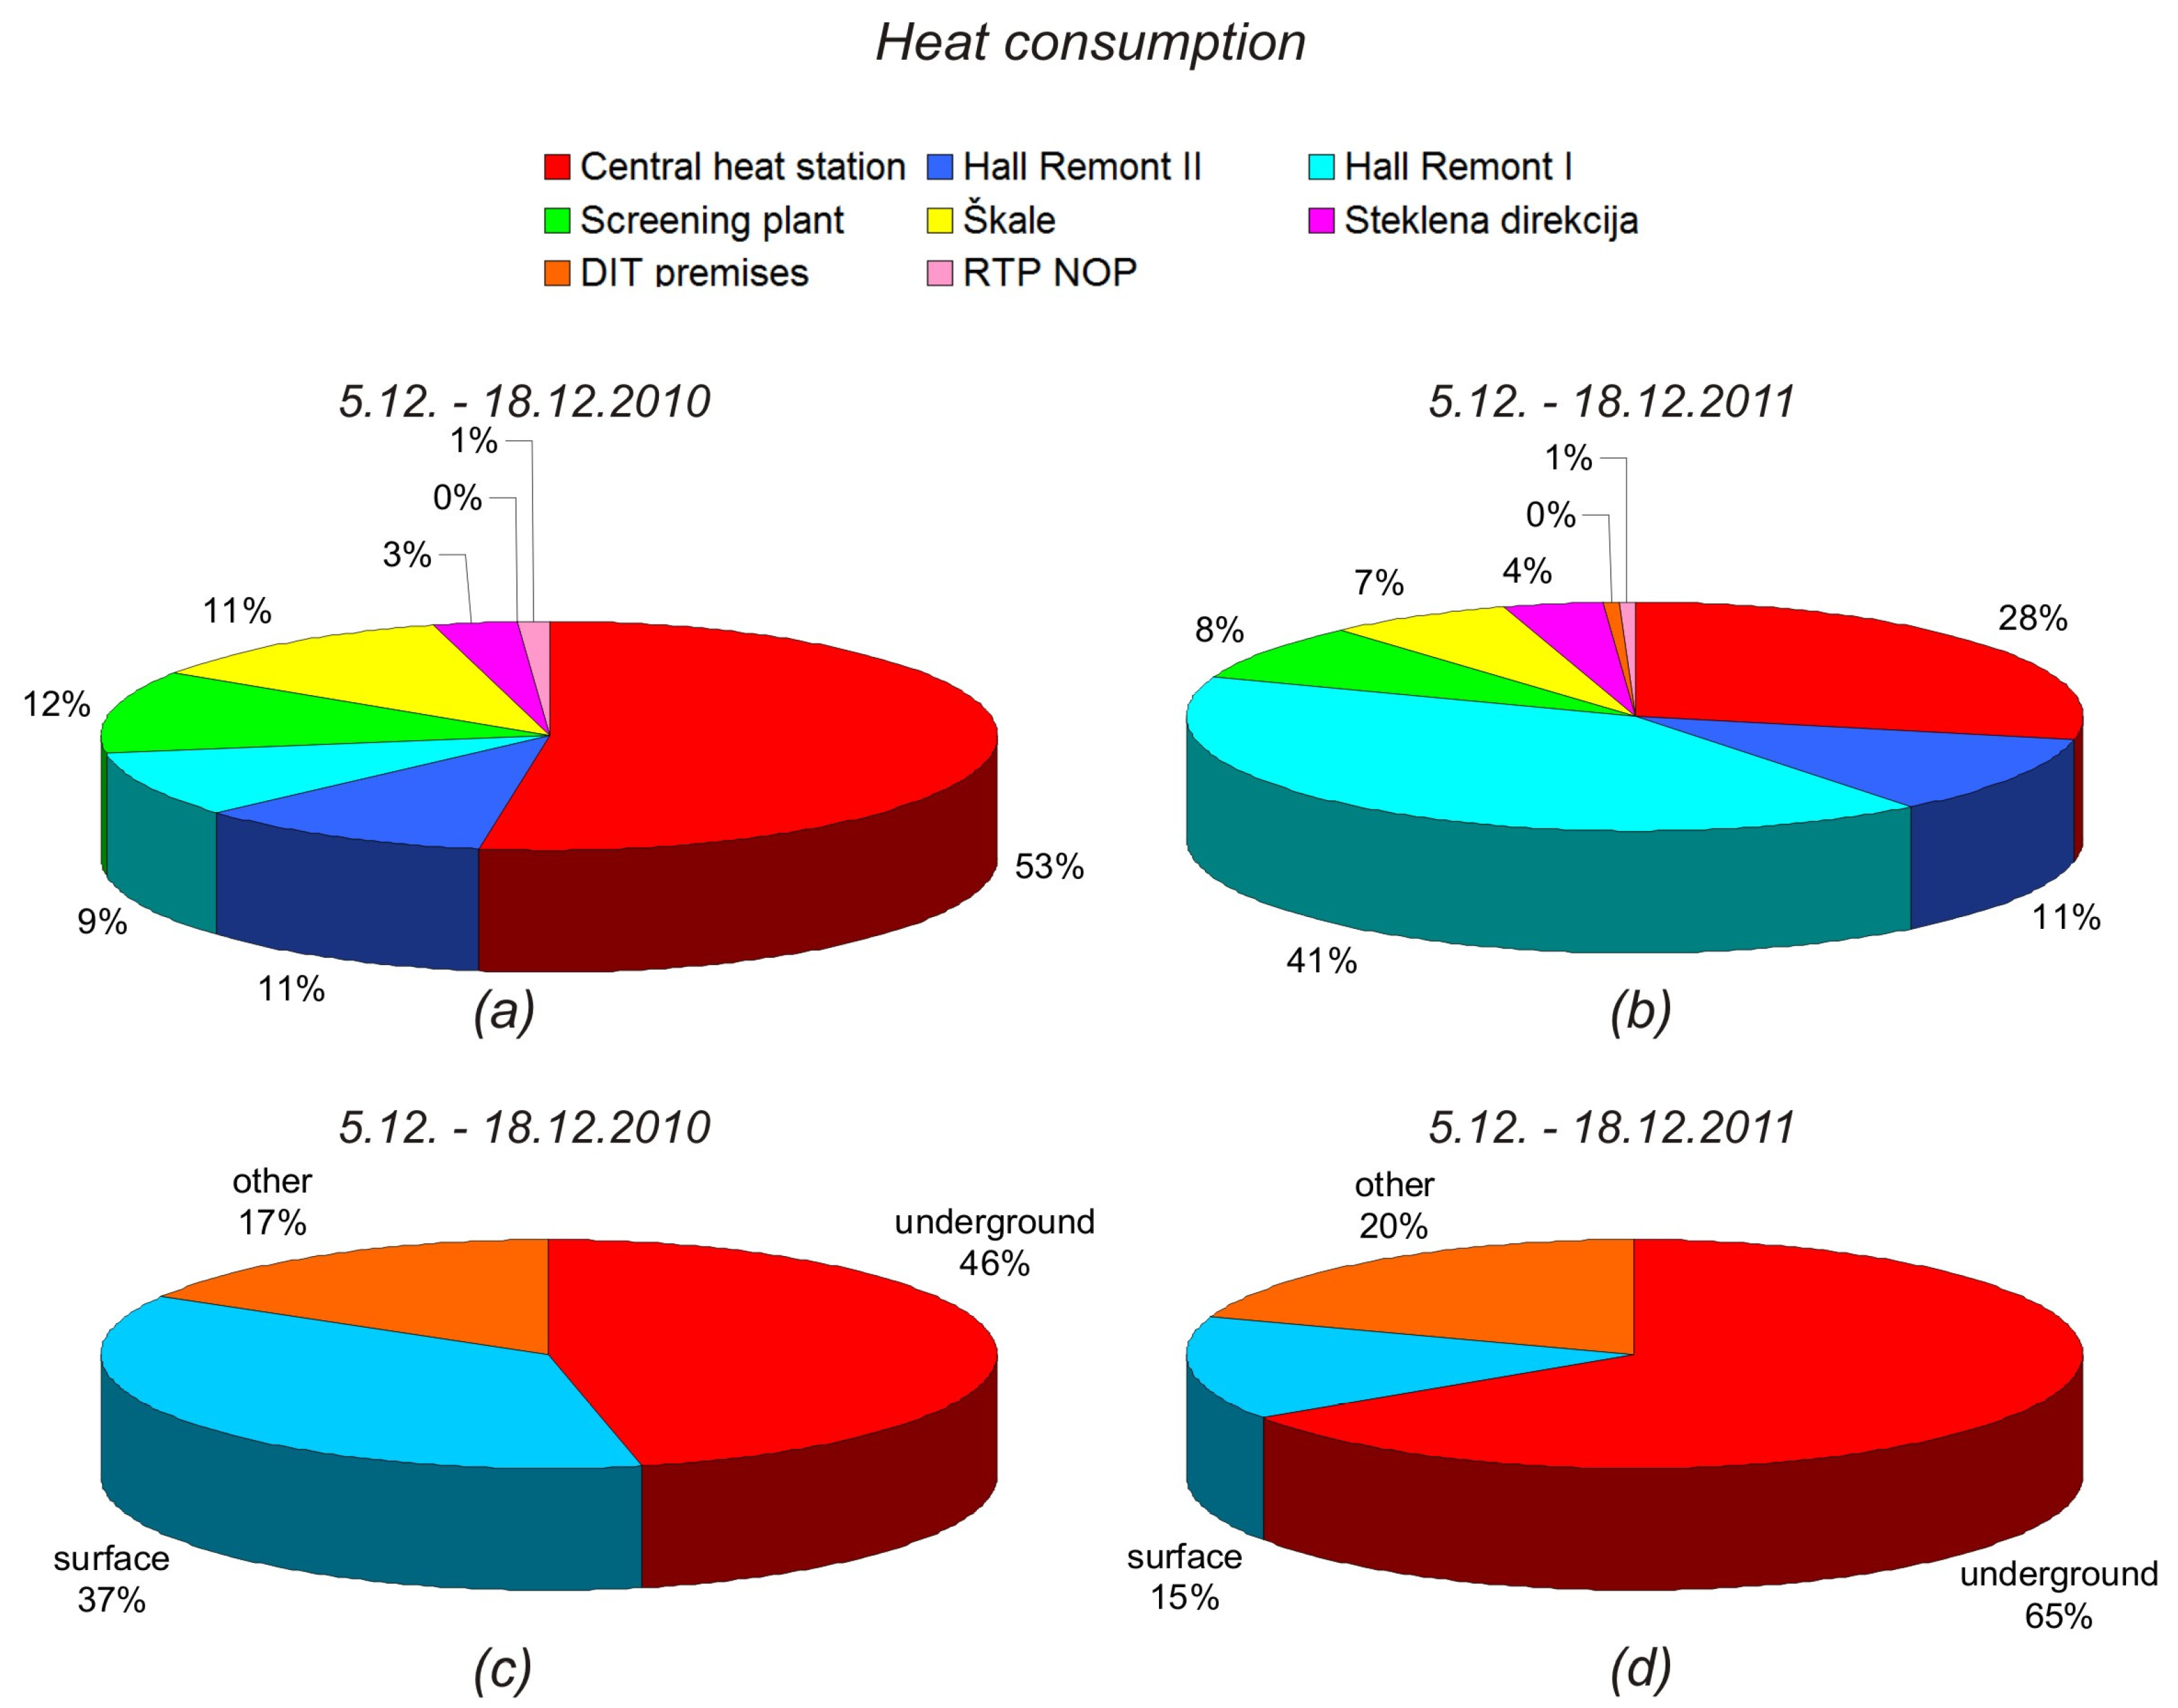
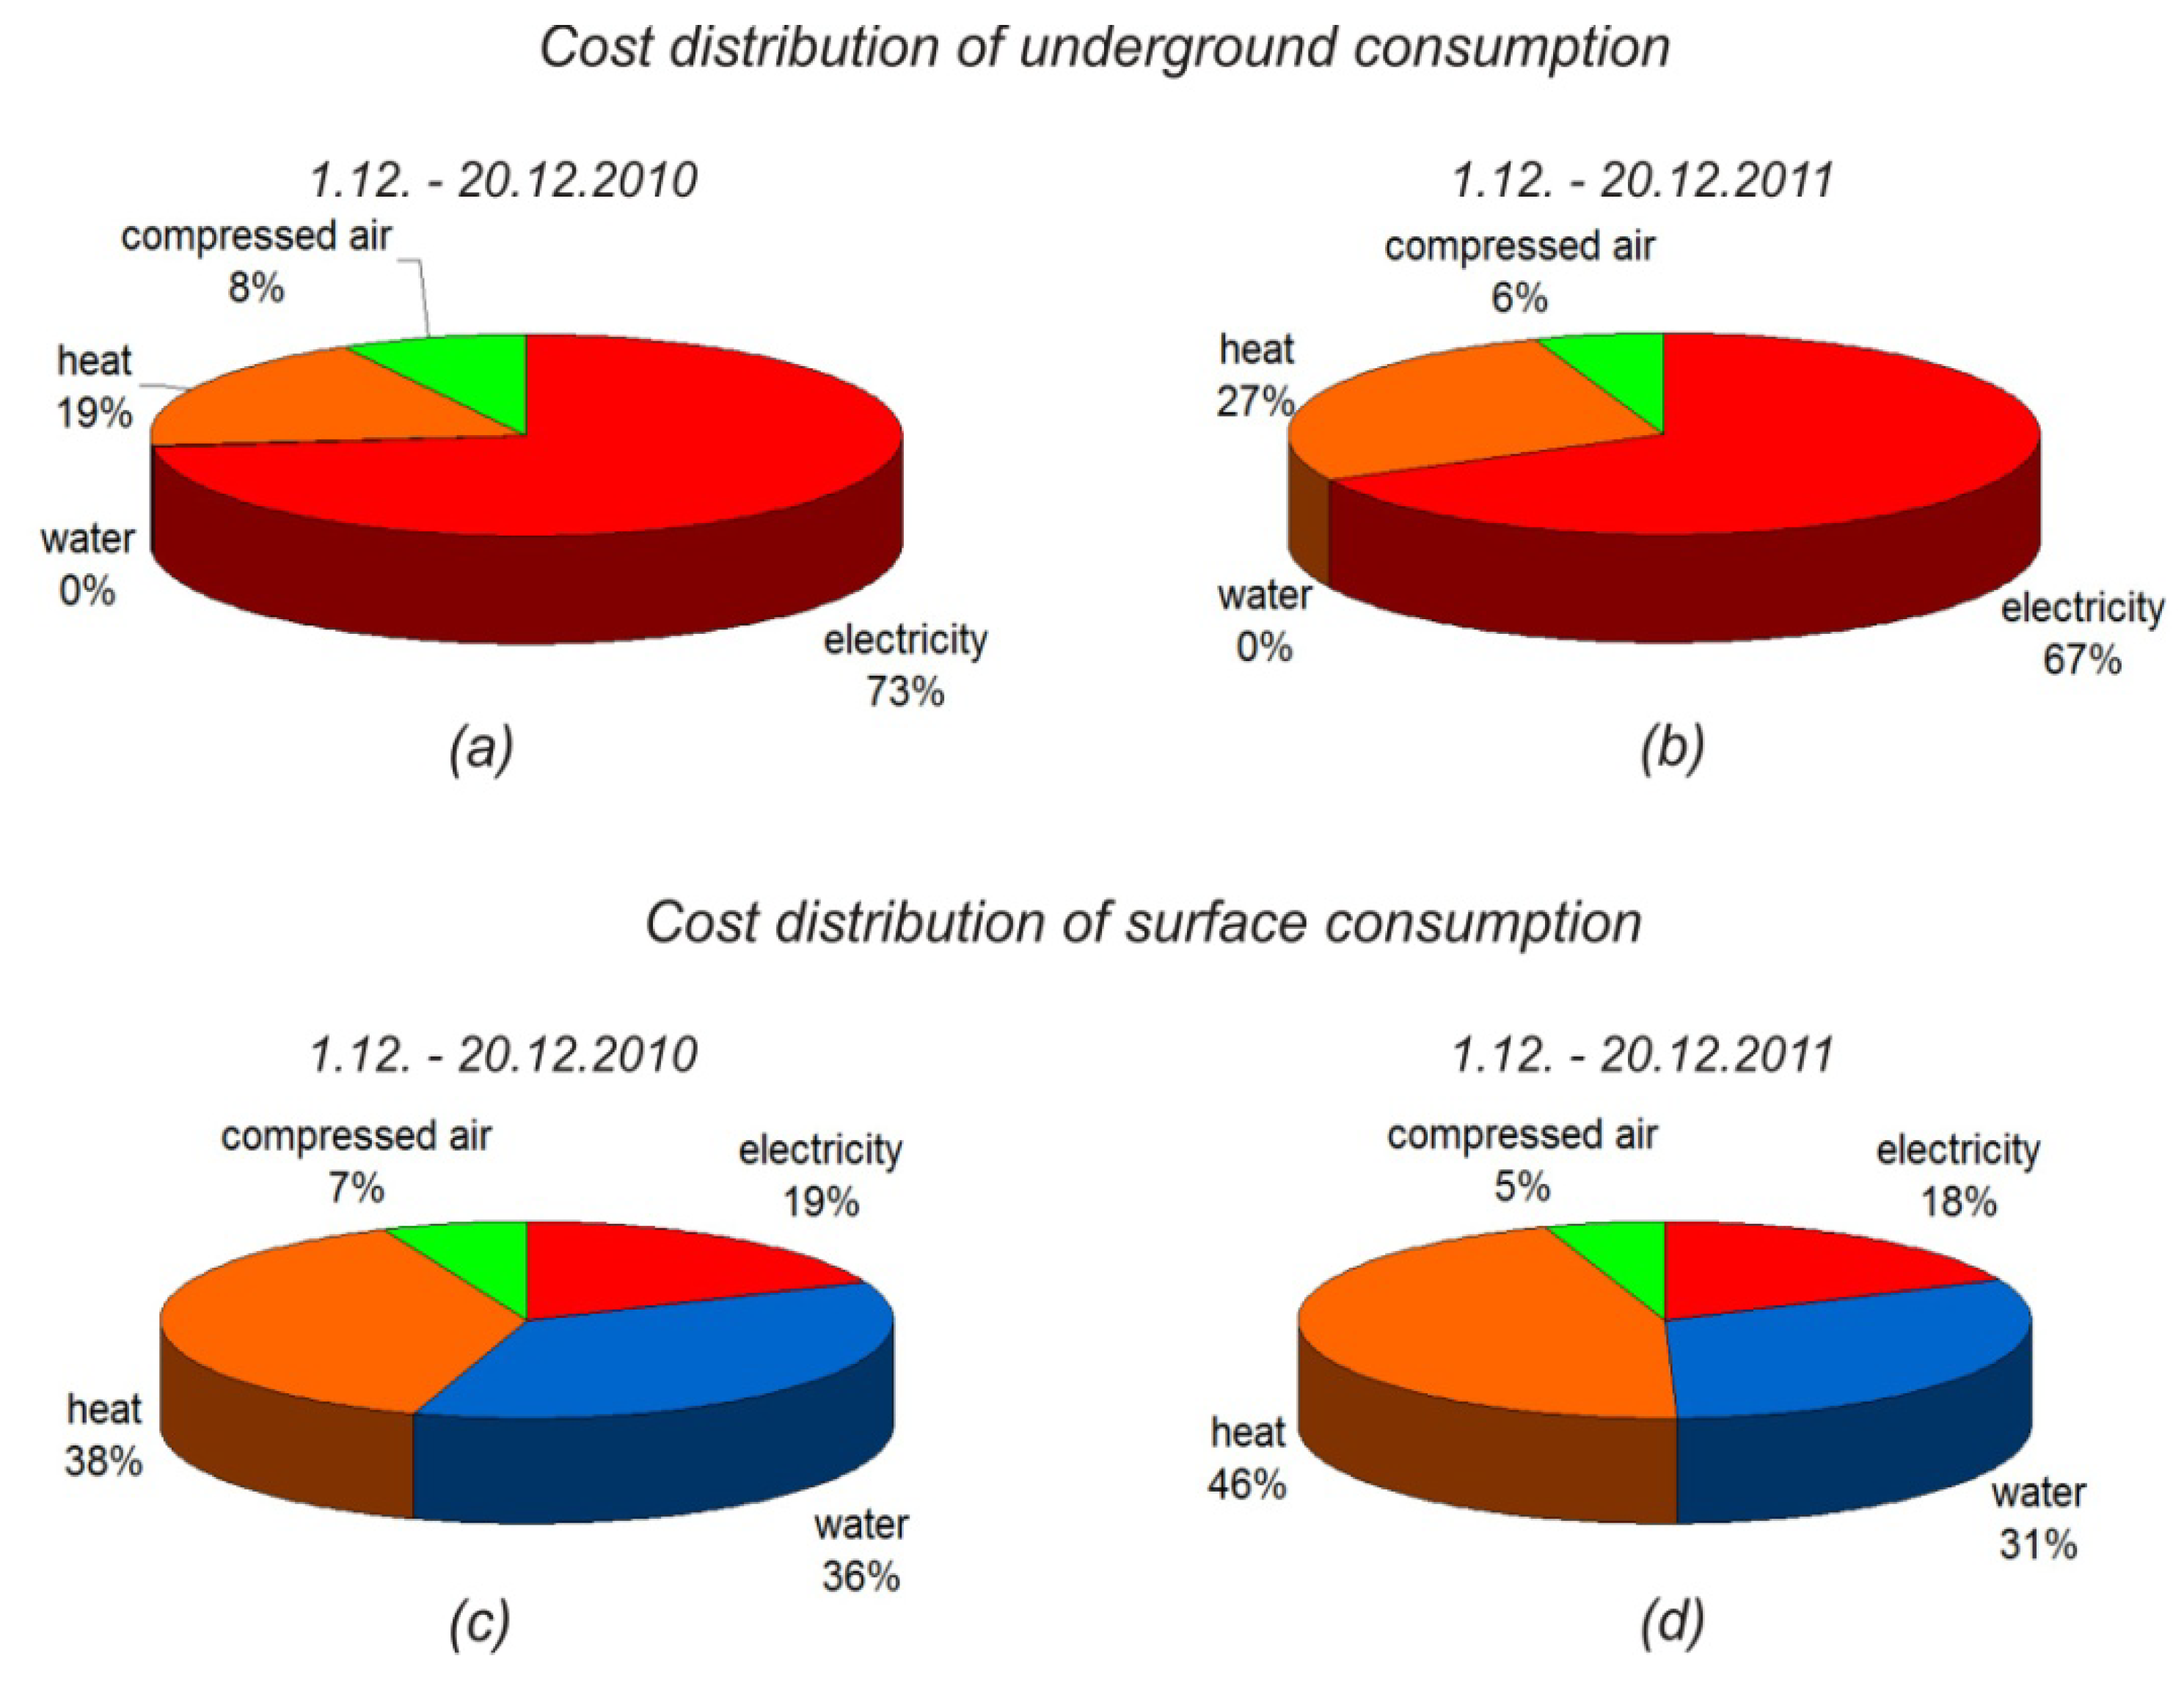
Figure 6 shows the cost percentage of different energy sources depending on their spending location for the period from 1 to 20 December in the years 2010 and 2011 (underground and surface consumption).
The great advantage of the CSRE system is possibility to monitor the energy consumption by different groups of consumers. In
Figure 7 and
Figure 8 are shown the electricity and heat consumption of the various consumers and various locations during the period from 15th to 28th of July and 5th to 18th of December in years 2010 and 2011, respectively.
Figure 6.
Cost distribution of energy consumption for the period from 1 to 20 December: (a) in underground mining processes in 2010; (b) in underground mining processes in 2011; (c) on surface processes in 2010; (d) on surface processes in 2011.
Figure 6.
Cost distribution of energy consumption for the period from 1 to 20 December: (a) in underground mining processes in 2010; (b) in underground mining processes in 2011; (c) on surface processes in 2010; (d) on surface processes in 2011.
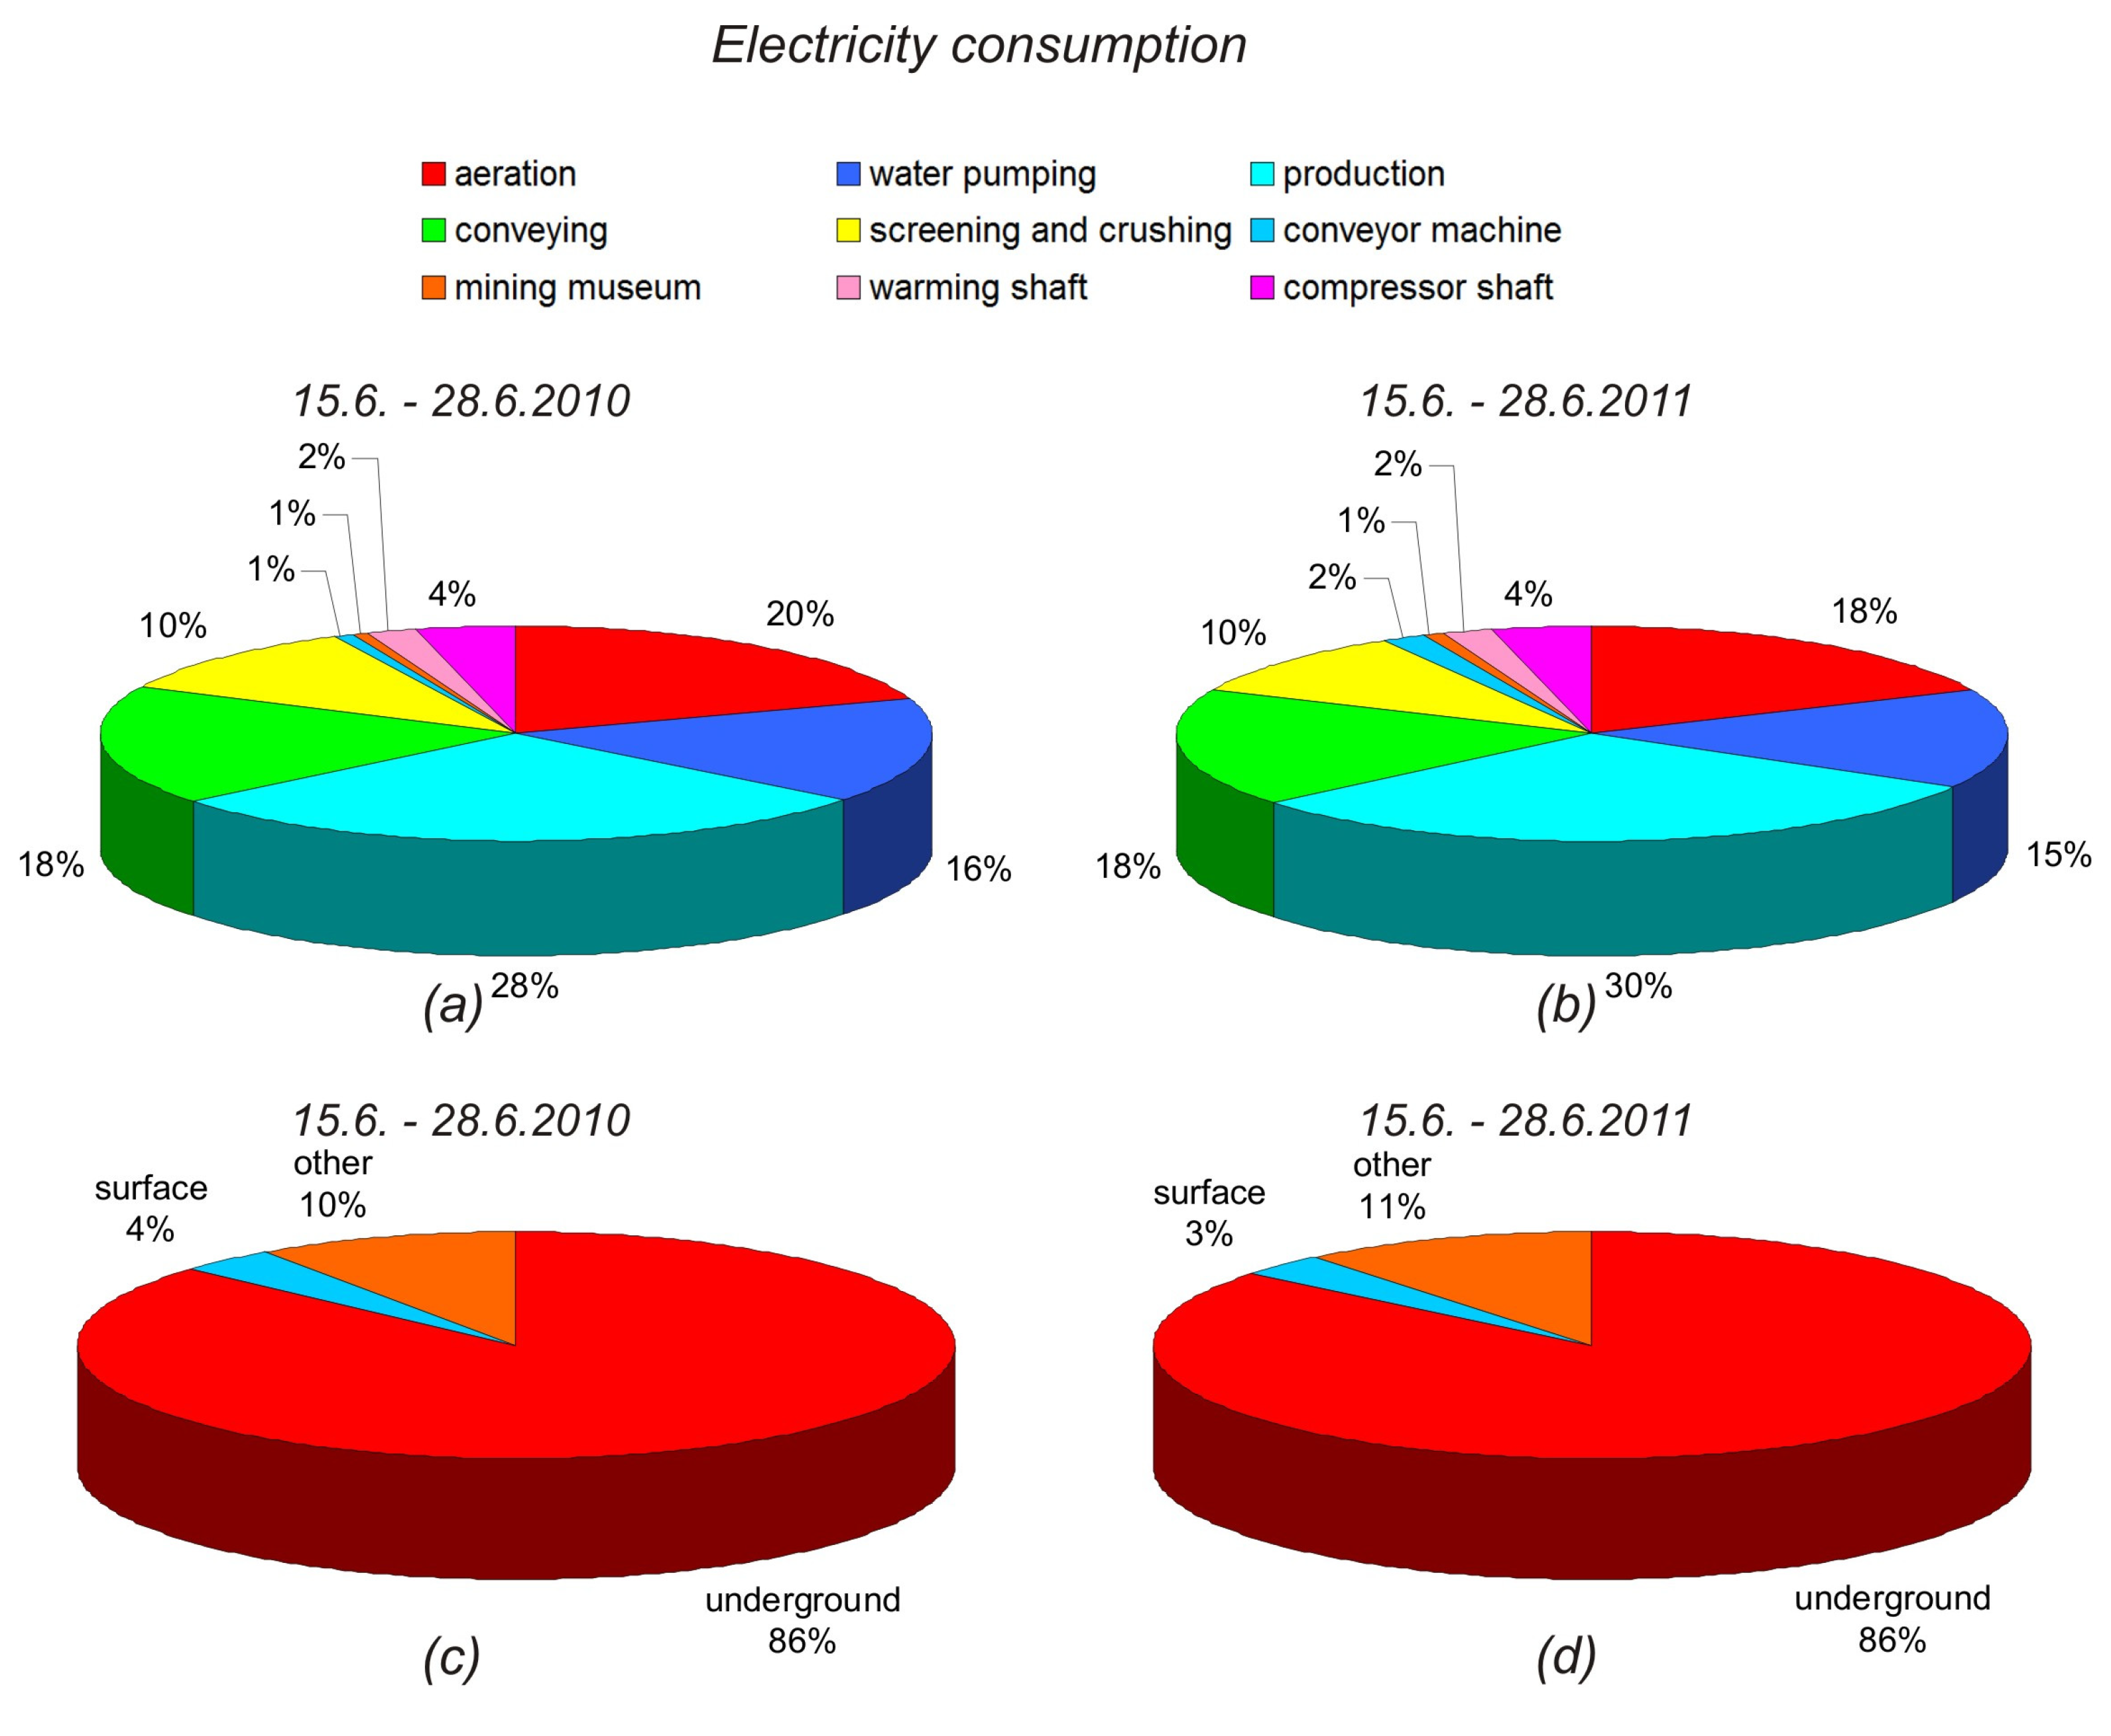
Figure 7.
Electricity consumption distribution in VCM for the month of July: (a) by different consumers in 2010; (b) by different consumers in 2011; (c) by location in 2010; (d) by location in 2011.
Figure 7.
Electricity consumption distribution in VCM for the month of July: (a) by different consumers in 2010; (b) by different consumers in 2011; (c) by location in 2010; (d) by location in 2011.
Figure 8.
District heating consumption distribution in VCM for the month of December: (a) by different consumers in 2010; (b) by different consumers in 2011; (c) by location in 2010; (d) by location in 2011.
Figure 8.
District heating consumption distribution in VCM for the month of December: (a) by different consumers in 2010; (b) by different consumers in 2011; (c) by location in 2010; (d) by location in 2011.
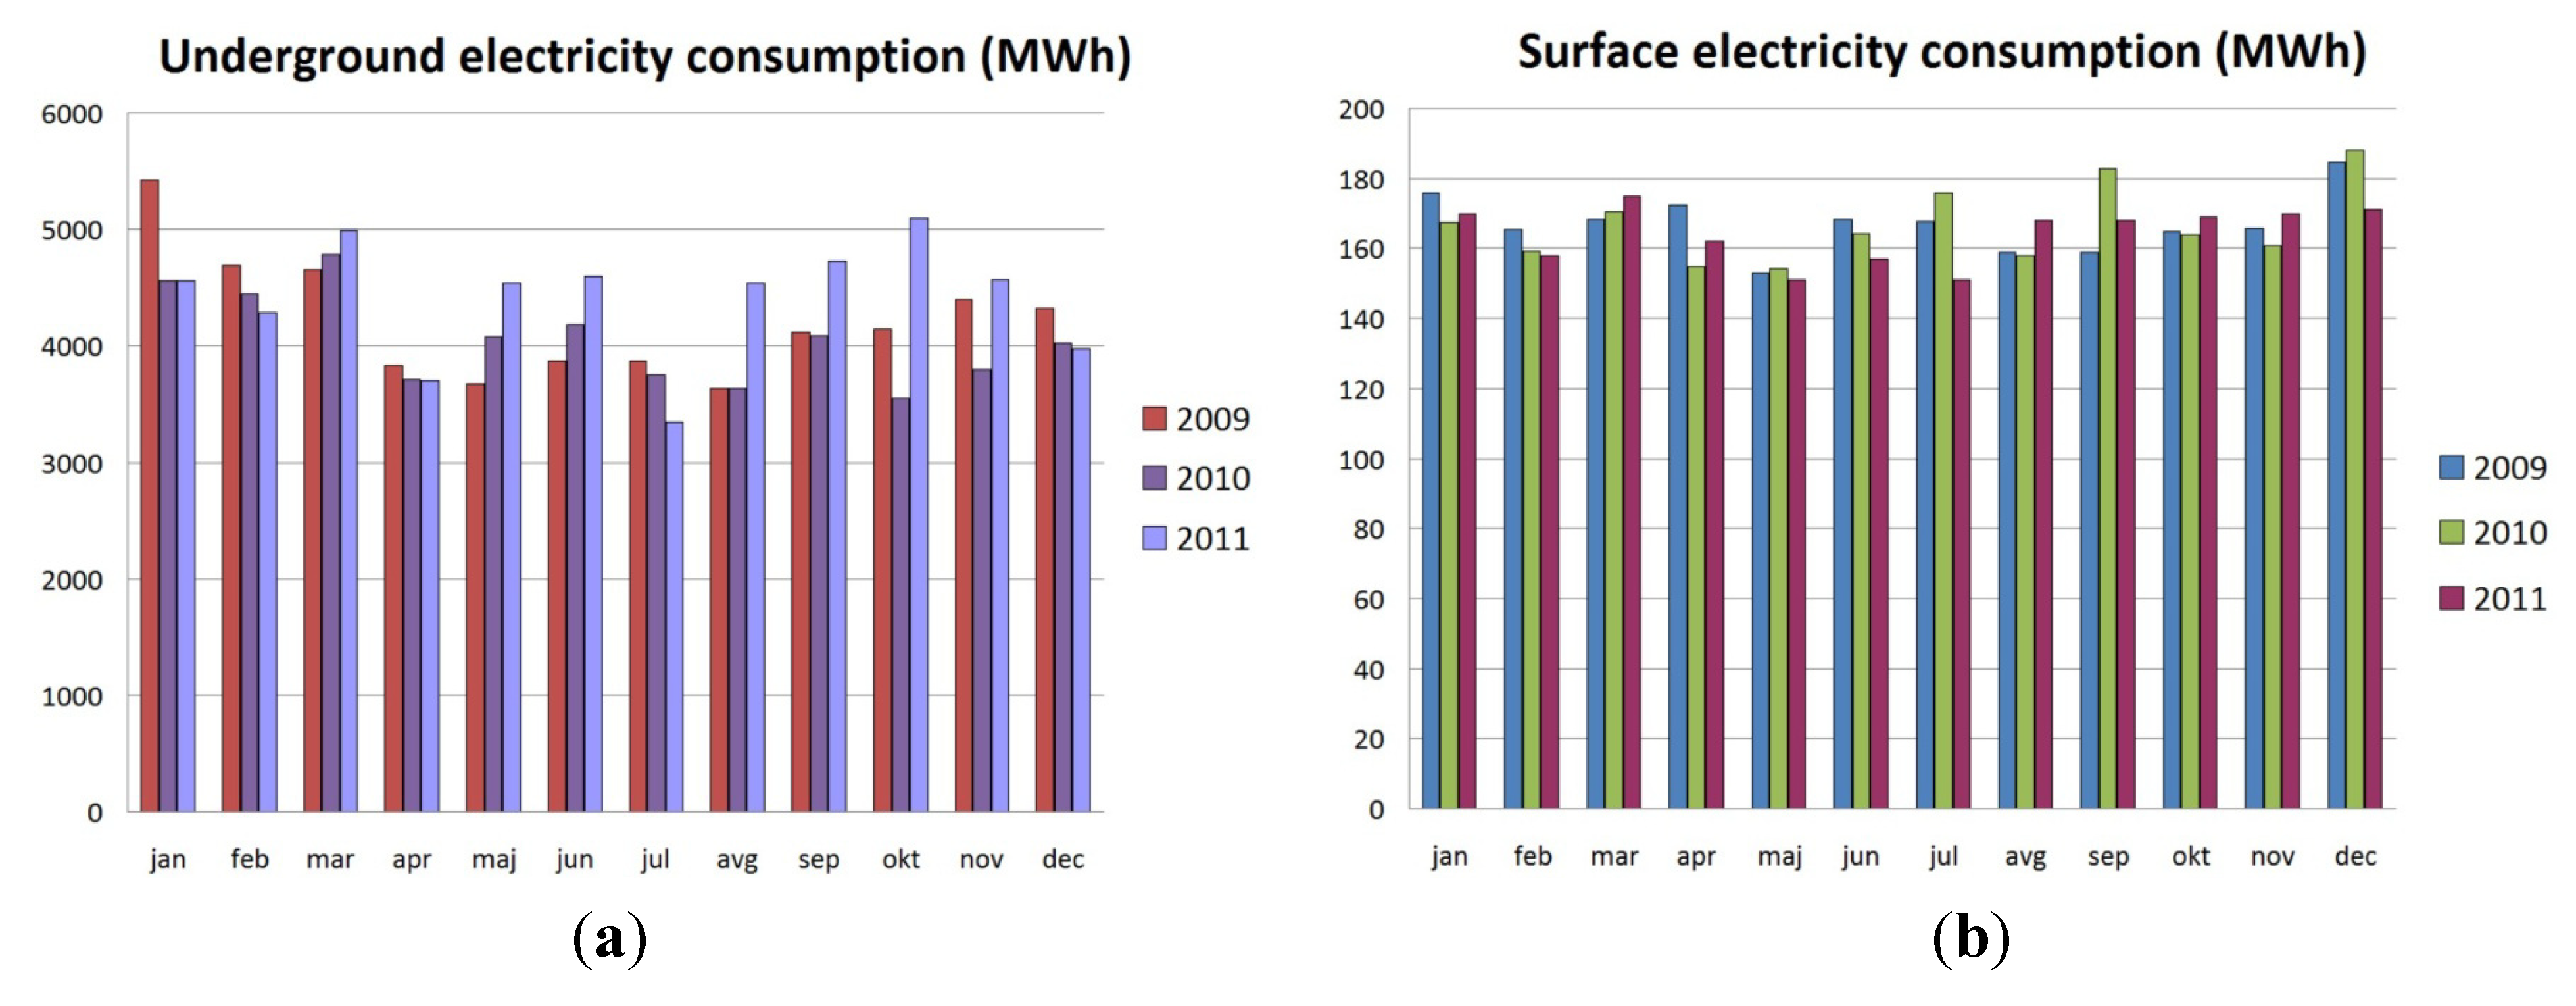
3.1. Electricity
Electric power represents about 70% of the cost of energy at the VCM (
Figure 6). The electricity consumption in year 2009 declined by 3% in comparison to 2008, as a result of modified work schedules, some energy saving measures implemented in the building lighting field (for example, substituting electric lamps with energy saving lamps), controlling prescribed scheduling of refrigeration equipment and staff behavior. The consumption in the year 2010 decreased by another 4%. The consumption of electricity for the underground production processes is approximately 95%, and the remaining 5% is used above ground. A large part of electricity consumption is associated with the continuous aeration of the underground mine [approximately 20%;
Figure 7(a,b)], which is independent of production levels. Of course, the production itself comprises the largest share of consumed electricity, which is around 30% [
Figure 7(a,b)]. In 2011 the coal production increased by 1.4%. By using CSRE we identified optimal aeration settings, which involve specially modified aeration modes for the non-working days. This is reflected in lower consumption of electricity as shown on the diagram in
Figure 9(a) (the modified aeration mode is operational since October 2010).
Figure 9.
Electricity consumption in years 2009 to 2011: (a) in underground mining processes; (b) on surface processes.
Figure 9.
Electricity consumption in years 2009 to 2011: (a) in underground mining processes; (b) on surface processes.
Since we use electricity for the production of compressed air, the reduction in the compressed air consumption is directly reflected in the reduced electricity consumption in 2010. On the other hand, in 2011 the consumption of compressed air increased by a quarter, which is directly reflected in the consumed electricity. Consumption of electricity on the surface is constant and depends on the number of working days [
Figure 9(b)] [
2].
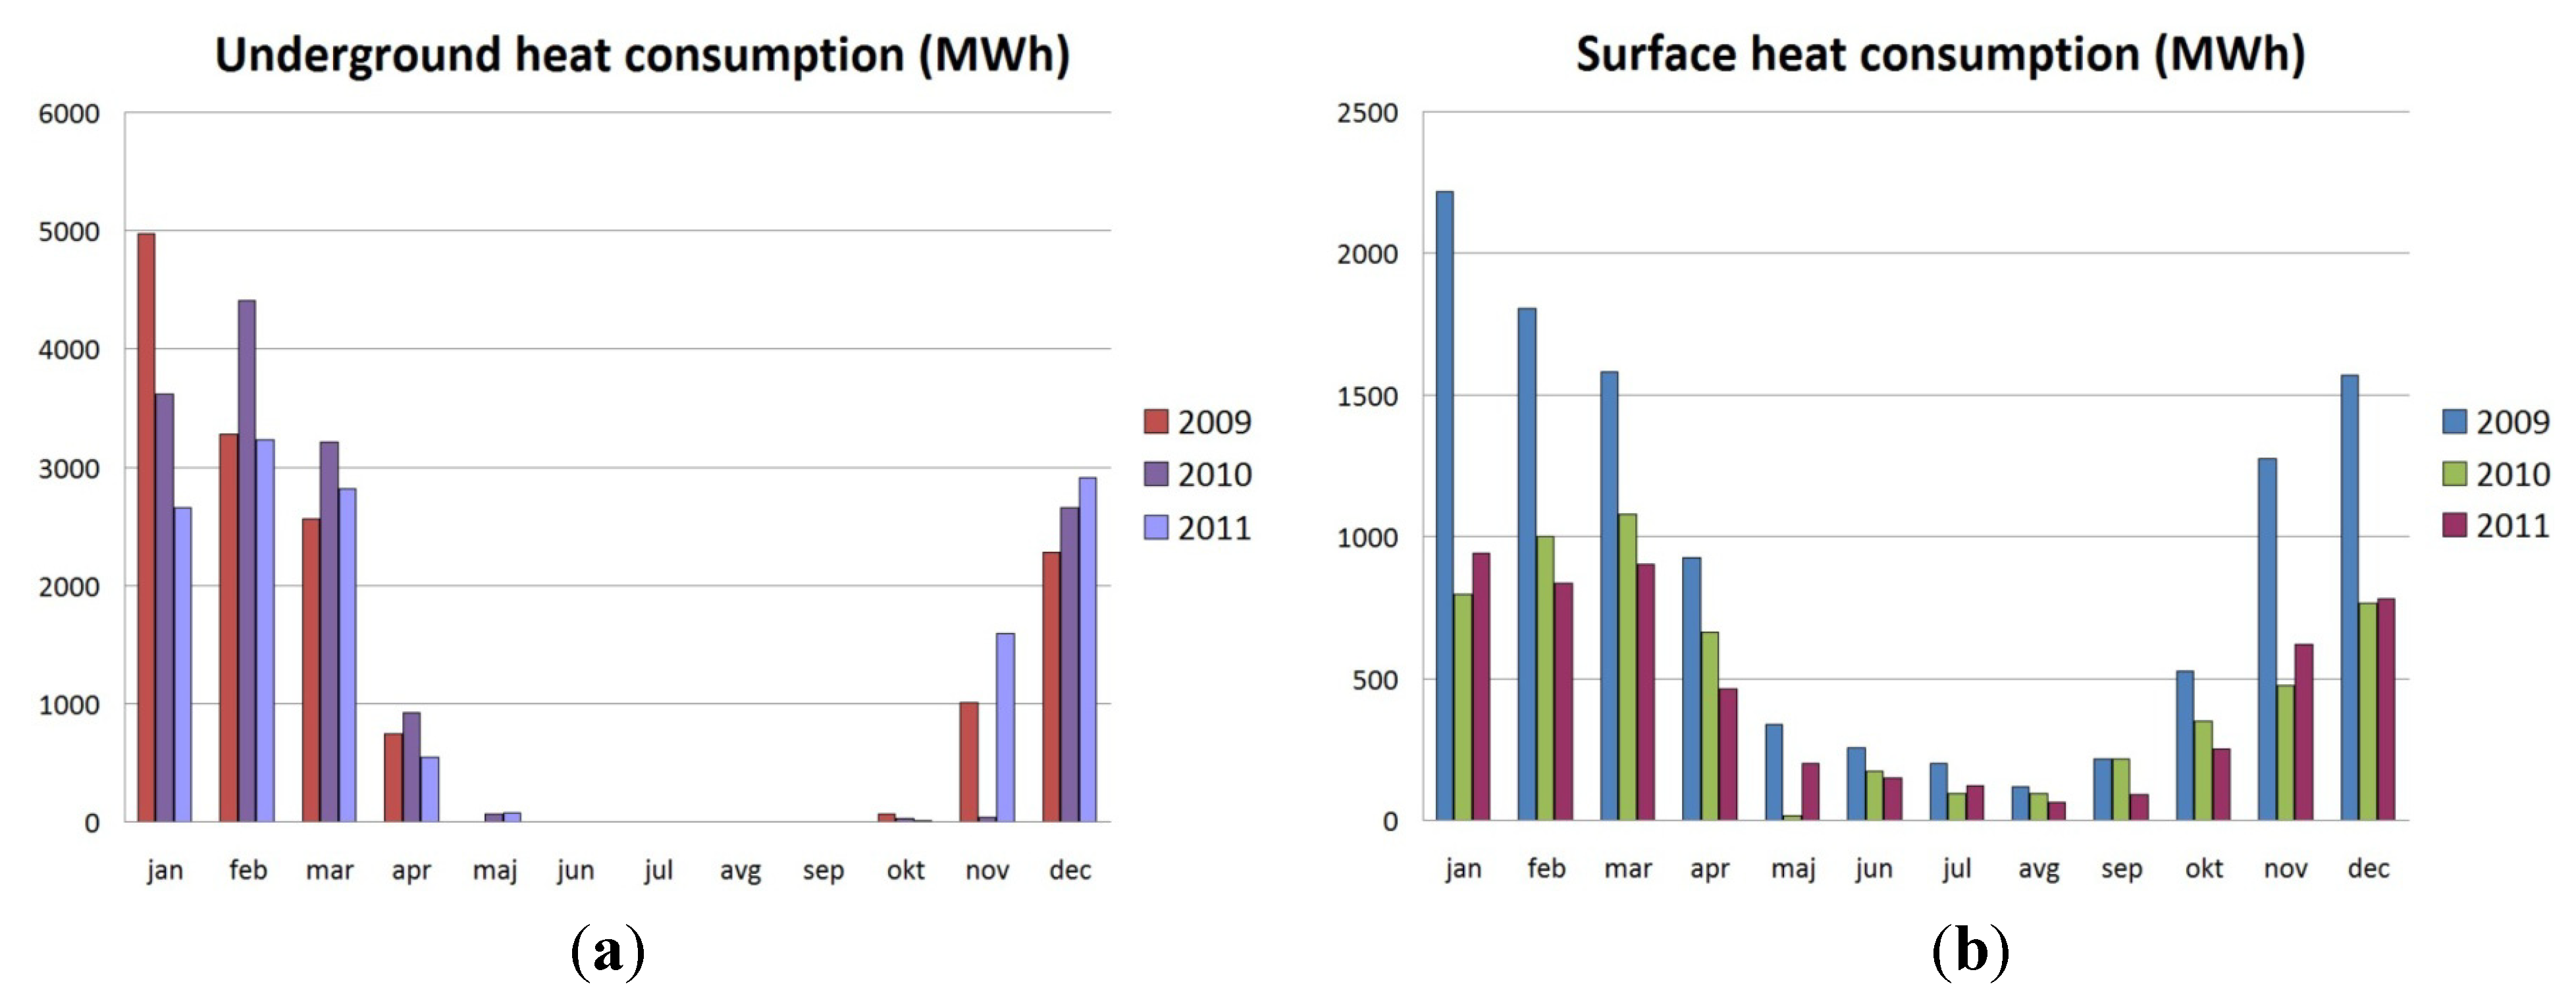
3.2. District Heating
The largest consumption of district heating is for underground mine warming and thus to ensure adequate working conditions that depend on the outside environment temperatures and the preferences of users. The dynamics of heat consumption by month are shown in the diagrams in
Figure 10. We saw increased heat consumption at the beginning of year (winter time), but minor in the summer, when the environmental temperatures are high. By monitoring the current consumption with the CSRE we are able to regulate the temperatures for underground mine and buildings heating as well for sanitary water heating.
Figure 10.
Heat consumption in years 2009 to 2011: (a) in underground mining processes; (b) on surface processes.
Figure 10.
Heat consumption in years 2009 to 2011: (a) in underground mining processes; (b) on surface processes.
With optimal temperatures we decrease heating consumption and achieve lower heating costs, resulting in a reduction of installed power from 23 MW to 21.2 MW [
8]. In 2010, in comparison to the year 2009, the reduction in heat consumption is approximately 11%. An additional 7% reduction in 2011 is mainly due to a higher that average air temperature in 2011, which was 1.2 °C higher than in 2010.
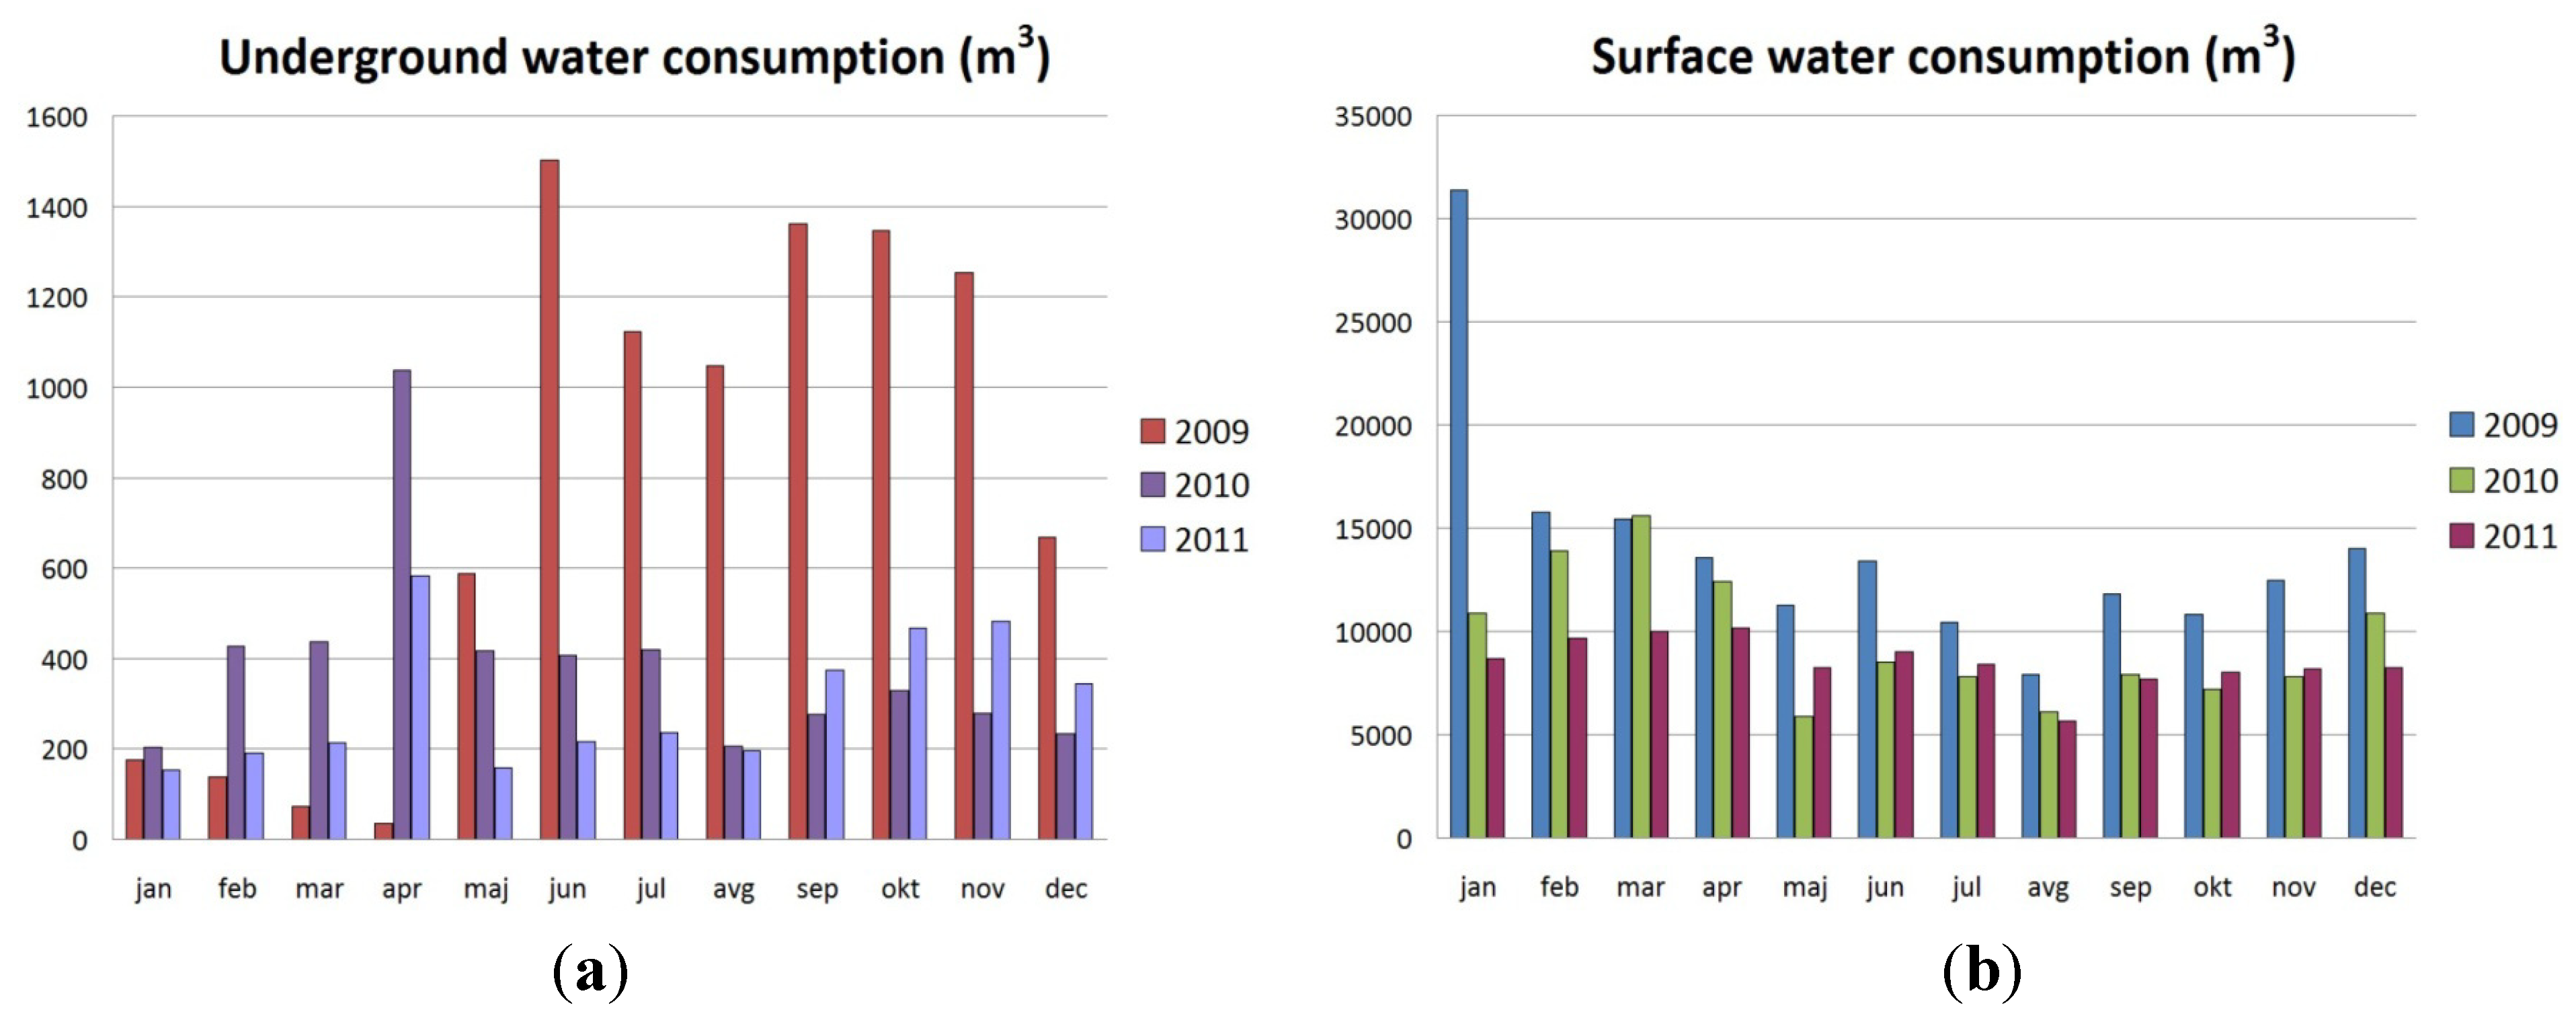
3.3. Drinking Water
The total VCM water consumption in 2009 was nearly 180,000 m
3. In the year 2010 the consumption was reduced significantly, by about 30% compared to the prior year. The biggest impact on reduction came from the renovation of the hydrant system in May, which is evident from the diagrams in
Figure 11.
Figure 11.
Water consumption in years 2009 to 2011: (a) in underground mining processes; (b) on surface processes.
Figure 11.
Water consumption in years 2009 to 2011: (a) in underground mining processes; (b) on surface processes.
By monitoring the consumption in real-time through CSRE we are able to inform consumers about water consumption and thus influence employees to make economical use of resources. In 2011, in comparison to the year 2010, the reduction in drinking water consumption was an additional 12%. Underground water consumption in 2011 was reduced due to the regular daily checks and maintenance on the pressure reducing station. On the surface water consumption, the largest effect resulted from a bathroom renovation in January 2011.
3.4. Compressed Air
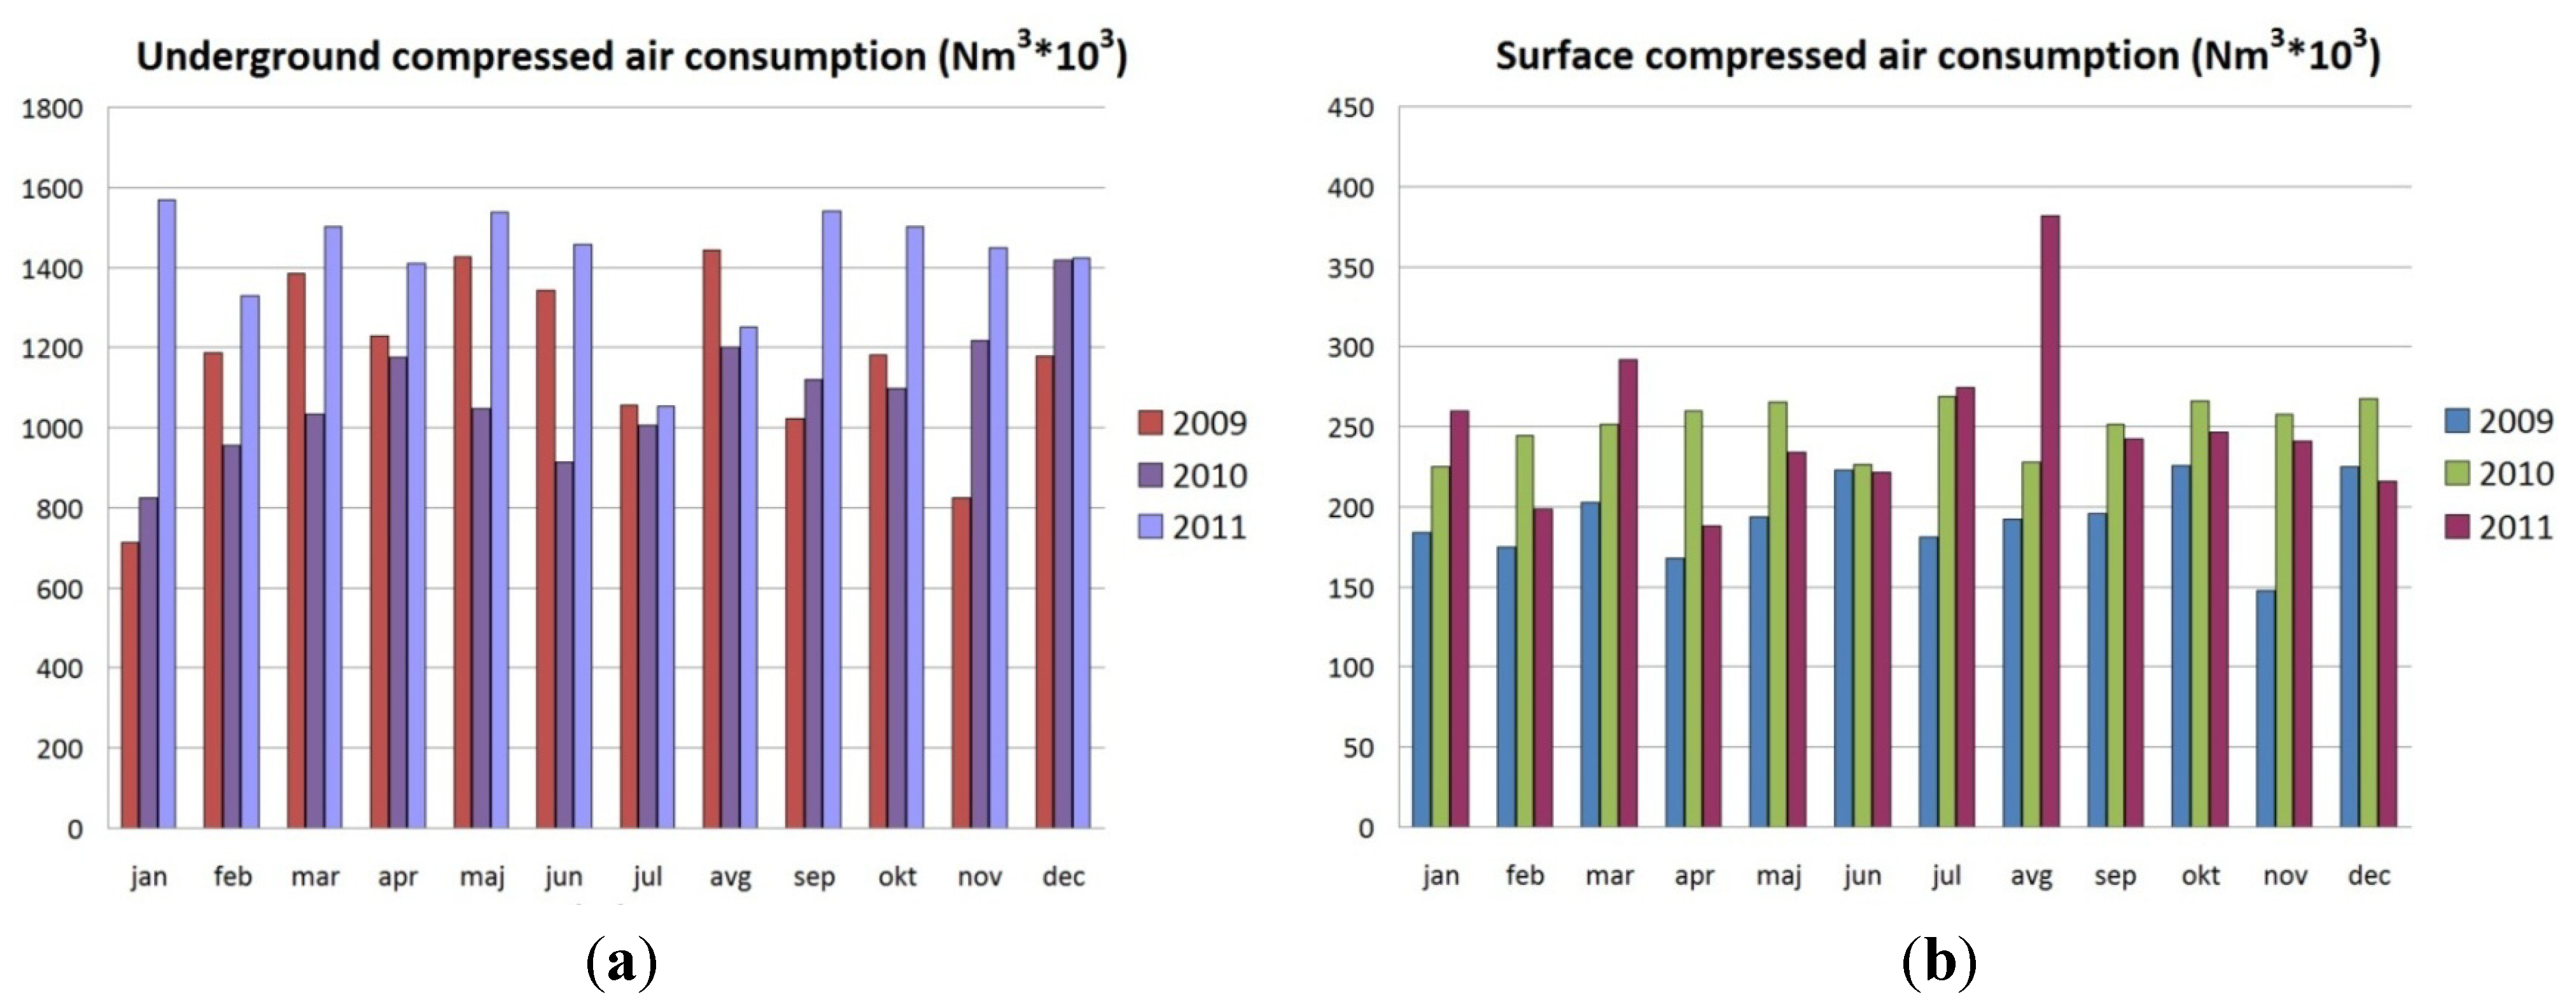
The consumption of compressed air in 2009 was 13% less than in 2008. The negative trend of compressed air consumption is a result of the regular maintenance work on pipelines and thus reduction of air losses. In 2010, the consumption decreased by another 2% in comparison to the year 2009. With CSRE we followed target consumption, reduced the use of compressed air in the underground mine processes and also reduced the losses on the pipeline system (
Figure 12).
Figure 12.
Compressed air consumption in years 2009 to 2011: (a) in underground mining processes; (b) on surface processes.
Figure 12.
Compressed air consumption in years 2009 to 2011: (a) in underground mining processes; (b) on surface processes.
Unfortunately, from July 2010, the losses due to pipeline leakage increased. In 2011 additional maintenance work on the pipeline has been carried out. However, underground consumption in 2011 increased due to higher production targets and operational plans. Even though that production does not directly affect the consumption of compressed air, it is affected by the number of working days, the number of underground roadway construction sites and their daily advance and mine equipment assembling. In comparison to 2010, in 2011 the consumption of compressed air has increased by 25%.
Reviewing advances related to energy savings by applying energy monitoring methodology and software solutions it is clear that achievements are significant and that there are numerous scientific research, suggested and applied solutions for monitoring energy consumption, improvements is some mining activities and application of Best Available Technologies (BAT) for the purpose of energy consumption reduction. Some designed solutions, as well as some software solutions are generally related to specific parts of mining activities. Other solutions encompass energy consumption monitoring and energy savings in several combined mining activities. As many studies have shown, the benefits of Ventilation-On-Demand (VOD) are numerous. Most notably, implementation of a VOD system has been shown to provide a 20%–50% reduction in ventilation energy costs [
9,
10], Recent studies carried out under the Deep Mine Research Programme have shown that cyclical operation of cooling and ventilation systems can lead to significant cost savings [
11,
12]. The Motor Challenge program promotes a “Systems Approach” rather than a “Component Approach” when evaluating projects for energy efficiency [
13]. REMS Winder software is a fully automated on-site Real-Time Energy Management System (REMS) that controls electrically operated mining equipment via the SCADA system [
14]. An Energy Management Information System (EMIS) is an important element of a comprehensive energy management program. It provides relevant information to key individuals and departments that enables them to improve energy performance [
15].
As already mentioned, the process of obtaining coal is specific. Mechanized extraction of coal by the use of the long wall method was developed by VCM and it is patent-protected. Having in mind that this mining method is not applied in other mines in the region and in EU, comparison to other mines would not provide efficient results, because different mining activities are performed. On the other hand, results of analyses like those presented in this paper are typically considered confidential information by the mining companies and because of that such data is difficult to obtain. Large mining companies, which are operating several mines all around the World include:
Glencore (one of the world’s leading integrated producers and marketers of commodities. Glencore has worldwide activities in its industrial operations in 33 countries);
Xstrata (operations and projects in more than 20 countries in North America, South America, Europe, Africa and Australia)
Rio Tinto (five principal product groups—Aluminum, Copper, Diamonds &Minerals, Energy and Iron Ore—plus two support groups: Technology & Innovation and Exploration)
RAG Aktiengesellschaft (collieries in North Rhine-Westphalia and Saarland);
UK Coal (Deep mines—Daw Mill colliery, Kellingley colliery, Thoresby colliery, Harworth colliery, number of surface mines in Durham, Northumberland, Shropshire and Derbyshire);
Consol Energy Inc. (produced bituminous coal from 13 mining complexes in the United States);
Inmet Mining Corporation (Turkey, Spain, Finland, Canada, Papua New Guinea, Panama);
China Coal Energy Company Limited (Pingshuo Mining Area—6 open pit and underground mine, Datun Mining Area—6 mines, Liliu Mining Area, Dongpo Coal Mine, Nanliang Coal Mine), etc.
These are mainly producing different type of product (energy-coal, ferrous and non-ferrous) and in their annual and technical reports are providing data on global energy savings for all mines within the company, regardless to the type of the resource [
16,
17,
18,
19,
20,
21,
22,
23]. Therefore, analysis related to energy savings in these companies, could not be used for comparison to efficiency of applied solution in VCM.
4. Conclusions
The presented system has proven to be effective in meeting the goals, which include the establishment of system for the review of energy consumption, for monitoring the quantity and costs of energy consumption, cost savings in energy usage, for optimizing energy use in all processes and to measure consumption by individual consumers. Key performance indicators show a constant decline in consumption of electricity, heat, drinking water and compressed air at the VCM. Because of measures taken and the effective energy management, specific energy consumption decreases each year.
In recent years, VCM has been able to reduce overall energy consumption by 8 to 10 percent by the appropriate energy efficiency and rational energy use, which would be more difficult or even impossible without establishment of the CSRE. For example, in the year 2010, after the establishment of the CSRE monitoring system, the total cost of energy consumption in VCM was approximately 20% less of the total energy cost in the year 2009. The monitoring actions resulted in efficiency improvement, a considerable reduction in energent consumption and consequently in reduction of emissions. According to 2010 energy costs in 2011 increased for 15%, but with the use of CSRE we know that this is due to increased coal production and higher energy prices in 2011.
According to a 2007 study by the U.S. Department of Energy, entitled the Mining Industry Energy Bandwidth Study [
24], in which energy-saving potential of key processes in coal mining industry have been analyzed, the estimated saving due to implementation of best practices in coal mines could save approximately 17% of the total energy consumption and furthermore with a combined energy savings from best practice investments and further Research & Development could allow for total savings of 49% of the total energy consumption of the coal mining industry. In recent years the Velenje Coal Mine has reduced energy consumption by approximately 10%, simply by appropriate energy efficiency and rational energy use. Further energy-saving opportunities exist if the current processes are improved by implementing more energy-efficient practices and by using advanced technologies. The principal advantage of the presented system is its flexibility in improvements. In the future we plan to install a module for forecasting energy consumption for the target production and also for actual weather conditions as shown in [
25]. We can conclude that the CSRE is certainly quite an acquisition for the Velenje Coal Mine, but with future upgrades this system promises even more.

