Abstract
Worldwide, algal biofuel research and development efforts have focused on increasing the competitiveness of algal biofuels by increasing the energy and financial return on investments, reducing water intensity and resource requirements, and increasing algal productivity. In this study, analyses are presented in each of these areas—costs, resource needs, and productivity—for two cases: (1) an Experimental Case, using mostly measured data for a lab-scale system, and (2) a theorized Highly Productive Case that represents an optimized commercial-scale production system, albeit one that relies on full-price water, nutrients, and carbon dioxide. For both cases, the analysis described herein concludes that the energy and financial return on investments are less than 1, the water intensity is greater than that for conventional fuels, and the amounts of required resources at a meaningful scale of production amount to significant fractions of current consumption (e.g., nitrogen). The analysis and presentation of results highlight critical areas for advancement and innovation that must occur for sustainable and profitable algal biofuel production can occur at a scale that yields significant petroleum displacement. To this end, targets for energy consumption, production cost, water consumption, and nutrient consumption are presented that would promote sustainable algal biofuel production. Furthermore, this work demonstrates a procedure and method by which subsequent advances in technology and biotechnology can be framed to track progress.
1. Introduction
The aspiration for producing algal biofuel is motivated by the desire to: (1) displace conventional petroleum-based fuels, which are exhaustible, (2) produce fuels domestically to reduce energy imports, and (3) reduce greenhouse gas emissions by cultivating algae that re-use carbon dioxide emitted from industrial facilities. In theory, algae have the potential to produce a large amount of petroleum fuel substitutes, while avoiding the need for large amounts of fresh water and arable land [1,2,3]. These attributes have created widespread interest in algal biofuels. In practice, however, profitable algal biofuel production faces several important challenges. The goal of the research presented in this paper is to examine and quantify the extent of some of those challenges with an eye towards identifying critical areas for advances in the development of algal biofuels.
For algae to be a viable feedstock for fuel production: a significant quantity of fuel must be produced, the energy return on investment (EROI) of the life cycle must be greater than 1 (and practically greater than 3 [4]), the financial return on investment (FROI) should be greater than 1, the water intensity of transportation using algal biofuels should be sustainable, and nutrient requirements should be manageable. This study examines these criteria for two cases using second-order analysis methods described by Mulder and Hagens [5], which include direct and indirect operating expenses, but neglect all capital expense. Process-specific terminology is based on the reporting framework established by Beal et al. [6].
There are several energy carriers and co-products that can be produced from algae, such as renewable diesel, electricity, hydrogen, ethanol, pharmaceutics, cosmetics, and fertilizers [7,8,9]. While non-energy co-products might enable economic viability of algal biofuel products in the short term, large scale production would quickly saturate co-product markets. Thus, in the long term, production of domestic, renewable, low-carbon fuels as an alternative to conventional fuel sources remains the main motivation for researching large-scale algae production. Consequently, this research focuses on the energy products. While bioelectricity from algal feedstocks is one possible pathway for energy production, this work considers only the co-production of bio-oil (a petroleum fuel substitute) and bio-gas (i.e., methane, which is a natural gas substitute) because those two fuels are produced from the experimental process at UT and align more directly with displacing petroleum [10,11,12]. Further, both bio-oil and bio-gas are feedstocks that can be combusted within additional technologies to produce electricity.
Because the intent of this research is to analyze and anticipate a mature algal fuels industry that does not yet exist, researchers have two options for conducting a process analysis as in this paper: (1) use data derived from experimental processes followed by scaling analyses (recognizing that lab-scale experiments are inherently sub-optimal) or (2) use estimated data from models of future commercial-scale systems. Both of these approaches are used in this study. Firstly, an Experimental Case is described, which is based on unique direct end-to-end measurements (from growth through biocrude separations) performed in a controlled indoor/outdoor laboratory setting at The University of Texas at Austin. Secondly, a Highly Productive Case is described, which is based an optimistic analytical model that incorporates the technology and pathways of the Experimental Case.
We encourage other researchers to present (life cycle) metrics of alternative algal technology pathways in the step-by-step manner we demonstrate. The reasons for presenting life cycle metrics at multiple stages are threefold: (1) easier facilitation of future life cycle assessment (LCA) harmonization and meta-analyses that can effectively compare many independent studies, (2) better tracking of technological progress over time, and (3) better comparison of competing technologies (e.g., capital intensive versus resource intensive). The benefits of LCA harmonization were demonstrated by Farrell et al. [13] in comparing net energy for corn ethanol. The National Renewable Energy Laboratory of the US Department of Energy tests and tracks photovoltaic cell efficiencies over time such that specialists and the general public can easily track the rate of progress, which is beneficial for the community as a whole. By doing so, one is able to observe the improvements that were made to photovoltaic cell designs over the course of research and development, providing a vantage point for researchers and investors alike to gauge the progress in that energy production technology. The authors believe algal energy processes would benefit from similar indicators and analyses, and this manuscript presents its results in that spirit of tracking technological metrics starting at the experimental batch scale. Additionally, the calculation of multiple life cycle indicators (e.g., EROI, FROI, water use, resource consumption, land use, air emissions, etc.) from the same experimental or modeled processes provides congruent indicators that emphasize the real design tradeoffs (e.g., water versus electricity inputs).
The work presented adds to research in the authors’ prior publications, which presented the second-order energy return on investment (2nd O EROI) analyses for an Experimental Case and a modeled Highly Productive Case. In the previous work, the 2nd O EROI, which is a ratio of the energy output of a system to the energy input for that system, for these two cases was determined to be 9.2 × 10⁻⁴ and 0.22, respectively [14]. That study illustrated the energetic challenges associated with producing algal biofuel. The present study extends the previous work with five new analytical thrusts to determine (1) the partial FROI, (2) the second-order water intensity of transportation using the algal biofuels produced, (3) the nitrogen constraints, (4) the carbon constraints, and (5) the electricity resource constraints for the Experimental Case and the Highly Productive Case, respectively. The cost, water, and resource results from this new work are presented in conjunction with the previously determined energy results. Thus, for our two cases (one experimentally measured and one analytically derived), this present research serves as a comprehensive and coherent evaluation of the algal biofuel process. It is important that LCAs demonstrate relationships among multiple metrics that are calculated. By reporting multiple metrics for the same algal energy processes, this paper presents an understanding of how one metric (e.g., water consumption) is linked to another (e.g., energy production).
Although the Experimental Case is not representative of commercial biofuel production due to significant artifacts that are inherent to lab-scale (vs. industrial scale) production, it represents the first known end-to-end experimental characterization of algal biocrude production at relatively large scale (thousands of liters). While other experiments have been performed at similar scale, they did not conduct the comprehensive mass and material balances that are presented here. Conversely, the data used for the Highly Productive Case are based on optimistic assumptions for operating within the specific production pathway in this study. To place the Highly Productive Case in context with other analyses that have been published, each assumption is compared with those from other studies in the literature.
Many prior studies have been performed, each with a slightly different focus: some have emphasized algal biomass productivity, estimated algal oil productivity per acre of land, or evaluated only a few constraints on algal biofuel production (e.g., energy requirements, cost, etc.) [15,16,17,18]. This paper takes the approach of considering many constraints simultaneously (energy, cost, water, and resources) to give a more complete assessment. To this end, quantitative targets are presented in the “Conclusions” that, if achieved, would enable algal biofuel production at large scale.
2. Methods and Materials
The production pathway and experimental methods used in this analysis has been described in detail in previous publications [6,14,19,20]. Furthermore, the materials and energy consumption data used in the Experimental Case and the Highly Productive Case are taken from Beal et al. that calculated the second-order energy return on (energy) investment (2nd O EROI) [14]. The term “second-order” refers to the inclusion of direct energy inputs (e.g., electricity consumed for pumping) and indirect energy inputs for consumed materials (e.g., the energy embedded in nitrogen fertilizer that is consumed). Details regarding data collection and uncertainty analysis in the Experimental Case and modeling calculations in the Highly Productive Case can be found in the previous publication [14] and at greater length in a publically available doctoral dissertation (cf. Chapter 4, Appendix 4A, and Appendix 4B of [19]). The work presented herein expands those datasets to incorporate the new analyses mentioned above (water use, nutrients use, FROI, etc.).
Figure 1 shows that the biocrude production process for both of our analyzed cases consists of algal cultivation, harvesting (i.e., concentration) with centrifugation or chemical flocculation, cell lysing via electromechanical pulsing, and neutral lipid recovery using a microporous hollow-fiber membrane contactor. The Experimental Case is comprised of growth and processing data from five relatively large batches (970–2000 L each), with a total processed volume of about 7600 L. The energy and material inputs that were measured are shown in Figure 1 and the energy outputs are modeled to include bio-oil and biomass fuel (methane) (refining was not conducted during the experiments). The Highly Productive Case models energy-efficient growth and processing methods with higher biomass and lipid productivities.
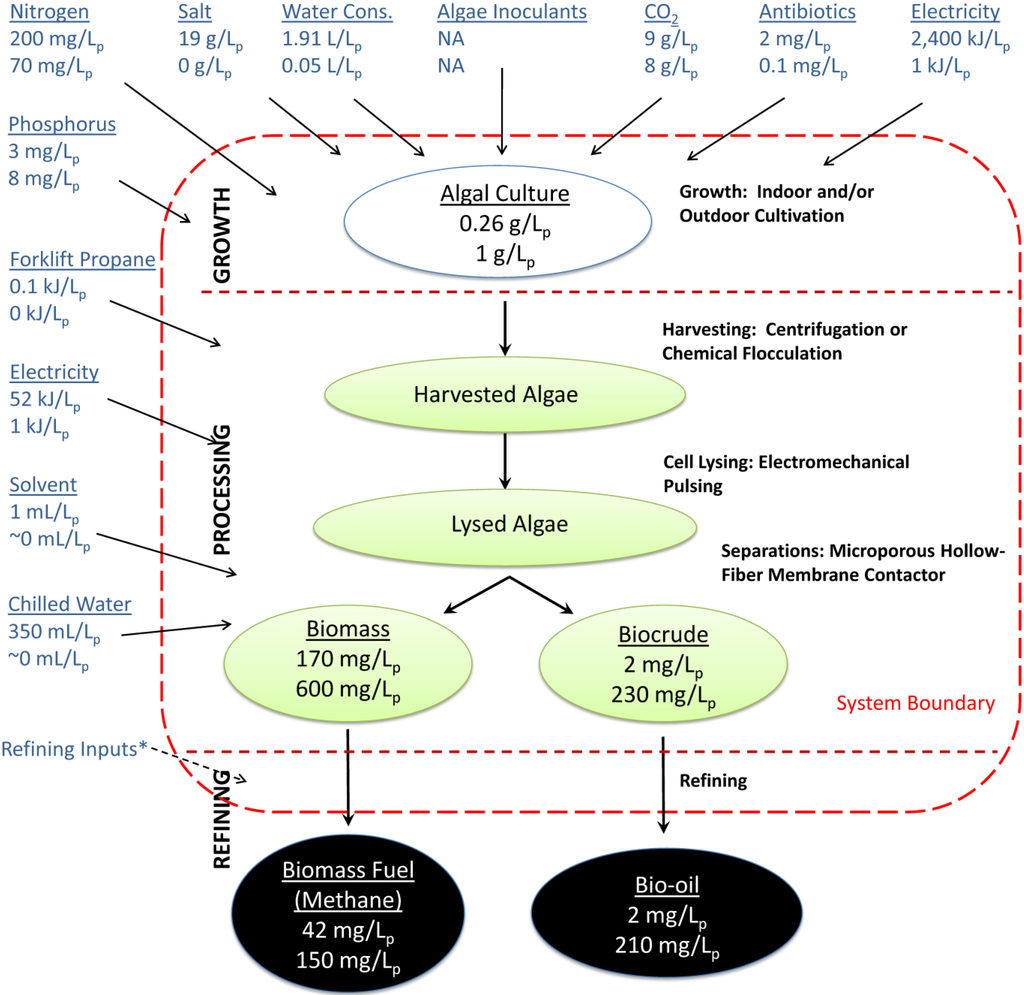
Figure 1.
The production pathway is represented as three phases: growth, processing, and refining [6]. The data used for each input and output are shown for the Experimental Case (top) and Highly Productive Case (bottom). For the Experimental Case, the material and energy inputs crossing the system boundary were measured for five relatively large scale batches (970–2000 L, each), grown and processed at The University of Texas at Austin, except for the refining inputs (which were modeled from literature data, and are noted in the figure with an asterisk (*) [14]. The Highly Productive Case is an analytical model of a similar production pathway operated more efficiently.
2.1. Experimental Case
The Experimental Case is comprised of five batches, ranging in volume from 970 L to 2000 L each. A marine species of Chlorella (KAS 603, provided by Kuehnle AgroSystems, Inc.) was used for all batches and was grown in four different growth stages: flasks, airlift photobioreactors, greenhouse tanks, and covered raceway ponds.
This growth process provided a stable method for scaling up cultivation volumes, although, the inherent inefficiencies of operating at lab-scale required high energy and material inputs (an artifact described in detail by Beal et al. [14]) and yielded relatively low biomass and lipid productivities, as listed below. Energy and material consumption were measured throughout the entire cultivation process and these data have been reported previously [14]. The amounts of resources consumed in the smaller growth volumes (e.g., energy required for bioreactor lighting) were allocated to the larger growth volumes as the algae were transferred through the system during scale-up (cf. Appendix 4A of [19] for details).
The algal biomass was tracked during each batch by measuring the dry cell weight of multiple samples collected throughout the production pathway. These samples were centrifuged and the pellet was rinsed three times to remove salts. Then, the samples were maintained at 70 °C until a constant weight was obtained. High performance liquid chromatography (HPLC) was used to calculate the lipid content and lipid composition for each batch according to methods developed at The University of Texas at Austin [21], which are refinements of standard methods [22,23,24].
All five of the experimental batches were processed using a centrifuge for harvesting, electromechanical cell lysing, and a microporous hollow-fiber membrane contactor for separations. While the energy and materials consumed during each of these steps, and the associated uncertainty, has been described in detail by Beal et al. [14,19], this study, combines these data with monetary costs, water impacts, and resource constraints for each input.
2.2. Highly Productive Case
The Highly Productive Case is an analytical model that was constructed to represent a system with greater biomass productivity (80 mg/L-d) and a higher neutral lipid fraction (30%) than the Experimental Case (which had productivity of 2 mg/L-d and lipid fraction of 2%). The Highly Productive Case assumes the same basic production pathway as the Experimental Case, but it substitutes bioreactors for growth and an advanced flocculation technique in place of centrifugation. In addition, several modifications are modeled to improve energy efficiency in the Highly Productive Case. In addition, it is assumed that there is no water loss from evaporation and 95% of the water used for cultivation was recycled. In this sense, the Highly Productive Case is an optimistic, but not wholly unreasonable, scenario for achieving low operating expense in commercial-scale algal biofuel production based on current technologies. The less optimistic assumption is the requirement of “full-price” inputs (such as nitrogen fertilizer and carbon dioxide from ammonia production plants). The ability to achieve each of the specified conditions in the Highly Productive Case in practice is assumed to be possible and the capital required to do so is not considered in this study. Each assumption used in the Highly Productive Case is compared with those from several literature sources in the “Discussion” section, below.
The ability to utilize discounted inputs, such as waste forms of carbon, nitrogen, and phosphorus and cheap energy inputs, would further improve the return on investment for producing algal biofuels with respect to the Highly Productive Case [11,14,25,26,27,28]. The Highly Productive Case is not intended to represent the optimum scenario for algal biofuels nor is it presented as the final arbiter of the fuel’s prospects for success; rather, it is intended to serve as a useful benchmark. The optimum scenario might utilize discounted inputs, high productivity algal strains (e.g., genetically modified organisms), and improved growth, processing, and harvesting methods that might be developed in the future. Instead, the Highly Productive Case models a similar production pathway as the Experimental Case, but with significantly higher fuel productivity and significantly more efficient growth and processing methods.
2.3. Biomass and Lipid Productivity Formulae
The bio-oil and biomass fuel (methane) productivities of this system can be reported as:
and:
where P is the productivity (of bio-oil (BO), biomass fuel (BMF), and grown mass (GM)) and represents the efficiency of harvesting (harv), cell lysing (cellys), separations (sep) (of biocrude (BC) and biomass in the post-extraction slurry (BS)), and refining (ref). Each efficiency is defined as the mass of the output divided by the mass of the input for that step (cf. [6]). For example, the biocrude separations efficiency, , is defined as the mass of biocrude recovered divided by the lysed algal biomass, and the neutral lipid fraction is embedded in this efficiency [6].
2.4. Photosynthetic Efficiency
The photosynthetic efficiency can be calculated as the energy content of the glucose produced during photosynthesis divided by the incident radiation. This value is different than the overall energy efficiency of growth, which includes the cost of living (i.e., respiration to enable cell functions), conversion of glucose to biomass, and required energy inputs (e.g., mixing, nutrient supply, etc.) [29]. The energy content of the glucose produced (per liter processed) can be calculated as:
where is the volumetric irradiance (in joules per liter of processed volume), is the photosynthetically active radiation fraction (0.46), is the photon transmission efficiency, and is the photon utilization efficiency [30]. The volumetric irradiance can be converted to an areal irradiance, , according to:
where is the cultivation time (123 days for the Experimental Case and 12.5 days for the Highly Productive Case) and is the pond depth (0.2 m for both cases). In Equation 3, the variable characterizes the efficiency by which photons used for photosynthesis are converted to glucose through Z-scheme photosynthesis. With a quantum requirement of 8 mol photons per mol of glucose (the energy content of glucose is 467.5 kJ/mol) and an average photon energy content of 225 kJ/mol [30], [29]. The photosynthetic efficiency, , is the ratio of to , which becomes:
The amount of energy contained in the growth volume (as algal biomass), , can be calculated from:
where HHVGM is the higher heating value of the grown algal biomass. The amount of energy contained in the growth volume can also be calculated from:
where is the cost of living, which is defined as the fraction of glucose consumed for cellular operations [30]. The energy conversion of glucose to biomass energy can be grossly simplified as a single-step process, represented by . Assuming algae have the Redfield stoichiometry defined by Clarens et al. [15] (), the conversion of glucose to algal biomass can be approximated as:
The higher heating value () for algae can be estimated as stated by Clarens et al.:
where is the mass fraction of each element (carbon, hydrogen, oxygen, and nitrogen) [15]. The for the algae considered here is 24.49 MJ/kg (59.12 MJ/mol). The energy conversion of glucose (106 mol with a HHV of 467.5 kJ/mol) to biomass energy is represented by . Combining several of these relations, the can be calculated as:
2.5. Energy Return on Investment Formulae
The second-order energy return on investment, 2nd O EROI is calculated as:
where is the energy input during growth, is the energy input for processing, is the energy input for refining, and is the energy output (from bio-oil () and biomass fuel ()). As a second-order analysis, direct and indirect energy inputs are included, while a first-order analysis would include only direct energy inputs [5]. An apostrophe accent is used to denote units that are reported with respect to the growth volume processed, such as the energy inputs in units of J per L processed (J/Lp).
To account for differences in energy quality among the inputs and outputs, the quality-adjusted second-order energy return on investment () was calculated by multiplying each input and output by priced-based quality factors. The quality factors () were calculated for energy flows based on the energy price (), which is the price of each energy source per joule, and correlates the relative value of each fuel [31]. Using coal as the arbitrary standard with a quality factor equal to 1 ($1.5/MMBtu, $1.4/GJ), the quality factors used in this study were: electricity 19.5 ($27.8/GJ, ¢10/kWh), petroleum 14.5 ($20.6/GJ, $0.66/L), and natural gas 2.7 ($3.8/GJ, $4/MMBtu) [32]. The bio-oil was assigned the of petroleum and methane was assigned the of natural gas. For materials, the quality-factor was determined as:
where is the price (in $/kg), is the energy equivalent (in MJ/kg), and is the energy price for coal ($1.4/GJ).
2.6. Partial Financial Return on Investment Analysis Formulae
The overall financial return on investment, , can be calculated as:
where is revenue (from bio-oil (BO), biomass fuel (BMF), and subsidies (S)), and the total investment is the sum of the capital costs (CC), operating costs (OC), and labor costs (L) for growth (G), processing (P), refining (R), and distribution (D). To parallel the 2nd O EROI, the partial financial return on investment, , is defined as:
and is equivalent to the .
In Equation (14), is revenue from bio-oil, is revenue from biomass fuel (methane), and is the operating cost for growth (G), processing (P), and refining (R). Capital, labor, fuel distribution, discounting, and potential subsidy revenue would need to be included to determine an overall .
2.7. Water Intensity Analysis Formulae
The water consumption and water withdrawal required for transportation via bio-oil and biomass fuel (methane) produced in this production pathway are calculated based on the methodology presented by King and Webber [33]. Consumption and withdrawal are defined as:
“Water consumption describes water that is taken from surface water or a groundwater source and not directly returned. For example, a closed-loop cooling system for thermoelectric steam power generation where the withdrawn water is run through a cooling tower and evaporated instead of being returned to the source is consumption. Water withdrawal pertains to water that is taken from a surface water or groundwater source, used in a process, and (may be) given back from whence it came to be available again for the same or other purposes. To determine the water consumption or withdrawal for each input, the amount of each energy or material input is multiplied by the water equivalent for that input.”.[33]
The water consumption intensity, , is defined as:
and the water withdrawal intensity, , is defined as:
where is the water consumed per liter of growth volume processed, is the water withdrawn per liter of growth volume processed, and are the volumes of bio-oil and biomass fuel (methane) produced per liter of growth volume processed, and and are the fuel economy values for transportation via bio-oil (28 miles/gallon, 11.8 km/L) and methane fuels (0.2 miles/standard cubic foot, 0.01 km/L). Thus, these metrics are calculated as the water required (consumed or withdrawn) for operating the production pathway shown in Figure 1 divided by the total distance that could be traveled using the bio-oil and the biomass fuel produced (assuming typical conversion efficiencies). The water consumption and water withdrawal include direct water inputs (e.g., water supplied to the growth volumes) and indirect water inputs (e.g., water used during nitrogen fertilizer production and electricity generation), thereby yielding a second-order water analysis. The energy return on water investment (EROWI) is a similar metric for evaluating water intensity [9,34] and can be calculated from the data in this study that are reported in Table 3A and Table 4A. However, this metric does not consider the energy quality of the fuels produced, and therefore the and were used as the main metrics for evaluating water intensity in this study.
2.8. Raw Data and Resource Consumption Factors
The data collected in this study are presented in Table 1. The values shown for the experimental data are the average across the five batches that were processed. Table 1 lists the energy, price, and water factors for the energy and material inputs needed to produce the algal fuels of this study. The quality factors and have been reported in previous publications by Beal et al. [14,19]. The previous work is expanded as here the data are used to also calculate the economic, water intensity, and resource results presented in the next section.

Table 1.
Raw data used to calculate the second-order EROI, PFROI, WCI (water consumption intensity), WWI (water withdrawal intensity), and resource constraints in this study. The abbreviations in this table are: EC Cons.—Experimental Case Consumption, HPC Cons.—Highly Productive Case consumption, EE—energy equivalent, QF—quality factor, WCE—water consumption equivalent, WWE—water withdrawal equivalent. References for these data are presented in the tables below where applicable.
| Growth Total (kJ/Lp) | EC Cons. | HPC Cons. | EE | QF | Price | WCE | WWE |
| 2,475.45 | 64.43 | ||||||
| Direct Water (L/Lp) | 1.91 | 0.05 | 1.33 kJ/L | 568 | $1.1/kL | 1 L/L | 1 L/L |
| CO2 (g/L) | 9.35 | 8.00 | 7.33 MJ/kg CO2 | 2.14 | $0.022/kg | 6.50 L/kg | 6.50 L/kg |
| Nitrogen in Fertilizer (mg/Lp) | 195.52 | 70.00 | 59 MJ/kg N | 8.84 | $0.73/kg N | 7.88 L/kg | 7.88 L/kg |
| F/2 Media (several components not shown) | |||||||
| Phosphorus in Fertilizer (mg/Lp) | 3.00 | 8.00 | 44 MJ/kg P | 25.75 | $1.6/kg P | 10 L/kg | 10 L/kg |
| Ferric chloride hexahydrate (mg/Lp) | 9.51 | 0 | 20 MJ/kg | 11.00 | $0.31/kg | 10 L/kg | 10 L/kg |
| EDTA dihydrate (mg/Lp) | 13.09 | 0 | 20 MJ/kg | 11.00 | $0.31/kg | 10 L/kg | 10 L/kg |
| B3N Media (several components not shown) | |||||||
| Sodium Nitrate (mg/Lp) | 20.59 | 0 | 9.38 MJ/kg | 9.14 | $0.12/kg | 2.8 L/kg | 2.8 L/kg |
| Instant Ocean Salts (g/Lp) | 19.44 | 0 | 1.15 MJ/kg | 1,110 | $1.78/kg | 0 L/kg | 0 L/kg |
| Antibiotics (mg/Lp) | 1.89 | 0.09 | 50 MJ/kg | 14,300 | $1/g | 50 L/kg | 50 L/kg |
| Lighting (kJ/Lp) | 860.60 | 0 | 1 MJ/MJ | 19.5 | ¢2.8/MJ | 0.49 L/MJ | 21.2 L/MJ |
| Compressor (kJ/Lp) | 392.89 | 0 | 1 MJ/MJ | 19.5 | ¢2.8/MJ | 0.49 L/MJ | 21.2 L/MJ |
| Transfers (kJ/Lp) | 0.82 | 0 | 1 MJ/MJ | 19.5 | ¢2.8/MJ | 0.49 L/MJ | 21.2 L/MJ |
| Mixing (kJ/Lp) | 1,054.81 | 1.24 | 1 MJ/MJ | 19.5 | ¢2.8/MJ | 0.49 L/MJ | 21.2 L/MJ |
| Greenhouse Fans (kJ/Lp) | 60.38 | 0 | 1 MJ/MJ | 19.5 | ¢2.8/MJ | 0.49 L/MJ | 21.2 L/MJ |
| Harvesting Total (kJ/Lp) | 22.81 | 8.04 | |||||
| Pump from pond (kJ/Lp) | 1.80 | 0.96 | 1 MJ/MJ | 19.5 | ¢2.8/MJ | 0.49 L/MJ | 21.2 L/MJ |
| Forklift propane (uL/Lp) | 3.59 | 0 | 27 MJ/L | 15.9 | $0.60/L | 0.29 L/L | 0.000291 |
| Centrifuge (kJ/Lp) | 13.95 | 0 | 1 MJ/MJ | 19.5 | ¢2.8/MJ | 0.49 L/MJ | 21.2 L/MJ |
| Centrifuge Pump (kJ/Lp) | 6.96 | 0 | 1 MJ/MJ | 19.5 | ¢2.8/MJ | 0.49 L/MJ | 21.2 L/MJ |
| Flocculants (mg/Lp) | 0.00 | 354.00 | 20 MJ/kg | 3.93 | $0.11/kg | 20 L/kg | 20 L/kg |
| Lysing Total (kJ/Lp) | EC Cons. | HPC Cons. | EE | QF | Price | WCE | WWE |
| 3.80 | 0.20 | ||||||
| Pump (kJ/Lp) | 0.03 | 0.00 | 1 MJ/MJ | 19.5 | ¢2.8/MJ | 0.49 L/MJ | 21.2 L/MJ |
| Power Supply (kJ/Lp) | 3.51 | 0.21 | 1 MJ/MJ | 19.5 | ¢2.8/MJ | 0.49 L/MJ | 21.2 L/MJ |
| Fans (kJ/Lp) | 0.26 | 0 | 1 MJ/MJ | 19.5 | ¢2.8/MJ | 0.49 L/MJ | 21.2 L/MJ |
| Extraction Total (kJ/Lp) | 70.20 | 0.24 | |||||
| Membrane | |||||||
| 2 Pumps (kJ/Lp) | 1.22 | 0.00 | 1 MJ/MJ | 19.5 | ¢2.8/MJ | 0.49 L/MJ | 21.2 L/MJ |
| Distillation | |||||||
| Feed Pump (kJ/Lp) | 1.53 | 0.00 | 1 MJ/MJ | 19.5 | ¢2.8/MJ | 0.49 L/MJ | 21.2 L/MJ |
| Vacuum Pump (kJ/Lp) | 16.16 | 0.00 | 1 MJ/MJ | 19.5 | ¢2.8/MJ | 0.49 L/MJ | 21.2 L/MJ |
| Stage 1 Heater (kJ/Lp) | 5.65 | 0.18 | 1 MJ/MJ | 19.5 | ¢2.8/MJ | 0.49 L/MJ | 21.2 L/MJ |
| Stage 2 Heater (kJ/Lp) | 0.89 | 0 | 1 MJ/MJ | 19.5 | ¢2.8/MJ | 0.49 L/MJ | 21.2 L/MJ |
| Chill Water (L/Lp) | 0.35 | 0.00 | 11.23 kJ/L | 568 | $8.9/kL | 1 L/L | 1 L/L |
| Heptane Loss (mL/Lp) | 0.98 | 0.00 | 41.75 MJ/L | 51.3 | $3/L | 30 L/L | 30 L/L |
| Refining (kJ/Lp) | 0.24 | 2.13 | |||||
| Bio-oil Refining (kJ/Lp) | 0.00 | 0.46 | 1 MJ/MJ | 2.66 | ¢2.8/MJ | 0.49 L/MJ | 21.2 L/MJ |
| Refining Materials (Methanol) (mg/Lp) | 0.21 | 20.78 | 40.7 MJ/kg | 6.40 | $0.36/kg | 30 L/L | 30 L/L |
| Biomass Fuel Refining (kJ/Lp) | 0.23 | 0.83 | 1 MJ/MJ | 2.66 | ¢0.4/MJ | 0 L/MJ | 0 L/MJ |
| Total Energy Input (kJ/Lp) | 2,575.66 | 75.05 | |||||
| Bio-oil (mg/Lp) | 2.11 | 210 | 40 MJ/kg | 14.5 | ¢2.1/MJ | ||
| Methane (mg/Lp)) | 41.58 | 150 | 55 MJ/kg | 2.66 | ¢0.4/MJ | ||
| Total Energy Output (kJ/Lp) | 2.37 | 16.61 | |||||
| 2nd O EROI | 9.2 × 10⁻⁴ | 0.22 |
3. Results
3.1. Biomass, Lipid, and Biofuel Productivities
The average algal concentration of the growth volume in the Experimental Case was 0.26 g/L, the neutral lipid fraction was estimated to be 0.02, and cultivation required 123 days. The neutral lipid content was determined by HPLC and the lipid composition included hydrocarbons, triglycerides, diglycerides, and monoglycerides. On average, 2 mg of biocrude and 165 mg of post-extraction biomass were recovered per liter of processed volume. These are not high productivity values as the research focus was on processing rather than growth. It was assumed that the bio-oil refining efficiency (, upgrading biocrude to bio-oil) was 1 and the biomass fuel refining efficiency (, converting post-extraction biomass to methane) was 0.25 [14,35].
The grown mass productivity (), estimated bio-oil productivity (), and estimated methane productivity () were calculated by combining these values, yielding 2.1 g of bio-oil per thousand liters of processed growth volume (0.0026 L/kLp, 0.00069 gal/kLp where Lp is the liters of processed growth volume) and 41.6 g of methane per kLp (cf. Table 2).
For the Highly Productive Case, the algal concentration was modeled to be 1 g/L (a factor of four improvement over the Experimental Case), requiring 12.5 days of cultivation with a grown mass productivity of 0.08 g/L-d. The neutral lipid fraction was assumed to be 0.3 and the production efficiencies were specified as: , , , , , [14]. The grown mass productivity (), bio-oil productivity (), and methane productivity () were calculated from these values and are listed in Table 2. As listed, 210 g (0.26 L, 0.069 gal) of bio-oil and 150 g of methane are produced for each kLp. The Highly Productive Case yields an energy output that is 7 times greater than that for the Experimental Case, and the energy inputs are described below.
Table 2.
Grown mass, bio-oil, and biomass fuel (methane) productivities for the Experimental Case and the Highly Productive Case are listed in terms of volume and surface area. Culture depth is assumed to be 0.2 m.
| Photosynthetic Efficiency (%) | Grown Mass Productivity () mg/L-d, (g/m2-d) | Bio-oil Productivity () mg/L-d, (g/m2-d) | Biomass Fuel Productivity () mg/L-d, (g/m2-d) | |
|---|---|---|---|---|
| Experimental Case | NA | 2.17 (0.43) | 0.02 (0.004) | 0.34 (0.07) |
| Highly Productive Case | 3.7 | 80.0 (16.0) | 16.6 (3.32) | 12.1 (2.42) |
| Theoretical Optimum Case | 11.9 | 921 (184) | NA | NA |
3.2. Photosynthetic Efficiency
The photosynthetic efficiency () cannot be determined for the Experimental Case because the incident radiation was not measured. For the Highly Productive Case, the can be determined from Equation (10), using the grown mass productivity and the cultivation time as specified inputs ( and ). Therefore, inserting values for the (24.49 MJ/kg) and (1.19) into Equation (10) and specifying values for (0.5, based on the results of Weyer et al. [30]) and (1100 kJ/Lp, which converts to 6500 MJ/m2-yr [30]), the for the Highly Productive Case can be calculated as:
Similarly, the for an idealized Idealized Case can be calculated from Equation (10) by setting , , , and , yielding a . Based on Equation (10), one possible scenario for the Idealized Case would yield the following values: , , , , , and [30].
3.3. Energy Return on Investment for Algal Biofuel
As shown in Table 3, the 2nd O EROI for the Experimental Case and the Highly Productive Case, which have been reported previously by Beal et al. [14], are 9.2 × 10⁻⁴ ± 3.3 × 10⁻⁴ (cf. [19] for uncertainty analysis) and 0.22, respectively.
For algal biofuels to be produced commercially, the EROI must be competitive with that of conventional fuels (e.g., over the last few decades the EROI for oil and gas, including industrial capital, has typically been 10–20 [36] with delivered gasoline between 5 and 10 [37]). Several other studies have presented hypothetical energy analyses of algal biofuel production, and although the scope and systems evaluated vary, each of these studies has also found that without discounted inputs, the EROI is not competitive with conventional fuels [11,15,17,27,38]. The 2nd O EROI results from this study are plotted in Figure 2, along with the first-order EROI, which only includes direct energy inputs (and thereby neglects energy embedded in material inputs).
Table 3.
Summary of energy, water, cost, and resource requirement results for the Experimental Case and the Highly Productive Case. The methane-to-bio-oil ratio is much greater for the Experimental Case than the Highly Productive Case due to the difference in lipid fraction of these scenarios. (Note: 5 Bgal/yr = 19 GL/yr).
| Experimental Case | Highly Productive Case | |
|---|---|---|
| Bio-oil Yield (g/kLp) | 2.1 | 210 |
| (% of U.S. transp. petroleum displaced by 5 Bgal of Bio-oil/yr) | 2.8% | 2.8% |
| Methane Yield (g/kLp) | 42 | 150 |
| (% of U.S. natural gas displaced by methane co-product of 5 Bgal of Bio-oil/yr) [39] | 60% | 2.2% |
| Energy Expense for Growth (kJ/Lp) | 2500 | 64 |
| Energy Expense for Processing (kJ/Lp) | 97 | 8.5 |
| Energy Expense for Refining (kJ/Lp) | 0.2 | 2.1 |
| Energy Output (Bio-oil and Methane) (kJ/Lp) | 2.4 | 17 |
| Second-order EROI | 9.2 × 10⁻⁴ | 0.22 |
| Quality Adjusted Second-order EROI | 9.2 × 10⁻⁵ | 0.36 |
| Operating Cost of Growth ($/L BO) | 40,000 | 1.6 |
| Operating Cost of Processing ($/L BO) | 2,900 | 0.4 |
| Operating Cost of Refining ($/L BO) | 0.4 | 0.1 |
| Bio-oil Revenue ($/L BO) | 0.7 | 0.7 |
| Methane Revenue ($/L BO) | 2.3 | 0.1 |
| Subsidy ($/L BO) | 0.1 | 0.1 |
| PFROI (No Capital, No Subsidies) | 9.2 × 10⁻⁵ | 0.37 |
| PFROI w/ Subsidies (No Capital, With Subsidies) | 9.6 × 10⁻⁵ | 0.43 |
| Total Distance Traveled (Bio-oil and Methane) (km/kLp) | 0.6 | 5.2 |
| Water Consumption (L H2O/L of Bio-oil) | 1.3 × 10⁶ | 450 |
| (multiples of Austin water use for 5 Bgal of Bio-oil/yr) [40] | 150,000× | 51× |
| Second-order Water Consumption (L H2O/kLp) | 3500 | 120 |
| Second-order Water Consumption Intensity, WCI (L H2O/km) | 5700 | 22 |
| Water Withdrawal (L H2O/L of Bio-oil) | 20 × 106 | 4400 |
| Water Withdrawal (L H2O/kLp) | 53,700 | 1100 |
| Second-order Water Withdrawal Intensity, WWI (L H2O/km) | 87,000 | 220 |
| Electricity Consumption (MJ/L BO) (1 kWh = 3.6 MJ) | 9.2 × 10⁵ | 9.9 |
| (% of U.S. electricity production for 5 Bgal of Bio-oil/yr) [41] | 120,000% | 1.3% |
| CO2 Consumption (kg/L BO) | 3700 | 31 |
| (% of total U.S. emissions for 5 Bgal of Bio-oil/yr) [42] | 1200% | 11% |
| Nitrogen Consumption (kg/L BO) | 77 | 0.3 |
| (% of total U.S. N use for 5 Bgal of Bio-oil/yr) [43] | 13,000% | 45% |
Units that are reported with respect to the amount of growth volume processed contain a “p” subscript (e.g., kJ/Lp is the energy input per liter of growth volume processed).
For the Experimental Case, 90% (2308 kJ/Lp) of the total energy input (2572 kJ/Lp) was associated with bioreactor lighting, air compression (for supplying CO2), and pond mixing; all of which are considered to be artifacts of inefficient research-scale growth methods. Conversely, in the Highly Productive Case, which modeled efficient growth equipment, embedded energy in nutrients accounted for 85% (63 kJ/Lp) of the total energy input (75 kJ/Lp). The Highly Productive Case assumes 8 kg of CO2, 70 g of nitrogen, and 8 g of phosphorus consumed per kg of algae produced.
Based on conservation of mass, the minimum possible CO2, nitrogen, and phosphorus consumption can be approximated as 1.8 kg, 70 g, and 8 g per kg of generic algal biomass, respectively [2,15,17,44,45,46]. Using these minimum data, and the associated energy equivalents (with values of 7.3 MJ/kg CO2, 59 MJ/kg N, and 44 MJ/kg P [15,19,46,47,48,49,50,51]), the minimum possible energy embedded in the (full-price) nutrients alone requires more energy (17.7 kJ/Lp) than the total energy produced (16.6 kJ/Lp), which prevents a positive net energy yield, and illustrates the need to use waste forms of nutrients. The energy embedded in carbon, nitrogen, and phosphorus is dependent on the stoichiometric requirement and energy intensity of production for each element. However, the embedded energy in these elements is independent of growth rate [14], demonstrating the limited ability for growth optimization to alter the overall EROI for algal biofuels.
The EROI was adjusted using quality factors reported by Beal et al. [14] that were calculated according to the price of each input, yielding a that directly parallels the PFROI analysis. For the Experimental Case and the Highly Productive Case, the was 9.2 × 10⁻⁵ and 0.36, respectively [14].
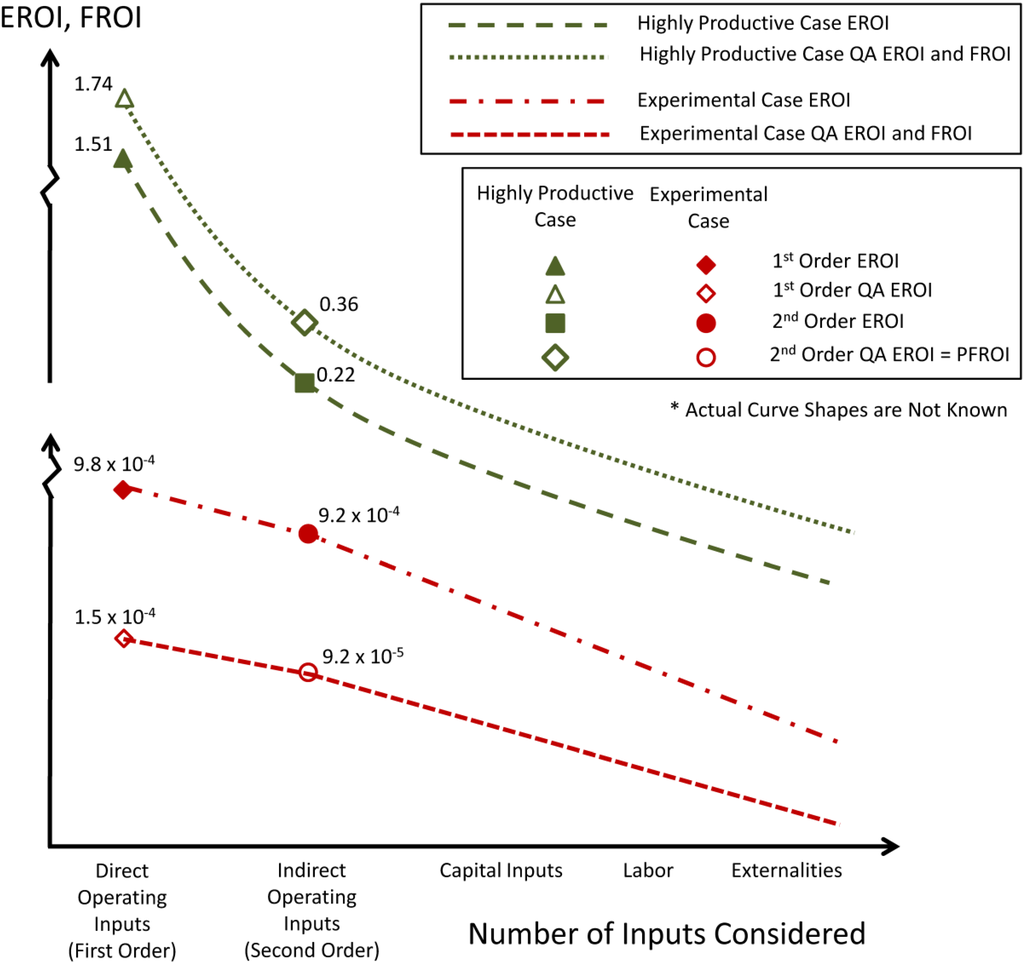
Figure 2.
The EROI and PFROI for the Experimental Case and the Highly Productive Case decline as more inputs are considered. The curves are presented for illustration only, as the curve shapes are unknown.
3.4. Financial Return on Investment of Algal Biofuel
The is equivalent to the and is calculated using Equation (14) and the data presented in Appendix (also cf. Table 1). This relation serves as a standard way to compare energy and cost analyses at a systems level. By doing so, the energetic profitability of an energy system (which is the most important metric for researchers interested in global energy production and consumption or thermodynamics of energy systems) can be compared with the financial profitability of an energy system (which is most important to businesses and investors).
The cost of growing algae () was calculated for the Experimental Case by applying the electricity and material prices shown in Table 1A, yielding a total cost of growth of $105.2/kLp. With 2.1 g of bio-oil produced from each kL of processed volume, these cultivation costs () are $40,000/L of bio-oil ($150,000/gal). The Highly Productive Case data is presented in Table 2A and results in a total cultivation cost of $0.42/kLp, which is equivalent to $0.42/kg of algae or $1.6/L of bio-oil ($6.1/gal) based on the bio-oil productivity calculated above (210 g bio-oil/kLp). The combined cost of processing () and refining () was calculated to be $7.71/kLp and $0.13/kLp for the Experimental and Highly Productive Cases, respectively (cf. Table 1A and Table 2A). Based on the resulting bio-oil productivities, these values correspond to $2900/L of bio-oil ($11,000/gal) and $0.5/L of bio-oil ($1.9/gal) for these cases, respectively. Davis et al. present a comprehensive techno-economic analysis of a similar production system (including capital costs) and determined that operating costs for both open-pond and enclosed bioreactor settings would be near $1.3/L of bio-oil ($5/gal) [16]. This result is similar to the total operating cost of the Highly Productive Case ($2.1/L of bio-oil, $7.99/gal).
In the Experimental Case, 2.1 g of bio-oil were produced per kLp (0.0026 L/kLp) and 41.6 g of methane were produced per kLp. Assuming market prices of $0.66/L of bio-oil ($0.66/L, $0.83/kg) and $4/MMBtu of methane ($0.21/kg) yields revenues of $0.0017/kLp for bio-oil and $0.0087/kLp for methane in the Experimental Case (yielding $0.010/kLp of total revenue). In the Highly Productive Case, 210 g (0.26 L) of bio-oil and 150 g of methane are produced for each kLp, resulting in $0.17/kLp of bio-oil revenue and $0.03/kLp of methane revenue. Until 2012, a production subsidy of $0.13/L was provided for corn ethanol in the United States, and if an equal subsidy was provided for algal fuels, the production plant would gain incremental income of $0.0004/kLp for the Experimental Case and $0.035/kLp for the Highly Productive Case.
The partial financial returns on investment (PFROI) are calculated from Equation (14) for the Experimental Case and the Highly Productive Case to be 9.2 × 10⁻⁵ and 0.37, respectively. The challenge in obtaining a PFROI greater than 1 is growing, processing, and refining high-yield biomass cheaply, especially since many of the costs scale directly with biomass productivity (e.g., nutrient costs increase as biomass productivity increases). The overall FROI would be lower than the PFROI as capital, labor, and distribution costs will be significant expenses, which are not included in the PFROI. For example, Lundquist et al. and Davis et al. provide analyses for capital costs of similar production systems and demonstrate that capital costs might contribute roughly 50% of the total cost for open-pond systems (this fraction increases substantially for bioreactors) [16,52]. Figure 2 illustrates the relationships between the EROI, QA EROI, and PFROI with respect to the number of inputs that are considered in the analysis, and is based on the work of Henshaw, King, and Zarnikau in relating EROI to full business costs, or cash flows [53]. For a given biofuel output, as more inputs are included in the calculations, the return on investment values decrease.
3.5. Water Intensity of Algal Biofuel
The is calculated using Equation (15) and the data listed in Table 1 and Table 5A. Figure 3 plots the second-order water intensity of transportation (consumption and withdrawal) using algal biofuels produced in this system (bio-oil and methane) for the two cases considered. These data are shown alongside equivalent results for a variety of transportation fuels, including fossil fuels, electricity for electric vehicles, and biofuels reported previously by King and Webber [33] (note the logarithmic scales).
As shown, the Experimental Case water intensity (which includes significant research-scale artifacts, no recycling, evaporation from the ponds, and relatively low biofuel yields) far exceeds any of the other transportation fuels. Meanwhile, the Highly Productive Case water consumption intensity is lower than that of biofuels from irrigated crops, while its water withdrawal intensity is similar to, or slightly greater than, that of biofuels from irrigated crops. Still, the Highly Productive Case, which assumes very efficient water use (no evaporation and 95% recycling), is much more water intensive than traditional fossil fuels or non-irrigated biofuels from conventional feedstocks. While the WCI and WWI metrics are useful to evaluate the magnitude of water required for fuel production, they do not consider water quality (that is, algae can be grown in degraded, brackish, or saline sources, for which the concerns about water quantity are muted as compared with freshwater). The relationship between water requirements (considering magnitude and quality) and water availability (including precipitation, which is not considered here for the algal biofuel cases) is more important than the water intensity, alone. However, this relationship is dependent on location and must be evaluated on a case-by-case, site-specific basis for all of the fuels shown.
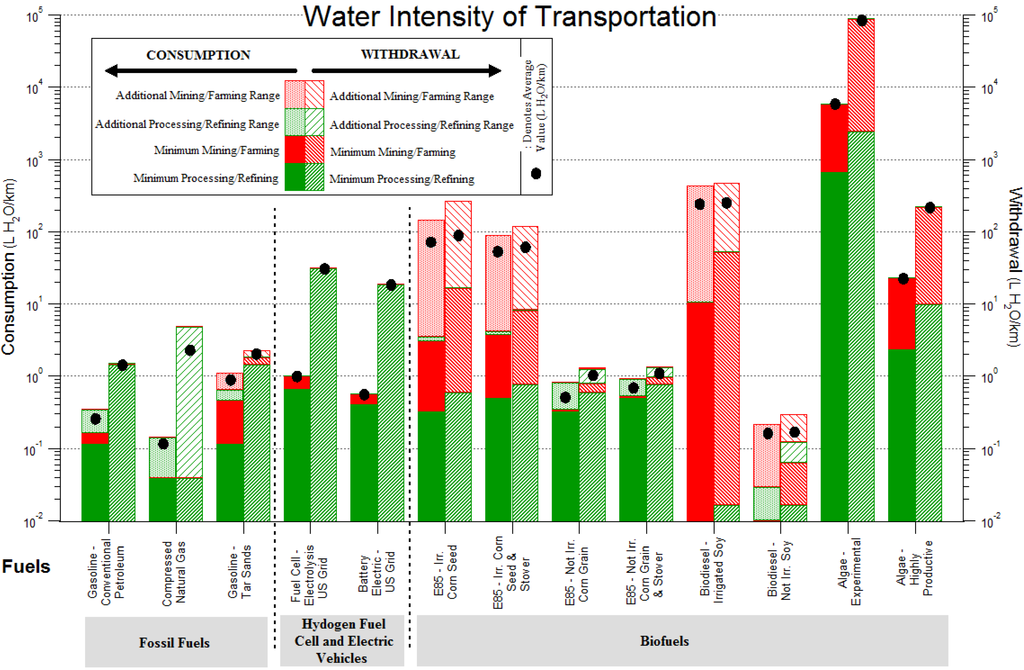
Figure 3.
Second-order water intensity of transportation for several fuels [33], including the bio-oil and methane co-products from the two algal biofuel cases: the Experimental Case and the Highly Productive Case. * Note the logarithmic scale. To evaluate sustainability, the water intensity and required water quality must be considered in conjunction with water availability.
Several other studies have been conducted to determine the water intensity of algal biofuel production and the system boundaries used in each study vary [9,11,15,17,54,55]. Analogous to energy inputs, the water inputs for a production pathway include direct and indirect parts. Additionally, the water consumption required to produce capital equipment can be included (e.g., water required for producing glass bioreactors [54]). Finally, the water intensity is dependent on co-product allocation, as the total water consumed to operate the production pathway should be allocated between the bio-oil and co-products (e.g., methane). The first-order WCI results (which include only direct water inputs) are listed in Table 4 for several studies, along with the second-order WCI (which includes indirect water associated with water embedded in material and energy inputs) from the present study. Many of these studies use different methods to allocate water use between products, and each study should be consulted for specific methods. Subhadra and Edwards present a similar analysis (with slightly different conversion assumptions) [9].
The is calculated according to Equation (16) using the data presented in Table 1 and Table 6A. As shown in Table 3, the for the Experimental Case and the Highly Productive Case are 87,000 L/km and 220 L/km, respectively. Like the nutrient analysis presented below, the water analysis underscores the advantages of using nutrient-rich low-quality water, like waste water or agricultural runoff [28]. In these cases, the incremental water usage is minimized and the discharge water can be of higher quality (e.g., higher purity) than the water input.
Table 4.
Water consumption intensity values for various studies. Each study should be consulted for specific methods regarding allocation of water use among products (i.e., bio-oil, methane, etc.). * Other analyses include studies that omit certain first order water inputs, include water inputs that are neither first nor second order (e.g., water for capital equipment), or do not evaluate the entire production pathway. It is assumed that bio-oil has a density of 0.8 kg/L and a higher heating value of 40 MJ/kg.
| Study, Case | Water/MJ BO [L H2O/MJ BO] | Water/kg BO [L H2O/kg BO] | WCI [L/km] | Reference |
|---|---|---|---|---|
| First Order Analysis | ||||
| Yang et al., 0% Recycling | 93 | 3700 | 250 | [55] |
| Yang et al., 100% Recycling | 15 | 600 | 40 | [55] |
| Subhadra and Edwards, Lower Bound | 25 | 1010 | 68 | [9] |
| Subhadra and Edwards, Upper Bound | 68 | 2700 | 182 | [9] |
| Lundquist et al., Case 5 | NA | NA | 85 | [11] |
| Experimental Case (evaporation, no recycling, lab-scale artifacts) | NA | NA | 3700 | |
| Highly Productive Case (95% recycling, no evaporation) | NA | NA | 10 | |
| Second Order Analysis | ||||
| Experimental Case (evaporation, no recycling, lab-scale artifacts) | 42,000 | 1,700,000 | 5700 | |
| Highly Productive Case (no evaporation, 95% recycling) | 10 | 560 | 22 | |
| Other Analyses* | ||||
| Clarens et al. | 380 | [15] | ||
| Harto et al., Enclosed Average | 1.3 | 44 | 2.9 | [54] |
| Harto et al., Open Average | 6.2 | 220 | 14 | [54] |
| Lardon et al., Dry processing, low N | 0.3 | 11 | 0.7 | [17] |
| Lardon et al., Wet processing, normal N | 1.0 | 34 | 2.3 | [17] |
3.6. Resource Requirements for 5 Bgal/yr of Algal Bio-oil
The amounts of CO2, nitrogen, water, and electricity that would be required to produce 5 billion gallons (Bgal) of algal bio-oil per year (19 GL/yr) in each case (which would satisfy the unspecified portion of Renewable Fuel Standards in the Energy Independence and Security Act (EISA) of 2007 [56]), are listed in Table 3. The results demonstrate that algal biofuel production under the Experimental Case is, as expected, unfeasible. In the Highly Productive Case, the required amounts of these resources are more manageable, but still large. Batan et al. [27] and Pate et al. [18] present similar results, also showing that present algal bio-oil production technology would be constrained by carbon, nitrogen, and electricity requirements.
While re-use of CO2 would be desirable and some water requirements could be met with wastewater or saline water, the increased demand for fertilizer and electricity could have negative economic impacts. Depending on the scale of production, this electricity input requirement could impact electricity prices and yield a significant, unintended increase in carbon emissions.
3.6.1. Carbon Dioxide
Under ideal conditions, algae require roughly 2 kg of CO2 for each kg of algal biomass produced [2,15,17]. However, in the experiments, most of the CO2 delivered to the growth volumes was not retained in biomass (and released as outgas). As a result, 9.35 g of CO2 were consumed per liter of pond water processed, which only contained 0.26 g of algae, on average. Based on this consumption, 3.7 Mg of CO2 were consumed per L of bio-oil. For the Highly Productive Case (with 1 kg algal biomass/kL of processed volume, 8 kg of CO2 per kL of processed volume, and 0.26 L of bio-oil per kL of processed volume) 31 kg of CO2 would be required for each L of bio-oil produced. For 19 GL/yr of bio-oil (5 Bgal/yr), this equates to 5.8 × 10¹¹ kg of CO2 consumed per year, which is ~11% of the total CO2 emissions from the U.S. [42].
3.6.2. Nitrogen Fertilizer
For ideal conditions, roughly 70 g of nitrogen are required for each kg of algal biomass [15,17,44]. In the experiments, 0.20 kg of nitrogen was consumed per kLp. This amount translates to 77 kg of nitrogen per L of bio-oil produced (which is 769 g of N per kg of algal biomass). In the Highly Productive scenario (with 1 kg of algal biomass/kL of processed volume, 70 g of N per kL of processed volume, and 0.26 L of bio-oil per kLp) 0.27 kg of N are required per L of bio-oil produced, or 5.1 × 10⁹ kg of N would be required for 19 GL of bio-oil (5 Bgal), which is 45% of the total amount of nitrogen fertilizer consumed in the U.S. annually [43].
3.6.3. Electricity
In the Experimental Case, 2.4 GJ of electricity were consumed per kLp, resulting in ~0.92 × 10¹² J of electricity consumption per L of bio-oil. In the Highly Productive Case, 2.59 MJ of electricity is consumed per kLp, which yields 0.26 L of bio-oil. Thus, 9.9 MJ of electricity would be consumed per L of bio-oil, or 0.19 EJ per year for 19 GL of bio-oil per year (5 Bgal/yr). This amount is 1.3% of the annual U.S. electricity generation in 2009 [41].
3.6.4. Methane Co-Product
Based on the methane productivity presented above, 15.9 kg of methane would be produced per L of bio-oil in the Experimental Case, which yields 16.6 EJ/yr of methane energy produced for 19 GL/yr of bio-oil (5 Bgal/yr). This methane yield would displace 60% of the total U.S. natural gas consumption (~28.1 EJ/yr in 2009 [39]) (although this result is not a realistic expectation, as the EROI for this scenario is several orders of magnitude less than 1). In the Highly Productive Case a smaller portion of the biomass is used to produce methane (70% rather than ~95%–99% in the Experimental Case) because of the much higher lipid fraction. As a result, only 0.6 kg of methane would be co-produced for each L of bio-oil, yielding 0.60 EJ/yr of methane co-product for 19 GL/yr of algal bio-oil (5 Bgal/yr). This methane production could replace ~2.2% of the total U.S. natural gas consumption [39].
4. Conclusions
4.1. Current Feasibility
As shown above, the 2nd O EROI and PFROI are less than 1 for algal biofuels produced in this production system, even for the Highly Productive Case, which assumes efficient growth and processing methods. Including additional expenses that were omitted by this analysis (i.e., capital, labor, externalities, etc.) would further reduce profitability. Additionally, transportation using algal biofuels produced in these cases is more water intensive and resource intensive than conventional fuels. The challenge for achieving energy-positive, profitable biofuel production from algae is rooted in the thermodynamic challenges associated with converting materials with low energy density (such as dispersed photons, CO2, and nutrients) to energy-dense fuels [29]. This conversion requires a significant reduction in specific entropy, which thereby requires a significant amount of work input (i.e., energy expense).
This body of work demonstrates that producing petroleum fuel substitutes from algae without using discounted electricity, nutrients, and/or CO2 is not energetically favorable with the existing technologies considered. Although improving algal biomass productivity by optimizing physical conditions, biochemical conditions, and by genetic engineering might improve the overall biofuel yield, the required amounts of carbon, nitrogen, and phosphorus are dictated by stoichiometry. While some variation in algal stoichiometry exists (evidenced, for example, by the change in chemical composition that can occur under different growth conditions, such as nitrogen starvation), any algal species will inevitably be constrained by stoichiometric conditions. Thus, producing more algae (e.g., by increasing photosynthetic efficiency) also increases the nutrient requirement and the associated energy embedded in the nutrients. As shown in this study, there can be more energy and cost embedded in the nutrients consumed than produced in the resulting algal biomass. As a result, low-energy and low-cost sources of carbon, nitrogen, phosphorus, and water (for example, from waste streams) would likely be needed.
Researchers have two options for conducting analyses for non-commercial algal energy production processes: (1) use data from experimental processes (which are devoid of the efficiencies that accompany large-scale production) or (2) use data from models of future commercial-scale systems. The Experimental Case and the Highly Productive Case represent these two approaches, respectively. The presentation of results for both measured lab and up-scaled estimates is important because it enables more informed modeling of the innovation process from lab to production. It is unclear how well a lab-scale experiment needs to perform before moving to the next stage of development. We see this simultaneous presentation of multiple metrics (EROI, FROI, water intensity, nutrient constraints, and CO2 constraints) as part of a critical due diligence process for inventors and investors. Ongoing, it can be possible to have standard experimental test conditions that enable consistent comparison and tracking progress as new technologies are incorporated into the process chain. This tracking of progress can mimic that of the photovoltaic cell industry.
Since the Experimental Case contains many lab-scale artifacts, the constraints on the Highly Productive Case are more representative of the challenges that will be faced by the algal biofuels industry. Most of the conclusions in this study are based on the Highly Productive Case and the targets provided in the following section for achieving profitable algal biofuel production rely on the Highly Productive Case for comparison. To compare the Highly Productive Case with advanced algal biofuel production systems, the main assumptions of the Highly Productive Case are shown in Table 5.
Table 5.
Comparison of the Highly Productive Case with data reported in the literature. Experimentally-based data are shown in italic font.
| Parameter | Highly Productive Case Assumption | Data Reported in the Literature |
|---|---|---|
| Grown Mass Productivity (mg/L-d) | 80 | Ponds: 50–170 [2], 83 [10], 70 [11], 2 [14], 410 [27], 19–26 [15], 64–83 [17], 100 [44], 80 [46], 95–300 [57], 35 [58], 200 [59] |
| Reactors: 270–560 [59], 550 [60], 1700 [61] | ||
| Lipid Fraction (-) | 0.3 1 | 0.22 [3], 0.25 [11], 0.02 [14], 0.5 [27], 0.18–0.39 [17], 0.2–0.35 [46], 0.3 [58], 0.5 [59], 0.23 [60], 0.44 [61], 0.25 [62], 0.15 [63], 0.21–0.25 [57], 0.16–0.75 [64] |
| Mixing Energy (J/L-d) | 100 | 60 [10], 58 [11], 8600 [14], 674 [27], 6.4 [15], 100 [17], 72 [44], 28–240 [46], 22 [57], 346 (4800–220,000 bioreactors) [58], 130 [59], 50 [64], 31–53 [57] |
| Nutrient Supply (J/L-d) | 0 | In Mixing [27], 2.6 [57], 2.0 [57] |
| Carbon Dioxide Requirement (g/g algae) | 1.8 | 1.7–2 [2,15,17,44,45,46] |
| Carbon Dioxide Uptake (%) | 25 | 25 (in airlift reactors) [14] |
| Nitrogen Requirement (mg/g algae) | 70 | 61 [10], 147 [27], 87 [15], 110 (47 for N-starved) [17] 4 [44], 130 [46] |
| Nitrogen Uptake (%) | 100 | 61 [26], 100 [65] |
| Phosphorus Requirement (mg/g algae) | 8 | 20 [27], 12 [15], 2.4 (9.9 for N-starved) [17], 0.6 [44], 8 [46] |
| Phosphorus Uptake (%) | 100 | 91 [26], 100 [65] |
| Antibiotic Consumption (mg/Lp) | 0.1 | 1.89 [14] |
| Harvesting Efficiency (-) | 0.90 4 | 0.92 [14], 0.9 [17], 0.85 [46], 0.95 [55], 0.95 [59], 0.95 (pH sweep) [66] |
| Harvesting Pumping Energy (J/L-d) | 77 4 | 46 [10], 37 [46] |
| Harvesting Concentration Energy (J/L-d) | ~0 4 | 13 [10], 190 [14], 500 [27], 11 [15], 92 [17], 237 [46], 0 [59], 63 [57], 37 [57] |
| Harvesting Flocculants (mg/g algae) | 350 4 | cf. [66,67] |
| Harvesting Drying Energy (J/L-d) | 0 4 | 0 [14], 1,135 [17], 4200 [46], 0 [59] |
| Cell Lysing Efficiency (-) | 0.95 4 | 0.92 [14] |
| Cell Lysing Energy (J/Lp) | 0.21 4 | 3.8 [14] |
| Biocrude Separations Efficiency 3 (-) | 0.27 4 | 0.01 [14] |
| Biocrude Separations Electricity (J/L-d) | ~0 4 | 5.3 [11], 154 [14], 206 [27], 17–83 [17] |
| Biocrude Separations Heat (J/L-d) | 17 4 | 210 [11], 53 [14], 641 [27], 76–221 [17] |
| Biomass Slurry Separations Efficiency (-) | 1.00 4 | NA, Recovered during biocrude separations |
| Biomass Slurry Separations Energy (J/L-d) | 0 4 | NA, Recovered during biocrude separations |
| Bio-oil Refining Efficiency (-) | 0.90 | ~0.6 [63], 0.23–0.98 [68] (also cf. [62,69,70]) |
| Bio-oil Refining Energy (MJ/kg bio-oil) | 2.2 | 2.2 [27], 0.9 [17] |
| Bio-oil Refining Methanol (g/kg bio-oil) | 0.1 | 0.1 [27], 114 [17], (also cf. [57,68]) |
| Biomass Fuel (Methane) Refining Efficiency (-) | 0.25 | Catalytic hydrothermal gasification [35] |
| Biomass Fuel (Methane) Refining Energy (J/Lp) | 830 | Catalytic hydrothermal gasification [35] |
| Bio-oil Produced (mg/L-d) (40 MJ/kg) | 17 (670 J/L-d) | 660 J/(L-d) [11] 5, 160 [27], 6 [46] |
| Methane Produced (J/L-d) | 660 | 630 [11] 5, 350 [44] |
| Total Energy Output (J/Lp) | 16,600 5 | 2400 J/Lp [14], 1290 J/L-d [11] 5 |
1 This is the Neutral Lipid Fraction (), while most other studies report total lipid fraction (); 2 No evaporation due to the use of enclosed bioreactors; 3 The is embedded in this efficiency; 4 The model data is based on specific calculations for technologies developed at the University of Texas at Austin and described previously by Beal et al. [14]; 5 Case 5 is used for Lundquist et al.
The reference data shown in italic font are based on experimental analysis. The data listed in Table 5 illustrate the wide range of data used in algal biofuel analyses, and they also place the Highly Productive Case in context with leading publications in the field.
4.2. Targets to Achieve Sustainable Production
Based on the results of this study, targets can be set for producing algal biofuel that will enable a 2nd O EROI and PFROI equal to 1 (i.e., break-even) without exceeding water availability constraints or drastically increasing national fertilizer consumption. Since these targets are devised only with consideration of operating inputs, productivity would need to be increased and/or expenses would need to be decreased significantly to achieve an overall EROI and overall FROI (including capital costs) greater than 1 for the delivered energy carriers (a requirement for fuels to make a net energetic contribution), or greater than 3 (for practical purposes). The guiding targets for research stakeholders as presented in Table 6 for comparison to the Experimental Case and the Highly Productive Case are:
- Algal concentration of 3 g/L with a lipid fraction of 0.3, which would yield approximately 25 kJ of bio-oil and 25 kJ of methane per liter of processed volume (which is about 800 L BO/MLp and 450 kg methane/MLp, estimated to be roughly $600 of revenue per million liters of growth volume (assuming $0.66/L BO ($2.50/gal BO) and $3.8/GJ ($4/MMBtu) of methane));
- In conjunction with item 1, an energy input for growth, processing, and refining that is less than 50 kJ per liter of processed volume enables a 2nd O EROI > 1 and requires using discounted inputs;
- The FROI is dependent upon market prices, and therefore can vary substantially depending on market conditions (e.g., oil price). However, based on the price assumptions used in this study, if the targets listed above can be achieved, the PFROI would be greater than 1 if the cost of growth, processing, and refining is less than $600 per million liters of growth volume processed (which is equivalent to $0.20/kg of grown mass). Achieving a total cost less than $600 per million liters of growth volume processed would yield an overall FROI greater than 1 for this scenario (assuming no subsidy revenue);
- A fresh water consumption intensity on the order of 2.4 L/km (1 gal/mi), achieved by consuming roughly 25 liters of fresh water per thousand liters of processed volume (which corresponds to no evaporation during growth, minimal processing water use, and greater than 97.5% recycling for fresh water cultivation). This consumption corresponds to about 33 liters of fresh water per liter of bio-oil produced (with a methane co-product of about 0.58 kg/L BO). Using saline water or waste water could also enable a low fresh water consumption intensity;
- A net nutrient consumption that would enable large-scale production while only marginally increasing the national fertilizer consumption. For example, to produce 5 Bgal of fuel per year (19 GL/yr), the net nitrogen consumption for each liter of fuel produced should be less than about 26 g to prevent a national increase in nitrogen fertilizer consumption of more than 5% (which is about 6 × 10⁸ kg N/yr [43]). In this scenario, one liter of bio-oil is produced from about 4 kg of algae, and therefore the nitrogen consumption should be less than about 7 g per kg of algae, which is roughly 10% of the minimum possible nitrogen requirement for algae (~70 g of nitrogen per kg of algae). Therefore, nitrogen recycling or utilization of waste nitrogen of 90% or more is required.
Table 6.
A comparison of the Experimental Case (EC), Highly Productive Case (HPC), and the targets needed for sustainable large-scale algal biofuel production.
| Algal Concentration (g/Lp) | Lipid Fraction (%dw) | Energy Consumption (kJ/Lp) | Production Cost ($/MLp) | Fresh Water Consumption (L/km traveled) | Nitrogen Consumption (g/kg algae) | |
|---|---|---|---|---|---|---|
| EC | 0.3 | 2 | 2600 | 112,000 | 5700 | 770 |
| HPC | 1 | 30 | 75 | 550 | 22 | 70 |
| Targets | 3 | 30 | 50 | 600 | 2.4 | 7 |
4.3. Innovation Pathways
Based on this analysis and consistent with some earlier research, there are a few approaches and areas of opportunity where innovations would make the biggest impact in terms of improving the energy balance, economic profitability, and water intensity of algal biofuel production. These improvements include:
- (1)
- using waste and recycled nutrients (e.g., waste water and animal waste) [11,15,25,26,27,28,65,71,72];
- (2)
- using waste heat and flue-gas from industrial plants [44,59], carbon in wastewater [28], or developing energy-efficient means of using atmospheric CO2;
- (3)
- developing ultra-productive algal strains (e.g., genetically modified organisms) [73,74,75];
- (4)
- minimizing pumping [58,76,77];
- (5)
- establishing energy-efficient water treatment and recycling methods [55];
- (6)
- employing energy-efficient harvesting methods, such as chemical flocculation [66,78,79], and
- (7)
- avoiding separation via distillation.
The development of genetically modified organisms that secrete oils might provide parallel reductions in energy expense, as the oil might be more easily collected. Policies (e.g., carbon legislation) and externalities could change algal biofuel economics, but not energy accounting. Additionally, algae can produce nutraceutical and pharmaceutical co-products, which could significantly improve the overall process economics. For comparison, co-products account for approximately 20% of the energy value for corn ethanol [13]; because co-products from algae find markets in higher value industries, algal fuels will likely have higher co-product allocation than from corn seed.
The most favorable scenario for algal biofuel production is one that can use each of the improvements listed above. Implementing growth and processing technology advancements, in conjunction with co-locating facilities with discounted energy and materials (i.e., electricity plants, waste water treatment plants, livestock feed lots, etc.) offers the potential for profitable algal biofuel production, and this concept has been proposed by several researchers [11,15,25,26,28,44]. However, relying on waste materials as feedstock relegates algal biofuel production to relatively low volumes [11,28,71].
Overall, it is most important that the EROI for the energy sector is greater than unity, including contributions from all energy resources. Although the results of this study suggest that the EROI for algal fuels will remain less than one without significant biotechnology innovations, algae represent one of the few alternative feedstocks capable of producing petroleum fuel substitutes directly (without expensive gasification or Fischer-Tropsch processes) for applications that require high energy-density, such as aviation. Thus, even though algal biofuels face significant hurdles before becoming large-scale substitutes for petroleum, they have the potential to satisfy niche markets in the short-term, while implementation of “game-changing” biotechnology advances are needed for sustainable large-scale algal biofuel production.
When looking forward towards those potential advances, it is the authors’ hope that the analytical approach presented in this manuscript will provide a useful framework with which progress can be tracked. Specifically, we think this framework will be useful for tracking energy, cost, water and other resource inputs and outputs of cultivation.
Abbreviations:
Products:
| BO | Bio-oil |
| BMF | Biomass Fuel |
| BF | Biofuel |
| BS | Biomass in slurry |
| BC | Biocrude |
| GM | Grown Mass |
| HM | Harvested Mass |
| LM | Lysed Mass |
| GV | Growth Volume |
| S | Subsidy |
Processes:
| G | Growth |
| P | Processing |
| R | Refining |
| H | Harvesting |
| CL | Cell Lysing |
| D | Distribution |
Efficiency:
| proc | Processing |
| ref | Refining |
| harv | Harvesting |
| cellys | Cell Lysing |
| sep | Separations |
Composition:
| LF | Lipid Fraction |
| NLF | Neutral Lipid Fraction |
Nomenclature :
| EROI | Energy Return On Investment |
| FROI | Financial Return On Investment |
| PFROI | Partial Financial Return On Investment |
| P | Productivity |
| M | Mass |
| V | Volume |
| φ | Efficiency |
| E | Energy |
| ED | Direct energy flows |
| EI | Indirect energy flows (in units of joules) |
| I | Irradiance (in units of joules per square meters per day) |
| tc | Cultivation time |
| d | Pond depth (in units of meters) |
| PE | Photosynthetic Efficiency |
| PAR | Photosynthetically Active Radiation |
| PTE | Photon Transmission Efficiency |
| PUE | Photon Utilization Efficiency |
| A | Photon-to-glucose conversion efficiency |
| HHV | Higher heating value |
| CoL | Cost of Living |
| τ | Glucose-to-biomass conversion efficiency |
| QF | Quality Factor |
| MP | Material Price (in units of dollars per kilogram) |
| EP | Energy Price (in units of dollars per joule) |
| EE | Energy Equivalent (in units of joules per kilogram) |
| R | Revenue |
| CC | Capital Cost |
| OC | Operating Cost |
| L | Labor |
| WCI | Water Consumption Intensity (in units of liters per km traveled) |
| WWI | Water Withdrawal Intensity (in units of liters per km traveled) |
| WC | Water Consumption (in units of liters) |
| WW | Water Withdrawal (in units of liters) |
| FE | Fuel Economy |
Accents:
Tilde denotes an input for a processing step | |
Apostrophe indicates units of joules per liter of processed volume | |
Inverted apostrophe indicates units of joules per liter of processed volume per day |
Acknowledgments
We would like to thank the entire algal biofuels research team at the University of Texas at Austin for collaboration on this research and OpenAlgae LLC for financial support.
Appendix
Table A1.
Experimental Case Inputs and Outputs. Data are reported in units of dollars per kL of processed volume ($/kLp) unless otherwise noted.
| Inputs and Outputs | Cost Equivalent ($/X) | Batch 1 | Batch 2 | Batch 3 | Batch 4 | Batch 5 | Ave Total Cost ($/kLp) | Percent of Total |
|---|---|---|---|---|---|---|---|---|
| Volume (L) | 947 | 974 | 1889 | 1893 | 1941 | |||
| Growth Total ($/kLp) | 97.68 | 101.16 | 97.07 | 184.89 | 45.06 | 105.17 | 93.18 | |
| Direct Water ($/kLp) | 1.1 $/kL | 2.22 | 2.24 | 1.78 | 2.56 | 1.29 | 2.02 | 1.79 |
| CO2 ($/kLp) | 0.022 $/kg | 0.23 | 0.23 | 0.16 | 0.32 | 0.09 | 0.21 | 0.18 |
| Urea ($/kL) | 0.30 $/kg | 0.08 | 0.08 | 0.17 | 0.33 | 0.05 | 0.14 | 0.12 |
| F/2 Media ($/kLp) | - | |||||||
| Sodium phosphate | 0.30 $/kg | 0.00 | 0.00 | 0.00 | 0.01 | 0.00 | 0.00 | 0.00 |
| B3N Media ($/kLp) | - | |||||||
| Sodium nitrate | 0.12 $/kg | 0.00 | 0.00 | 0.00 | 0.00 | 0.01 | 0.00 | 0.00 |
| Instant Ocean Salt ($/kLp) | 1.78 $/kg | 28.69 | 28.99 | 39.64 | 51.73 | 23.75 | 34.56 | 30.62 |
| Antibiotics ($/kLp) | 1.0 $/g | 2.03 | 2.05 | 0.72 | 4.64 | 0.00 | 1.89 | 1.67 |
| Lighting ($/kLp) | 0.028 $/MJ | 27.64 | 27.93 | 16.56 | 44.60 | 3.76 | 24.10 | 21.35 |
| Compressor ($/kLp) | 0.028 $/MJ | 11.54 | 11.88 | 8.98 | 18.42 | 4.18 | 11.00 | 9.75 |
| Transfers ($/kLp) | 0.028 $/MJ | 0.02 | 0.02 | 0.02 | 0.05 | 0.00 | 0.02 | 0.02 |
| Mixing ($/kLp) | 0.028 $/MJ | 23.54 | 26.00 | 27.80 | 60.25 | 10.09 | 29.53 | 26.17 |
| Greenhouse Fans ($/kLp) | 0.028 $/MJ | 1.70 | 1.72 | 1.23 | 1.98 | 1.82 | 1.69 | 1.50 |
| Harvesting Total | 0.54 | 0.52 | 0.78 | 0.70 | 0.64 | 0.64 | 0.57 | |
| Pump from pond ($/kLp) | 0.028 $/MJ | 0.04 | 0.04 | 0.05 | 0.07 | 0.06 | 0.05 | 0.04 |
| Forklift propane ($/kLp) | 0.6 $/L | 0.00 | 0.00 | 0.00 | 0.00 | 0.00 | 0.00 | 0.00 |
| Centrifuge ($/kLp) | 0.028 $/MJ | 0.39 | 0.38 | 0.45 | 0.38 | 0.35 | 0.39 | 0.35 |
| Centrifuge Pump ($/kLp) | 0.028 $/MJ | 0.11 | 0.11 | 0.28 | 0.24 | 0.24 | 0.20 | 0.17 |
| Lysing Total | 0.09 | 0.10 | 0.15 | 0.10 | 0.10 | 0.11 | 0.09 | |
| Pump ($/kLp) | 0.028 $/MJ | 0.00 | 0.00 | 0.00 | 0.00 | 0.00 | 0.00 | 0.00 |
| Power Supply ($/kLp) | 0.028 $/MJ | 0.09 | 0.10 | 0.13 | 0.09 | 0.09 | 0.10 | 0.09 |
| Fans ($/kLp) | 0.028 $/MJ | 0.00 | 0.00 | 0.02 | 0.01 | 0.01 | 0.01 | 0.01 |
| Extraction Total | 11.10 | 1.33 | 11.61 | 8.08 | 2.66 | 6.96 | 6.16 | |
| Membrane | ||||||||
| 2 Pumps ($/kLp) | 0.028 $/MJ | 0.01 | 0.04 | 0.04 | 0.01 | 0.07 | 0.03 | 0.03 |
| Distillation | ||||||||
| Feed Pump ($/kLp) | 0.028 $/MJ | 0.04 | 0.05 | 0.08 | 0.03 | 0.02 | 0.04 | 0.04 |
| Vacuum Pump ($/kLp) | 0.028 $/MJ | 0.61 | 0.49 | 0.65 | 0.29 | 0.22 | 0.45 | 0.40 |
| Stage 1 Heater ($/kLp) | 0.028 $/MJ | 0.15 | 0.18 | 0.28 | 0.11 | 0.07 | 0.16 | 0.14 |
| Stage 2 Heater ($/kLp) | 0.028 $/MJ | 0.05 | 0.01 | 0.04 | 0.01 | 0.01 | 0.02 | 0.02 |
| Chilled Water ($/kLp) | 8.9 $/kL | 3.45 | 3.58 | 3.68 | 4.38 | 1.46 | 3.31 | 2.93 |
| Heptane Loss ($/kLp) | 3 $/L | 6.79 | -3.02 | 6.84 | 3.25 | 0.80 | 2.93 | 2.60 |
| Refining Total | 0.00 | 0.00 | 0.00 | 0.00 | 0.00 | 0.00 | 0.00 | |
| Bio-oil refining ($/kLp) | 0.028 $/MJ | 0.00 | 0.00 | 0.00 | 0.00 | 0.00 | 0.00 | 0.00 |
| Refining Materials ($/kLp) | 0.36 $/kg | 0.00 | 0.00 | 0.00 | 0.00 | 0.00 | 0.00 | 0.00 |
| Biomass Fuel Refining ($/kLp) | 0.4 ¢/MJ | 0.00 | 0.00 | 0.00 | 0.00 | 0.00 | 0.00 | 0.00 |
| Total Input ($/kLp) | 109.41 | 103.12 | 109.60 | 193.78 | 58.46 | 112.87 | 100.00 | |
| Biocrude (g) | 1.5 g | 2.9 g | 4.9 g | 4.4 g | 2.1 g | |||
| Biomass in Slurry (g) | 154 g | 138 g | 301 g | 310 g | 383 g | |||
| Bio-oil ($/kLp) | 0.83 $/kg | 0.0013 | 0.0024 | 0.0022 | 0.0019 | 0.0009 | 0.0017 | 16.75 |
| Methane ($/kLp) | 0.21 $/kg | 0.0085 | 0.0074 | 0.0084 | 0.0086 | 0.0104 | 0.0087 | 83.25 |
| Total Output ($/kLp) | 0.010 | 0.010 | 0.010 | 0.010 | 0.011 | 0.010 | 100.00 | |
| Partial FROI (×103) (no subsidies or capital costs) | 0.09 | 0.10 | 0.10 | 0.05 | 0.23 | 0.092 |
Table 2A.
Highly Productive Case (HP) Inputs and Outputs.
| Inputs and Outputs | Cost Equivalent ($/X) | HP Case ($/MLp) | Percentage of HP Total | HP Case ($/gal bio-oil) |
|---|---|---|---|---|
| Growth Total | 422.33 | 76.83 | 6.18 | |
| Direct Water | 1.1 $/kL | 52.84 | 9.61 | 0.78 |
| CO2 | 0.022 $/kg | 176.00 | 32.02 | 2.59 |
| Urea | 0.30 $/kg | 51.44 | 9.36 | 0.74 |
| F/2 Media | - | |||
| Sodium phosphate monobasic hydrate | 0.30 $/kg | 13.00 | 2.36 | 0.18 |
| B3N Media | - | |||
| Sodium Nitrate | 0.12 $/kg | 0.00 | 0.00 | 0.00 |
| Instant Ocean Salt | 1.78 $/kg | 0.00 | 0.00 | 0.00 |
| Antibiotics | 1.0 $/g | 94.40 | 17.17 | 1.39 |
| Lighting | 0.028 $/MJ | 0.00 | 0.00 | 0.00 |
| Compressor | 0.028 $/MJ | 0.00 | 0.00 | 0.00 |
| Transfers | 0.028 $/MJ | 0.00 | 0.00 | 0.00 |
| Mixing | 0.028 $/MJ | 34.65 | 6.30 | 0.51 |
| Greenhouse Fans | 0.028 $/MJ | 0.00 | 0.00 | 0.00 |
| Harvesting Total | 65.68 | 11.95 | 0.97 | |
| Pump from pond | 0.028 $/MJ | 26.74 | 4.86 | 0.39 |
| Flocculants | 0.11 $/kg | 38.94 | 7.08 | 0.57 |
| Lysing Total | 5.88 | 1.07 | 0.09 | |
| Pump | 0.028 $/MJ | 0.10 | 0.02 | 0.00 |
| Power Supply | 0.028 $/MJ | 5.78 | 1.05 | 0.08 |
| Extraction Total | 43.40 | 7.90 | 0.64 | |
| Membrane | ||||
| 2 Pumps | 0.028 $/MJ | 0.00 | 0.00 | 0.00 |
| Distillation | ||||
| Feed Pump | 0.028 $/MJ | 0.00 | 0.00 | 0.00 |
| Vacuum Pump | 0.028 $/MJ | 0.09 | 0.02 | 0.00 |
| Stage 1 Heater | 0.028 $/MJ | 5.17 | 0.94 | 0.08 |
| Chilled Water | 8.9 $/kL | 37.78 | 6.87 | 0.56 |
| Heptane Loss | 3 $/L | 0.36 | 0.06 | 0.01 |
| Refining Total | 12.38 | 2.25 | 0.18 | |
| Bio-oil refining | 0.028 $/MJ | 1.66 | 0.30 | 0.02 |
| Refining Materials | 0.36 $/kg | 7.58 | 1.38 | 0.11 |
| Biomass Fuel Refining | 0.4 ¢/MJ | 3.15 | 0.57 | 0.05 |
| Total Input | 547.90 | 100.00 | 8.06 | |
| Biocrude | 208 g/kL | |||
| Biomass in Slurry | 599 g/kL | |||
| Bio-oil | 0.83 $/kg | 171.54 | 84.51 | 2.52 |
| Methane | 0.21 $/kg | 31.45 | 15.49 | 0.46 |
| Total Output | 202.99 | 100.00 | 2.99 | |
| Partial FROI (no subsidies or capital) | 0.37 |
Table 3A.
Water Consumption. Direct and indirect water consumption for 5 batches comprising the Experimental Case. Unless otherwise noted, data are reported in units of liters per thousand liters of processed volume (L/kLp).
| Inputs | Water Equiv. (L/X) | #1 (L/kLp) | #2 (L/kLp) | #3 (L/kLp) | #4 (L/kLp) | #5 (L/kLp) | Ave Water (L/kLp) |
|---|---|---|---|---|---|---|---|
| Vol. Processed (Lp) | 947 L | 974 L | 1889 L | 1893 L | 1941 L | ||
| Growth Total (L/kLp) | 3294.21 | 3372.86 | 2689.80 | 4716.68 | 1600.72 | 3134.85 | |
| Direct Water | 1 L/L | 2097.48 | 2119.67 | 1683.79 | 2420.20 | 1224.43 | 1909.11 |
| CO2 | 6.50 L/kg 1 | 66.95 | 68.81 | 46.21 | 95.00 | 27.03 | 60.80 |
| Urea | 7.88 L/kg 1 | 1.84 | 1.86 | 4.05 | 7.76 | 1.24 | 3.35 |
| F/2 Media | |||||||
| Sodium phosphate monobasic dihydrate | 10 L/kg 2 | 0.07 | 0.07 | 0.16 | 0.35 | 0.11 | 0.15 |
| Ferric chloride hexahydrate | 10 L/kg 2 | 0.04 | 0.04 | 0.10 | 0.22 | 0.07 | 0.10 |
| EDTA dihydrate | 10 L/kg 2 | 0.06 | 0.06 | 0.14 | 0.30 | 0.10 | 0.13 |
| B3N Media | |||||||
| Sodium Nitrate | 2.8 L/kg | 0.00 | 0.00 | 0.00 | 0.00 | 0.29 | 0.06 |
| Instant Ocean Salt (NaCl) | 0.00 | 0.00 | 0.00 | 0.00 | 0.00 | 0.00 | |
| Lighting | 0.49 L/MJ | 483.70 | 488.82 | 289.73 | 780.42 | 65.81 | 421.69 |
| Compressor | 0.49 L/MJ | 201.90 | 207.97 | 157.10 | 322.41 | 73.20 | 192.52 |
| Transfers | 0.49 L/MJ | 0.36 | 0.37 | 0.38 | 0.86 | 0.03 | 0.40 |
| Mixing | 0.49 L/MJ | 411.92 | 454.98 | 486.52 | 1054.31 | 176.53 | 516.86 |
| Greenhouse Fans | 0.49 L/MJ | 29.77 | 30.09 | 21.59 | 34.60 | 31.87 | 29.58 |
| Harvesting Total (L/kLp) | 9.44 | 9.11 | 13.67 | 12.23 | 11.21 | 11.13 | |
| Pump from pond | 0.49 L/MJ | 0.61 | 0.63 | 0.86 | 1.27 | 1.04 | 0.88 |
| Forklift propane | 0.3 L/L | 0.00 | 0.00 | 0.00 | 0.00 | 0.00 | 0.00 |
| Centrifuge | 0.49 L/MJ | 6.88 | 6.64 | 7.89 | 6.72 | 6.05 | 6.84 |
| Centrifuge Pump | 0.49 L/MJ | 1.94 | 1.84 | 4.91 | 4.24 | 4.13 | 3.41 |
| Lysing Total (L/kLp) | 1.51 | 1.79 | 2.58 | 1.74 | 1.69 | 1.86 | |
| Pump | 0.49 L/MJ | 0.01 | 0.01 | 0.01 | 0.02 | 0.01 | 0.01 |
| Power Supply | 0.49 L/MJ | 1.50 | 1.78 | 2.28 | 1.54 | 1.50 | 1.72 |
| Fans | 0.49 L/MJ | 0.00 | 0.00 | 0.28 | 0.19 | 0.18 | 0.13 |
| Extraction Total | 469.22 | 384.83 | 396.74 | 531.35 | 178.92 | 392.21 | |
| Membrane | |||||||
| 2 Pumps | 0.49 L/MJ | 0.13 | 0.62 | 0.75 | 0.24 | 1.25 | 0.60 |
| Distillation | |||||||
| Feed Pump | 0.49 L/MJ | 0.65 | 0.92 | 1.42 | 0.45 | 0.32 | 0.75 |
| Vacuum Pump | 0.49 L/MJ | 10.71 | 8.58 | 11.30 | 5.07 | 3.93 | 7.92 |
| Stage 1 Heater | 0.49 L/MJ | 2.66 | 3.08 | 4.89 | 1.98 | 1.24 | 2.77 |
| Stage 2 Heater | 0.49 L/MJ | 0.89 | 0.22 | 0.63 | 0.24 | 0.19 | 0.43 |
| Chilled Water | 1 L/L | 386.28 | 401.60 | 309.35 | 490.88 | 163.97 | 350.42 |
| Heptane Loss | 30 L/L 2 | 67.89 | -30.18 | 68.40 | 32.49 | 8.04 | 29.32 |
| Refining Total (L/kLp) | 0.01 | 0.01 | 0.01 | 0.01 | 0.00 | 0.01 | |
| Bio-oil refining | 0.49 L/MJ | 0.00 | 0.00 | 0.00 | 0.00 | 0.00 | 0.00 |
| Refining Materials | 30 L/L 2 | 0.00 | 0.01 | 0.01 | 0.01 | 0.00 | 0.01 |
| Biomass Fuel Refining | 0 L/MJ | 0.00 | 0.00 | 0.00 | 0.00 | 0.00 | 0.00 |
| Total Input (L/kLp) | 3774.38 | 3768.61 | 3102.79 | 5262.01 | 1792.55 | 3540.08 | |
| Outputs | #1 (mg/Lp) | #2 (mg/Lp) | #3 (mg/Lp) | #4 (mg/Lp) | #5 (mg/Lp) | ||
| Biocrude (mg/Lp) | 1.61 | 2.96 | 2.60 | 2.34 | 1.06 | ||
| Biomass in Slurry (mg/Lp) | 162.62 | 141.68 | 159.48 | 163.75 | 197.44 | ||
| Bio-oil (mg/Lp) | 1.61 | 2.96 | 2.60 | 2.34 | 1.06 | ||
| Methane (mg/Lp) | 40.98 | 35.70 | 40.19 | 41.27 | 49.76 | ||
| #1 (kJ/Lp) | #2 (kJ/Lp) | #3 (kJ/Lp) | #4 (kJ/Lp) | #5 (kJ/Lp) | |||
| Total Output (kJ/Lp) | 2.32 | 2.08 | 2.31 | 2.36 | 2.78 |
1 Derived from [80] including cooling water (12 kg of water per kg of ammonia); 2 Estimated roughly.
Table 4A.
Water Withdrawal. Direct and indirect water withdrawal for 5 batches comprising the Experimental Case. Unless otherwise noted, data are reported in units of liters per thousand liters of processed volume (L/kLp).
| Inputs and Outputs | Water Equiv. (L/X) | #1 (L/kLp) | #2 (L/kLp) | #3 (L/kLp) | #4 (L/kLp) | #5 (L/kLp) | Ave Water (L/kLp) |
|---|---|---|---|---|---|---|---|
| Vol. Processed (Lp) | 947.00 | 974.00 | 1,889.00 | 1,893.00 | 1,941.00 | ||
| Growth Total | 50,955.0 | 53,340.1 | 43,066.4 | 97,387.7 | 16,285.4 | 52,206.9 | |
| Direct Water | 1 L/L | 2,097.48 | 2,119.67 | 1,683.79 | 2,420.20 | 1,224.43 | 1,909.11 |
| CO2 | 6.50 L/kg 1 | 66.95 | 68.81 | 46.21 | 95.00 | 27.03 | 60.80 |
| Urea | 7.88 L/kg 1 | 1.84 | 1.86 | 4.05 | 7.76 | 1.24 | 3.35 |
| F/2 Media | |||||||
| Sodium phosphate monobasic dehydrate | 10 L/kg 2 | 0.07 | 0.07 | 0.16 | 0.35 | 0.11 | 0.15 |
| Ferric chloride hexahydrate | 10 L/kg 2 | 0.04 | 0.04 | 0.10 | 0.22 | 0.07 | 0.10 |
| EDTA dehydrate | 10 L/kg 2 | 0.06 | 0.06 | 0.14 | 0.30 | 0.10 | 0.13 |
| B3N Media | |||||||
| Sodium Nitrate | 2.8 L/kg | 0.00 | 0.00 | 0.00 | 0.00 | 0.29 | 0.06 |
| Instant Ocean Salt | 0 | 0.00 | 0.00 | 0.00 | 0.00 | 0.00 | 0.00 |
| Lighting | 21.2 L/MJ | 20,927.4 | 21,148.8 | 12,535.2 | 33,765.0 | 2,847.1 | 18,244.7 |
| Compressor | 21.2 L/MJ | 8,735.1 | 8,997.9 | 6,796.9 | 13,949.2 | 3,167.1 | 8,329.6 |
| Transfers | 21.2 L/MJ | 15.78 | 15.95 | 16.33 | 37.28 | 1.12 | 17.29 |
| Mixing | 21.2 L/MJ | 17,822.1 | 19,685.1 | 21,049.5 | 45,615.1 | 7,637.8 | 22,361.9 |
| Greenhouse Fans | 21.2 L/MJ | 1,288.09 | 1,301.72 | 934.07 | 1,497.05 | 1,378.96 | 1,279.98 |
| Harvesting Total | 408.49 | 394.18 | 591.24 | 529.13 | 484.99 | 481.61 | |
| Pump from pond | 21.2 L/MJ | 26.60 | 27.43 | 37.17 | 54.83 | 44.82 | 38.17 |
| Forklift propane | 0.30 L/L | 0.00 | 0.00 | 0.00 | 0.00 | 0.00 | 0.00 |
| Centrifuge | 21.2 L/MJ | 297.79 | 287.11 | 341.56 | 290.85 | 261.65 | 295.79 |
| Centrifuge Pump | 21.2 L/MJ | 84.11 | 79.64 | 212.52 | 183.44 | 178.51 | 147.64 |
| Lysing Total | 65.23 | 77.48 | 111.56 | 75.40 | 73.00 | 80.53 | |
| Pump | 21.2 L/MJ | 0.46 | 0.51 | 0.61 | 0.81 | 0.39 | 0.56 |
| Power Supply | 21.2 L/MJ | 64.76 | 76.97 | 98.83 | 66.53 | 64.75 | 74.37 |
| Fans | 21.2 L/MJ | 0.00 | 0.00 | 12.12 | 8.06 | 7.86 | 5.61 |
| Extraction Total | 1,105.17 | 952.09 | 1,199.45 | 868.55 | 471.39 | 919.33 | |
| Membrane | |||||||
| 2 Pumps | 21.2 L/MJ | 5.46 | 26.69 | 32.65 | 10.55 | 54.03 | 25.88 |
| Distillation | |||||||
| Feed Pump | 21.2 L/MJ | 28.21 | 39.96 | 61.41 | 19.35 | 13.76 | 32.54 |
| Vacuum Pump | 21.2 L/MJ | 463.40 | 371.41 | 488.87 | 219.32 | 169.86 | 342.57 |
| Stage 1 Heater | 21.2 L/MJ | 115.25 | 133.21 | 211.71 | 85.47 | 53.48 | 119.82 |
| Stage 2 Heater | 21.2 L/MJ | 38.68 | 9.40 | 27.07 | 10.48 | 8.26 | 18.78 |
| Chilled Water | 1 L/L | 386.28 | 401.60 | 309.35 | 490.88 | 163.97 | 350.42 |
| Heptane Loss | 30 L/L2 | 67.89 | -30.18 | 68.40 | 32.49 | 8.04 | 29.32 |
| Refining Total | 0.08 | 0.15 | 0.13 | 0.12 | 0.05 | 0.11 | |
| Bio-oil refining | 21.2 L/MJ | 0.08 | 0.14 | 0.12 | 0.11 | 0.05 | 0.10 |
| Refining Materials | 30 L/L2 | 0.00 | 0.01 | 0.01 | 0.01 | 0.00 | 0.01 |
| Biomass Fuel Refining | 0 L/MJ | 0.00 | 0.00 | 0.00 | 0.00 | 0.00 | 0.00 |
| Total Input (L/kLp) | 52,534.0 | 54,764.0 | 44,968.8 | 98,860.9 | 17,314.8 | 53,688.6 | |
| Mass Outputs | #1 (mg/Lp) | #2 (mg/Lp) | #3 (mg/Lp) | #4 (mg/Lp) | #5 (kJ/Lp) | ||
| Biocrude (mg/Lp) | 1.61 | 2.96 | 2.60 | 2.34 | 1.06 | ||
| Biomass in Slurry (mg/Lp) | 162.62 | 141.68 | 159.48 | 163.75 | 197.44 | ||
| Bio-oil (mg/Lp) | 1.61 | 2.96 | 2.60 | 2.34 | 1.06 | ||
| Methane (mg/Lp) | 40.98 | 35.70 | 40.19 | 41.27 | 49.76 | ||
| Energy (kJ/Lp) | #1 (kJ/Lp) | #2 (kJ/Lp) | #3 (kJ/Lp) | #4 (kJ/Lp) | #5 (kJ/Lp) | ||
| Total Output (kJ/Lp) | 2.32 | 2.08 | 2.31 | 2.36 | 2.78 |
1 Derived from [80]; 2 Estimated roughly.
Table 5A.
Water consumption and withdrawal summary for the Experimental Case and the Highly Productive Case.
| Water Consumption | Water Withdrawal | |||
|---|---|---|---|---|
| Experimental Case (L/kLp) | Highly Productive Case (L/kLp) | Experimental Case (L/kLp) | Highly Productive Case (L/kLp) | |
| Growth Total | 3,134.85 | 103.89 | 52,206.93 | 1,079.51 |
| Direct Water | 1,909.11 | 50.00 | 1,909.11 | 1,000.00 |
| CO2 | 60.80 | 52.00 | 60.80 | 52.00 |
| Urea | 3.35 | 1.20 | 3.35 | 1.20 |
| F/2 Media | ||||
| Sodium phosphate monobasic dehydrate | 0.15 | 0.08 | 0.15 | 0.08 |
| Ferric chloride hexahydrate | 0.10 | 0.00 | 0.10 | 0.00 |
| EDTA dehydrate | 0.13 | 0.00 | 0.13 | 0.00 |
| B3N Media | ||||
| Sodium Nitrate | 0.06 | 0.00 | 0.06 | 0.00 |
| Instant Ocean Salt | 0.00 | 0.00 | 0.00 | 0.00 |
| Lighting | 421.69 | 0.00 | 18,244.70 | 0.00 |
| Compressor | 192.52 | 0.00 | 8,329.26 | 0.00 |
| Transfers | 0.40 | 0.00 | 17.29 | 0.00 |
| Mixing | 516.86 | 0.61 | 22,361.90 | 26.24 |
| Greenhouse Fans | 29.58 | 0.00 | 1,279.98 | 0.00 |
| Harvesting Total | 11.13 | 7.55 | 481.61 | 27.33 |
| Pump from pond | 0.88 | 0.47 | 38.17 | 20.25 |
| Forklift propane | 0.00 | 0.00 | 0.00 | 0.00 |
| Centrifuge | 6.84 | 0.00 | 295.79 | 0.00 |
| Centrifuge Pump | 3.41 | 0.00 | 147.64 | 0.00 |
| Flocculants | 7.081 | 7.081 | ||
| Lysing Total | 1.86 | 0.10 | 80.53 | 4.45 |
| Pump | 0.01 | 0.00 | 0.56 | 0.08 |
| Power Supply | 1.72 | 0.10 | 74.37 | 4.37 |
| Fans | 0.13 | 0.00 | 5.61 | 0.00 |
| Extraction Total | 392.21 | 4.42 | 919.33 | 8.32 |
| Membrane | ||||
| 2 Pumps | 0.60 | 0.00 | 25.88 | 0.00 |
| Distillation | ||||
| Feed Pump | 0.75 | 0.00 | 32.54 | 0.00 |
| Vacuum Pump | 7.92 | 0.00 | 342.57 | 0.07 |
| Stage 1 Heater | 2.77 | 0.09 | 119.82 | 3.92 |
| Stage 2 Heater | 0.43 | 0.00 | 18.78 | 0.00 |
| Chill Water | 350.42 | 4.33 | 350.42 | 4.33 |
| Heptane Loss | 29.32 | 0.00 | 29.32 | 0.00 |
| Refining Total | 0.01 | 0.23 | 0.11 | 10.36 |
| Bio-oil refining | 0.00 | 0.22 | 0.10 | 9.73 |
| Refining Materials | 0.01 | 0.00 | 0.01 | 0.62 |
| Biomass Fuel Refining | 0.00 | 0.00 | 0.00 | 0.00 |
| Total Input (L/kLp) | 3,540.08 | 116.19 | 53,688.61 | 1,129.97 |
| Outputs | (mg/Lp) | (mg/Lp) | (mg/Lp) | (mg/Lp) |
| Biocrude (mg/Lp) | 2.11 | 207.77 | 2.11 | 207.77 |
| Biomass in Slurry (mg/Lp) | 164.99 | 598.50 | 164.99 | 598.50 |
| Bio-oil (mg/Lp) | 2.11 | 207.77 | 2.11 | 207.77 |
| Methane (mg/Lp) | 41.58 | 150.82 | 41.58 | 150.82 |
| (kJ/Lp) | (kJ/Lp) | (kJ/Lp) | (kJ/Lp) | |
| Total Output (kJ/Lp) | 2.37 | 16.61 | 2.37 | 16.61 |
1 Estimated roughly as 20 L/kg of flocculant for consumption and withdrawal.
Table 6A.
Water intensity of transportation from bio-oil and methane derived from the algal biofuel production pathway.
| Consumption | Experimental Case | Highly Productive Case |
| Mining/Farming (Growth) (L/kL) | 3134.85 | 103.89 |
| Processing/Refining (L/kL) | 405.21 | 12.30 |
| Total Water Consumed per Vol. Processed (L/kL) | 3,540.06 | 116.19 |
| Bio-oil Produced per Vol. Processed (kg/kL) | 0.002 | 0.21 |
| Methane Produced per Vol. Processed (kg/kL) | 0.04 | 0.15 |
| Energy Output per Vol. Processed (MJ/kL) | 2.37 | 16.61 |
| Water Consumed per kg bio-oil (kL/kg) | 1,675.27 | 0.56 |
| Water Consumed per kg methane (kL/kg) | 85.14 | 0.77 |
| Water Consumed per Energy Output (L/MJ) | 1,492.85 | 7.00 |
| Miles Traveled from Bio-oil per Vol. Processed (mile/ML) | 19.68 | 1,934.93 |
| Miles Traveled from Methane per Vol. Processed (mile/ML) | 365.94 | 1,327.43 |
| Total Miles Traveled per Vol. Processed (mile/ML) | 385.62 | 3,262.36 |
| Water Consumption from Mining/Farming (Growth) (gal/mile) | 2,147.76 | 8.41 |
| Water Consumption for Processing/Refining (gal/mile) | 277.62 | 1.00 |
| Water Consumption per Mile (L/mile) | 9,180.07 | 35.62 |
| Water Consumption per Mile (gal/mile) | 2,425.38 | 9.41 |
| Water Consumption per km (L/km) | 5,737.54 | 22.26 |
| Withdrawal | Experimental Case | Highly Productive Case |
| Mining/Farming (Growth) (L/kL) | 52,206.77 | 1,079.51 |
| Processing/Refining (L/kL) | 1,481.58 | 50.46 |
| Water Withdrawn per Vol. Processed (L/kL) | 53,688.35 | 1,129.97 |
| Bio-oil Produced per Vol. Processed (kg/kL) | 0.002 | 0.21 |
| Methane Produced per Vol. Processed (kg/kL) | 0.04 | 0.15 |
| Energy Output per Vol. Processed (MJ/kL) | 2.37 | 16.61 |
| Water Withdrawn per kg bio-oil (kL/kg) | 25,407.04 | 5.44 |
| Water Withdrawn per kg methane (kL/kg) | 1,291.25 | 7.49 |
| Water Withdrawn per Energy Output (L/MJ) | 22,640.43 | 68.05 |
| Miles Traveled from Bio-oil per Vol. Processed (mile/ML) | 19.68 | 1,934.93 |
| Miles Traveled from Methane per Vol. Processed (mile/ML) | 365.94 | 1,327.43 |
| Total Miles Traveled per Vol. Processed (mile/ML) | 385.62 | 3,262.36 |
| Water Withdrawn from Mining/Farming (Growth) (gal/mile) | 35,768.12 | 87.42 |
| Water Withdrawn for Processing/Refining (gal/mile) | 1,015.07 | 4.09 |
| Water Withdrawn per Mile (L/mile) | 139,224.38 | 346.37 |
| Water Withdrawn per Mile (gal/mile) | 36,783.19 | 91.51 |
| Water Withdrawal per km (L/km) | 87015.23 | 216.48 |
References
- Wijffels, R.H.; Barbosa, M.J. An outlook on microalgal biofuels. Science 2010, 329, 796–799. [Google Scholar] [CrossRef] [PubMed]
- Schenk, P.; Thomas-Hall, S.; Stephens, E.; Marx, U.; Mussgnug, J.; Posten, C.; Kruse, O.; Hankamer, B. Second generation biofuels: high-efficiency microalgae for biodiesel production. BioEnergy Res. 2008, 1, 20–43. [Google Scholar] [CrossRef]
- Sheehan, J.; Dunahay, T.; Benemann, J.; Roessler, P. A Look Back at the U.S. Department of Energy’s Aquatic Species Program, Biodiesel from Algae; NREL and U.S. Department of Energy’s Office of Fuels Development: Golden, CO, USA, 1998. [Google Scholar]
- Hall, C.A.S.; Balogh, S.; Murphy, D.J.R. What is the minimum EROI that a sustainable society must have? Energies 2009, 2, 25–47. [Google Scholar] [CrossRef]
- Mulder, K.; Hagens, N.J. Energy return on investment: toward a consistent framework. AMBIO J. Hum. Environ. 2009, 37, 74–79. [Google Scholar] [CrossRef]
- Beal, C.M.; Smith, C.H.; Webber, M.E.; Ruoff, R.S.; Hebner, R.E. A framework to report the production of renewable diesel from algae. BioEnergy Res. 2011, 4, 36–60. [Google Scholar] [CrossRef]
- Amin, S. Review on biofuel oil and gas production processes from microalgae. Energy Convers. Manag. 2009, 50, 1834–1840. [Google Scholar] [CrossRef]
- Brennan, L.; Owende, P. Biofuels from microalgae—A review of technologies for production, processing, and extractions of biofuels and co-products. Renew. Sustain. Energy Rev. 2010, 14, 557–577. [Google Scholar] [CrossRef]
- Subhadra, B.G.; Edwards, M. Coproduct market analysis and water footprint of simulated commercial algal biorefineries. Appl. Energy 2011, 88, 3515–3523. [Google Scholar] [CrossRef]
- Collet, P.; Helias, A.; Lardon, L.; Ras, M.; Goy, R.; Steyer, J. Life-cycle assessment of microalgae culture coupled to biogas production. Bioresour. Technol. 2011, 102, 207–214. [Google Scholar] [CrossRef] [PubMed]
- Lundquist, T.J.; Woertz, I.C.; Quinn, N.W.T.; Benemann, J.R. A Realistic Technology and Engineering Assessment of Algae Biofuel Production; Energy Biosciences Institute: Berkeley, CA, USA, 2010. [Google Scholar]
- Sialve, B.; Bernet, N.; Bernard, O. Anaerobic digestion of microalgae as a necessary step to make microalgal biodiesel sustainable. Biotechnol. Adv. 2009, 27, 409–416. [Google Scholar] [CrossRef] [PubMed]
- Farrell, A.E.; Plevin, R.J.; Turner, B.T.; Jones, A.D.; O’Hare, M.; Kammen, D.M. Ethanol can contribute to energy and environmental goals. Science 2006, 311, 506–508. [Google Scholar] [CrossRef] [PubMed]
- Beal, C.M.; Hebner, R.E.; Webber, M.E.; Ruoff, R.S.; Seibert, A.F. The energy return on investment for algal biocrude: Results for a research production facility. BioEnergy Res. 2012, 5, 341–262. [Google Scholar] [CrossRef]
- Clarens, A.F.; Resurreccion, E.P.; White, M.A.; Colosi, L.M. Environmental life cycle comparison of algae to other bioenergy feedstocks. Environ. Sci. Technol. 2010, 44, 1813–1819. [Google Scholar] [CrossRef] [PubMed]
- Davis, R.; Aden, A.; Pienkos, P.T. Techno-economic analysis of autotrophic microalgae for fuel production. Appl. Energy 2011, 88, 3524–3531. [Google Scholar] [CrossRef]
- Lardon, L.; Helias, A.; Sialve, B.; Steyer, J.; Bernard, O. Life-cycle assessment of biodiesel production from microalgae. Environ. Sci. Technol. 2009, 43, 6475–6481. [Google Scholar] [CrossRef] [PubMed]
- Pate, R.; Klise, G.; Wu, B. Resource demand implications for US algae biofuels production scale-up. Appl. Energy 2011, 88, 3377–3388. [Google Scholar] [CrossRef]
- Beal, C.M. Constraints on Algal Biofuel Production. Ph.D. Thesis, University of Texas at Austin, Austin, TX, USA, May 2011. [Google Scholar]
- Beal, C.M.; Hebner, R.E.; Romanovicz, D.; Mayer, C.C.; Connelly, R. Progression of lipid profile and cell structure in a research production pathway for algal biocrude. Renew. Energy 2012, in press. [Google Scholar]
- Jones, J.; Manning, S.; Montoya, M.; Keller, K.; Poenie, M. Analysis of Algal Lipids by HPLC and Mass Spectroscopy. J. Am. Oil Chem Soc. 2012. [Google Scholar] [CrossRef]
- Nordbäck, J.; Lundberg, E.; Christie, W.W. Separation of lipid classes from marine particulate material by HPLC on a polyvinyl alcohol-bonded stationary phase using dual-channel evaporative light-scattering detection. Mar. Chem. 1998, 60, 165–175. [Google Scholar] [CrossRef]
- Gillan, F.T.; Johns, R.B. Normal-phase hplc analysis of microbial carotenoids and neutral lipids. J. Chromatogr. Sci. 1983, 21, 34–38. [Google Scholar] [CrossRef] [PubMed]
- Graeve, M.; Janssen, D. Improved separation and quantification of neutral and polar lipid classes by HPLC-ELSD using a monolithic silica phase: Application to exceptional marine lipids. J. Chromatogr. B 2009, 877, 1815–1819. [Google Scholar] [CrossRef]
- Pittman, J.K.; Dean, A.P.; Osundeko, O. The potential of sustainable algal biofuel production using wastewater resources. Bioresour. Technol. 2011, 102, 17–25. [Google Scholar] [CrossRef] [PubMed]
- Sturm, B.S.M.; Lamer, S.L. An energy evaluation of coupling nutrient removal from wastewater with algal biomass production. Appl. Energy 2011, 88, 3499–3506. [Google Scholar] [CrossRef]
- Batan, L.; Quinn, J.; Willson, B.; Bradley, T. Net energy and greenhouse gas emission evaluation of biodiesel derived from microalgae. Environ. Sci. Technol. 2010, 44, 7975–7980. [Google Scholar] [CrossRef] [PubMed]
- Beal, C.M.; Stillwell, A.S.; King, C.W.; Cohen, S.M.; Berberoglu, H.; Bhattarai, R.; Connelly, R.; Webber, M.E.; Hebner, R.E. Energy return on investment for algal biofuel production coupled with wastewater treatment. Water Environ. Res. 2012, in press. [Google Scholar]
- Beal, C.M.; Hebner, R.E.; Webber, M.E. Thermodynamic analysis of algal biofuel production. Available online: http://dx.doi.org.ezproxy.lib.utexas.edu/10.1016/j.energy.2012.05.003 (accessed on 8 June 2012).
- Weyer, K.; Bush, D.; Darzins, A.; Willson, B. Theoretical maximum algal oil production. BioEnergy Res. 2010, 3, 204–213. [Google Scholar] [CrossRef]
- Cleveland, C.J.; Kaufmann, R.K.; Stern, D.I. Aggregation and the role of energy in the economy. Ecol. Econ. 2000, 32, 301–317. [Google Scholar] [CrossRef]
- Energy Information Agency. Annual Energy Outlook 2010: DOE/EIA-0383(2010); Energy Information Agency: Washington, DC, USA, 2010. [Google Scholar]
- King, C.W.; Webber, M.E. Water intensity of transportation. Environ. Sci. Technol. 2008, 42, 7866–7872. [Google Scholar] [CrossRef] [PubMed]
- Mulder, K.; Hagens, N.; Fisher, B. Burning water: A comparative analysis of the energy return on water invested. AMBIO J. Hum. Environ. 2010, 39, 30–39. [Google Scholar] [CrossRef]
- Oyler, J.; Catalytic Hydrothermal Gasification. Genifuel, Halethorpe, MD, USA. Personal Communication, 2010.
- Cleveland, C.J. Net energy from the extraction of oil and gas in the United States. Energy 2005, 30, 769–782. [Google Scholar] [CrossRef]
- King, C.W. Energy intensity ratios as net energy measures of United States energy production and expenditures. Environ. Res. Lett. 2010, 5. [Google Scholar] [CrossRef]
- Xu, L.; Brilman, D.W.F.; Withag, J.A.M.; Brem, G.; Kersten, S. Assessment of a dry and a wet route for the production of biofuels from microalgae: Energy balance analysis. Bioresour. Technol. 2011, 102, 5113–5122. [Google Scholar] [CrossRef] [PubMed]
- Natural Gas Overview: Table 6.1, EIA. Available online: http://www.eia.gov/totalenergy/data/annual/txt/ptb0601.html (accessed on 13 June 2012).
- Austin Water, Austin City Connection. Available online: http://www.austintexas.gov/department/ austin-water-utility-statistics (accessed on 14 April 2011).
- Summary Statistics for the United States: Electric Power Annual data for 2009, EIA. 2011. Available online: http://205.254.135.7/electricity/annual/archive/03482009.pdf (accessed on 8 February 2011).
- Hockstad, L.; Cook, B. 2011 Draft. U.S. Greenhouse Gas Inventory Report. 2011. Available online: http://www.epa.gov/climatechange/emissions/usinventoryreport.html (accessed on 13 June 2012). [Google Scholar]
- Huang, W. Impact of Rising Natural Gas Prices on U.S. Ammonia Supply. Available online: http://www.ers.usda.gov/publications/wrs0702/ (accessed on 31 October 2010).
- Campbell, P.K.; Beer, T.; Batten, D. Life cycle assessment of biodiesel production from microalgae in ponds. Bioresour. Technol. 2010, 102, 50–56. [Google Scholar] [CrossRef] [PubMed]
- Chisti, Y. Biodiesel from microalgae. Biotechnol. Adv. 2007, 25, 294–306. [Google Scholar] [CrossRef] [PubMed]
- Murphy, C. Analysis of Innovative Feedstock Sources and Production Technologies for Renewable Fuels: Chapter 6. Algal Oil Biodiesel, EPA: XA-83379501-0; University of Texas: Austin, TX, USA, 2010. [Google Scholar]
- Ramírez, C.A.; Worrell, E. Feeding fossil fuels to the soil: An analysis of energy embedded and technological learning in the fertilizer industry. Resour. Conserv. Recycl. 2006, 46, 75–93. [Google Scholar] [CrossRef]
- Sheehan, J.; Camobreco, V.; Duffield, J.; Shapouri, H.; Graboski, M.; Tyson, K.S. An Overview of Biodiesel and Petroleum Diesel Life Cycles. 2000; Technical Report. 2000; NREL/TP-580-24772. [Google Scholar]
- Wu, H.; Fu, Q.; Giles, R.; Bartle, J. Production of mallee biomass in Western Australia: Energy balance analysis. Energy Fuels 2007, 22, 190–198. [Google Scholar] [CrossRef]
- U.S. Life-Cycle Inventory Database; NREL: Golden, CO, USA, 2008; Volume 1.6.0.
- Worrell, E.; Phylipsen, D.; Einstein, D.; Martin, N. Energy Use and Energy Intensity of the U.S. Chemical Industry; 2000; p. 40. [Google Scholar]
- Lundquist, T.J.; Woertz, I.C.; Quinn, N.W.T.; Benemann, J.R. A Realistic Technology and Engineering Assessment of Algae Biofuel Production; EBI: Berkeley, CA, USA, 2010. [Google Scholar]
- Henshaw, P.; King, C.W.; Zarnikau, J. System Energy Assessment (SEA), Defining a Standard Measure of EROI for Energy Businesses as Whole Systems. Sustainability 2011, 3, 1908–1943. [Google Scholar] [CrossRef]
- Harto, C.; Meyers, R.; Williams, E. Life cycle water use of low-carbon transport fuels. Energy Policy 2010, 38, 4933–4944. [Google Scholar] [CrossRef]
- Yang, J.; Xu, M.; Zhang, X.; Hu, Q.; Sommerfeld, M.; Chen, Y. Life-cycle analysis on biodiesel production from microalgae: Water footprint and nutrients balance. Bioresour. Technol. 2010, 102, 159–165. [Google Scholar] [CrossRef] [PubMed]
- Energy Independence and Security Act of 2007, One Hundred Tenth Congress of the United States of America. Available online: http://www.govtrack.us/congress/bills/110/hr6 (accessed on June 2012).
- Benemann, J.; Oswald, W. Systems and Economic Analysis of Microalgae Ponds for Conversion of CO2 to Biomass; U.S. Department of Energy: Washington, DC, USA, 1996. [Google Scholar]
- Jorquera, O.; Kiperstok, A.; Sales, E.A.; Embiruçu, M.; Ghirardi, M.L. Comparative energy life-cycle analyses of microalgal biomass production in open ponds and photobioreactors. Bioresour. Technol. 2010, 101, 1406–1413. [Google Scholar] [CrossRef] [PubMed]
- Kadam, K.L. Environmental implications of power generation via coal-microalgae cofiring. Energy 2002, 27, 905–922. [Google Scholar] [CrossRef]
- Pruvost, J.; van Vooren, G.; Cogne, G.; Legrand, J. Investigation of biomass and lipids production with Neochloris oleoabundans in photobioreactor. Bioresour. Technol. 2009, 100, 5988–5995. [Google Scholar] [CrossRef] [PubMed]
- Li, X.; Xu, H.; Wu, Q. Large-scale biodiesel production from microalga Chlorella protothecoides through heterotrophic cultivation in bioreactors. Biotechnol. Bioeng. 2007, 98, 764–771. [Google Scholar] [CrossRef] [PubMed]
- Hu, Q.; Sommerfeld, M.; Jarvis, E.; Ghirardi, M.; Posewitz, M.; Seibert, M.; Darzins, A. Microalgal triacylglycerols as feedstocks for biofuel production: Perspectives and advances. Plant J. 2008, 54, 621–639. [Google Scholar] [CrossRef] [PubMed]
- Miao, X.; Wu, Q. Biodiesel production from heterotrophic microalgal oil. Bioresour. Technol. 2006, 97, 841–846. [Google Scholar] [CrossRef] [PubMed]
- Meng, X.; Yang, J.; Xu, X.; Zhang, L.; Nie, Q.; Xian, M. Biodiesel production from oleaginous microorganisms. Renew. Energy 2009, 34, 1–5. [Google Scholar] [CrossRef]
- Wang, B.; Lan, C.Q. Biomass production and nitrogen and phosphorus removal by the green alga Neochloris oleoabundans in simulated wastewater and secondary municipal wastewater effluent. Bioresour. Technol. 2011, 102, 5639–5644. [Google Scholar] [CrossRef] [PubMed]
- Molina Grima, E.; Belarbi, E.H.; Acién Fernández, F.G.; Robles Medina, A.; Chisti, Y. Recovery of microalgal biomass and metabolites: Process options and economics. Biotechnol. Adv. 2003, 20, 491–515. [Google Scholar] [CrossRef] [PubMed]
- Choi, J. Pilot Scale Evaluation of Algae Harvesting Technologies for Biofuel Production. M.S. Thesis, University of Texas at Austin: Austin, TX, USA, 2009. [Google Scholar]
- Umdu, E.S.; Tuncer, M.; Seker, E. Transesterification of Nannochloropsis oculata microalga’s lipid to biodiesel on Al2O3 supported CaO and MgO catalysts. Bioresour. Technol. 2009, 100, 2828–2831. [Google Scholar] [CrossRef] [PubMed]
- Demirbas, A. Progress and recent trends in biodiesel fuels. Energy Convers. Manag. 2009, 50, 14–34. [Google Scholar] [CrossRef]
- Meher, L.C.; Vidya Sagar, D.; Naik, S.N. Technical aspects of biodiesel production by transesterification—A review. Renew. Sustain. Energy Rev. 2006, 10, 248–268. [Google Scholar] [CrossRef]
- Christenson, L.; Sims, R. Production and harvesting of microalgae for wastewater treatment, biofuels, and bioproducts. Biotechnol. Adv. 2011, 29, 686–702. [Google Scholar] [CrossRef] [PubMed]
- Woertz, I.; Feffer, A.; Lundquist, T.; Nelson, Y. Algae grown on dairy and municipal wastewater for simultaneous nutrient removal and lipid production for biofuel feedstock. J. Environ. Eng. 2009, 135, 1115–1122. [Google Scholar] [CrossRef]
- Radakovits, R.; Jinkerson, R.E.; Darzins, A.; Posewitz, M.C. Genetic engineering of algae for enhanced biofuel production. Eukaryot. Cell 2010, 9, 486–501. [Google Scholar] [CrossRef] [PubMed]
- Robertson, D.; Jacobson, S.; Morgan, F.; Berry, D.; Church, G.; Afeyan, N. A new dawn for industrial photosynthesis. Photosynth. Res. 2011, 107, 269–277. [Google Scholar] [CrossRef] [PubMed]
- Rosenberg, J.N.; Oyler, G.A.; Wilkinson, L.; Betenbaugh, M.J. A green light for engineered algae: Redirecting metabolism to fuel a biotechnology revolution. Curr. Opin. Biotechnol. 2008, 19, 430–436. [Google Scholar] [CrossRef] [PubMed]
- Bolhouse, A.; Ozkan, A.; Berberoglu, H. Rheological Study of Algae Slurries for Minimizing Pumping Power. In Proceedings of the ASME-IMECE 2010, Vancouver, Canada, 13–18 November 2010.
- Murphy, C.; Allen, D. The energy water nexus of mass cultivation of algae. Environ. Sci. Technol. 2011, 45, 5861–5868. [Google Scholar] [CrossRef] [PubMed]
- Henderson, R.; Parsons, S.; Jefferson, B. The impact of algal properties and pre-oxidation on solid-liquid separation of algae. Water Res. 2008, 42, 1827–1845. [Google Scholar] [CrossRef] [PubMed]
- Poelman, E.; De Pauw, N.; Jeurissen, B. Potential of electrolytic flocculation for recovery of micro-algae. Resour. Conserv. Recycl. 1997, 19, 1–10. [Google Scholar] [CrossRef]
- Jiménez-González, C.; Kim, S.; Overcash, M. Methodology for developing gate-to-gate Life cycle inventory information. Int. J. Life Cycle Assess. 2000, 5, 153–159. [Google Scholar] [CrossRef]
© 2012 by the authors; licensee MDPI, Basel, Switzerland. This article is an open access article distributed under the terms and conditions of the Creative Commons Attribution license (http://creativecommons.org/licenses/by/3.0/).