1. Introduction
A liquid electrolyte lithium/sulfur (Li/S) cell is a liquid electrochemical system. In discharge, elemental sulfur is first reduced to highly soluble Li
2S
8, which dissolves into the organic electrolyte and serves as the liquid cathode (or called catholyte), followed by further reductions on the electrolyte-carbon interface [
1,
2]. This concept has been verified by Li/S cells with a dual-layer structural cathode consisting of a porous carbon cloth as the current collector and a porous sulfur membrane as the sulfur source [
3]. Since sulfur and its reduction products are neither electronically nor ionically conductive, the operations of such cells entirely depend on the dissolution of lithium polysulfide (PS) in the liquid electrolyte, which makes it possible for the cell reactions to occur on the electrolyte-carbon interface. Determined by the nature of liquid electrochemical system, the performance of Li/S cells is greatly affected by the properties of PS solution, including PS solubility in electrolyte, viscosity of PS solution, and chemical compatibility between the electrolyte components and PS anions. Due to the strongly nucleophilic reactivity of PS anions, the electrolyte solvents of Li/S cells are mainly limited within the linear and cyclic ethers, such as dimethyl ether (DME), 1,3-dioxolane (DOL), and various glymes [
1,
2,
3,
4,
5,
6]. Other solvents, such as the carbonates widely used in Li-ion batteries, are chemically incompatible with Li/S chemistry [
7].
In Li/S cells, the dissolution of PS in the liquid electrolyte plays two opposite roles. On one hand, the dissolution facilitates the cell’s reactions of the non-conductive sulfur and PS species, while on the other hand, it causes redox shuttle reactions of PS anions between the two electrodes, which reduces the cell’s cycling efficiency while it increases the cell’s self-discharge. Provided that the redox shuttle reactions can be suppressed, an electrolyte with high PS solubility and low viscosity is highly desirable for good cycling performance of Li/S cells. Based on this consideration, Liang
et al. [
8] successfully improved the specific capacity and capacity retention of Li/S cells by addition of small amount of P
2S
5 into the electrolyte to form more soluble P
2S
5-S
x and P
2S
5-Li
2S
x complexes, which meanwhile passivate the Li surface to suppress redox shuttle reactions. In recent years, research efforts on rechargeable Li/S batteries have been overwhelmingly focused on so-called “sulfur-carbon composite”. This approach usually results in two lows,
i.e., low sulfur content and low sulfur loading. In most cases, the good results of the Li/S cells have been obtained from the cathodes with sulfur content lower than 65% and sulfur loading less than 2 mg cm
−2 [
9,
10,
11,
12,
13,
14,
15]. Even using these sulfur-carbon composites, the Li/S cells still are a liquid electrochemical system except that the dissolved PS are physically adsorbed on the carbon surface or absorbed within the carbon’s pores. To take the advantage of the high energy density of Li/S cells, one should aim for a cathode with high sulfur content and sulfur loading. In this paper, we report an improvement on the cyclability of Li/S cells by simply optimizing the electrolyte/sulfur (E/S) ratio and propose an empirical method for the determination of an optimized E/S ratio.
2. Results and Discussion
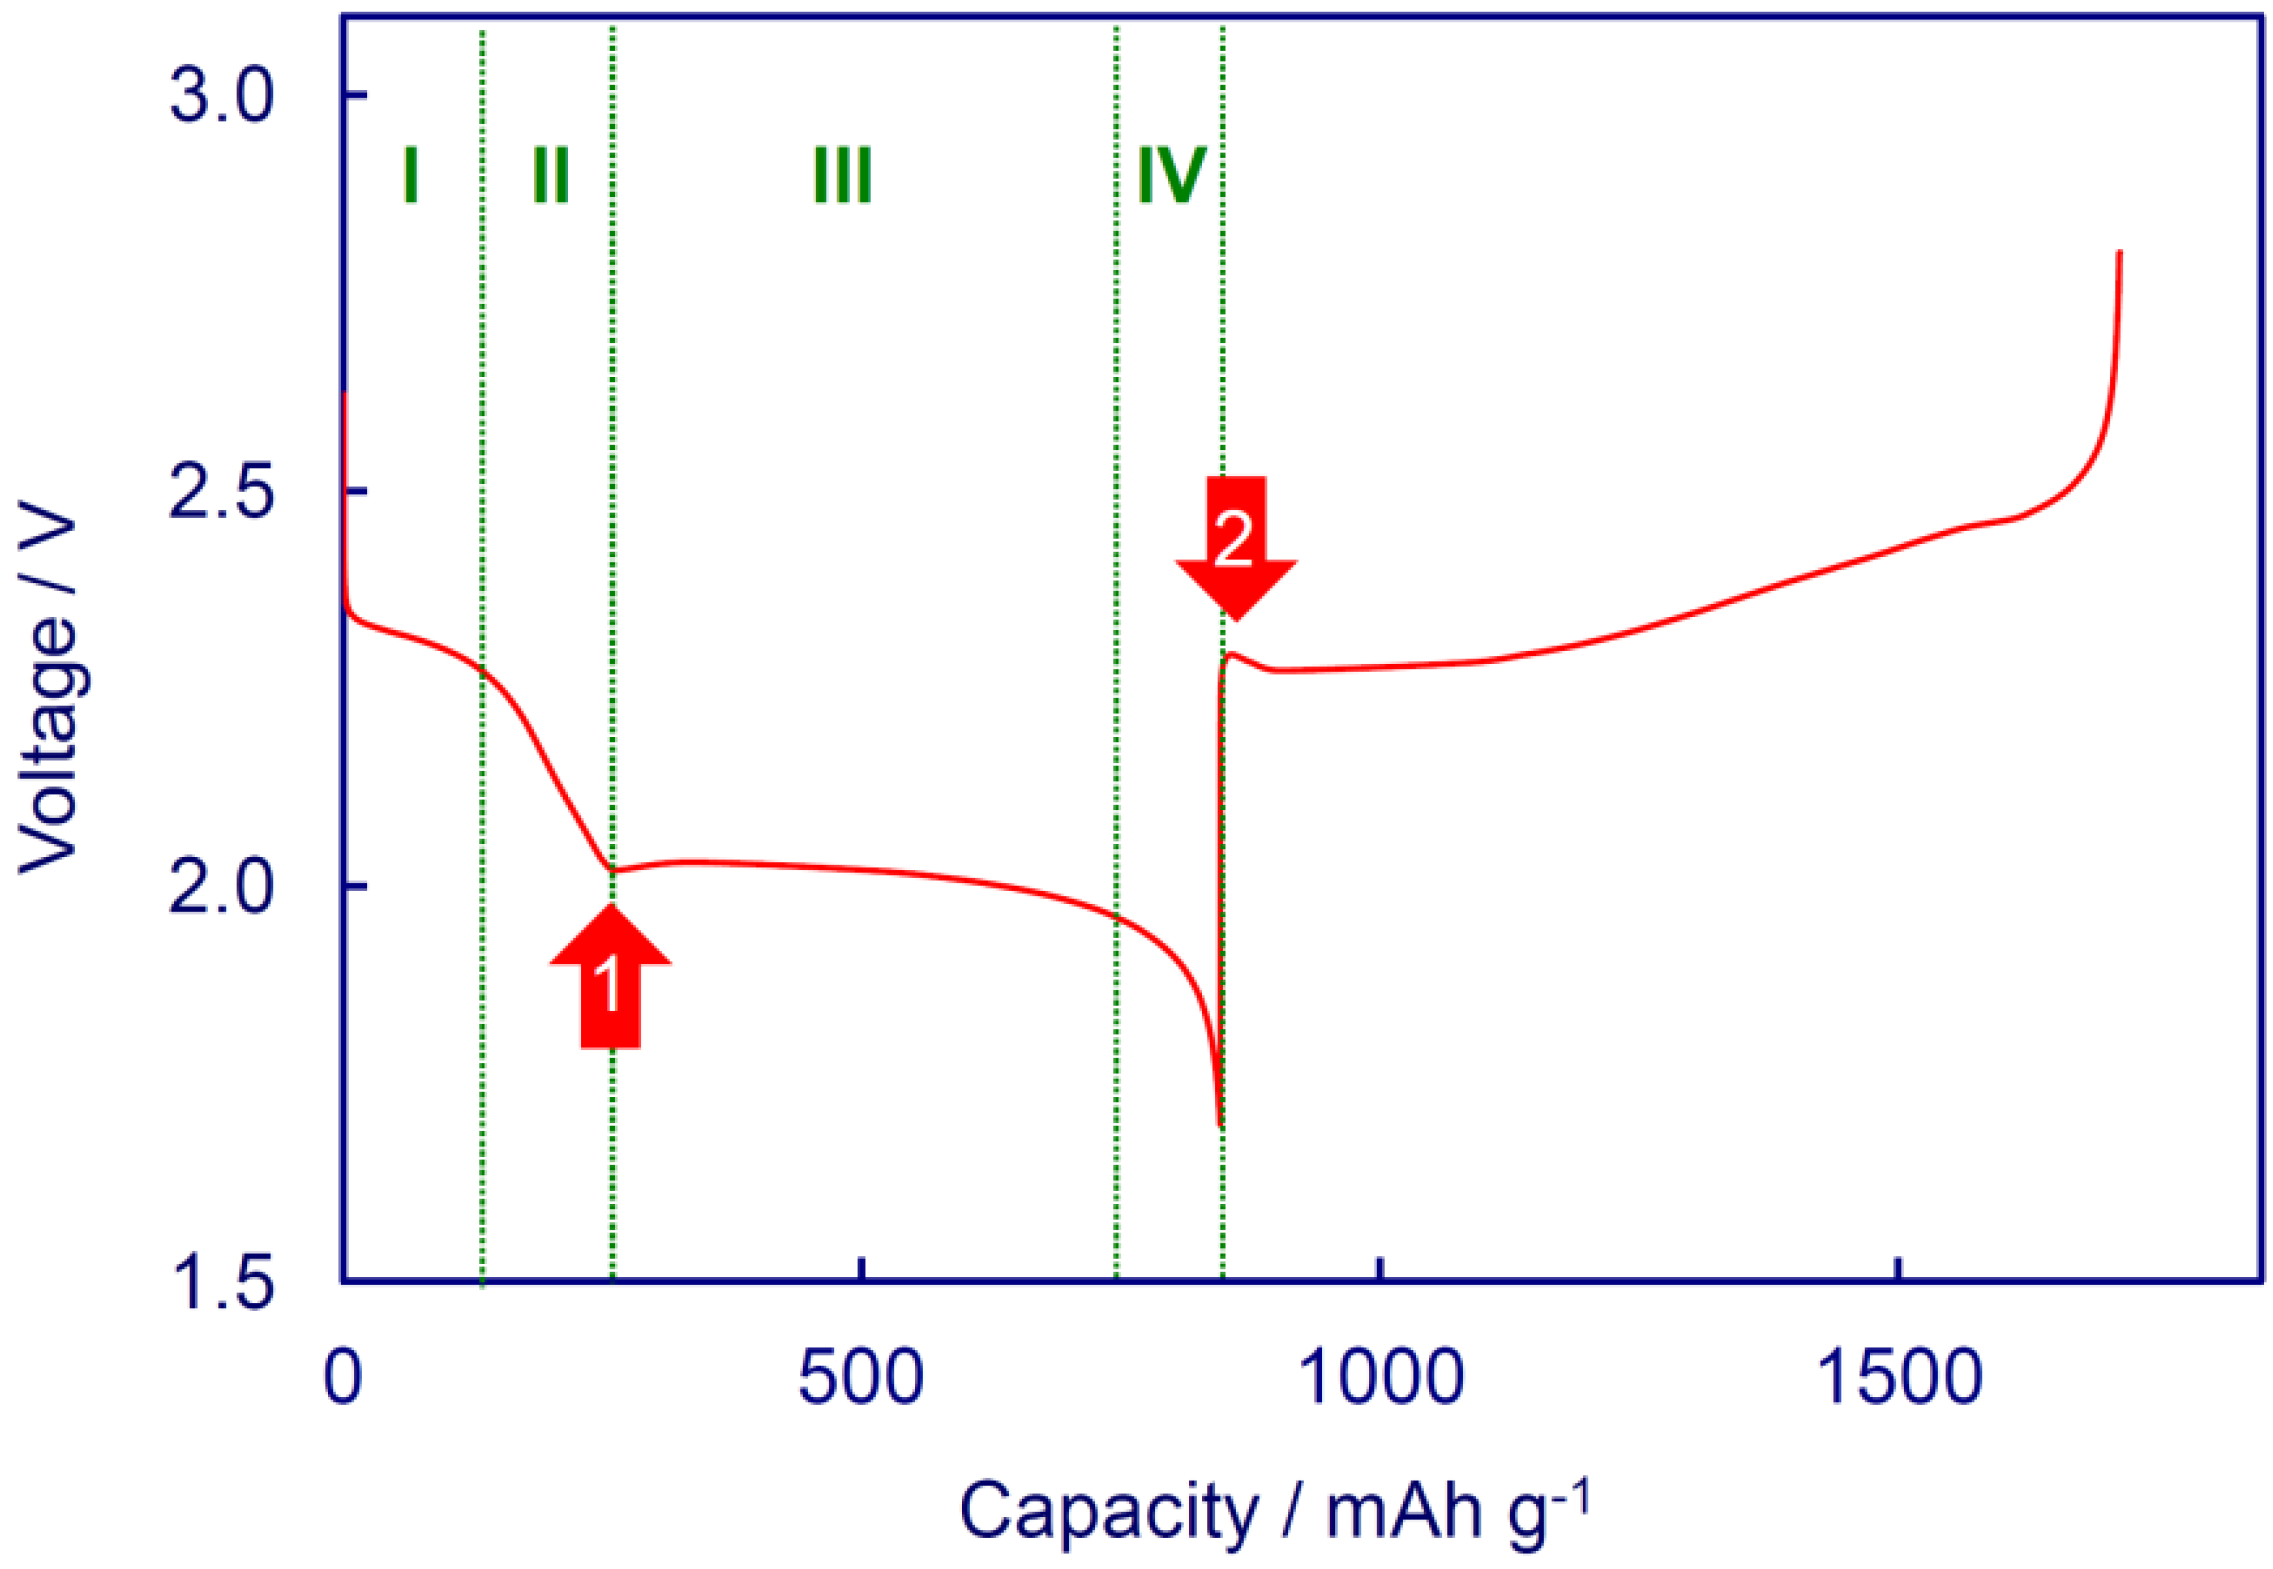
Figure 1 indicates a typical discharge and charge voltage profile of the Li/S cells with a LiNO
3-contained electrolyte, in which the redox shuttle reactions of PS are suppressed by use of LiNO
3 for protecting the Li anode [
15,
16,
17,
18,
19]. From the viewpoint of phase transitions, the discharge process of Li/S cells can be divided into four reaction regions [
3,
18]: Region I, a solid-liquid two-phase reaction, corresponds to the reduction from the solid sulfur and dissolved sulfur into highly soluble Li
2S
8, during which the formed Li
2S
8 dissolves into the electrolyte and migrates out of the cathode by chemical diffusion and electrical drag (transport); Region II, a liquid-liquid single-phase reaction, relates to a series of complicated reductions from Li
2S
8 into soluble Li
2S
4, during which the voltage declines steeply with a decrease in the length of S–S chain while the viscosity of PS solution increases gradually until reaching a maximum value in the end of the region with an increase in the number (concentration) of PS; Region III, a liquid-solid two-phase reaction, reflects a series of complicated reductions from the dissolved Li
2S
4 into insoluble Li
2S
2 and Li
2S, respectively, these reductions compete with each other and contribute to the major capacity of a Li/S cell; Region IV, a solid-solid single-phase reaction, relates to the reduction from Li
2S
2 into Li
2S, which is kinetically slow and generally suffers high polarization due to the non-conductive nature of Li
2S
2 and Li
2S. Among these four regions, Region IV is greatly affected by Region III, and it may be very short or even disappears when Li
2S is the main product in Region III. In addition, the voltages of discharge and charge show two small peaks, as indicated by two arrows in
Figure 1. Arrow 1 corresponds to a point at which the PS solution has the highest viscosity as a combined result of the S–S chain length and the number (concentration) of PS anions. Arrow 2 reflects a reduced polarization as a result of the solid-liquid phase transition from insoluble Li
2S
2 and Li
2S to the soluble PS. At discharge state, the surfaces of carbon are covered by a solid Li
2S
2/Li
2S layer so that the cell suffers high polarization. Upon charge, the solid Li
2S
2 and Li
2S are oxidized into soluble PS which enters into liquid phase, resulting in a reduction in the polarization.
Figure 1.
A typical discharge and charge voltage profile of Li/S cells.
Figure 1.
A typical discharge and charge voltage profile of Li/S cells.
Beside the electrochemical reductions discussed above, a series of PS disproportionations are present in the solution as described by Equation (1), where
y is less than
x, especially it equals to 2 and 1 for insoluble Li
2S
2 and Li
2S, respectively:
The chemical equilibrium of Equation (1) is affected by the temperature and concentration of PS solution, and we show that high temperature and high PS concentration favor Equation (1) moving backward (left side). For example, a Li
2S
9 solution can be easily prepared by reacting stoichiometric amounts of sulfur and Li
2S in an electrolyte solution at elevated temperature according to the reverse process of Equation (1) [
1,
17,
18,
19]. The effect of PS concentration on Equation (1) can be demonstrated by a storage test of the PS solution. To do this, we prepared two Li
2S
9 solutions with PS concentrations of 0.05 m and 0.5 m, respectively, using a 1:1 (wt:wt) DME/DOL mixed solvent and stored the solutions at room temperature. After a week, we observed that yellow sulfur precipitated out of the 0.05 m Li
2S
9 solution while the 0.5 m Li
2S
9 solution remained unchanged.
Due to their low solubility, sulfur and low order PS (especially Li
2S
2 and Li
2S) formed by the PS disproportionation would precipitate out of the electrolyte solution, and those depositing within the pores of separator and in the dead corners become inactive during the continued discharge (note that the disproportionation, Equation (1), can be reversed back in the next charging process as a result of the increase in PS concentration). In order to achieve high specific capacity of Li/S cells, the PS disproportionation should be minimized, which can be realized by optimizing the E/S ratio.
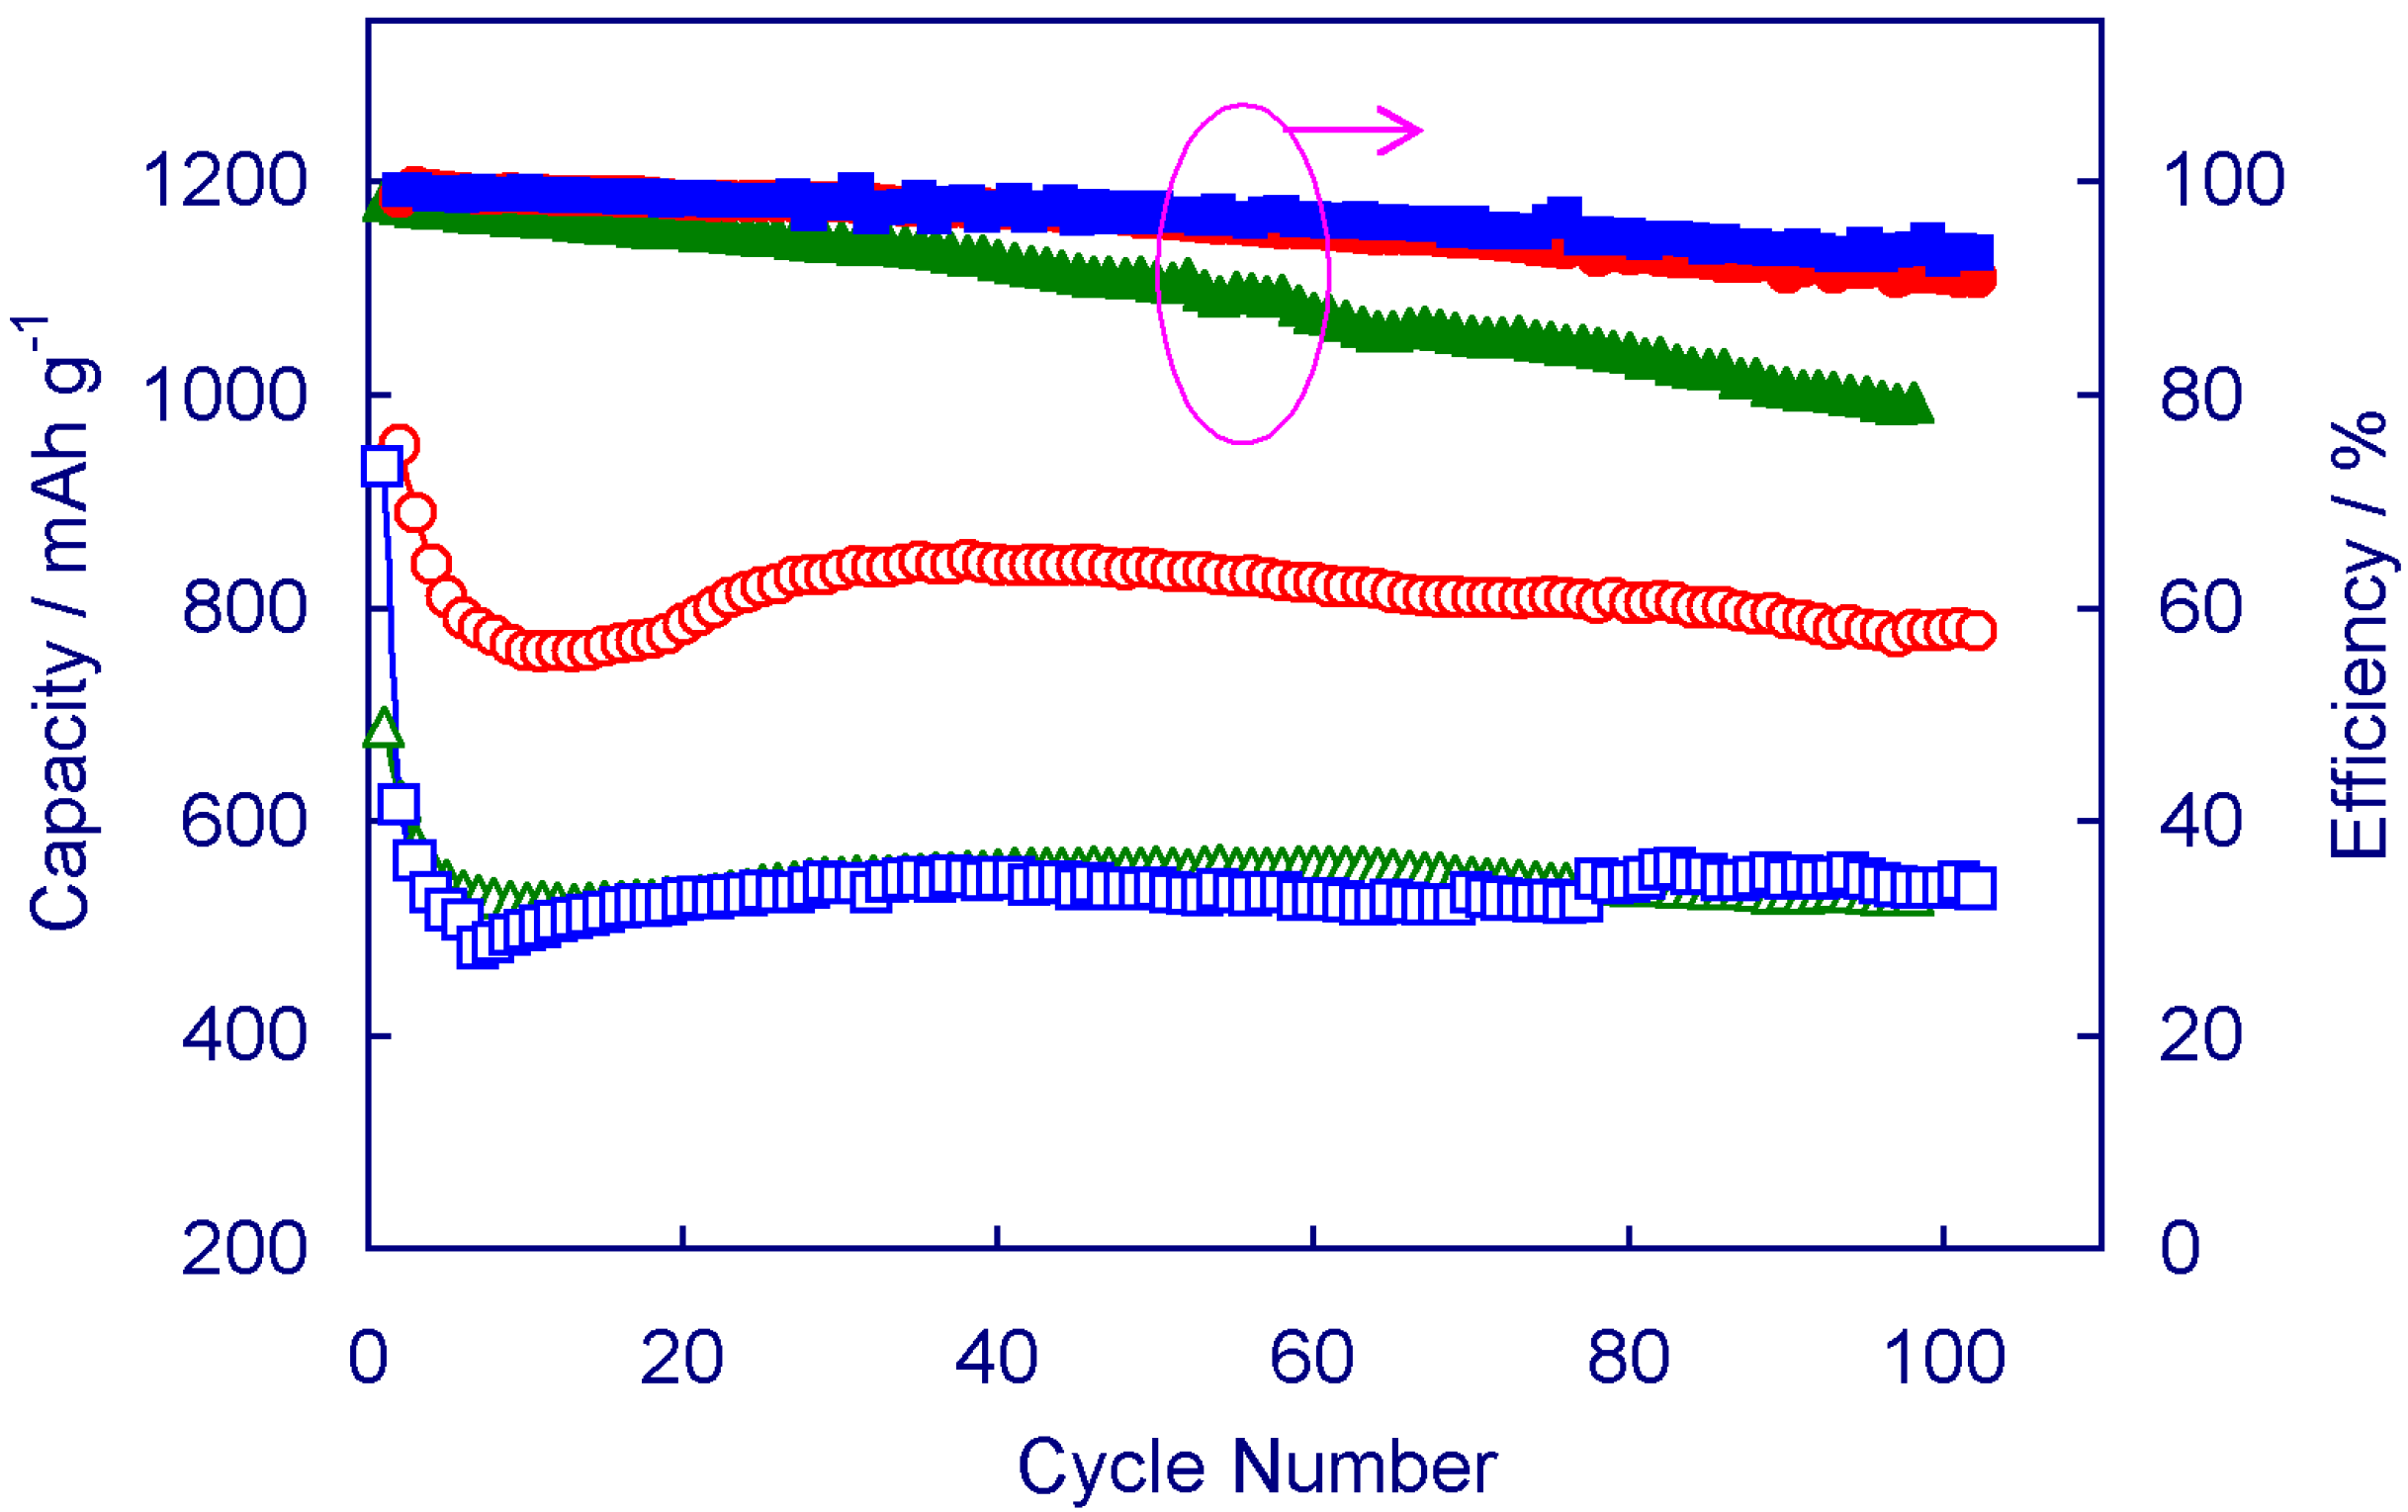
Figure 2 shows the capacity retention and cycling efficiency of Li/S cells with three representative E/S ratios.
Figure 2.
Effect of E/S ratio on the cycling performance of Li/S cells. (1) E/S = 13.3 ( and ), (2) E/S = 10 ( and ), and (3) E/S = 6.5 mL g−1 ( and ).
Figure 2.
Effect of E/S ratio on the cycling performance of Li/S cells. (1) E/S = 13.3 ( and ), (2) E/S = 10 ( and ), and (3) E/S = 6.5 mL g−1 ( and ).
Cell 1 having an E/S = 13.3 mL g
−1 (shown in circle symbols) is an example of cells with an excess amount of electrolyte. In this case, the cell shows high initial capacity, however, the capacity declines rapidly with cycle number because PS dissolves into electrolyte and diffuses into the cell’s dead corners. Furthermore, the excess electrolyte leads to low PS concentration, which moves Equation (1) forward (right side). Cell 2, having an E/S = 10 mL g
−1 (in square symbols) is an example of cells with an appropriate amount of electrolyte. In this case, the cell shows the best combination of specific capacity and capacity retention. Even after 100 cycles, the cell still retained a specific capacity of 780 mAh g
−1. Cell 3, having an E/S = 6.5 mL g
−1 (in triangle symbols) is an example of cells with insufficient amount of electrolyte. In this case, the cell is still able to retain high specific capacity, however, the results have poor reproducibility and cycle life is short due to the enhanced redox shuttle reactions by the concentrated PS solution. In most cases, the cells with low E/S ratio show a gradual increase in the specific capacity during the initial cycles. This is because the low E/S ratio results in a highly concentrated PS solution, whose high viscosity resists PS species diffusing out of the cathode so that the remaining sulfur cannot be effectively utilized. On the other hand, the E/S ratio affects the cell’s cycling efficiency. A general trendy is that the cycling efficiency declines slowly with cycle number, which is attributed to the gradual consumption of LiNO
3 in Li/S cells [
18,
19].
Figure 2 also shows that Cell 1 with higher E/S ratio has relatively lower cycling efficiency. This result is in consistence with the fact that low PS concentration drives Equation (1) forward (right side), leading to lower discharge capacity.
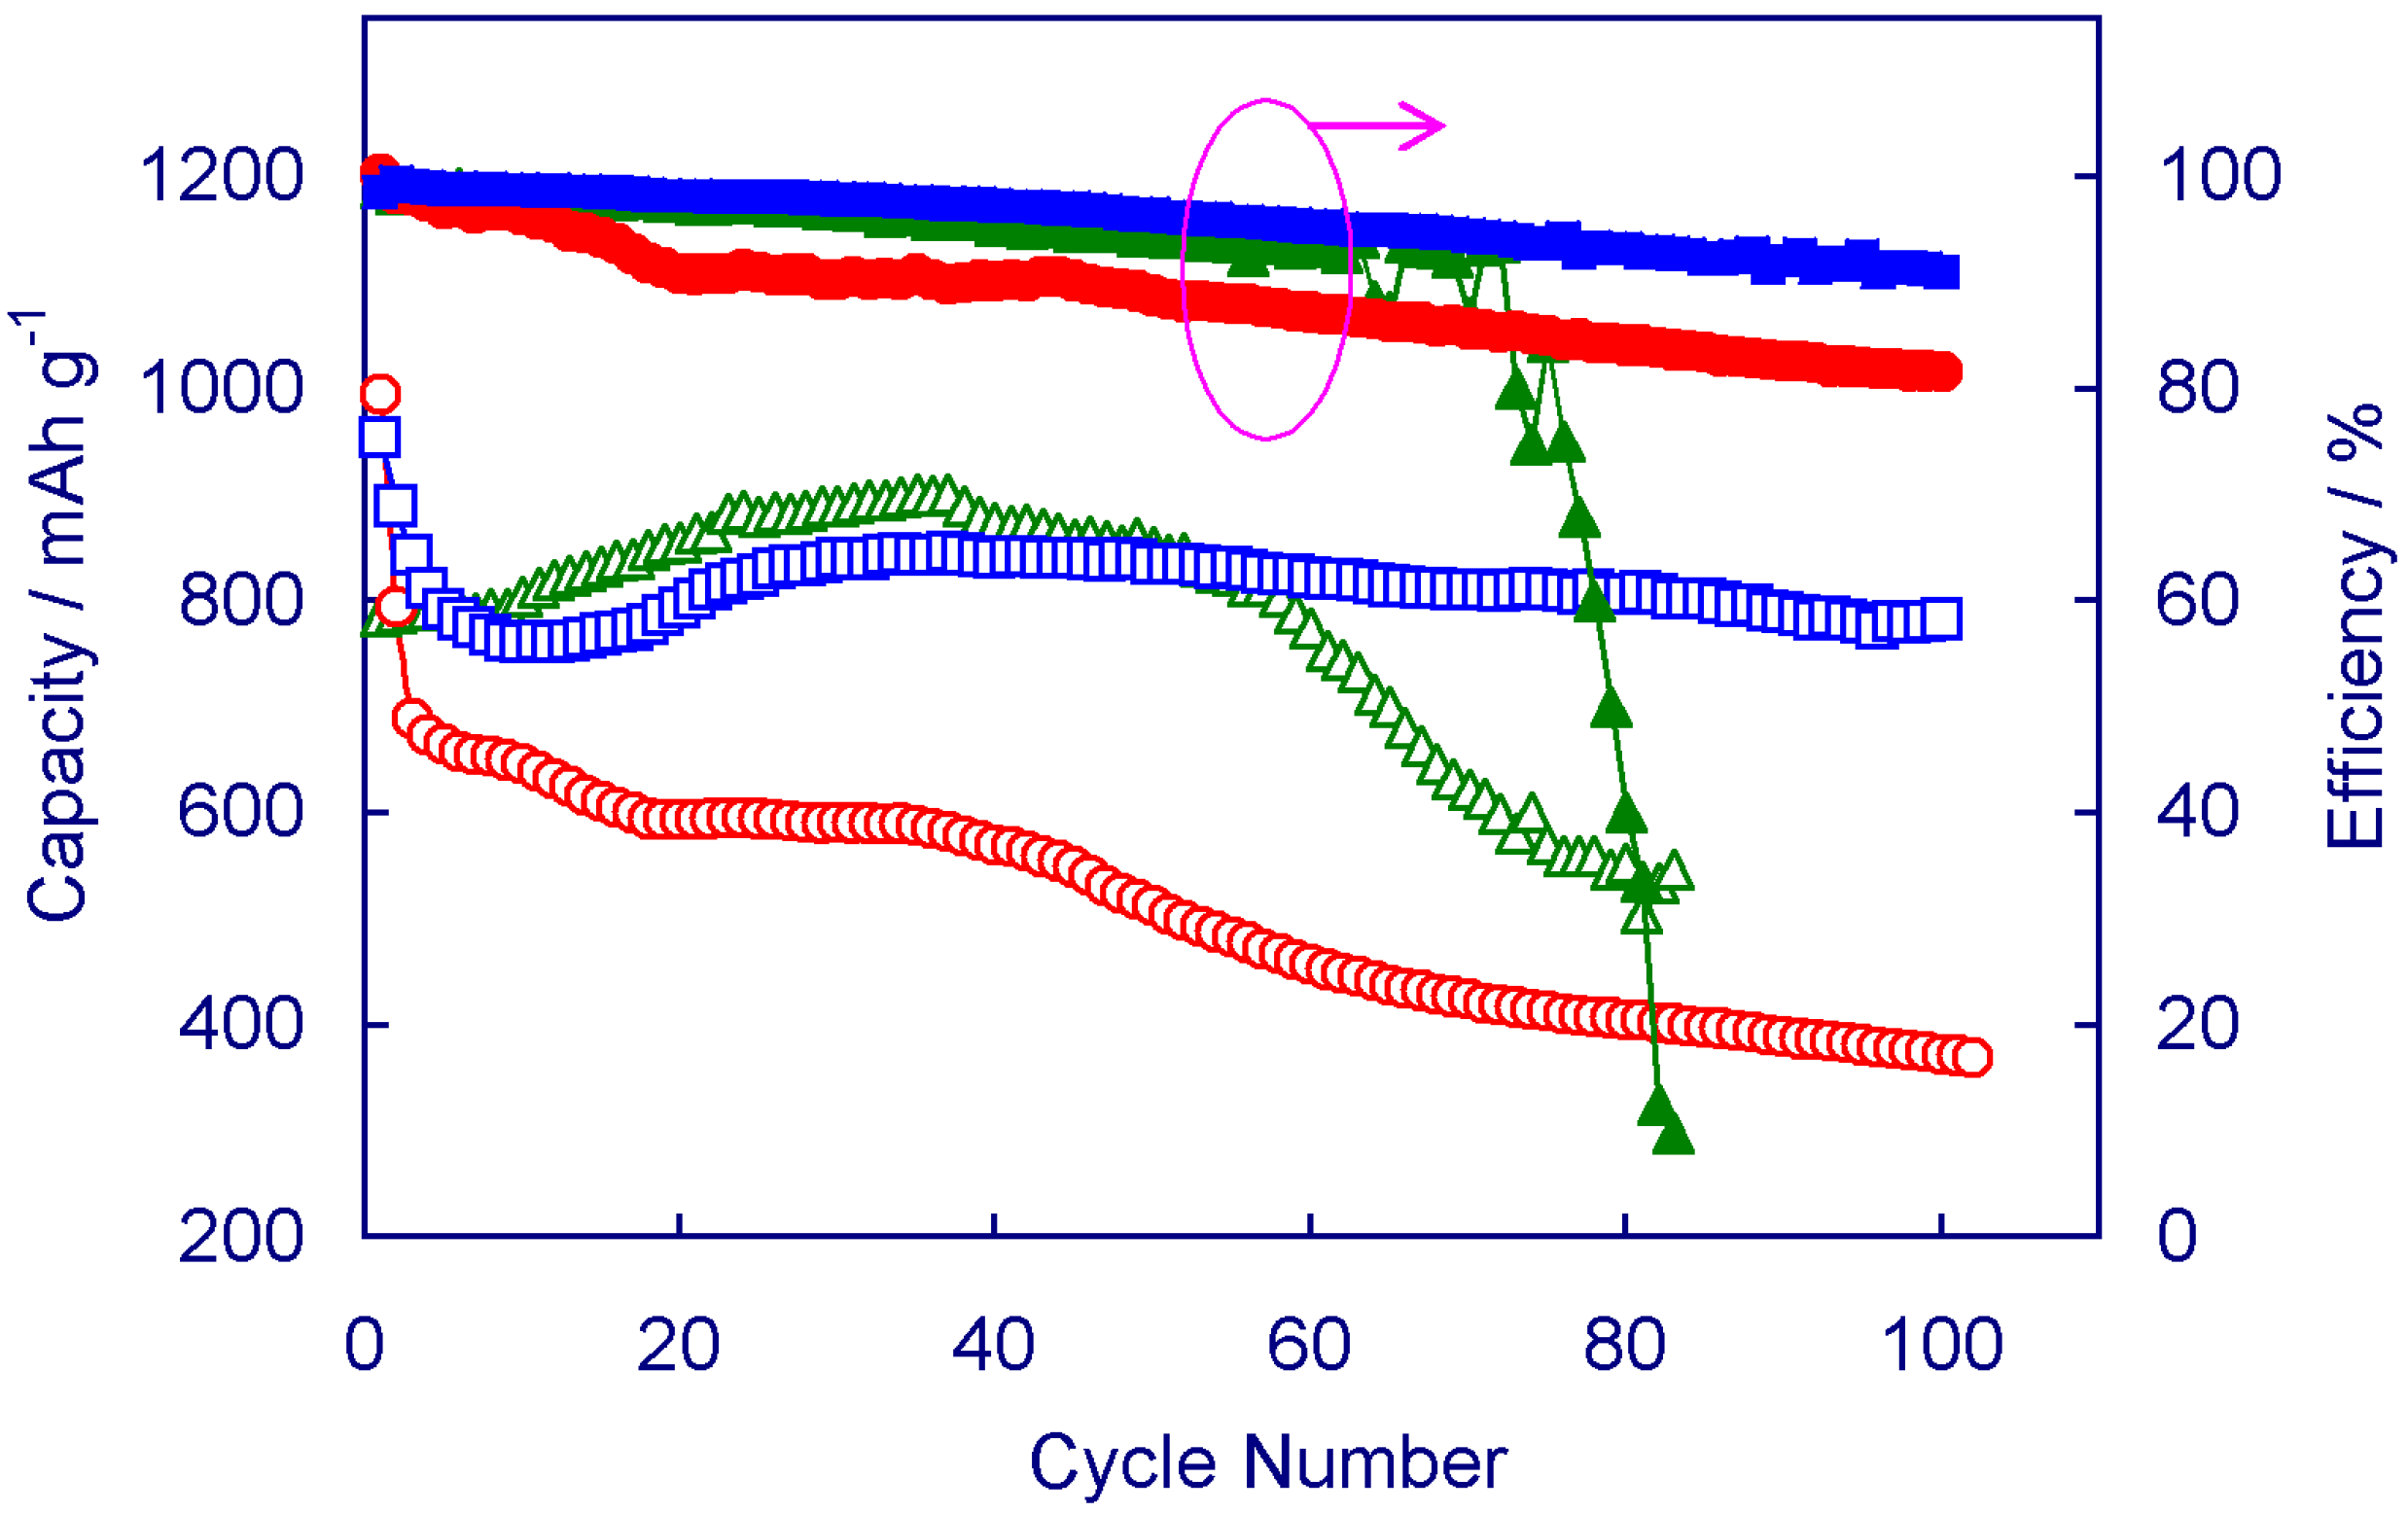
Figure 3 shows the effect of sulfur loading on the specific capacity and cycling efficiency for three Li/S cells with similar E/S ratio (~10 mL g
−1). It is shown that Cell 1 with sulfur loading of 2.0 mg cm
−2 has significantly higher specific capacity than the other two cells with sulfur loading of 2.9 and 3.3 mg cm
−2, respectively. We also see that below 2.0 mg cm
−2, a small decrease in the sulfur loading can result in significant improvement in both of the specific capacity and capacity retention. Cell-3 with sulfur loading of 3.3 mg cm
−2 suffers the fastest fading rate of cycling efficiency. Since the sulfur loading is proportional to the thickness of electrode, the observations above can be easily understood from the viewpoints of electrode thickness and PS diffusion. When the electrode is thick, the PS anions formed are unable to effectively diffuse out of the cathode. As a result, the PS anions are stayed on the surfaces of carbon and reduced into shorter and less soluble PS that deposit on the surfaces of carbon and isolate the remaining sulfur from the contact with carbon.
Figure 3.
Effect of sulfur loading on the cycling performance of Li/S cells with an E/S ratio of ~10 mL g−1. (1) S=2.0 mg cm−2 ( and ), (2) S=2.9 mg cm−2 ( and ), and (3) S=3.3 mg cm−2 ( and ).
Figure 3.
Effect of sulfur loading on the cycling performance of Li/S cells with an E/S ratio of ~10 mL g−1. (1) S=2.0 mg cm−2 ( and ), (2) S=2.9 mg cm−2 ( and ), and (3) S=3.3 mg cm−2 ( and ).
The value of the optimized E/S ratio is affected by many factors, including the type of the solvents, the composition and thickness of sulfur cathode, the specific surface area and porosity of carbon, as well as the configuration of Li/S cells. For each Li/S cell’s configuration, the voltage profile of the first discharge can be used as the empirical method to determine the optimized E/S ratio.
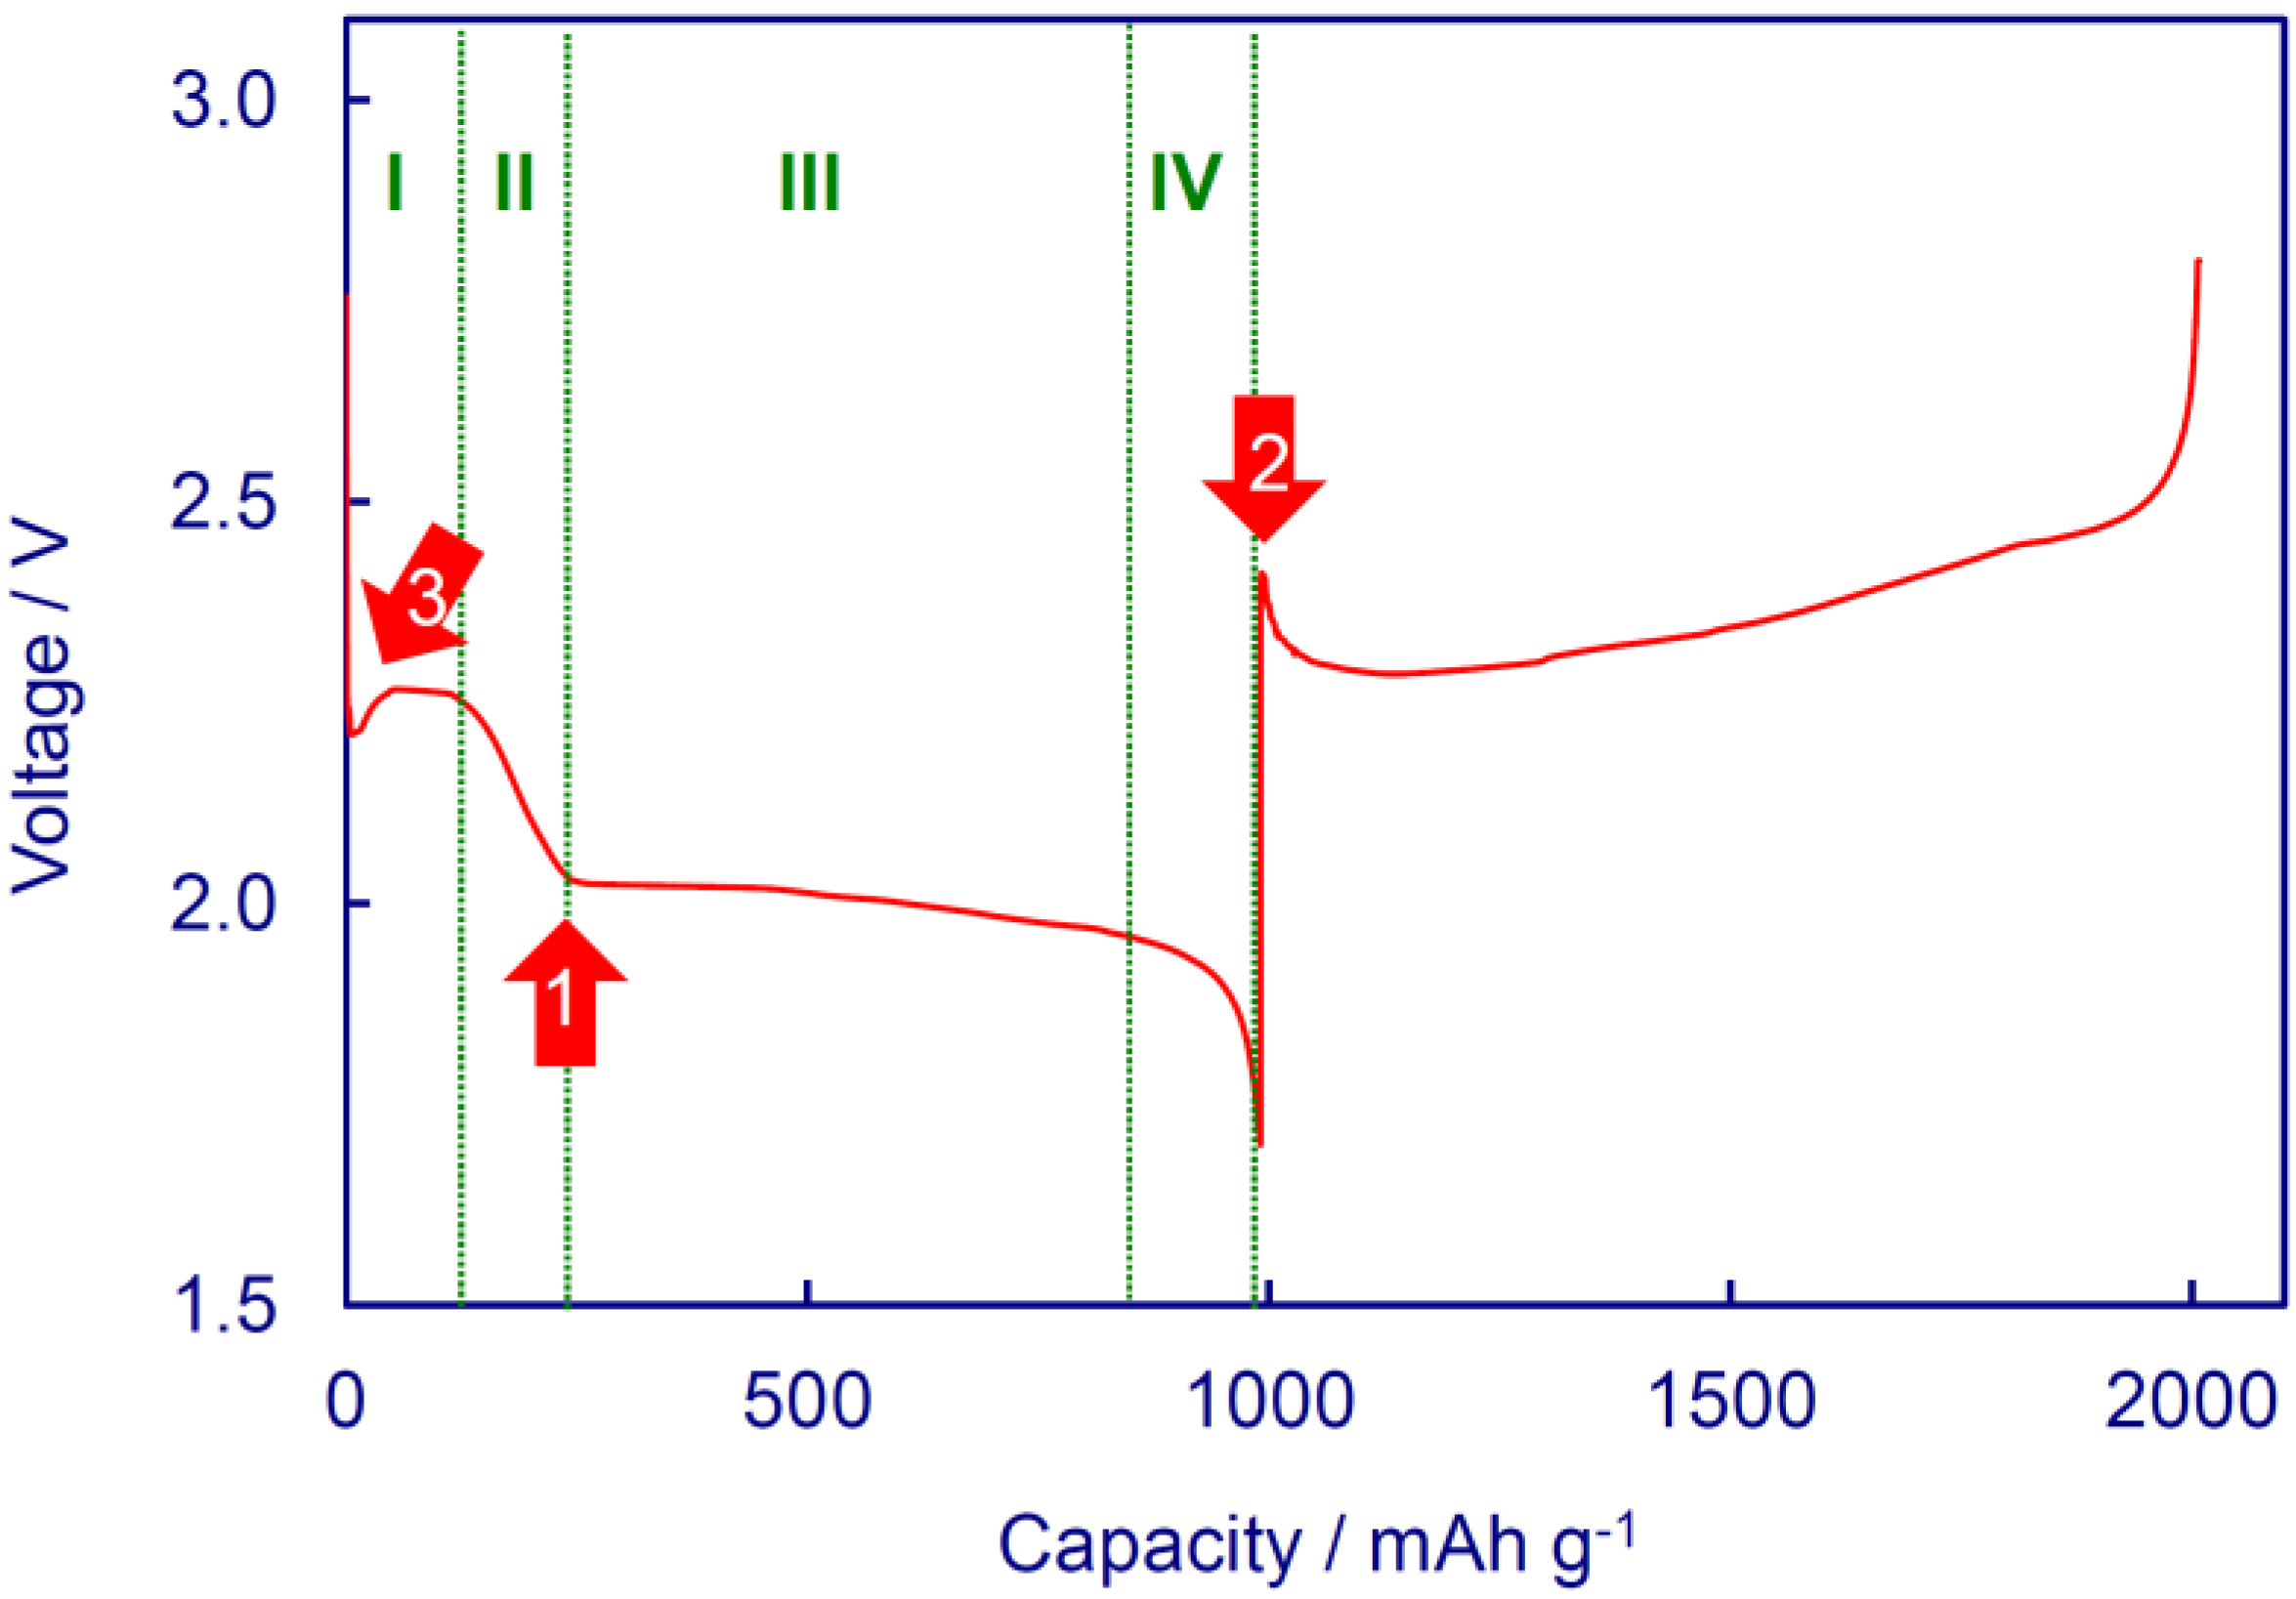
Figure 4 shows the voltages of the first discharge and charge for a Li/S cell with an E/S ratio of 10 mL g
−1. It is shown that beside two voltage peaks as observed in
Figure 1, a voltage delay appears in the beginning of the first discharge, as indicated by Arrow 3. This voltage delay, which can be observed from all Li/S cells with insufficient amount of electrolyte, is a signal for the resistive diffusion of the dissolved Li
2S
8 out of the cathode. Therefore, the voltage delay in the first discharge of Li/S cells can be used to determine the optimized E/S ratio, which empirically is the minimum value without appearance of the voltage delay.
Figure 4.
Discharge and charge voltages of the first cycle for a Li/S cell with an E/S ratio of ~10 mL g−1.
Figure 4.
Discharge and charge voltages of the first cycle for a Li/S cell with an E/S ratio of ~10 mL g−1.
3. Experimental Section
All chemicals were purchased from Sigma-Aldrich (St. Louis, MO, USA) unless noted otherwise. Prior to use, solvents DME and DOL were dried over 4 Å molecular sieves for a week, salts LiSO3CF3 and LiNO3 were dried at 110 °C under vacuum for 10 h. A sulfur cathode consisting by weight of 77% sulfur, 10% Super-P carbon, 10% Ketjenblack EC-300JD carbon black and 3% binder was coated onto a carbon-coated aluminum foil by using poly(acrylonitrile-methyl methacrylate) (ANMMA, AN/MMA = 94:6, MW = 100,000, Polysciences, Inc., Warrington, PA, USA) as the binder and N-methyl pyrrolidinone (NMP) as the solvent. After evaporating the solvent in air, the resulting cathode was punched into 1.27 cm−2 circular disks and dried at 60 °C under vacuum for 16 h. Sulfur loading of the cathode was calculated based on the weigh and sulfur content of the cathode coating. In an argon-filled glove-box, a solution with the composition of 0.25 m LiSO3CF3-0.25 m LiNO3 dissolved in a 1:1 (wt:wt) DME/DOL mixture was prepared and used as the liquid electrolyte. In a dry-room having a dew point below −90 °C, Li/S coin cells were assembled using the sulfur cathode and electrolyte prepared above and a Celgard 3500 membrane as the separator. Accurate amount of liquid electrolyte was added using a pipettor with care to make sure all cell components were well wetted. In order to avoid electrolyte spilling into dead corners, the liquid electrolyte was carefully applied onto the sulfur cathode, followed by stacking the separator and Li anode on it.
After resting for 2 h, the Li/S cells were galvanostatically cycled on a Maccor Series 4000 cycler at 0.5 mA cm−2 between 1.7 V and 2.8 V. For discussion, the cell’s specific capacity (mAh g−1) was referred to the weight of sulfur, the cell’s cycling efficiency was taken as the percentage (%) of discharge capacity to the following charging capacity, and the E/S ratio (mL g−1) was defined as the ratio of electrolyte volume to sulfur weight.


 Li2Sy + (x − y)/8 S8