Article

Simulation of Synthesis Gas Production from Steam Oxygen Gasification of Colombian Coal Using Aspen Plus®

1
Chemical Engineering Department, University of Los Andes, Bogotá 11001000, Colombia
2
Energy Conversion Research Group, Department of Mechanical Engineering, University of Los Andes, Bogotá 11001000, Colombia
*
Author to whom correspondence should be addressed.
Energies 2012, 5(12), 4924-4940; https://doi.org/10.3390/en5124924
Submission received: 18 September 2012 / Revised: 6 November 2012 / Accepted: 12 November 2012 / Published: 23 November 2012

Abstract

:
A steady state simulation of syngas production from a Steam Oxygen Gasification process using commercial technologies was performed using Aspen Plus®. For the simulation, the average proximate and ultimate compositions of bituminous coal obtained from the Colombian Andean region were employed. The simulation was applied to conduct sensitivity analyses in the O2 to coal mass ratio, coal slurry concentration, WGS operating temperature and WGS steam to dry gas molar ratio (SDG) over the key parameters: syngas molar composition, overall CO conversion in the WGS reactors, H2 rich-syngas lower heating value (LHV) and thermal efficiency. The achieved information allows the selection of critical operating conditions leading to improve system efficiency and environmental performance. The results indicate that the oxygen to carbon ratio is a key variable as it affects significantly both the LHV and thermal efficiency. Nevertheless, the process becomes almost insensitive to SDG values higher than 2. Finally, a thermal efficiency of 62.6% can be reached. This result corresponds to a slurry solid concentration of 0.65, a WGS process SDG of 0.59, and a LTS reactor operating temperature of 473 K. With these fixed variables, a syngas with H2 molar composition of 92.2% and LHV of 12 MJ Nm−3 was attained.

1. Introduction

Currently, in a world of high and growing energy demands and increasing oil prices, alternative and sustainable raw material resources are being sought. Ideally, these sources would be used for either energy generation or as valuable chemical feedstocks for variety of chemical processes and synthesis. Among different alternatives, syngas has shown to be a favorable option. Syngas is considered a clean fuel with environmental advantages compared to other fossil fuels because the sulfur oxides (SOx), nitrous oxides (NOx) and CO2 emissions are considerably lower [1,2].
Syngas is an important building block in the chemical, oil and energy industries due to its applications: (1) as a feedstock for the production of several chemicals such as hydrogen, ammonia, methanol, and Fischer-Tropsch products [3]; (2) as a fuel in a gas turbine to produce electricity [4]; (3) as a cell fuel for mobile sources [5]; (4) as an electricity supplier through solid oxide fuel cells [3]; (5) as a primary fuel. Syngas, which is mainly a mixture of hydrogen (H2) and carbon monoxide (CO), is mainly used as a chemical substance rather than a fuel, representing 50 billion US$ market for 40 Tg (40 Mt) annual production nowadays [6]. Hydrogen could help to satisfy the world energy demand as recent reports show that global energy consumption grew 5.6% in 2010, the largest yearly increase since 1973 [7].
There are many alternatives for hydrogen production from liquid and gaseous hydrocarbons such as thermo-catalytic cracking, steam reforming and plasma arc decomposition [6]. Furthermore, from solid feedstocks, H2 can be produced through the gasification of coal, biomass, petroleum coke, or solid waste. Nearly 50% of the global hydrogen is generated through natural gas reforming, 30% from oil/naphtha reforming, 18% from gasification, 3.9% from water electrolysis and 0.1% from other sources [6]. Coal gasification is a promising way to obtain H2 because the production techniques have achieved maturity and are commercially available. Moreover, the relatively high global resources of coal and its widespread availability worldwide make this resource a promising option [8]. In addition, this process has environmental advantages: (1) SOx can be processed into a marketable by-product; (2) ash can be liquefied into a slag that avoids toxicity issues; (3) CO2 can be held and recovered in the loops of gasifiers for remediation/reuse; (4) gasifiers can be modified such that wide product flexibility is easily obtained [9].
The steam-oxygen gasification (SOG) process is the only commercialized method of gasification used to manufacture several chemicals from coal. The Wabash River Coal Gasification Repowering Plant, near to West Terre Haute, Indiana (USA), has proven since November of 1995 the successful application of H2 production by coal gasification. This plant uses H2, from SOG process, in a gas combustion turbine generator to produce electricity. It generates around 292 MW of electric power. With this production, this plant is one of the largest single-train gasification combined cycle plants operating commercially in the world [10].
Two thirds of the total fuel fossil reserves in the world are coal and will last for more than 150 years [7]. Coal is in fact one of the main resources in Colombia. It is estimated that 0.7% of the world proved coal reserves, which corresponds to 6.7 Pg (6700 Mt), are in Colombian territory [11]. Colombia has several coal formations over its territory. The main ones are: Cerrejón, Los Cuervos, Guaduas, Umir, Cerrito and Amagá. The Guaduas formation’s coal, located in the center of Colombia, is characterized by a bituminous coal with high volatiles, low sulfur and ash content (Table 1). which is advantageous for a gasification use [12]. Therefore, coal from Guaduas formation was selected for this study.
Table 1. Ultimate and proximal analysis of Guaduas Formation’s coal (HHV = 30,634 kJ kg−1).
Parameterw/w (%)
Proximate analysis
Moisture4.12
Ash5.61
Fixed carbon67.84
Volatiles22.43
Ultimate analysis *
Carbon75.69
Hydrogen5.29
Nitrogen1.58
Chloride2.35
Sulfur1.57
Ash5.61
Oxygen7.91
Notes: * dry basis.
Aspen Plus® has been widely employed to simulate chemical processes in a wide number of fields including but not limiting to the petroleum industry, chemical processes and biomass gasification. It also can be used to model steady state processes handling solid carbons materials in multiple unit operations. Therefore, many coal and biomass conversion processes have been simulated using Aspen Plus as integrated coal gasification combined cycle (IGCC) power plant [13], biomass gasification [14], hybrid biomass gasification [15], hydrogen production from biomass gasification [16] and coal combustion [17]. Additionally, proximate and ultimate analysis properties of solid coal are specified to provide a fairly rigorous simulation of the gasifier performance [18].
The purpose of this study is to simulate and analyze through Aspen Plus® the coal gasification process and subsequent processing for the hydrogen-rich syngas production, using the most commercialized and referenced available technologies. A sensitive analysis of the variables with high impact over the key process parameters is performed to identify important process efficiency improvements (yield and energy) and environmental performance.

Gasification Technologies

There are three main types of coal gasification technologies: fixed-bed, fluidized-bed and entrained-flow gasification. Table 2 summarizes key parameters for these gasification technologies. Among these processes, entrained-flow gasification is the commercially preferred technology due to its versatility and lower environmental impact [4,12,13,19].
Table 2. Main features of industrial gasifiers.
Gasifier typeMain features
Entrained-flowParticle size below 0.1 mm
High operating temperature (>1473 K)
High operating pressure (3 to 12 MPa)
High oxidant demand
Short residence time (0.5 to 10 s)
Ash is removed as molten slag
Fluidized-bedParticle size between 6 and 10 mm
Uniform temperature distribution
High operating temperature (1073 to 1323 K)
Lower carbon conversion
Ash is removed as slag or dry
Fixed-bedCoarse particles (6 to 50 mm)
Low operating temperature (698 to 1088 K)
Low oxidant demand
Residence time above 600 s
Ash is removed as slag or dry
Many commercial technologies in entrained-flow gasification reactors are available nowadays such as the GE/Texaco, Shell and ConocoPhillips ones. GE/Texaco and Shell entrained-flow gasification reactors are used in about 75% of the gasification plants throughout the world [12]. In this study, the GE/Texaco gasifier has been selected because: (1) it is profusely discussed in the literature; (2) high coal conversion is reported; (3) the resulting syngas is free of tars, phenols and paraffins. Additionally, the GE/Texaco gasifier is leader worldwide with 145 reactors in commercial operation and 85 in planning, engineering, or under contract agreements in 15 different countries [20].

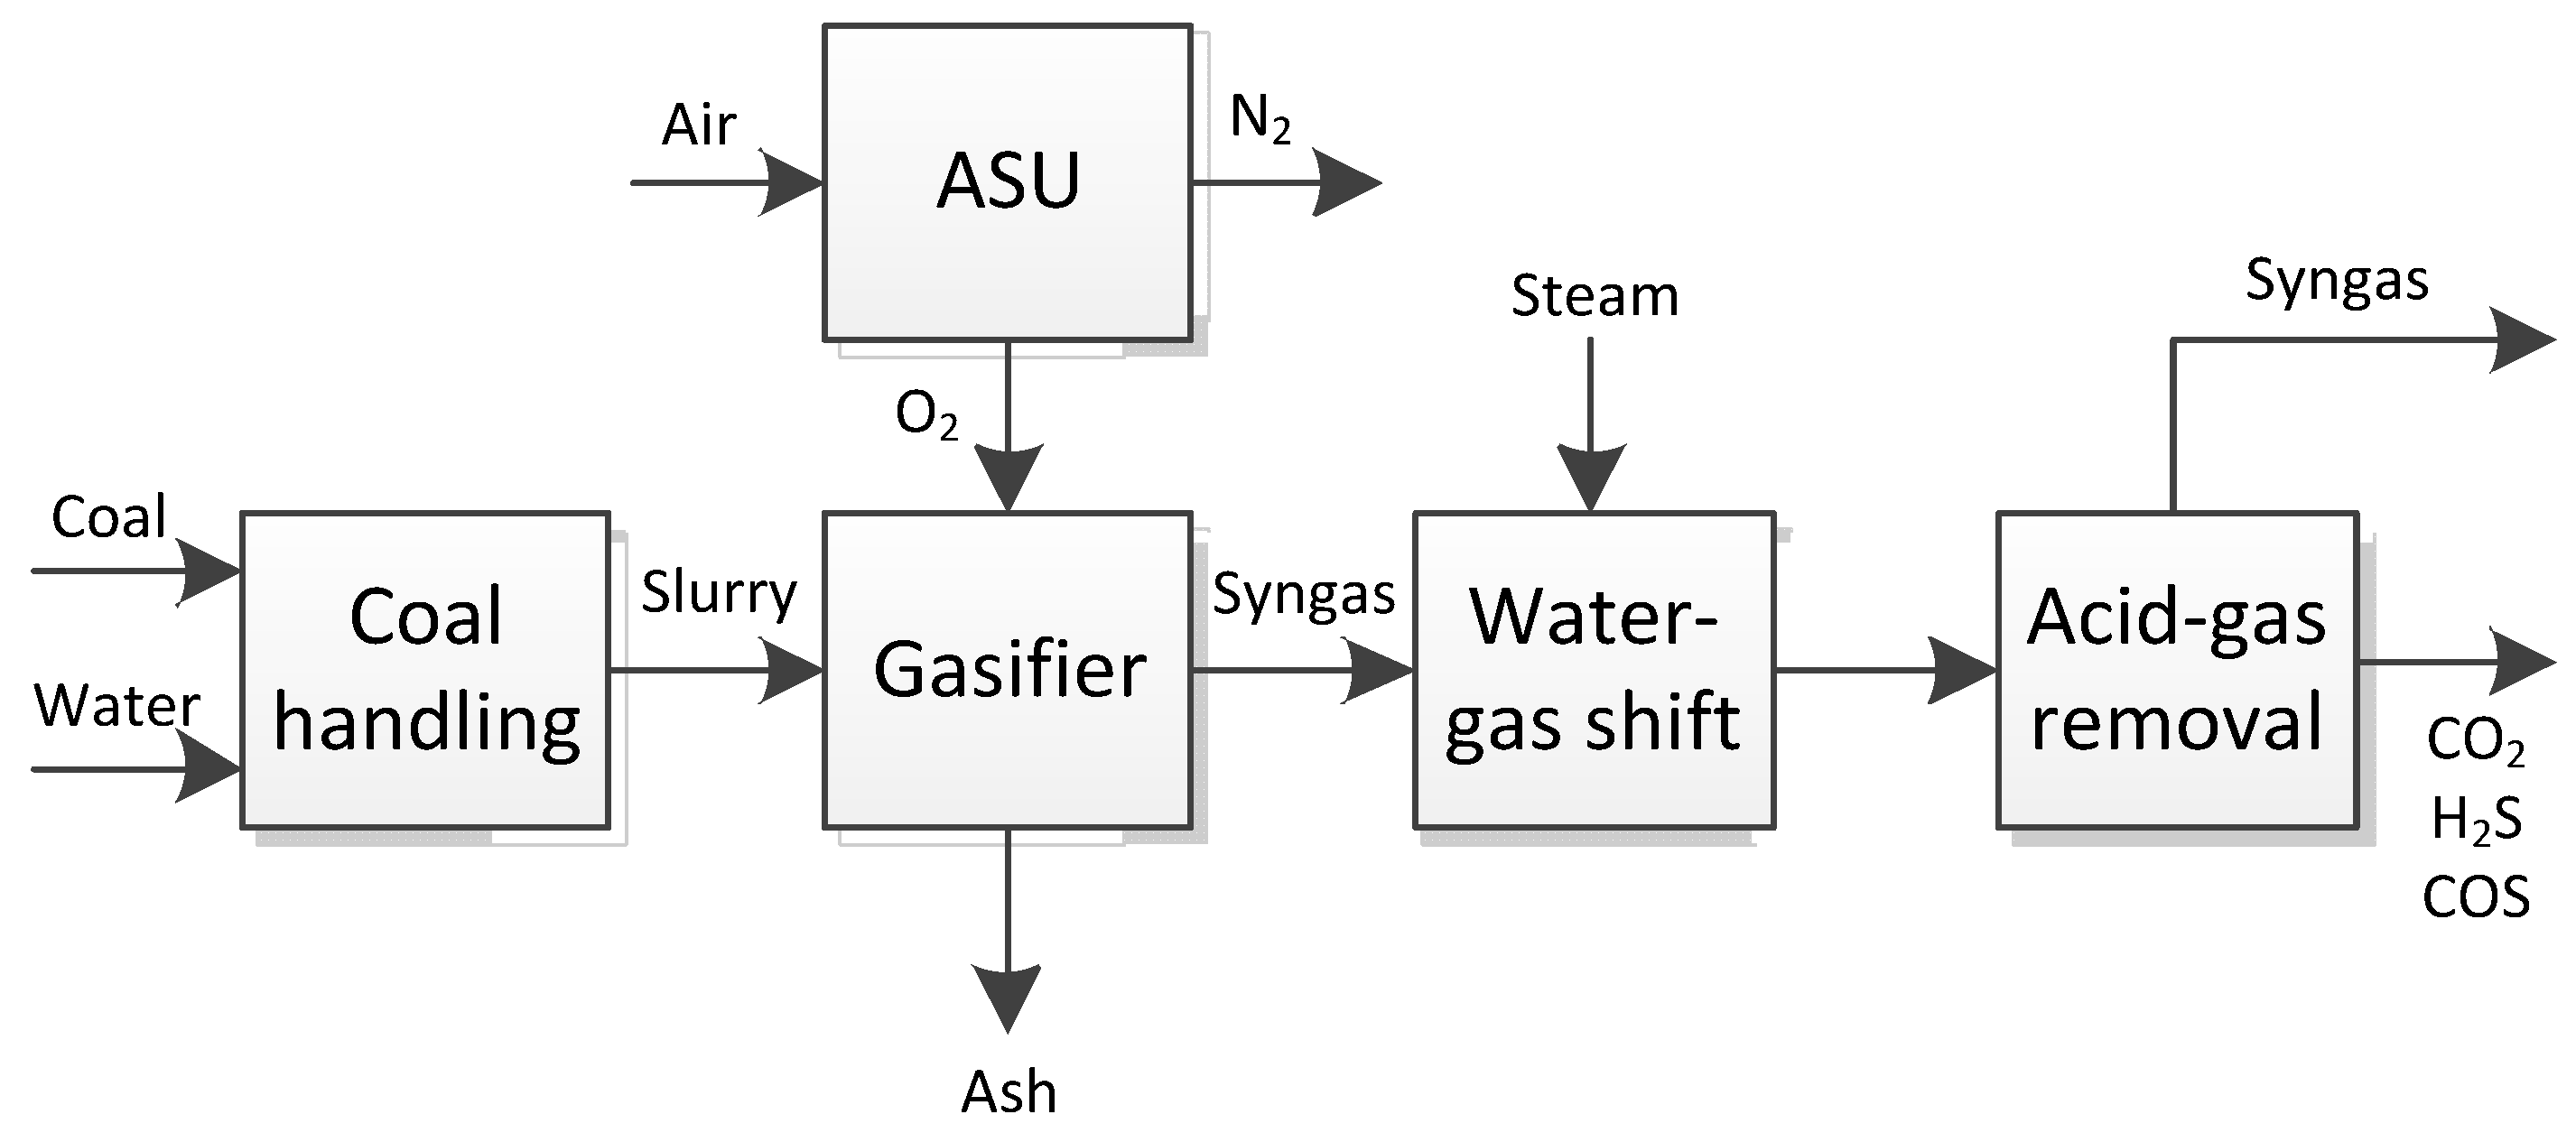
2. Process Description

In the SOG process, coal-water slurry is gasified with O2 from the air separation unit (ASU) to produce a gas mainly composed of CO and H2. It is necessary to increase the H2 concentration by a sour water-gas shift (WGS) process followed by an acid gas removal. H2-rich syngas is obtained after water condensation in the resulting gas. The SOG simplified process flow diagram is shown in Scheme 1.
Scheme 1. Simplified SOG process flow diagram.
Energies 05 04924 g005
There are many technologies for separating air into its main components. The application of either one depends on the process requirements. For lower volumes of O2 and/or N2 (<1600 g s−1), pressure swing adsorption or membrane processes are preferred [21]; whereas, for producing large quantities of gaseous products, cryogenic air separation technology is currently the most efficient, especially when high purity products are required [22].The cryogenic process consists on several unit operations that compress, purify and separate air into its principal components. First, impurities (H2O, CO2, among others) are removed in a pre-purification unit, located downstream of the air compression. Secondly, the air is cooled down to cryogenic temperatures (from 123 K to 463 K, depending on the operating pressure [23]) and goes into the air separation unit. Then, a multi-column cryogenic distillation is usually used for separating O2 and N2 [21]. Several configurations of rectifying columns and heat exchangers are made according to the requirements of the process.
A double column system is widely used in air separation processes. Air enters into the high pressure column (HPC) and provides two reflux streams that feed the low pressure column (LPC) [24]. At the top of the LPC, a pure gaseous nitrogen stream is obtained while liquid oxygen is evaporated at the bottom of this column to deliver a pure oxygen stream. The two columns are built in a single tower for the commercial application, considering the use of a condenser-reboiler as a heat exchange unit [23].
The gasification process is developed using a GE gasifier with a gas-water quench system. Guaduas formation coal is wet-milled to a particle size about 100 µm and mixed with water to produce slurry. Coal slurry and O2 stream from the ASU unit are fed in the top of the pressurized reactor through burners. The coal reacts exothermally with O2 at high temperature (>1473 K) and high pressure (>7 MPa) to produce syngas and slag [25]. The hot gas is contacted directly with water where the slag is solidified. The quenching process cools the syngas and generates a water-saturated gas product, leaving the quench chamber at a temperature between 473 K and 573 K. The resulting syngas is mainly free of particulate matter and water-soluble contaminants such as NH3, HCN and chlorides [19].
To increase the H2 concentration, the WGS process is employed to convert mostly CO into H2. This process consists of two reactors in series with intercooling. A high temperature (HTS) reactor (573–873 K) as an initial stage followed by a low temperature (LTS) reactor (453–523 K). The HTS reactor feed is heated by the effluent of the LTS to control the operating temperature. Additionally, the effluent of the HTS is cooled producing high pressure steam and then it is fed in the second reactor. In this unit, syngas and steam are mixed with a steam to dry gas ratio (SDG) depending on the feed syngas water content and the required H2 to CO ratio.
In the WGS reaction, chemical equilibrium favors products at low temperature; therefore, a catalyst is required to enhance the reaction rate. A catalyst typically made of sulfided Co/Mo on aluminum support reacts with the sulfurs, producing metal sulfides which activates the catalyst [26,27]. Carbonyl sulfide (COS) is converted to H2S making the sulfur removal easier due to the WGS process location before the acid-gas removal process.
For conditioning of the gas leaving the LTS, the Rectisol process is used. It employs methanol (CH3OH) as solvent to clean up the syngas. The high selectivity of methanol for H2S over CO2 at low temperatures (211 K to 233 K) and the ability to remove COS are the main advantages of the process. Besides, it allows a deep sulfur removal (<0.1 ppmv H2S + COS) [28].
There are many possible process configurations for Rectisol, depending on the process requirements. A selective H2S removal configuration was used in the simulation. In this configuration, the raw syngas feeds up the main absorber in which CH3OH absorbs most of the impurities produced in gasification process such as CO2, H2S, COS, HCN and NH3 [29]. Thereafter, the solvent passes through a regeneration process, where these components are desorbed by reducing the pressure, stripping and/or boiling up the solvent. The regenerated and recirculated solvent is free of sulfur compounds but still contains some CO2. The acid gas leaving the solvent regeneration units is suitable for the Claus process [30].

3. Simulation Model

In order to model the process, the following assumptions were considered: (1) the process is in steady state; (2) the coal feed flow rate is 3,472.2 (g s−1); (3) the reactors are perfectly insulated; (4) heat losses are neglected; (5) coal tar is not modeled; char only contains carbon and ash. Main unit operations modeled in Aspen Plus® are shown in Table 3:
Table 3. Main blocks used in the process.
Unit operationAspen Plus modelComments/specifications
ASURadFracLPC: Rigurous distillation model, first stage to separate N2 and O2. SN 40, RR 12.3, BR 41.3, partial-vapor condenser, TSP 0.14 MPa, CPD 0.005 MPa.
HPC: Rigurous distillation model, second stage to separate N2 and O2. SN 26, RR 0.5, BR 1.0, partial-vapor condenser, TSP 0.6 MPa, CPD 0.05 MPa.
Coal GasificationRGibbsSpecification of the possible products: CO, CO2, C, H2, H2O, CH4, SO2, H2S, S, CS2, COS, N2, NH3, HCN, O2, NO2, NO3.
HTS reactorREquilSpecification of the stoichometric reactions. OP 3.8 MPa, OT 623 K.
LTS reactorREquilSpecification of the stoichometric reactions. OP 0.5 MPa, OT 473 K.
CH3OH absorberRadfracRigorous absorption of H2S, SO2, COS, NH3, HCN. SN 10, TSP 3.2 MPa.
Notes: SN: Stage number; RR: Reflux ratio; BR: Boil up ratio; TSP: Top stage pressure; CPD: Column pressure drop; OT: Operating temperature; OP: Operating pressure.

3.1. Physical Property Method

The Soave-Redlich-Kwong equation of state with Kabadi-Danner mixing rules (SRKKB) was selected to calculate all thermodynamic properties for the conventional components in the overall process. This thermodynamic model was chosen as it provides high accuracy in water-hydrocarbon systems over a wide range of temperatures and predicts the instability of the liquid phase [31]. Additionally, the HCOALGEN and DCOALIGT models were used to calculate enthalpy and density for coal and ash (non-conventional components) [13].

3.2. Chemical Reactions

Gasification reactions occur above 873 K; at this temperature or higher, the kinetic barrier is minimized and reactor products are found around equilibrium. Therefore, in the simulation, a free kinetics model was implemented [32]. In this model, the equilibrium approach was employed by neglecting the hydrodynamic complexity of the gasifier. Gasification products are estimated employing the RGibbs model which uses Gibbs free energy minimization to calculate the chemical equilibrium of a list of conventional components. The gasification products are taken from the most important coal gasification reactions (Table 4) [17]. As RGibbs only estimate chemical equilibrium of conventional compounds, it is necessary to decompound solid coal (a nonconventional compound) on its constituting components. This is done by using the RYield model and specifying the yield distribution according to the Guaduas coal ultimate analysis. By this approach, satisfactory results have been obtained for many researchers from gasification simulation using Aspen Plus® [13,15,33,34].
The HTS and LTS reactors are simulated using the REquil model. The WGS reaction (R4) and COS hydrolysis (R14) are obtained specifying the stoichiometric reactions [4].
Table 4. Main process reactions.
ReactionReaction nameHeat of reaction (kJ mol−1)Reaction number
C +  O 2   CO 2 Carbon combustion−393R1
2 C +  O 2   2 CO Carbon combustion−221R2
C +  CO 2   2 CO Boudouard+173R3
C +  H 2 CO +  H 2 Steam gasification+131R4
CO +  H 2 CO 2   +  H 2 Water gas shift−412R5
CO +   3 H 2    CH 4 + H 2 O Steam reforming−206R6
CO 2 + 4 H 2    CH 4 + 2 H 2 O Methanation−165R7
S + O 2    SO 2 Sulfur combustion−297R8
SO 2 + 3 H 2    H 2 S + 2 H 2 O H2S formation−207R9
C + 2  CS 2 CS2 formation+115R10
CO +  COS COS formation+63R11
N 2 + 3 H 2   2 NH 3 NH3 formation−46R12
N 2 + 2 O 2   2 NO 2 NO2 formation+66R13
COS + H 2 H 2 S + CO 2 COS hydrolysis−34R14

4. Results and Discussion

Sensitivity analysis was performed with the aim to analyze and optimize overall operating conditions in the process. The chosen variables were: (1) O2 to coal mass ratio; (2) mass solid concentration in coal slurry; (3) LTS reactor operating temperature; (4) steam to dry gas molar ratio (SDG) in the WGS process. These were distinctively selected since they make a significant impact over the overall process [35,36,37,38]. The variable effect was evaluated over the next key process parameters: (1) syngas molar composition upstream and downstream the WGS process; (2) overall CO conversion in the WGS reactors; (3) lower heating value (LHV) of H2 rich-syngas; (4) thermal efficiency ( η T E ).

4.1. Thermal Efficiency

As the best performance, which is also the most economic option, is sought; this discussion starts showing the results obtained during the sensitivity analysis for thermal efficiency ( η T E ). This is an indicator of the overall process performance [13]. Thermal efficiency was calculated considering the hydrogen-rich syngas output energy divided by the thermal energy of the coal used as raw material and the energy requirements for auxiliary equipment (ASU, Rectisol, etc.) as follows:
η TE ( % ) = 100 × M Syn ×  LHV Syn ( M Coal ×  LHV Coal + Q Aux
According to Chen and co-workers [33], the LHV of syngas (kJ Nm−3) can be defined as:
LHV = ( 119950.4   × n H 2 + 10103.9 × n CO + 50009.3 ×  n CH 4 ) × ρ
Table 5 summarizes the results obtained from the sensitivity analysis of the variables which presents higher effect on the η TE and LHV of the H2-rich syngas. Additionally, the H2 molar fraction in the final process stream is reported. The effect of those variables will be analyzed individually in the next subsections.
Table 5. Variables effect on thermal efficiency and H2-rich syngas LHV.
VariableηTE, %LHV, MJ kg−1LHV, MJ Nm−3H2 molar fraction in H2-rich syngas
O2 to carbon ratio
0.16034.155.520.90.561
0.32042.269.015.10.806
0.48052.079.813.00.895
0.64062.683.412.00.922
0.80060.192.710.80.977
0.96054.597.310.70.983
Coal slurry concentration (% w/w)
86.2161.361.810.80.926
75.4760.487.010.80.971
65.0159.995.110.80.979
56.3459.297.011.00.974
50.0058.493.411.50.958
LTS reactor temperature (K) **
45359.599.310.70.983
47359.995.110.80.979
49860.488.610.80.971
52361.581.510.80.962
SDG gas molar ratio in WGS ††
0.69459.995.110.80.979
0.97258.6102.510.80.986
1.76855.3106.310.80.989
2.56452.4107.310.80.990
3.36049.8107.710.80.990
3.91748.2107.910.80.991
Notes: Solid concentration in coal slurry: 0.65, WGS process SDG7: 0.59, LTS reactor operating temperature: 473 K and HTS reactor operating temperature: 623 K; O2 to coal ratio: 0.8, WGS process SDG: 0.59, LTS reactor operating temperature: 473 K and HTS reactor operating temperature: 623 K as fixed variables; ** O2 to coal ratio: 0.8, solid concentration in coal slurry: 0.65, WGS process SDG : 0.59, and HTS reactor operating temperature: 623 K as fixed variables; †† O2 to coal ratio: 0.8, solid concentration in coal slurry: 0.65, LTS reactor operating temperature: 473 K and HTS reactor operating temperature: 623 K as fixed variables.

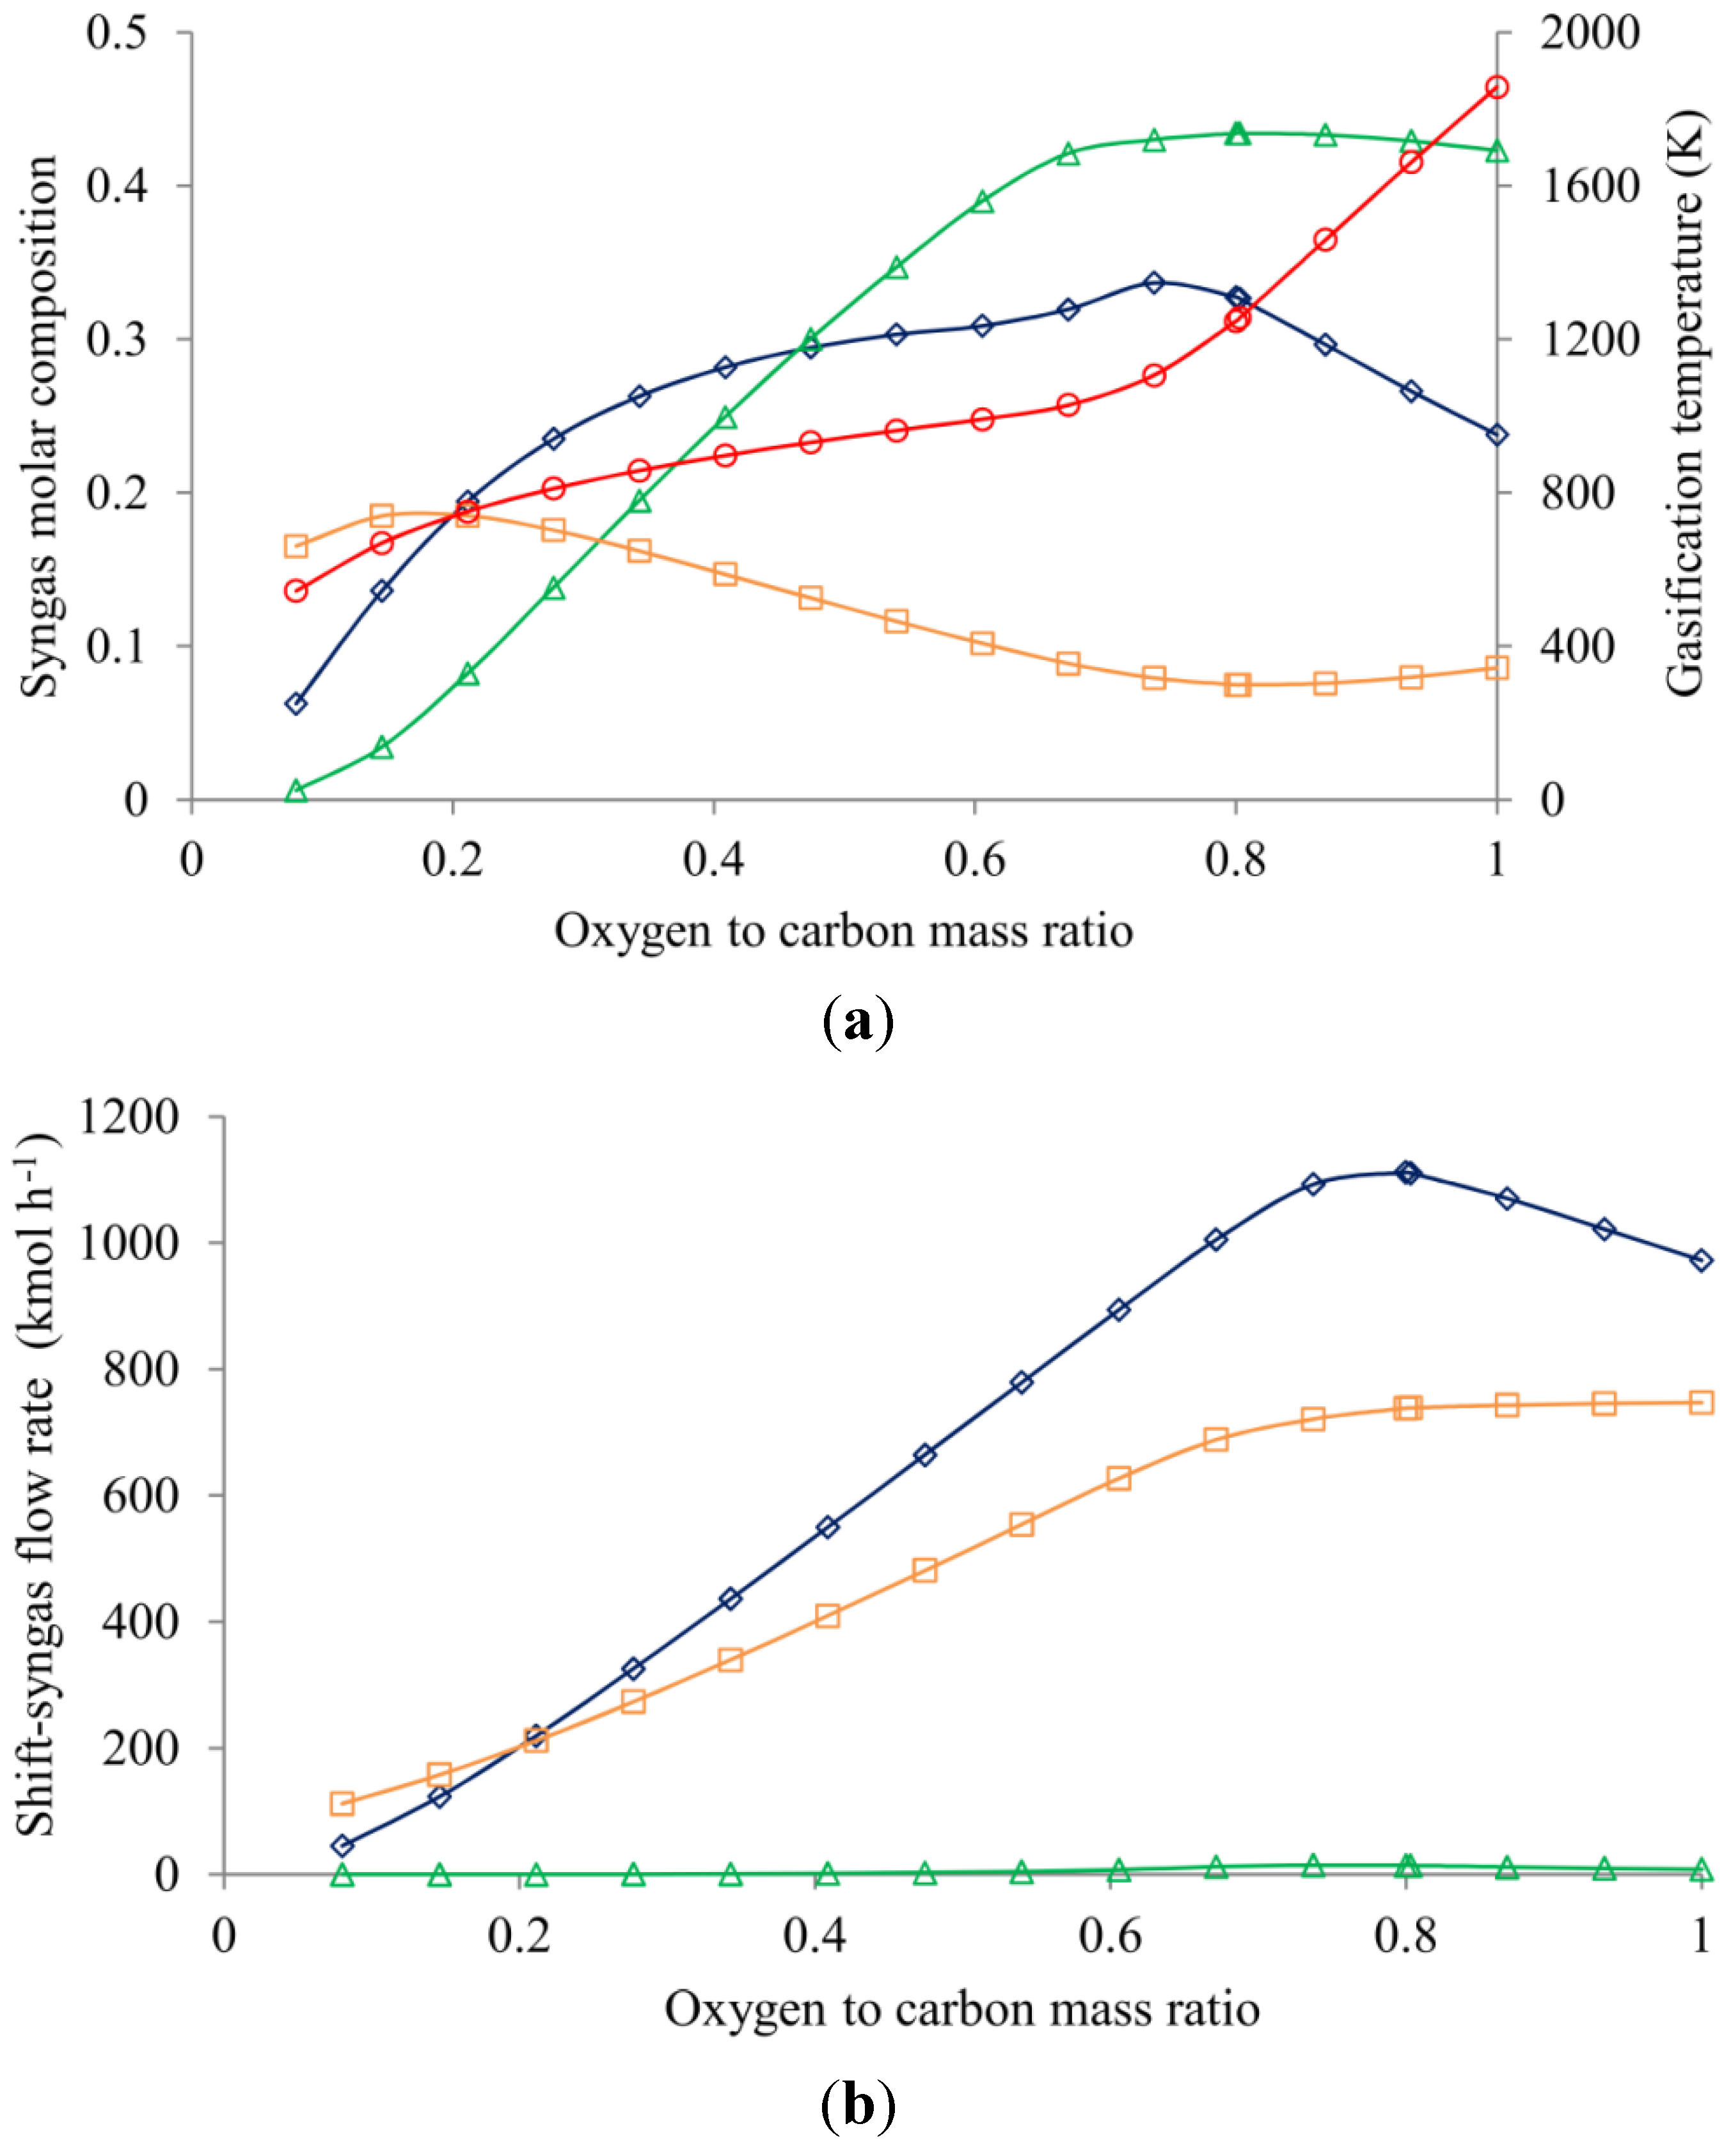
4.2. Oxygen to Carbon Mass Ratio Effect

Figure 1a,b summarizes the results obtained in the syngas molar composition and the gasification temperature in the gasifier as functions of a wide variation of the O2 to carbon mass ratio, as well as the shift-syngas flow rate after WGS. As expected, the increase in O2 to coal ratio favors exothermic reactions, therefore, an increase in gasifier operating temperature is achieved. However, as shown Figure 1a, there is a turning point in the operating gasifier temperature at an O2 to carbon ratio close to 0.8. This is due to the differences in the heat released from partial combustion and complete combustion [32]. This turning point appears when the maximum CO and H2 concentration are reached. Beyond this point the CO2 increases because of the complete combustion while the CO and H2 compositions decrease.
Figure 1. Effect of the O2 to carbon ratio on (a) the syngas molar composition upstream WGS reactors and (b) molar flow rate downstream WGS reactors: CO (∆), H2 (◊), CO2 (□) and adiabatic temperature (○) with solid concentration in coal slurry: 0.65, WGS process SDG: 0.59, LTS reactor operating temperature: 473 K and HTS reactor operating temperature: 623 K as fixed variables.
Energies 05 04924 g001
As shown in Figure 1b, the maximum H2 flow rate downstream the WGS reactors was obtained with an O2 to carbon ratio of 0.8. At this rate, CO concentration in the syngas leaving the gasifier is maximized while CO2 concentration is minimized. As a consequence, H2 production is favored in the WGS reactors.
Surprisingly, the maximum thermal efficiency was 62.6% and was obtained for an O2 to carbon ratio of 0.64 (see Table 5). When O2 to carbon ratio was fixed at 0.8, the thermal efficiency was 60.1%, decreasing 4% with respect to the maximum. That efficiency fall is caused by the increment in O2 flow rate. Consequently, energy requirements for ASU process penalize the η T E despite LHV increment.
As suggested by the results presented in Table 5, there is a linear correlation between the syngas H2 composition and its LHV. When the H2 composition rises, LHV also increases. This is because H2 is the main contributor, over CH4 and CO, to the syngas heating value.

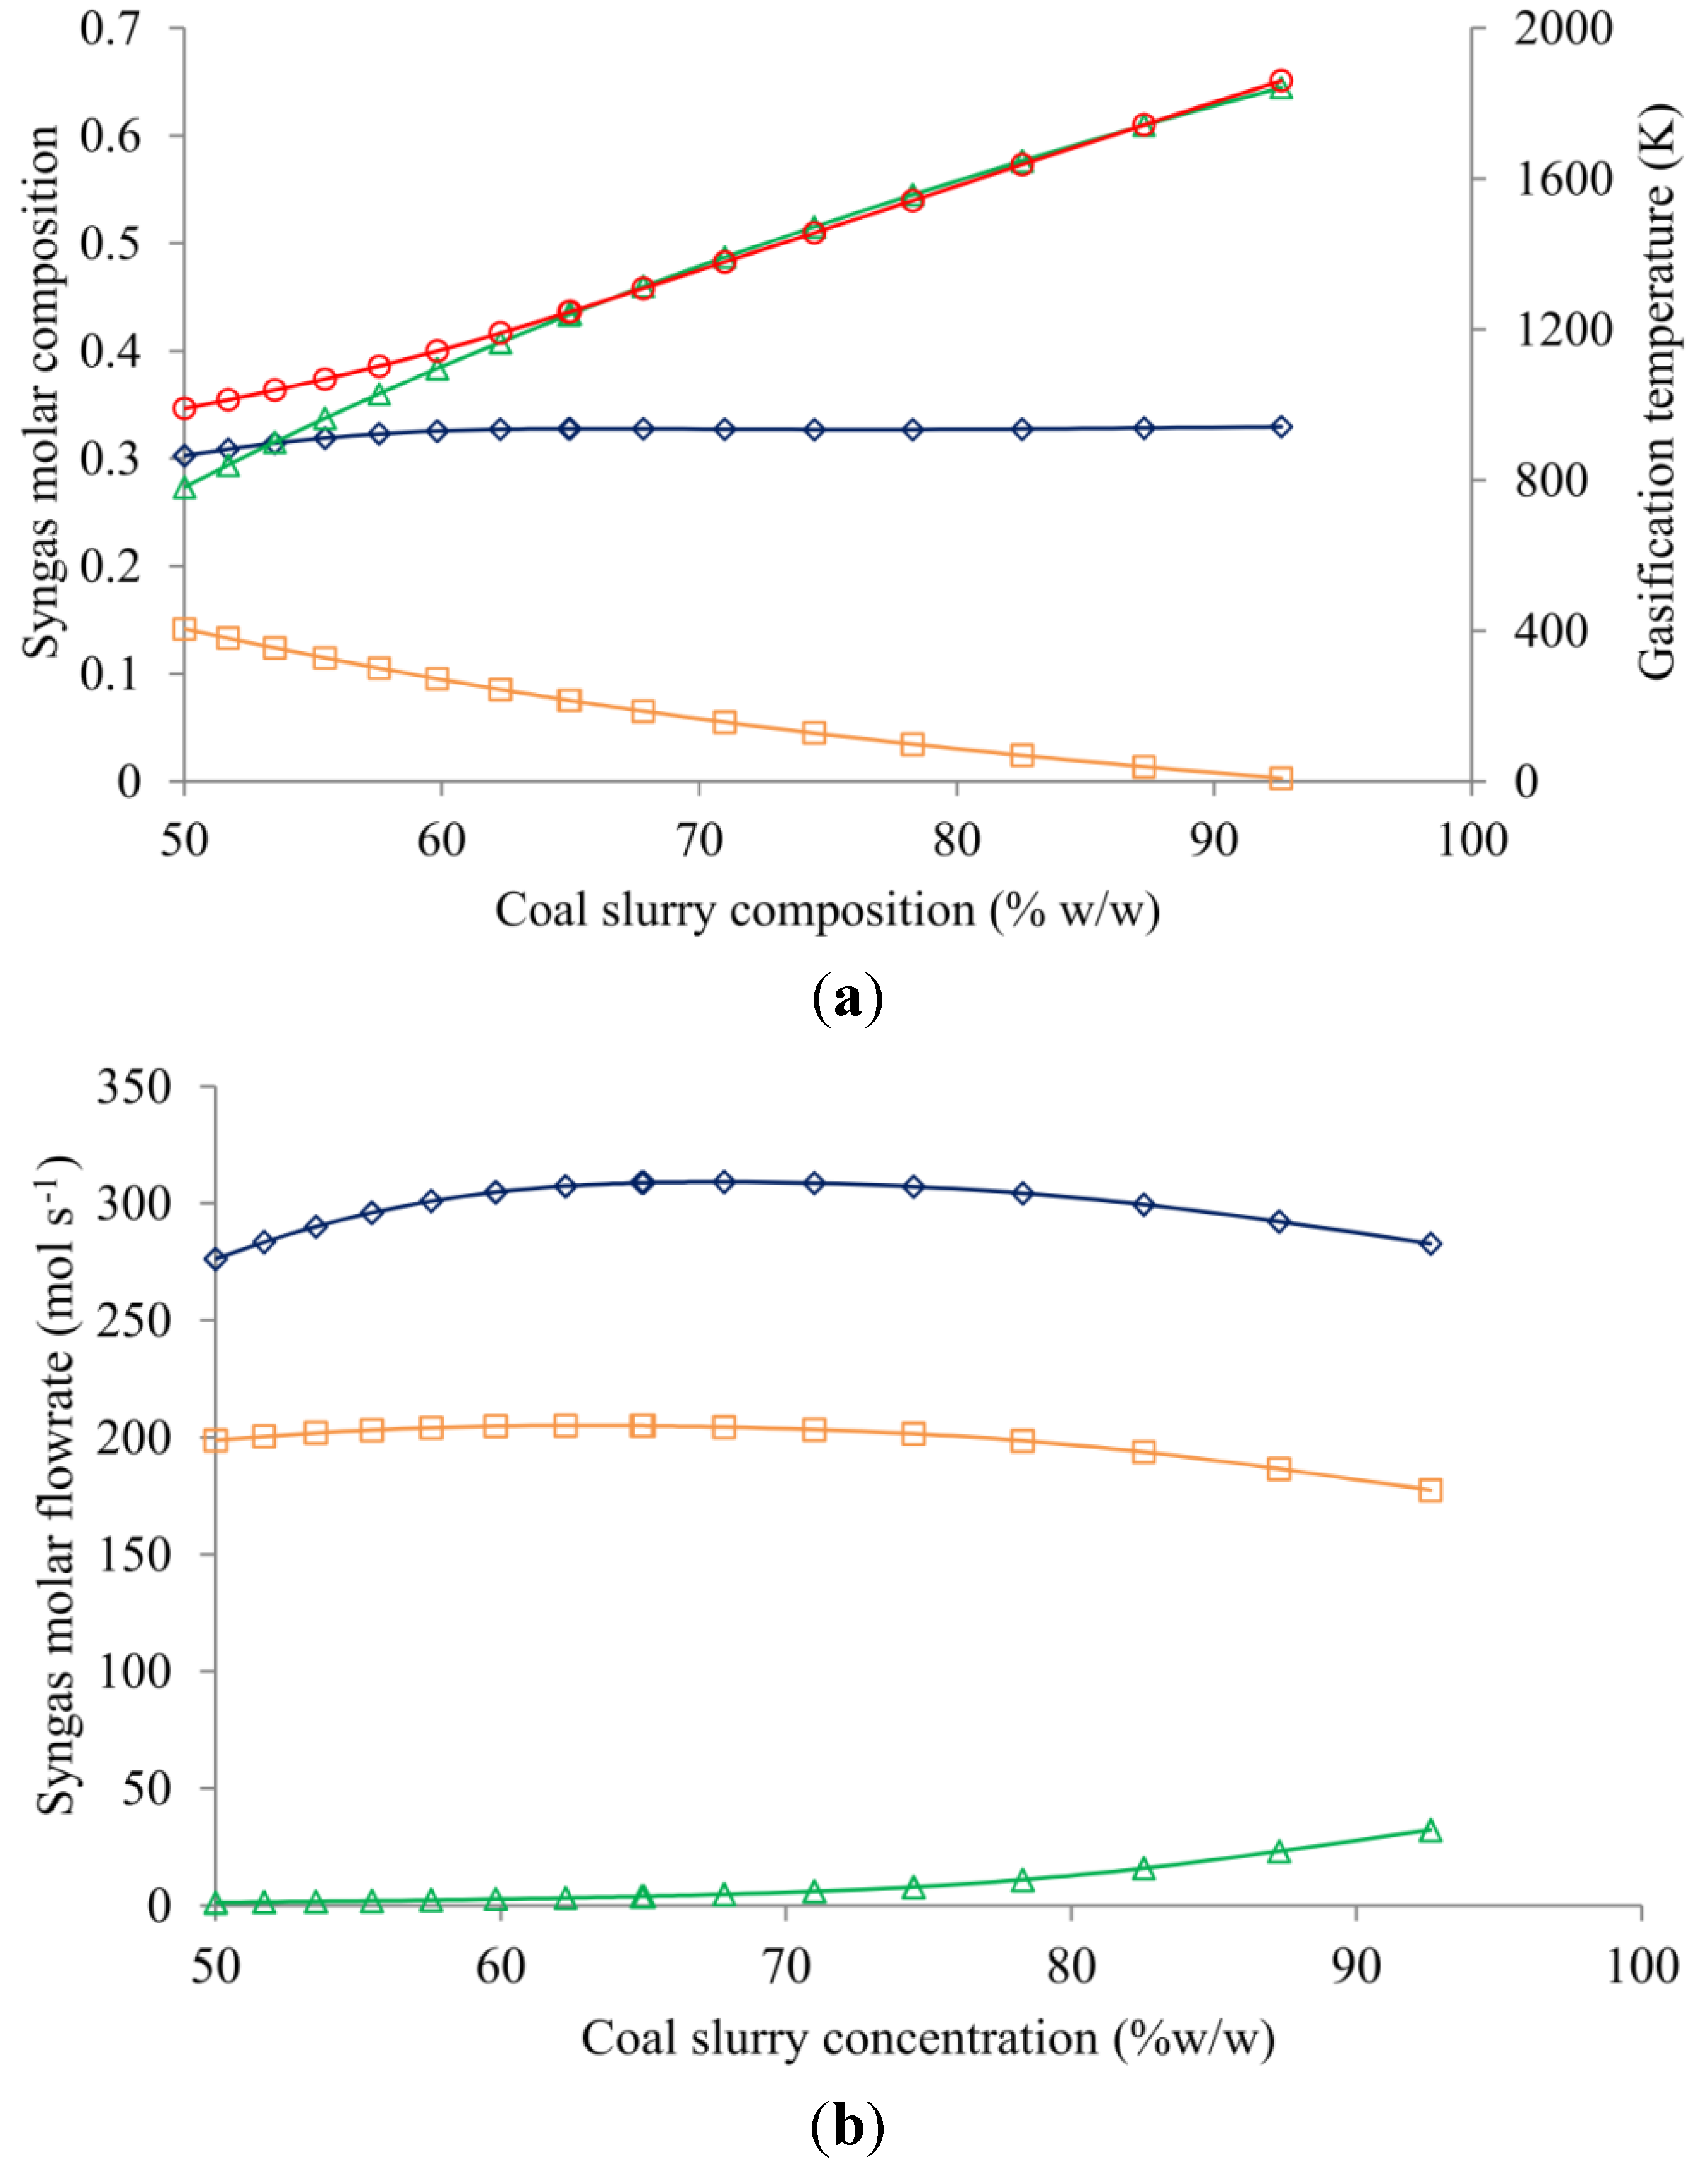
4.3. Coal Slurry Concentration Effect

Figure 2a,b summarizes the results obtained in the syngas molar composition and the gasification temperature in the gasifier as functions of a wide variation of the coal slurry concentration, as well as the shift-syngas flow rate after WGS. Figure 2a shows that a lower steam flow leads to a slight raise in H2 concentration and a significant increment of CO at the gasifier downstream.
Figure 2. Effect of the coal slurry concentration on (a) the syngas composition upstream WGS reactor and (b) molar flow rate downstream the WGS reactors: CO (∆), H2 (◊), CO2 (□) and the adiabatic temperature (○) with O2 to coal ratio: 0.8, WGS process SDG: 0.59, LTS reactor operating temperature: 473 K and HTS reactor operating temperature: 623 K as fixed variables
Energies 05 04924 g002
An increase in solid concentration results in a higher gasifier temperature. Hence, at higher temperatures Boudouard reaction (R3) and steam gasification (R4) are favored and CO production is increased. Downstream the WGS reactors, the H2 maximum flow is obtained with a solid concentration of 65% approximately, as shown in Figure 2b. Beyond this value, the H2 flow decreases because the CO conversion in the WGS reactors is limited by the steam flow rate. As shown in Table 5, the coal slurry concentration has slight effect on the η T E (<5% change within the range). Nevertheless, higher solid concentration does affect the LHV, as the WGS conversion is decreased and final H2 composition decrease moderately.

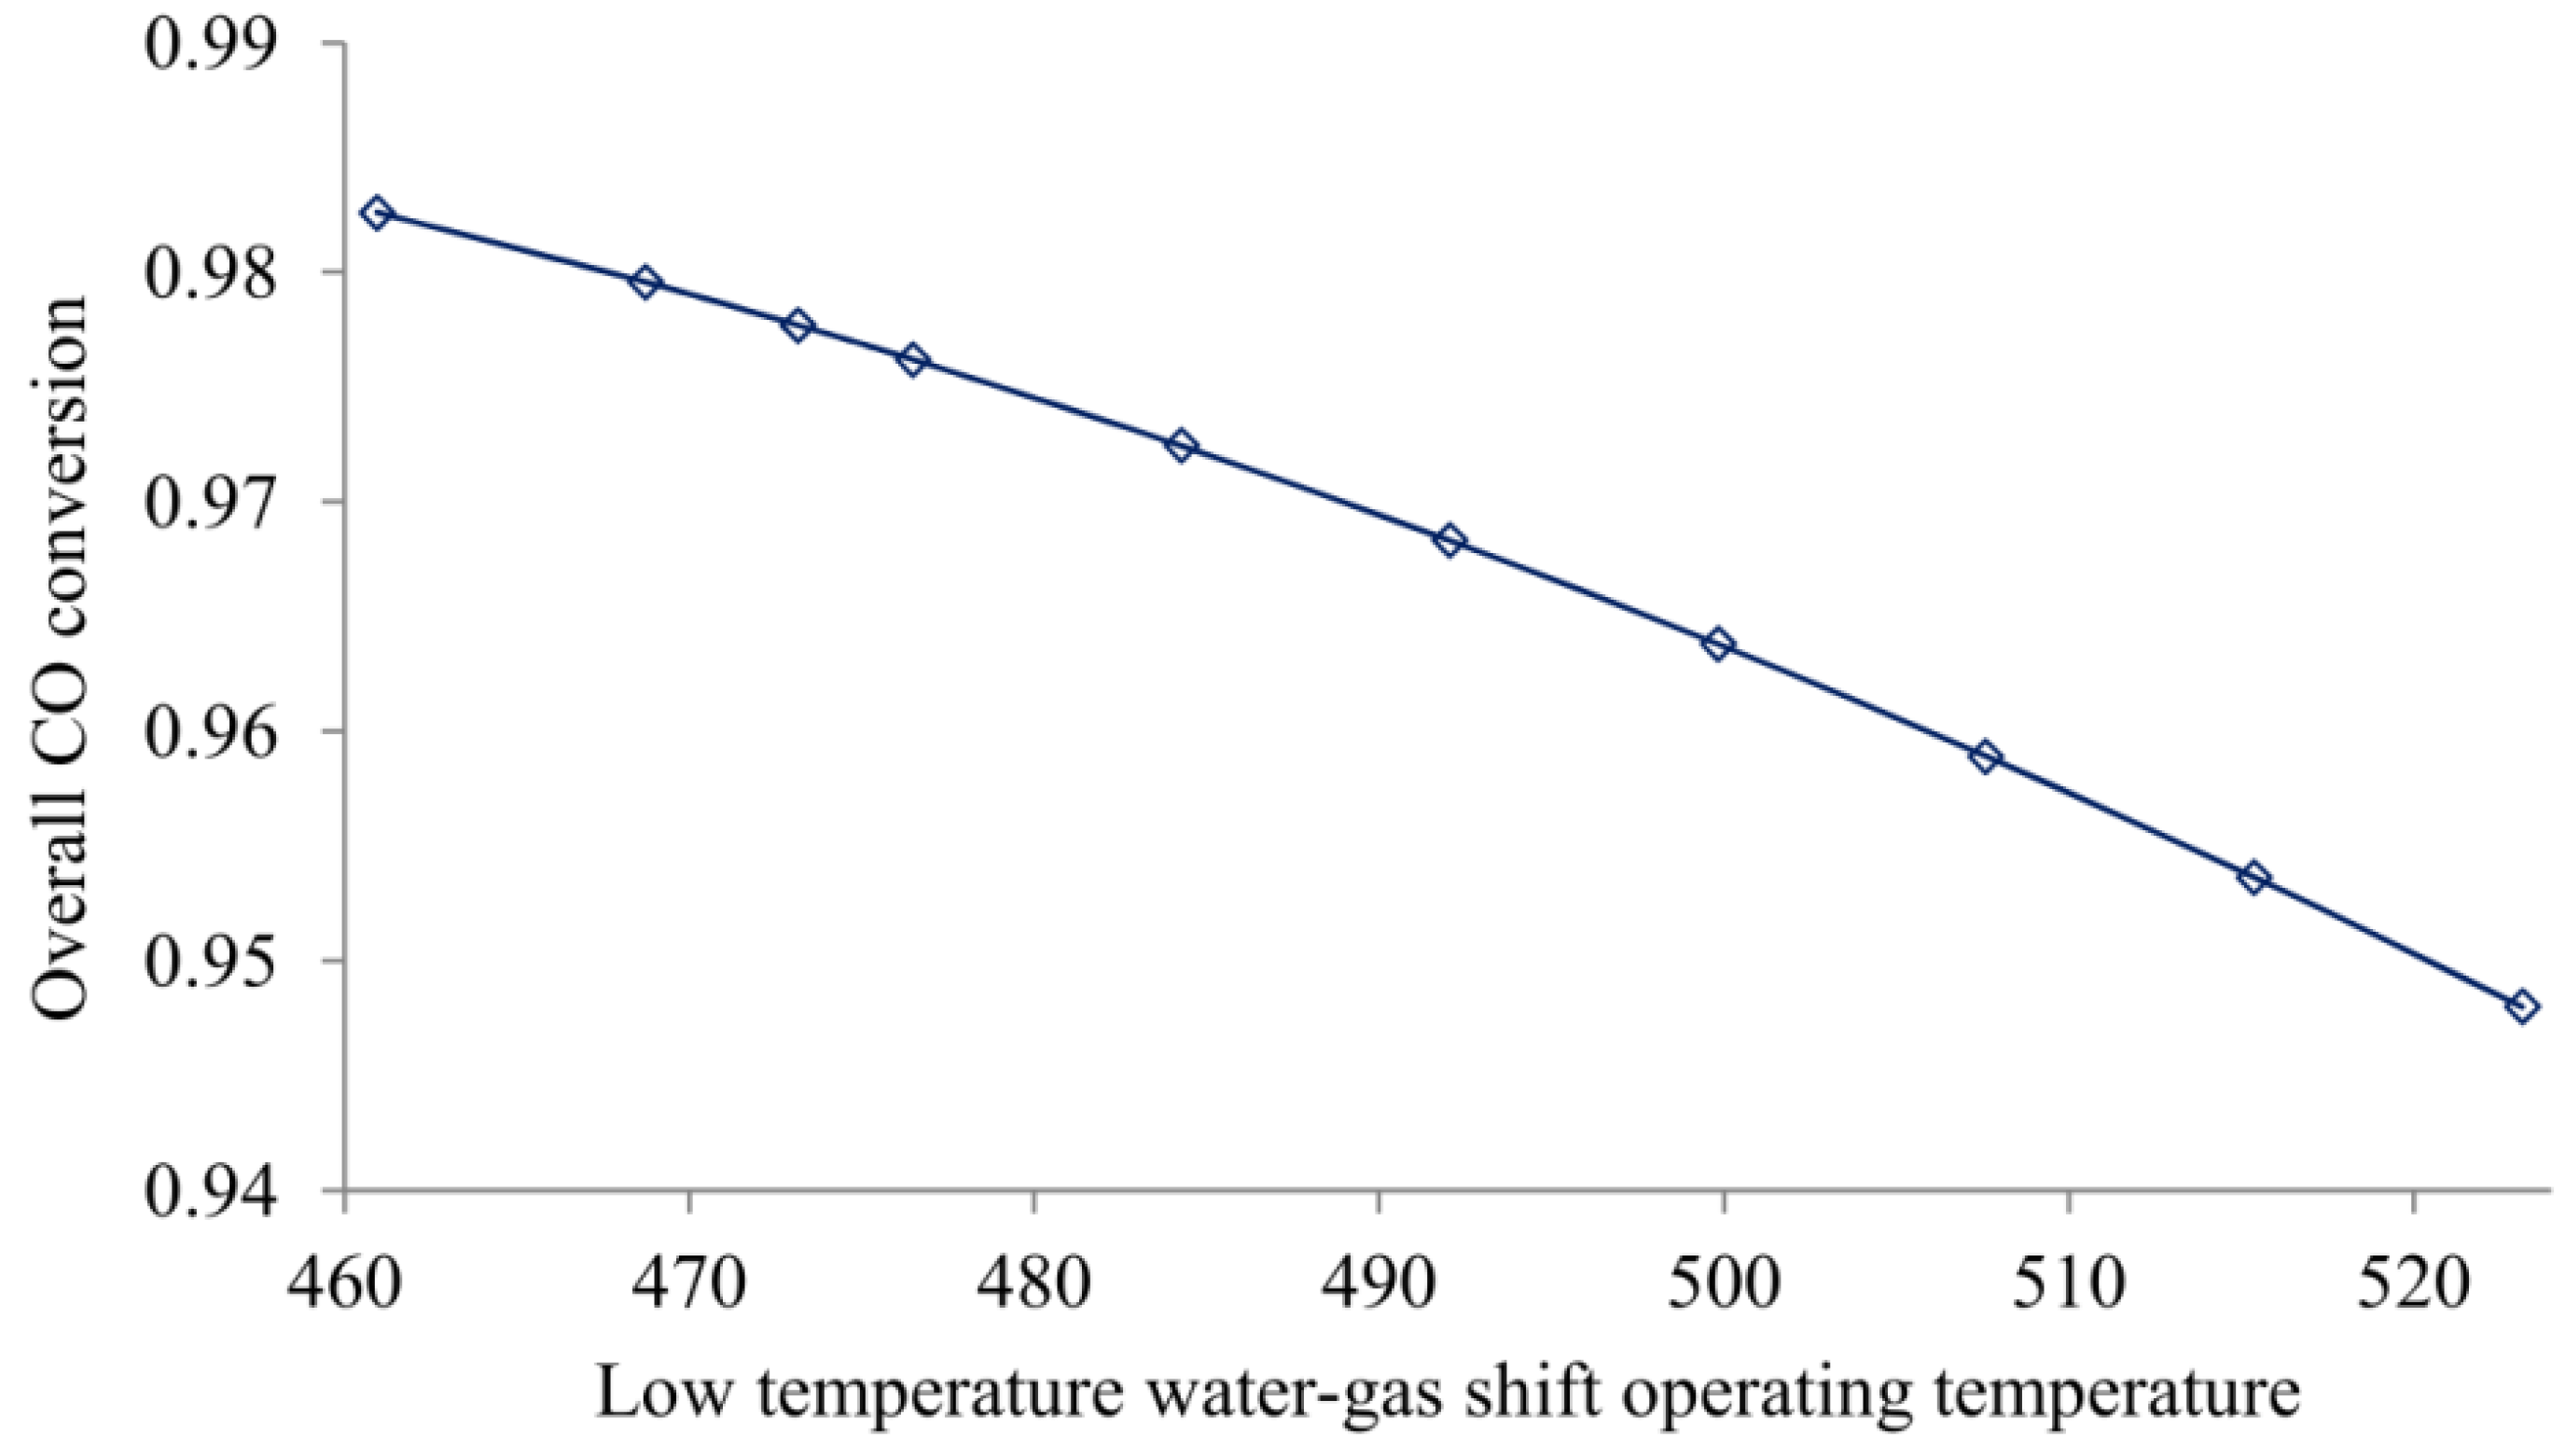
4.4. WGS Reactor Operating Temperature Effect

As shown in Figure 3, when the LTS reactor is operated at low temperatures, the CO conversion is promoted due to the exothermic nature of the WGS reaction (R5).
Figure 3. Effect of operating temperature on overall CO conversion in the shift reactors with O2 to coal ratio: 0.8, solid concentration in coal slurry: 0.65, WGS process SDG: 0.59, and HTS reactor operating temperature: 623 K as fixed variables.
Energies 05 04924 g003
Low operating temperatures are preferred to obtain higher CO to H2 conversion but it implies a decrease in the reaction rate and catalytic activity. When the LTS reactor operating temperature was raised from 453 K to 523 K, the cleaned-syngas LHV felt from 99.3 MJ kg−1 to 81.5 MJ kg−1. This is a decrease of 18% (Table 5), nevertheless, the η T E increases 3.3%. The CO2 flow in the shift-syngas drops as the LTS reactor temperature is increased (from 2.06 kg s−1 to 1.99 kg s−1). Therefore, less acid gas is removed in the Rectisol absorber from the shift-syngas. The energy requirement necessary to achieve the CH3OH recuperation is lower compared with higher CO2 concentration downstream the LTS reactor (from 1.16 MJ s−1 to 1.15 MJ s−1).

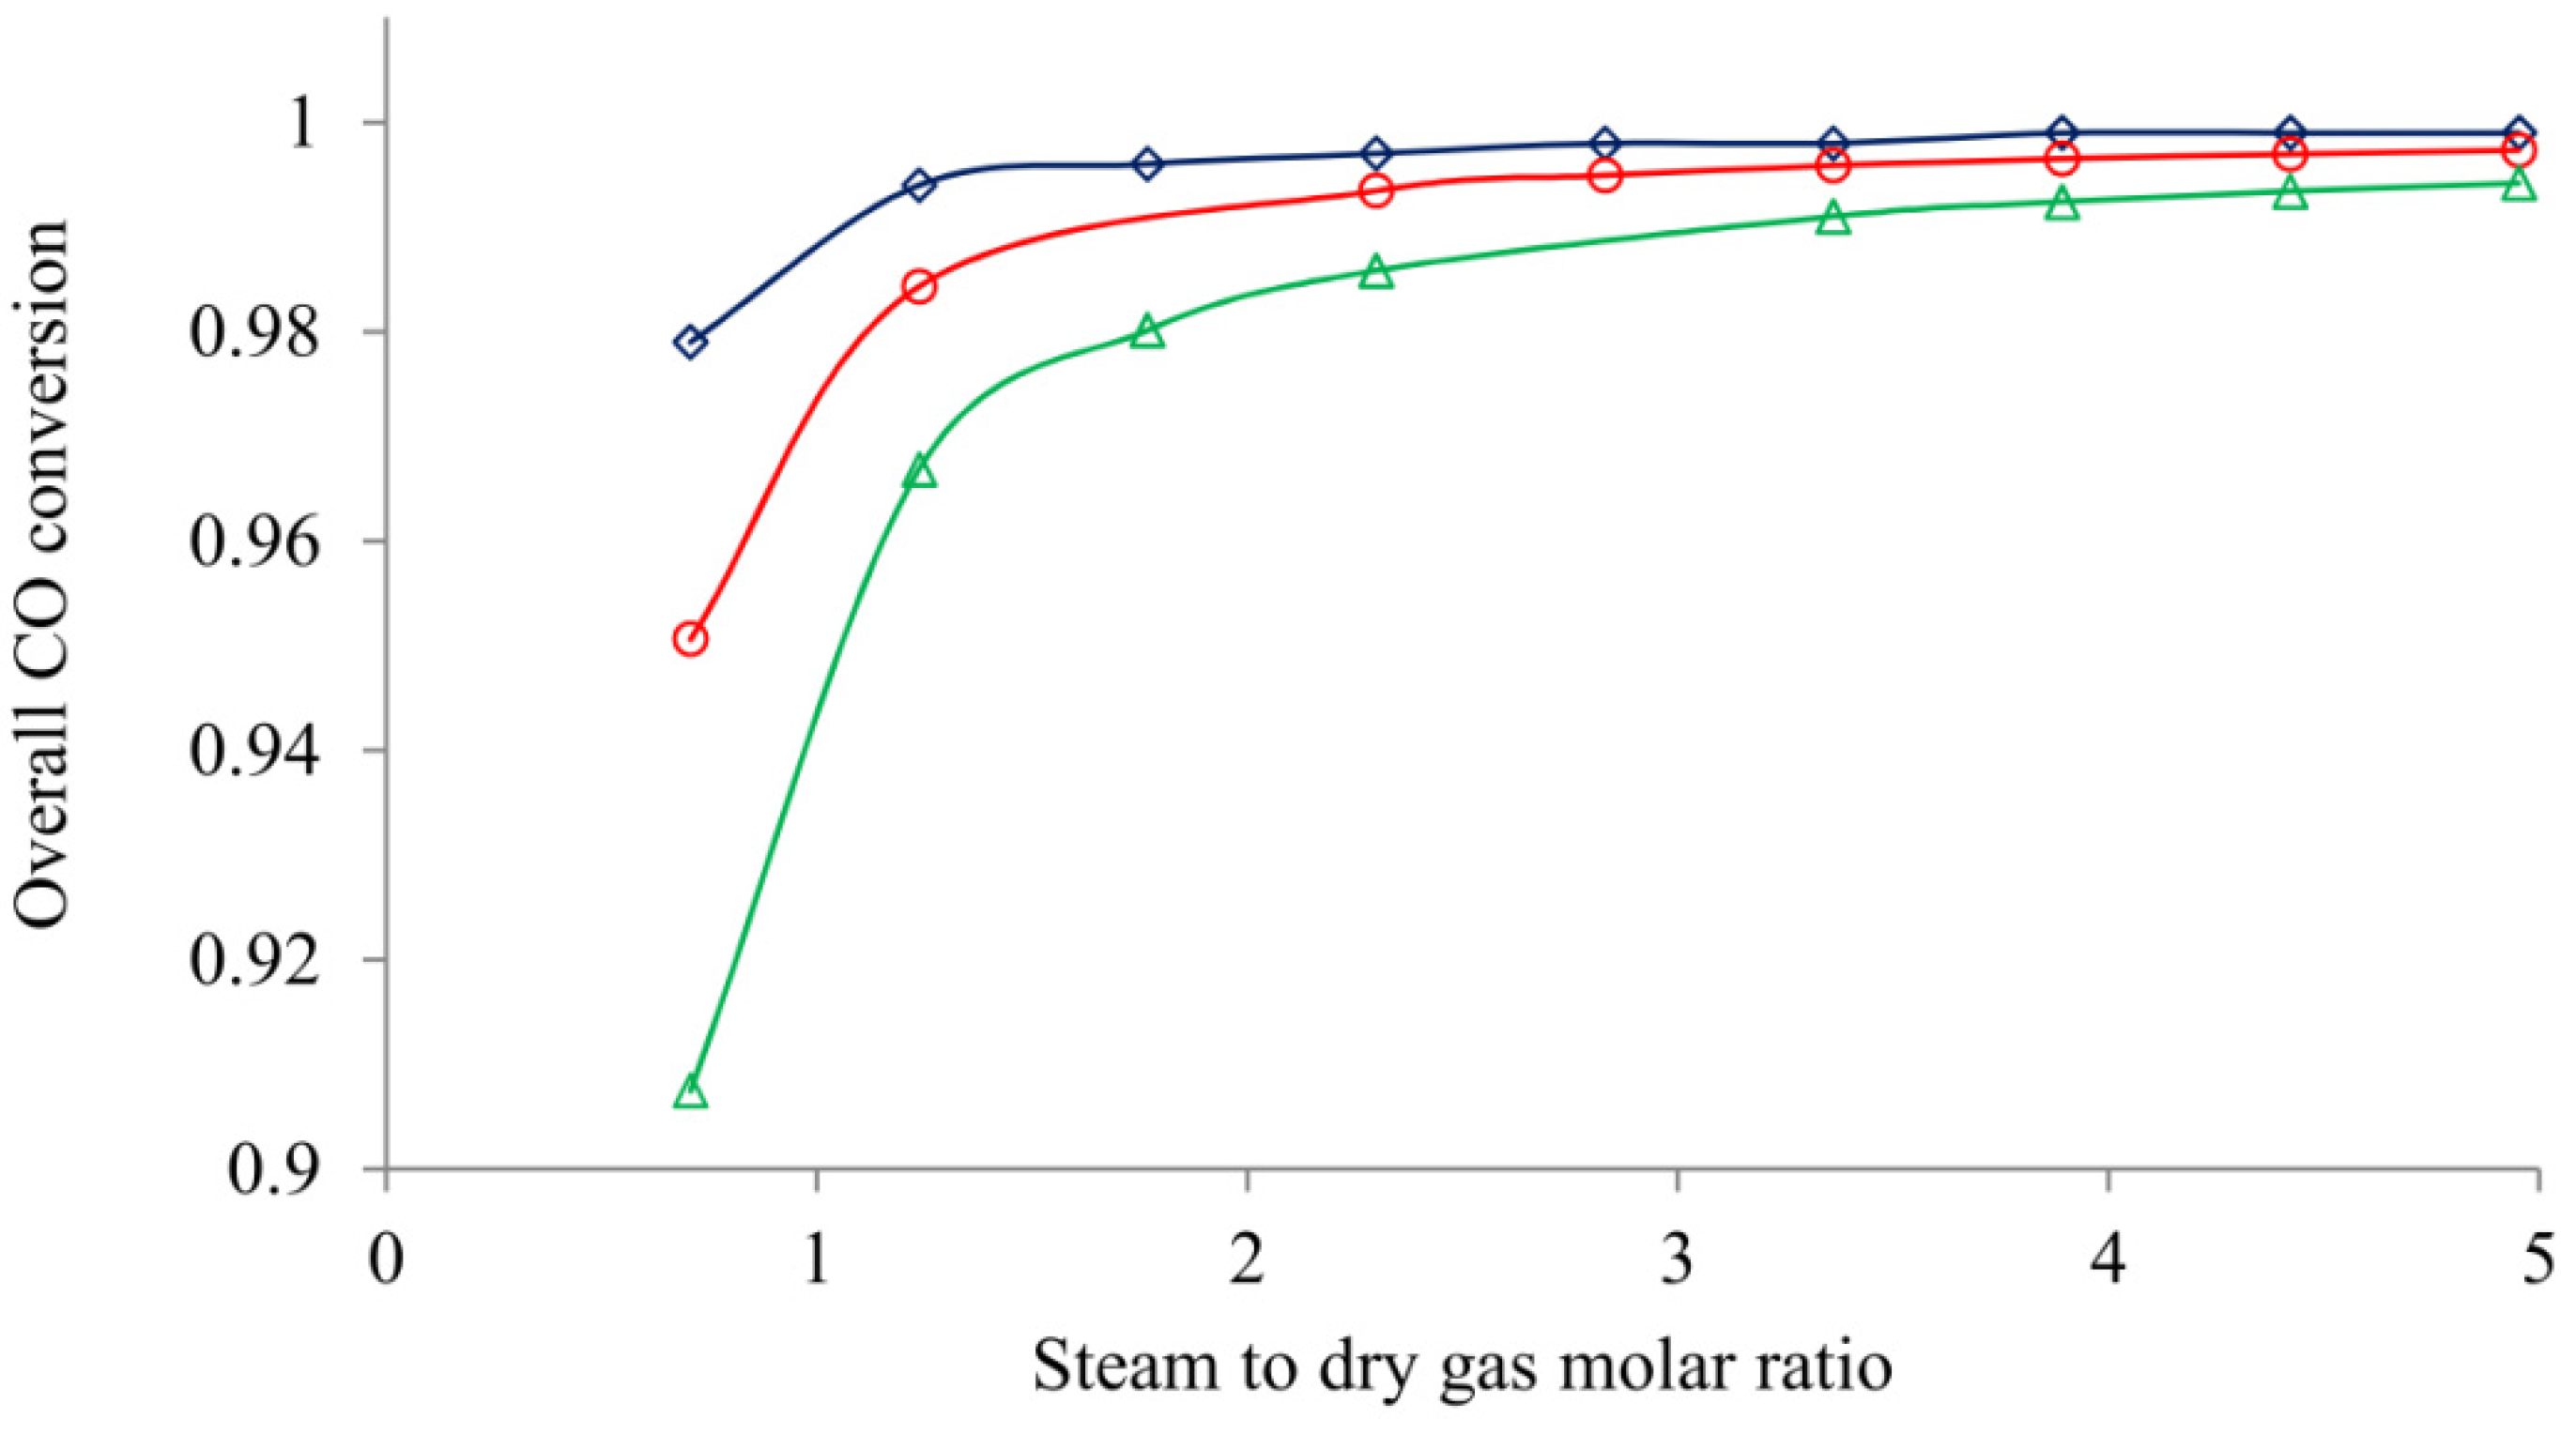
4.5. Effect of Steam to Dry Gas Molar Ratio

As shown in Figure 4, the total CO conversion grows inversely exponential with the steam to dry gas ratio (SDG), approaching asymptotically to an extent of CO conversion of 1. Besides, the SDG is dependent of the operating temperature. At lower temperatures, higher conversion with lower steam flow fed to the HTS reactor is reached. The maximum conversion of 0.999 was achieved when a 3.9 SDG was set at 473 K. However, the CO conversion keeps mainly constant after a SDG of 2, whilst a 0.996 conversion was attained. Over this value, to increase the CO conversion 0.12%, it is required to raise the SDG by 40%. Therefore, to get a conversion over 0.996 is preferred to manipulate other variables as it becomes almost insensitive to the SDG in ratios greater than 2.
Figure 4. Effect of the steam to dry gas molar ratio over overall CO conversion, when an operating temperature of 473 K (◊), 523 K (○) and 573 K (∆) is established in the LT-WGS reactor with O2 to coal ratio: 0.8, solid concentration in coal slurry: 0.65, and HTS reactor operating temperature: 623 K as fixed variables.
Energies 05 04924 g004
Cleaned-syngas LHV and η TE increases inversely exponential and decreases lineally respectively with an increasing of the SDG at a LTS operating temperature of 473 K (Table 5). Cleaned-syngas LHV increment is due to the CO conversion raising. Therefore, as in the CO conversion, after a SDG of 2 the LHV is almost constant. On the other hand, η TE drop is caused by the steam flow feed increment in WGS process. As a result, in the Rectisol process higher acid gas flow required to be treated increasing the energy consumption.

4.6. Optimal Syngas Composition

According to Table 5, the highest efficiency is reached at a slurry solid concentration of 0.65, an O2 to carbon ratio of 0.64, a WGS process SDG of 0.59, a LTS reactor operating temperature of 473 K. Table 6 shows the H2-rich syngas composition at these conditions.
Table 6. H2-rich syngas molar fraction.
ComponentH2-rich syngas molar fraction
H2O6.47 × 10−11
H20.922
N27.13 × 10−3
Cl20.00
CO9.58 × 10−3
CO26.00 × 10−6
CH40.062
H2S0.00
COS0.00
NH31.74 × 10−7
HCN0.00
CH4OH4.15 × 10−6
As shown in Table 6, the syngas product is suitable for gas turbines since H2 molar fraction is 92.2%. The operation of gas turbines using syngas with hydrogen fuel concentrations (>90%) has been demonstrated at several facilities in the United States [39]. Nevertheless, the co-sequestration of CO2 and H2S with the Rectisol process has proven to be a success as a high CO2 + H2S capture is obtained. The CO2 composition in the H2-rich syngas is 6 ppm as well as H2S and COS are found as traces. Furthermore, tail gas CO2 molar fraction is over 98% with a H2S concentration is 0.26% mol. As a result, this tail gas can be advantageous for enhanced oil production in sour fields as the environmental impact and processing costs will not be significant [40].

5. Conclusions

In this paper, a SOG simulation using Aspen Plus® was proposed to estimate syngas production by coal gasification. Sensitivity of the process for different operating variables was then analyzed. As a result, a maximum thermal efficiency of 62.6% was reached. This maximum corresponds to a slurry solid concentration of 0.65, a O2 to carbon ratio of 0.64, a WGS process SDG of 0.59, a LTS reactor operating temperature of 473 K. Under these fixed conditions, a H2-rich syngas of 92.2% molar composition and LHV of 12 MJ Nm−3 was attained.
The thermal efficiency is found to be: (1) insensitive to coal slurry concentration and LTS reactor operating temperature; (2) moderately sensitive to SDG in the WGS process; (3) most sensitive to oxygen to carbon ratio. An excessive increase in the O2 flow rate causes a fall in thermal efficiency. This behavior is caused as the energy requirements for ASU process and Rectisol process penalized the η TE despite LHV increment.
The lower heating value of the H2-rich syngas results to be: (1) moderately sensitive to the LTS reactor temperature and coal slurry concentration; (2) most sensitive to O2 to carbon ratio. Nonetheless, a SDG higher than 2 is necessary for a complete CO conversion. Beyond this ratio, the SDG has slight effect on the syngas composition (<0.12% within range) and the LHV remains constant.
Environmentally, our simulation results shows that the Rectisol process is an effective method for CO2 and H2S capture as these compounds concentrations in the H2-rich syngas were very low. Besides, the by-product tail gas can be used for enhanced oil production in sour fields.

Abbreviations

ASU
Air separation unit
HPC
High pressure column
HTS
High temperature reactor
LHV
Lower heating value, MJ Nm−3
LPC
Low pressure column
LTS
Low temperature reactor
SOG
Steam-oxygen gasification
SDG
Steam to dry gas ratio
Syn
Syngas
WGS
Water-gas shift

Nomenclature

M
Mass flow rate (kg h−1)
n
Mass fraction
QAux
Auxiliary power required (MJ h−1)
ηTE
Thermal efficiency (%)
ρ
Syngas density (kg m−3)

References

  1. Jin, H.; Lu, Y.; Liao, B.; Guo, L.; Zhang, X. Hydrogen production by coal gasification in supercritical water with a fluidized bed reactor. Int. J. Hydrogen Energy 2010, 35, 7151–7160. [Google Scholar] [CrossRef]
  2. Ramos, I.A.C.; Montini, T.; Lorenzut, B.; Troiani, H.; Gennari, F.C.; Graziani, M.; Fornasiero, P. Hydrogen production from ethanol steam reforming on M/CeO2/YSZ (M = Ru, Pd, Ag) nanocomposites. Catal. Today 2012, 180, 96–104. [Google Scholar] [CrossRef]
  3. Higman, C.; van der Burgt, M. Gasification, 2nd ed.; Gulf Professional Publishing: Burlington, VT, USA, 2008. [Google Scholar]
  4. Liu, K.; Cui, Z.; Fletcher, T.H. Coal Gasification. In Hydrogen and Syngas Production and Purification Technologies; Liu, K., Song, C., Subramani, V., Eds.; John Wiley & Sons, Inc.: Hoboken, NJ, USA, 2009; pp. 156–218. [Google Scholar]
  5. Giunta, P.; Amadeo, N.; Laborde, M. Simulation of a low temperature water gas shift reactor using the heterogeneous model/application to a pem fuel cell. J. Power Sources 2006, 156, 489–496. [Google Scholar] [CrossRef]
  6. Dincer, I. Green methods for hydrogen production. Int. J. Hydrogen Energy 2012, 37, 1954–1971. [Google Scholar] [CrossRef]
  7. Statistical Review of World Energy 2012; Technical Reports for BP Global: London, UK, June 2012; Available online: http://www.bp.com/statisticalreview (accessed on 1 September 2012).
  8. Stańczyk, K.; Kapusta, K.; Wiatowski, M.; Świądrowski, J.; Smoliński, A.; Rogut, J.; Kotyrba, A. Experimental simulation of hard coal underground gasification for hydrogen production. Fuel 2012, 91, 40–50. [Google Scholar] [CrossRef]
  9. Jones, R.H.; Thomas, G.J. Materials for the Hydrogen Economy; CRC Press: Boca Raton, FL, USA, 2008. [Google Scholar]
  10. U.S. Department of Energy. Pioneering Gasification Plants. Available online: http://www.fossil.energy.gov/programs/powersystems/gasification/gasificationpioneer.html (accessed on 1 September 2012).
  11. Ministerio de Minas y Energı́a de Colombia; Instituto Colombiano de Geología y Minería. El Carbón Colombiano: Recursos, Reservas y Calidad; Ingenominas: Bogotá, Colombia, 2004. [Google Scholar]
  12. Minchener, A.J. Coal gasification for advanced power generation. Fuel 2005, 84, 2222–2235. [Google Scholar] [CrossRef]
  13. Emun, F.; Gadalla, M.; Majozi, T.; Boer, D. Integrated gasification combined cycle (IGCC) process simulation and optimization. Comput. Chem. Eng. 2010, 34, 331–338. [Google Scholar] [CrossRef]
  14. Nikoo, M.B.; Mahinpey, N. Simulation of biomass gasification in fluidized bed reactor using ASPEN PLUS. Biomass Bioenergy 2008, 32, 1245–1254. [Google Scholar] [CrossRef]
  15. Ramzan, N.; Ashraf, A.; Naveed, S.; Malik, A. Simulation of hybrid biomass gasification using Aspen plus: A comparative performance analysis for food, municipal solid and poultry waste. Biomass Bioenergy 2011, 35, 3962–3969. [Google Scholar] [CrossRef]
  16. Shen, L.; Gao, Y.; Xiao, J. Simulation of hydrogen production from biomass gasification in interconnected fluidized beds. Biomass Bioenergy 2008, 32, 120–127. [Google Scholar] [CrossRef]
  17. Liu, B.; Yang, X.; Song, W.; Lin, W. Process simulation development of coal combustion in a circulating fluidized bed combustor based on aspen plus. Energy Fuels 2011, 25, 1721–1730. [Google Scholar] [CrossRef]
  18. Robinson, P.J.; Luyben, W.L. Simple dynamic gasifier model that runs in aspen dynamics. Ind. Eng. Chem. Res. 2008, 47, 7784–7792. [Google Scholar] [CrossRef]
  19. Chiesa, P.; Consonni, S.; Kreutz, T.; Robert, W. Co-production of hydrogen, electricity and CO2 from coal with commercially ready technology. Part A: Performance and emissions. Int. J. Hydrogen Energy 2005, 30, 747–767. [Google Scholar] [CrossRef]
  20. Davison, T.Y. GE Gasification Project Update. In Presented at Gasification 11 Conference, Cagliari, Italy, 8–11 May 2012.
  21. Smith, A.R.; Klosek, J. A review of air separation technologies and their integration with energy conversion processes. Fuel Process. Technol. 2001, 70, 115–134. [Google Scholar] [CrossRef]
  22. Vinson, D.R. Air separation control technology. Comput. Chem. Eng. 2006, 30, 1436–1446. [Google Scholar] [CrossRef]
  23. Cryogenic Air Separation: History and Technological Progress; The Linde Group: Vresova, Czech Republic; Available online: http://www.linde-le.de/process_plants/air_separation_plants/documents/L_2_1_e_09_150dpi.pdf (accessed on 1 September 2012).
  24. Castle, W.F. Air separation and liquefaction: Recent developments and prospects for the beginning of the new millennium. Int. J. Refrig. 2002, 25, 158–172. [Google Scholar] [CrossRef]
  25. Damartzis, T.; Zabaniotou, A. Thermochemical conversion of biomass to second generation biofuels through integrated process design—A review. Renew. Sustain. Energy Rev. 2011, 15, 366–378. [Google Scholar] [CrossRef]
  26. Haldor Topsøe. Sulphur Resistant/Sour Water-Gas Shift Catalyst. Available online: http://www.topsoe.com/business_areas/gasification_based/Processes/~/media/PDF%20files/SSK/topsoe_SSK%20brochure_aug09.ashx (accessed on 1 September 2012).
  27. Bell, D.; Towler, B. Coal Gasification and Its Applications; Elsevier: Oxford, UK, 2010. [Google Scholar]
  28. Korens, N.; Simbeck, D.; Wilhelm, D. Process Screening Analysis of Alternative Gas Treating and Sulfur Removal for Gasification; Technical Report for National Energy Technology Laboratory, U.S. Department of Energy: Pittsburgh, PA, USA, December 2002.
  29. Heil, S.; Brunhuber, C.; Link, K.; Kittel, J.; Meyer, B. Dynamic Modelling of CO2-Removal Units for an IGCC power plant. In Proceedings of the 7th Modelica Conference, Como, Italy, 20–22 September 2009; The Modelica Association: Como, Italy; pp. 77–85.
  30. Larson, E.D.; Consonni, S.; Katofsky, R.E.; Consulting, N.; Burlington, I.; Iisa, K.; Frederick, W.J., Jr. A Cost-Benefit Assessment of Gasification-Based Biorefining in the Kraft Pulp and Paper Industry; Technical Report for Princeton University: Princeton, NJ, USA, 21 December 2006. [Google Scholar]
  31. Kabadi, V.N.; Danner, R.P. A modified Soave-Redlich-Kwong equation of state for water-hydrocarbon phase equilibria. Ind. Eng. Chem. Process Des. Dev. 1985, 24, 537–541. [Google Scholar] [CrossRef]
  32. Yuehong, Z.; Hao, W.; Zhihong, X. Conceptual design and simulation study of a co-gasification technology. Energy Convers. Manag. 2006, 47, 1416–1428. [Google Scholar] [CrossRef]
  33. Chen, C.; Jin, Y.-Q.; Yan, J.-H.; Chi, Y. Simulation of municipal solid waste gasification in two different types of fixed bed reactors. Fuel 2011, in press. [Google Scholar]
  34. Wang, Y.; Dong, W.; Dong, L.; Yue, J.; Gao, S.; Suda, T.; Xu, G. Production of middle caloric fuel gas from coal by dual-bed gasification technology. Energy Fuels 2010, 24, 2985–2990. [Google Scholar] [CrossRef]
  35. Wu, Y.X.; Zhang, J.S.; Smith, P.J.; Zhang, H.; Reid, C.; Lv, J.F.; Yue, G.X. Three-dimensional simulation for an entrained flow coal slurry gasifier. Energy Fuels 2010, 24, 1156–1163. [Google Scholar] [CrossRef]
  36. Choi, Y.C.; Park, T.J.; Kim, J.H.; Lee, J.G.; Hong, J.C.; Kim, Y.G. Experimental studies of 1 ton/day coal slurry feed type oxygen blown, entrained flow gasifier. Korean J. Chem. Eng. 2001, 18, 493–498. [Google Scholar] [CrossRef]
  37. Seo, H.K.; Park, S.; Lee, J.; Kim, M.; Chung, S.W.; Chung, J.H.; Kim, K. Effects of operating factors in the coal gasification reaction. Korean J. Chem. Eng. 2011, 28, 1851–1858. [Google Scholar] [CrossRef]
  38. Grol, E.; Yang, W.-C. Evaluation of Alternate Water Gas Shift Configurations for IGCC Systems; Technical Report for National Energy Technology Laboratory, U.S. Department of Energy: Pittsburgh, PA, USA, 5 August 2009.
  39. Walton, S.M.; He, X.; Zigler, B.T.; Wooldridge, M.S. An experimental investigation of the ignition properties of hydrogen and carbon monoxide mixtures for syngas turbine applications. Proc. Combust. Inst. 2007, 31, 3147–3154. [Google Scholar] [CrossRef]
  40. Davison, J.; Bressan, L.; Domenichini, R. CO2 capture in coal-based igcc power plants. In Proceedings of the 7th International Conference in Greenhouse Gas Control Technologies, Vancouver, Canada, 5–9 September 2004.

