1. Introduction
Solar energy is commonly considered one of the most promising renewable energies. This is due to the widespread availability of solar radiation all over the World and to the recent development of its conversion technologies. Solar energy can be exploited for producing both electricity (by photovoltaic collectors, PV) and heat (by thermal solar collectors, SC). From this point of view, different commercial devices have been available for several decades [
1,
2].
However, a possible improvement of both PV and SC technologies consists in a combination of their effects. This occurs in photovoltaic/thermal collectors (PVT) which simultaneously provide electricity and heat. The basic principle of a PVT collector is simple, since it can be obtained by a conventional thermal collector whose absorber is covered by a suitable PV layer [
3]. The absorbed thermal energy is distributed to a fluid (typically air or water), whereas the PV produces electricity [
1,
2]. The final result of this arrangement is the combined production of electricity and heat and a possible improvement of PV efficiency. In fact, the PV electrical efficiency is strongly dependent on the system operating temperature, linearly decreasing with high values of such parameter [
4]. Therefore, if the PV layer operating temperature is reduced by a cooling fluid, the system efficiency will be higher than the one of conventional PV [
1,
2,
4]. In order to achieve this result, the outlet temperature of the cooling fluid should be sufficiently low (usually <40 °C). For this reason, the heat available from PVT systems can be used only for low-temperature heat demand (e.g., domestic hot water, floor heating,
etc.).
From this point of view, an interesting application is the desiccant cooling [
5,
6,
7,
8]. The selection of the PVT operating temperature is an important key-point in the system design. In fact, while higher operating temperatures increase the potential use of the cogenerative heat, they decrease the electricity production [
1,
2,
4]. As a consequence, researchers are performing a special effort seeking to realise a PVT collector providing medium-temperature heat (60 ÷ 80 °C) at high electrical efficiency [
9]. A possible alternative for increasing fluid PVT outlet temperature without decreasing PV electrical efficiency, may consist in the use of a heat pump, which uses part of the PV electricity to increase PVT outlet temperature [
1,
2,
9]. Although the basic idea of the PVT was developed about 40 years ago, this product is still far from mature commercialization [
10]. Thus, several researchers are investigating several novel PVT arrangements [
10,
11,
12,
13].
Anyhow, the majority of the studies regarding PVT are focused on the development of devices that reduce capital costs and improve the system reliability. In this framework, a possible system configuration consists in the adoption of Concentrating PVT collectors (CPVT). Basically, they are simple PVT collectors placed in the focus of some reflectors (Fresnel, parabolic, dish,
etc.) [
1,
2,
9,
14]. Obviously, the specific cost of this system is dramatically lower than the flat plate PVT one; this is due to the lower amount of PV employed per unit area. On the other hand, it must be considered that concentrating solar radiation devices determine an increase of radiative flux on PV, increasing its operating temperature and therefore decreasing its electrical efficiency. Usually, this drop off is not too high (typically, 0.45%/K for silicon cells), if the increase of temperature is fair (a silicon cell having an efficiency of 15% at 25 °C, will show an efficiency of 11.6% at 75 °C). Conversely, for high concentration ratios, the PVT operating temperature and the corresponding inefficiencies may significantly increase (for silicon cells, the voltage drops to zero at 270 °C) [
4]. Therefore, the use of CPVT may be improved adopting novel PV materials, such as multi-junction solar cells which can approach a nominal efficiency of 40% [
14,
15]. The adoption of such materials in CPVT may lead to a system operating up to 240 °C at reasonable conversion efficiency (slightly lower than 20%) [
14]. The perspective of using high temperature PVT is very interesting since it extends the number of possible applications. An example consists in the use of the high-temperature heat provided by the PVT to drive heat engines (Stirling engines [
16] or an Organic Rankine Cycle, ORC [
17]) or a Solar Heating and Cooling system [
14].
However, commercially or pre-commercially available CPVT systems typically represent a small amount of the PVT systems under development [
10]. Similarly, the availability of theoretical and experimental studies investigating CPVT performance is scarce. In particular, Mittelman
et al. [
14,
18,
19] performed some experimental and theoretical works dealing with CPVT systems. In reference [
19] presented a novel miniature CPVT based on a dish concentrator (0.95 m
2) and a silicon PV cell. A thermal model for that system was developed in order to predict its performance. The system provides 140–180 W of electricity and 400–500 W of heat. The cost of the system was evaluated at 2.5 $ per peak electric watt. The operation at high temperature of similar CPVT systems was also analyzed both for solar cooling [
14] and water desalination [
18] applications. A Parabolic Trough CPVT prototype was experimentally investigated by Coventry [
20]. In this work, the author pointed out that one of the major challenges in designing CPVT systems is to achieve an acceptable radiation flux distribution. The concentration ratio of the system under investigation was 37, thermal and electrical efficiencies were rated respectively at 58% and 11%. In this study, the author also concluded that the thermal efficiency of CPVT is higher than the one of flat plate solar collectors only when radiation is scarce and/or ambient temperature is low. Parabolic Trough CPVTs were also investigated by Li
et al. [
21,
22,
23] comparing the electrical and thermal efficiencies of the system varying the PV technology, for different concentration ratio. Authors concluded that GeAs cells increase electrical efficiency with respect to silicon cells. However, the thermal efficiency of GeAs results lower than the one of silicon cells. Authors also pointed out that the cost of unit area of the GeAs is 3067.16 $/m
2 versus the 131.34 $/m
2 of the silicon cell. A similar work was performed by Bernardo
et al. analyzing a low concentrating parabolic trough CPVT for the Swedish climate [
24]. This study presents a thermal model of the PVT subsequently validated by experimental data. The system is based on a combination of a one axis tracking parabolic concentrator and silicon cells. Additional specific applications of CPVT technology are also investigated in literature. Xu
et al. [
25] analyzed the integration of CPVT in the evaporator of a heat pump system. Al-Alilli
et al. [
26] investigated the use of a CPVT in a desiccant cooling system. Finally, Rosell
et al. [
27] investigated a low concentrating PVT system based on a linear Fresnel receiver. The system was analyzed by a mathematical model subsequently validated by experimental data. The rated thermal efficiency was about 60%.
This paper is focused on the Concentrating Parabolic Trough PVT solar collector technology of and it presents a design procedure and a simulation model of a novel concentrating PVT collector. The layout of the PVT system under investigation was derived from a prototype recently presented in literature and commercially available [
24]. The design of this prototype was modified with the scope to improve its electrical performance and it consists in a parabolic trough concentrator and a linear triangular receiver. The bottom surfaces of the receiver are equipped with mono-crystalline silicon cells whereas the top surface is covered by an absorbing surface. The aperture area of the parabola was covered by a glass in order to improve the thermal efficiency of the system. In the modified version of the collector considered in this paper, two modifications are implemented: the cover glass was eliminated and the mono-crystalline silicon cells were replaced by triple-junction cells allowing one to increase significantly the electrical efficiency of the system especially in case of high operating temperature. In order to analyze the performance of the modified Concentrating PVT (CPVT) collector a detailed mathematical model based on zero-dimensional energy balances on the control volumes of the system was implemented. The simulation model calculates in detail the temperatures of the main components of the system (PV layer, concentrator, fluid inlet and outlet and metallic substrate) and the main energy flows (electrical energy, useful thermal energy, radiative losses, convective losses). The input parameters of the model include all the weather conditions (temperature, insolation, wind velocity,
etc.) and the geometrical/material parameters of the systems (lengths, thermal resistances, thicknesses,
etc.). The model was used in order to evaluate both electrical and thermal efficiency curves related to the beam incident radiation, fluid inlet temperature and external temperature.
2. CPVT Simulation Model
The idea of CPVT considered in this study is based on the work of Bernardo
et al. [
24,
28] and on a prototype that has been recently commercialized [
10,
24,
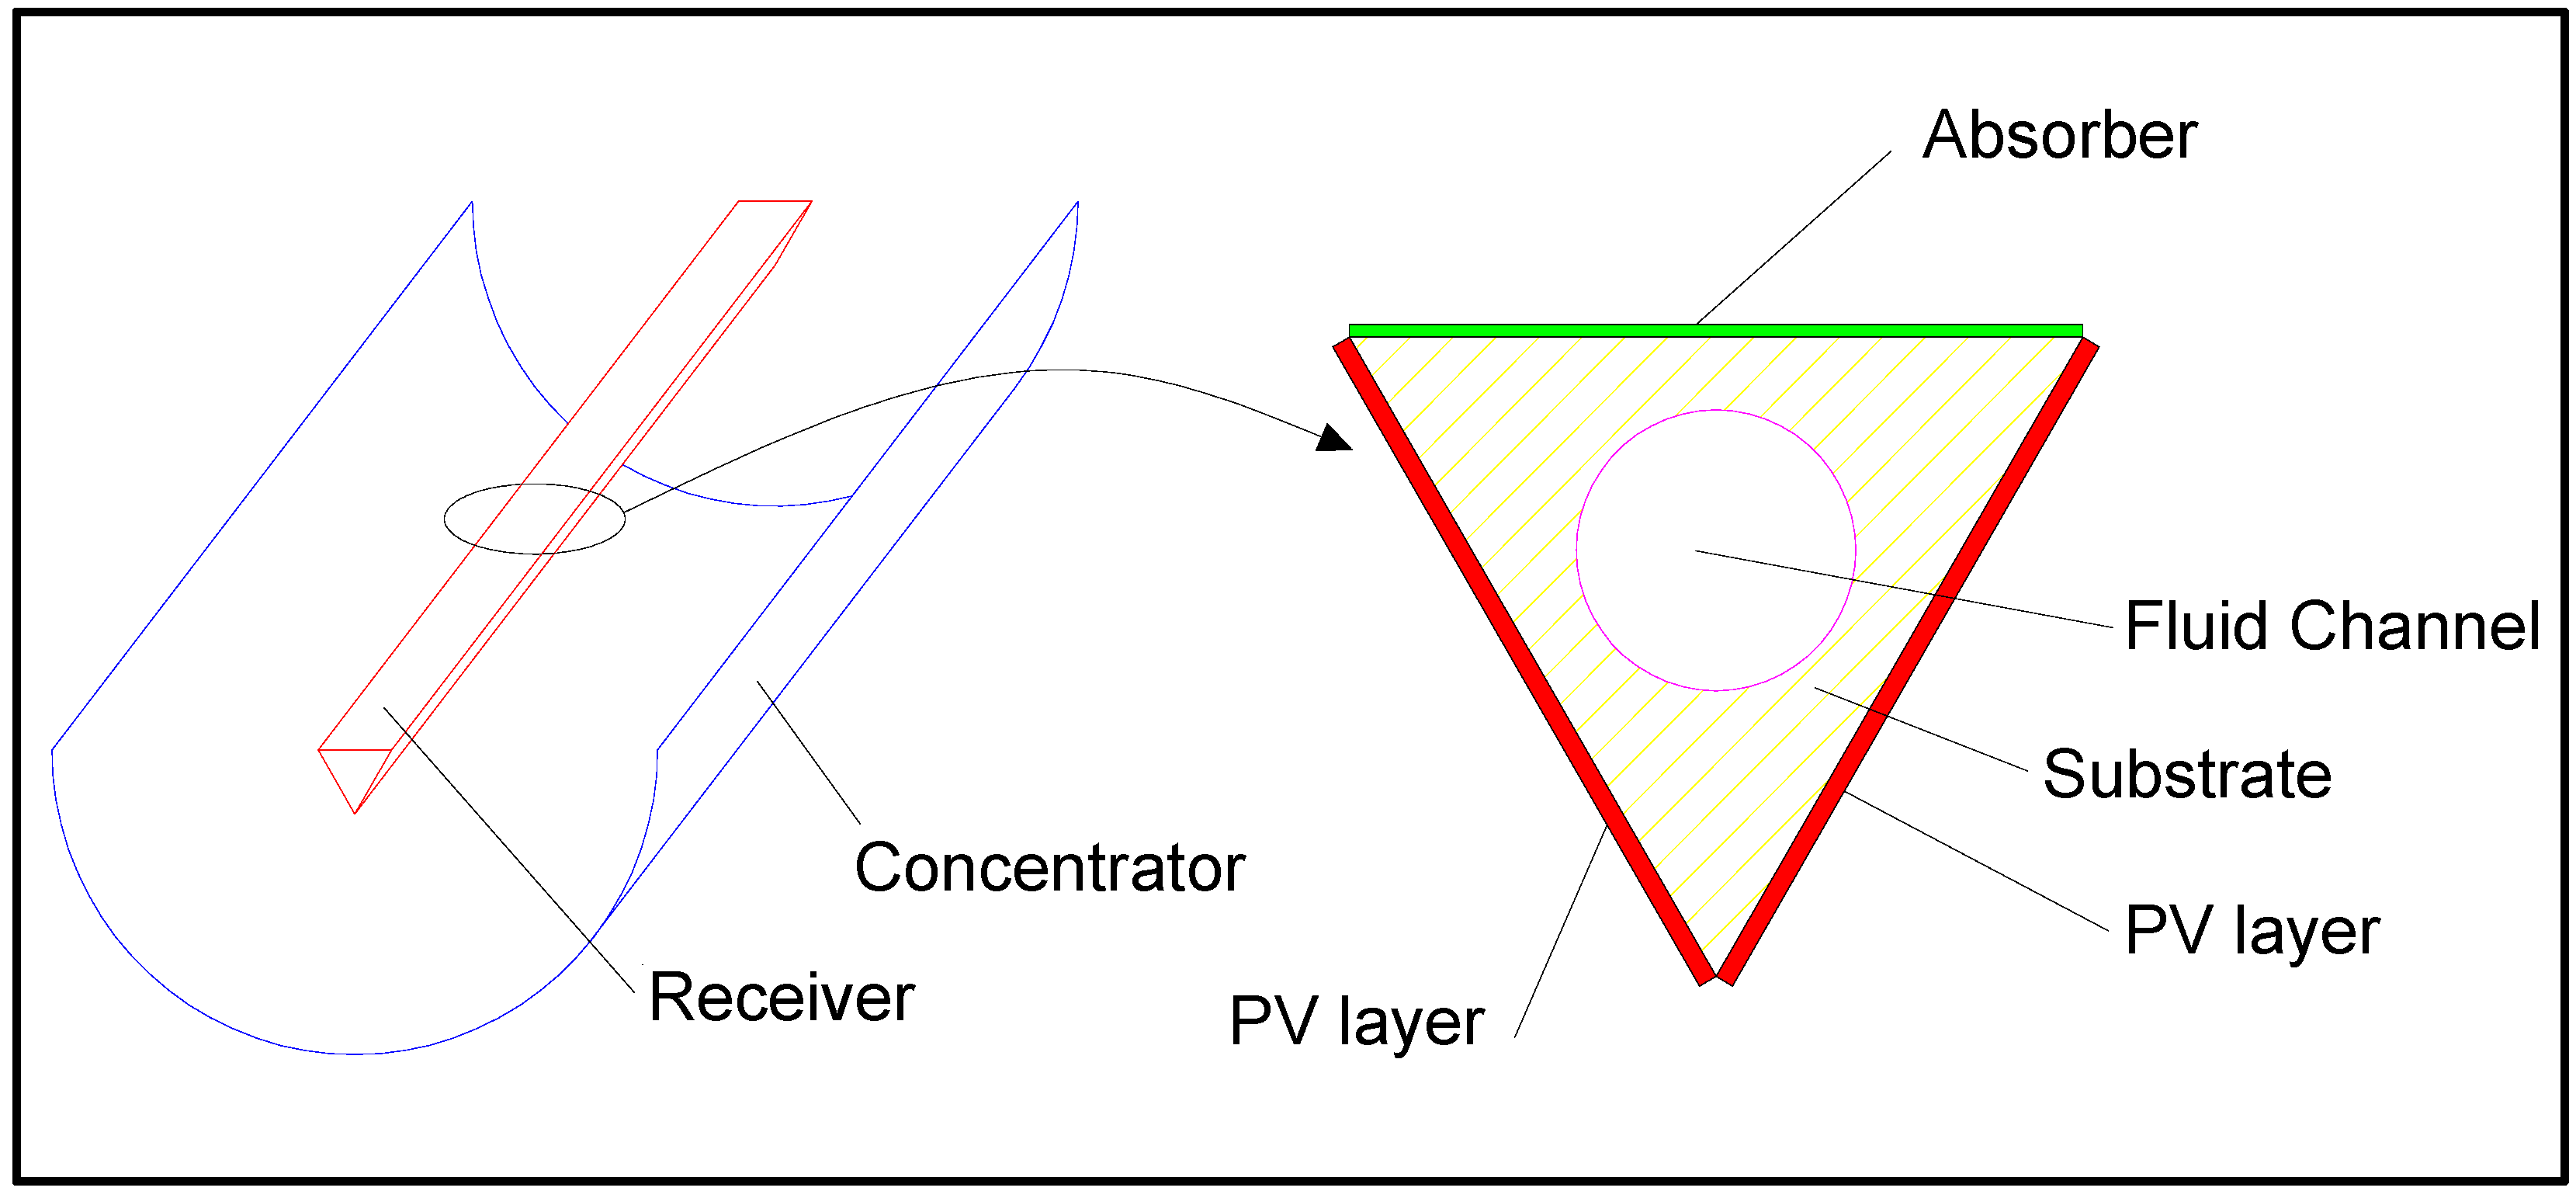
28]. The CPVT (
Figure 1) consists of a parabolic trough concentrator and a one-axis tracking system that uses the same operating principle of solar thermal Parabolic Trough Collectors (PTC) [
29,
30,
31]. The collector is placed horizontally and its axis is North-South oriented, whereas the tracking system follows the solar azimuth angle. In solar thermal PTC, an evacuated tube for heating the fluid is installed at the focus of the parabola while in the considered CPVT system the focus of the parabola is equipped with a triangular receiver (
Figure 1). A metallic substrate is used between the circular fluid channel and the external surfaces (PV layer and top surface in
Figure 1) in order to promote conductive heat transfer.
The two sides of the triangle facing the parabolic concentrator are equipped with triple-junction PV layers, whereas the top side of the receiver is equipped with a thermal absorber. The triangular receiver includes an inner channel trough where the fluid to be heated flows. Therefore, the solar irradiation collected is converted simultaneously into electricity by the PV layer and into thermal energy by the heated fluid. Note also that the top side of the triangular receiver is able to absorb both beam and diffuse radiation, whereas PV layers can only convert the concentrated beam radiation. In summary, the system considered in this work is basically the same as the one shown in references [
24,
28] with two main differences: (i) there is no covering glass; (ii) the PV layer is based on InGaP/InGaAs/Ge triple-junction solar cells [
15]. These two modifications increase significantly the electrical efficiency of the system with respect to the values reported in [
24,
28]. In fact, the covering glass is used to increase the thermal efficiency of the system, as it reduces convection and radiation losses. The glass also reduces the radiation incident on the PV layer, causing a possible decrease of the electrical efficiency of the system. However, the triple-junction cells are significantly more efficient than silicon ones and they are also less sensitive to variations of the operating temperature.
Although simplified models for the calculation of CPVT performance have been presented in the available in literature [
32], these cannot be applied to the system under investigation due to the use of concentrating systems and triple junction cells. For this reason, an appropriate model, based on energy balances, has been developed in order to design and simulate the CPVT under investigation. It is a 0-D model since the final scope of this work is to create a new type to be integrated in TRNSYS environment. Therefore, the model should be sufficiently fast in order to be used in a quasi-stationary yearly simulation. Higher dimensional models for heat exchangers can be expensive from a computational point of view and reduction models have been successfully used for their simulation in renewable energy systems [
33]. However, these models have been still considered too computational-intensive for the scope of this work.
The general assumptions adopted for the model are: thermodynamic equilibrium, steady state, negligible kinetic and gravitational terms in the energy balances, radiation uniformly concentrated along PV area. In addition the negligible temperature gradients in the PV film and in the substrate are assumed due to small thickness of the PV layer and the high conductivity in the metal substrate. In other words, PV and substrate temperature are assumed uniform.
The system is assumed to operate below 100 °C, since it is safer for the reliability of PV cells, although the system can theoretically operate up to 240 °C [
14]. In this case, the CPVT could drive a double effect Absorption Chiller (ACH), significantly increasing the overall efficiency of the system. However, this possibility must still be explored by experimental tests. Water was assumed as cooling fluid. Nevertheless, several types of cooling fluids can be considered in the model. The thermodynamic and thermo-physical properties of the fluids, namely air and water, were calculated using the appropriate routine included in TRNSYS.
The concentration ratio is defined as the ratio between the area,
APVT, the two PV triangular sides of the receiver, and the aperture area,
Aap, of the concentrator:
The optical efficiency (
ηopt) of the concentrator is assumed being constant [
14]. Therefore, the radiation indent on the PV surface is:
As it is commonly done in concentrating systems, in the previous equation only the beam incident radiation (
Ib) is considered. Such radiation is corrected considering both the optical efficiency of the receiver and the Incidence Angle Modifier (IAM) [
34], that takes in to account the radiation decreases when the angle of incidence increases. The IAM, related to the thermal production is evaluated on the basis of the data experimentally calculated by Bernardo
et al. [
24,
28]:
Simultaneously, additional thermal energy is absorbed by the top thermal absorber:
In this case, the top surface area, Atop, can convert both beam and diffuse radiation, i.e. the total radiation (Itot) as the insolation incident on that surface is not concentrated.
Assuming the top surface area as gray surface and considering that the area of the top surface is much smaller than the one of the sky, the radiative heat transfer between the top absorber and the sky can be calculated as follows [
34]:
Here, the sky equivalent temperature (Tsky) is calculated using the TRNSYS routine. Ttop is the temperature of the top surface.
Similarly, assuming the area of the concentrator much bigger than the one of the PVT receiver and assuming both PVT and concentrator as gray surfaces, the radiative heat transfer between the PVT and the concentrator [
34]:
where
TPVT and
Tconc are respectively PVT and concentrator surfaces temperatures.
The convective heat transfer between the PVT and the air is calculated as follows [
35]:
The convective heat transfer coefficient,
hc,PVT, is calculated taking into account that the wind velocity is typically around 4–5 m/s. Therefore, the convection mechanism is definitively a forced convection. The corresponding heat transfer coefficient is calculated using the following correlation, relating the Nusselt, Reynolds and Prandtl numbers [
35]:
In this equation the characteristic length is the length of the surface in the wind direction, assumed parallel to the CPVT longitudinal axis,
i.e.,
Ltube. The same correlation is used to calculate the heat transfer coefficient for the forced convection between the top absorber and the air,
hc,top. The corresponding heat flow is [
35]:
The gross electrical power produced by the PV layer is:
Note that this energy is calculated considering the concentrated beam radiation incident on the PV layer (corrected by the concentrator optical efficiency and by the IAM coefficient), corrected by the electrical efficiency of the PV,
ηPV. The electrical efficiency of the triple-junction PV (
ηPV) is experimentally related to the concentration ratio and to the temperature [
14]:
Note that this equation returns ultra-high values of electrical efficiency, also approaching 40%, as usual in III-V PV cells. The
IAMel is also evaluated on the basis of the experimental data provided by Bernardo
et al. [
24,
28]:
The net power produced by the system is reduced of the amount of electricity lost in the module connections and in the inverter, considering the corresponding efficiencies (
ηmod and
ηinv) [
14]:
Finally, the heat absorbed by the cooling fluid is:
In the previous equation, the enthalpies of the inlet and outlet cooling fluid (hin and hout) are calculated by the thermo-physical property subroutine discussed above.
Therefore, the overall energy balance on a control volume that included the entire triangular receiver is:
Among the terms on the right hand side, the first one is the useful thermal energy, the second one is the electrical power produced and all the remaining terms are losses. As discussed in the following section, this energy balance is dominated by the radiative terms, as the convection losses are low due to the small receiver area, typical of concentrating solar collectors.
A second energy balance considers the control volume that includes the metallic substrate and the fluid channel. In this study, this control volume can be considered as a heat exchanger. In particular, it is here assumed that the temperature of the metallic substrate is homogeneous along both radial and circumferential directions. In this case, the primary side of the heat exchanger is at constant temperature equal to the temperature of the metallic substrate. This assumption can be considered acceptable as a consequence of the high thermal conductivity of the metallic substrate [
14,
18,
19,
24,
28] and allows one to develop a 0-D model of the CPVT. According to the 0-D approach here implemented, the performance of the heat exchanger can be calculated using the well-known -NTU technique [
36]. For the case under consideration, the NTU number is:
The heat exchange area,
AHEX, is the lateral area of the fluid channel. The thermal resistance of the metallic substrate,
rsub, is typically orders of magnitude lower than the one of the fluid. The fluid heat transfer coefficient,
hfluid, is calculated using the following correlation [
35]:
Finally, the heat transfer effectiveness is [
36]:
The energy balance for the considered heat exchanger is:
where
Tsub is the temperature of the metallic substrate.
For the given boundary conditions (inlet temperature and mass flow rate, beam and total radiations and relative angle of incidence, environment and sky temperature, ambient pressure and wind velocity), the unknowns are five, namely: PVT temperature, substrate temperature, fluid outlet temperature, temperature of top receiver surface (facing the sky) and temperature of the concentrator. Therefore, three more equations, in addition to Equations (15) and (19), must be considered.
The third of the required five equations is derived from an energy balance on a control volume including the PVT layer, and the metallic substrate:
In other words, the previous equation shows that the conductive thermal flow coming from the PVT layer is partially used to increase the outlet temperature of the cooling fluid and partially it is conductively exchanged with the top side of the triangular receiver. Note that the top thermal resistance, rtop, is the conductive resistance calculated considering both the metallic substrate and the top absorbing surface included between the fluid channel and the top surface.
A fourth energy balance can be considered with respect to the control volume that includes the top side of the substrate and the top surface of the triangular receiver:
Finally, the last energy balance considers the control volume that includes only the parabolic concentrator:
In this case, the left side of the energy balance includes the radiative heat transfer between the concentrator and the PVT and the radiative energy absorbed by the concentrator surface. Conversely, the terms at the right hand side of the equations are respectively: the radiative heat transfer of the back surface (external side of the parabola) of the concentrator, the convective losses at the front surface (facing the sun) of the concentrator, and the convective heat loss at the back surface.
Equations (15) and (19–22) represent a system of five equations in the above mentioned five unknowns. This system of equations is highly non-linear as a consequence of the radiative terms included in the energy balances and of the correlations for the calculations of heat transfer coefficients. This system must be solved by conventional numerical iterative techniques.
The model discussed above is based on the assumption of steady state. However, this assumption can be easily removed, simply adding the capacitive terms in the five energy balances described above. In that case, the algebraic system of equations turns in a system of differential equations that can be easily solved using the tool included in TRNSYS package.
The overall performance of the CPVT is often evaluated using the well-known thermal and electrical efficiencies, which are conventionally related to the incident beam radiation and to the collector aperture area:
CPVT design parameters are reported in
Table 1 [
14,
18,
19,
24,
28]. For the design parameters assumed in this table, the concentration ratio is 10.
A rigorous validation of the simulation model presented in this paper is not possible since this analysis is based on a design idea of a theoretical CPVT, which has never been manufactured. Therefore, no experimental data is available for validation of the model presented in this paper. However, in order to prove the reliability of the model presented in this section, the results were compared with the ones available in literature for a similar CPVT [
24], using the following procedure. First, the above discussed model was slightly modified in order to consider the use of silicon cells, using the efficiency curve provided in [
24]. Second, the model was slightly modified by adding an additional thermal resistance and the glass transparency coefficient, in order to consider the effect of the covering glass. Third, the geometrical parameters were modified according to the data provided [
10,
24,
28]. Finally, the model was calibrated using the experimental data included in [
24]. This modified model was employed in order to calculate the thermal efficiency of the CPVT. Results show that the present model can calculate this parameter with acceptable errors (
Table 2).
Table 1.
CPVT design parameters.
Table 1.
CPVT design parameters.
| Parameter | Symbol | Value | Unit |
|---|
| CPVT aperture area | Aap | 12 | m2 |
| Top absorber area | Atop | 0.60 | m2 |
| PV layer area | APVT | 0.12 | m2 |
| Fluid channel diameter | d | 0.03 | m |
| Fluid specific heat | cf | 4.1877 | kJ/kg K |
| Rated fluid flow rate | mf | 0.15 | kg/s |
| Top surface absorptance | αtop | 0.90 | |
| Concentrator absorptance | αconc | 0.03 | |
| Back surface concentrator emissivity | εconc | 0.30 | |
| Top surface emissivity | εtop | 0.20 | |
| PV reflectance | ρPVT | 0.03 | |
| PV emissivity | εPVT | 0.20 | |
| IAM electrical coefficient | b0el | 0.28 | |
| IAM thermal coefficient | b0th | 0.14 | |
Table 2.
Model validation.
Table 2.
Model validation.
| Δt/Ib | ηCPVT,th [24] | ηCPVT,th | error |
|---|
| Km2/W | % | % | % |
|---|
| 0.01 | 43.1% | 45.2% | 4.8% |
| 0.02 | 41.2% | 42.9% | 4.2% |
| 0.03 | 39.3% | 40.7% | 3.5% |
| 0.04 | 37.4% | 36.5% | −2.5% |
| 0.045 | 36.5% | 35.3% | −3.2% |
3. Results and Discussion
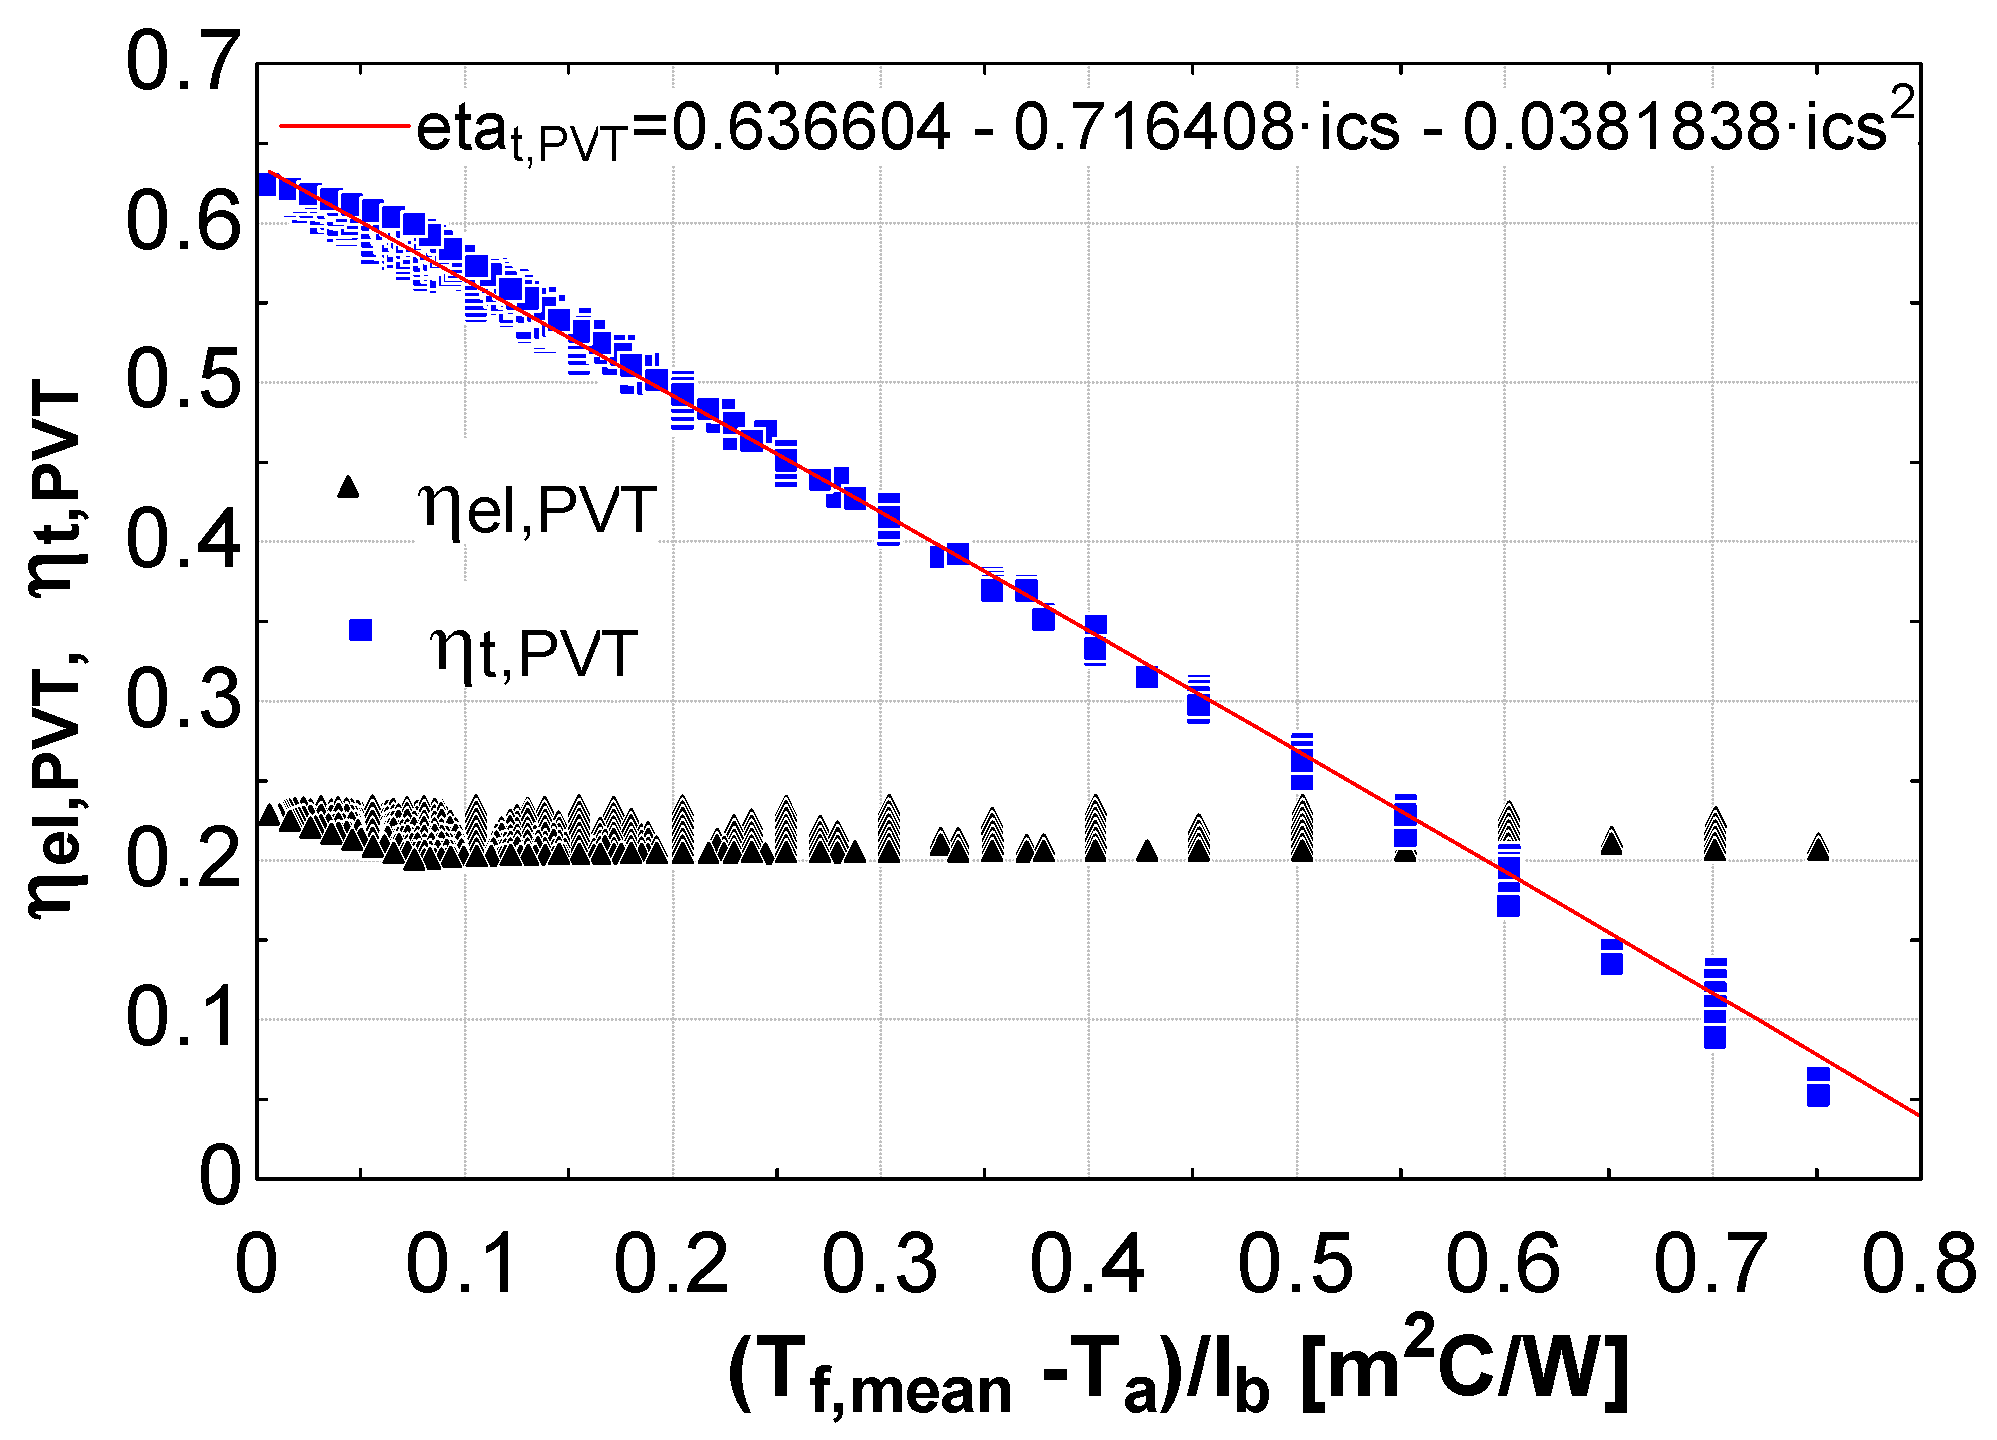
On the basis of the CPVT model discussed in the previous section, electrical and thermal efficiencies were analyzed as a function of the parameter shown below [
34]:
The result of this analysis is shown in
Figure 2. Here, it is clearly shown that the correlation between the thermal efficiency and the above mentioned parameter is very good. In fact, the value of the correlation index is very high, even using a linear interpolating curve. However, it is also clear that the markers are not perfectly aligned on the interpolating curve. In fact, the thermal efficiency curve of a solar thermal collector is a second-order polynomial when constant heat transfer coefficients are considered [
34]. Therefore, the deviation of the performance calculated by the model discussed in the previous section and the interpolating curve is basically due to the fact that, in the proposed model, the overall heat transfer coefficients are not constant and vary with the CPVT operating conditions.
Figure 2.
CPVT electrical and thermal efficiency.
Figure 2.
CPVT electrical and thermal efficiency.
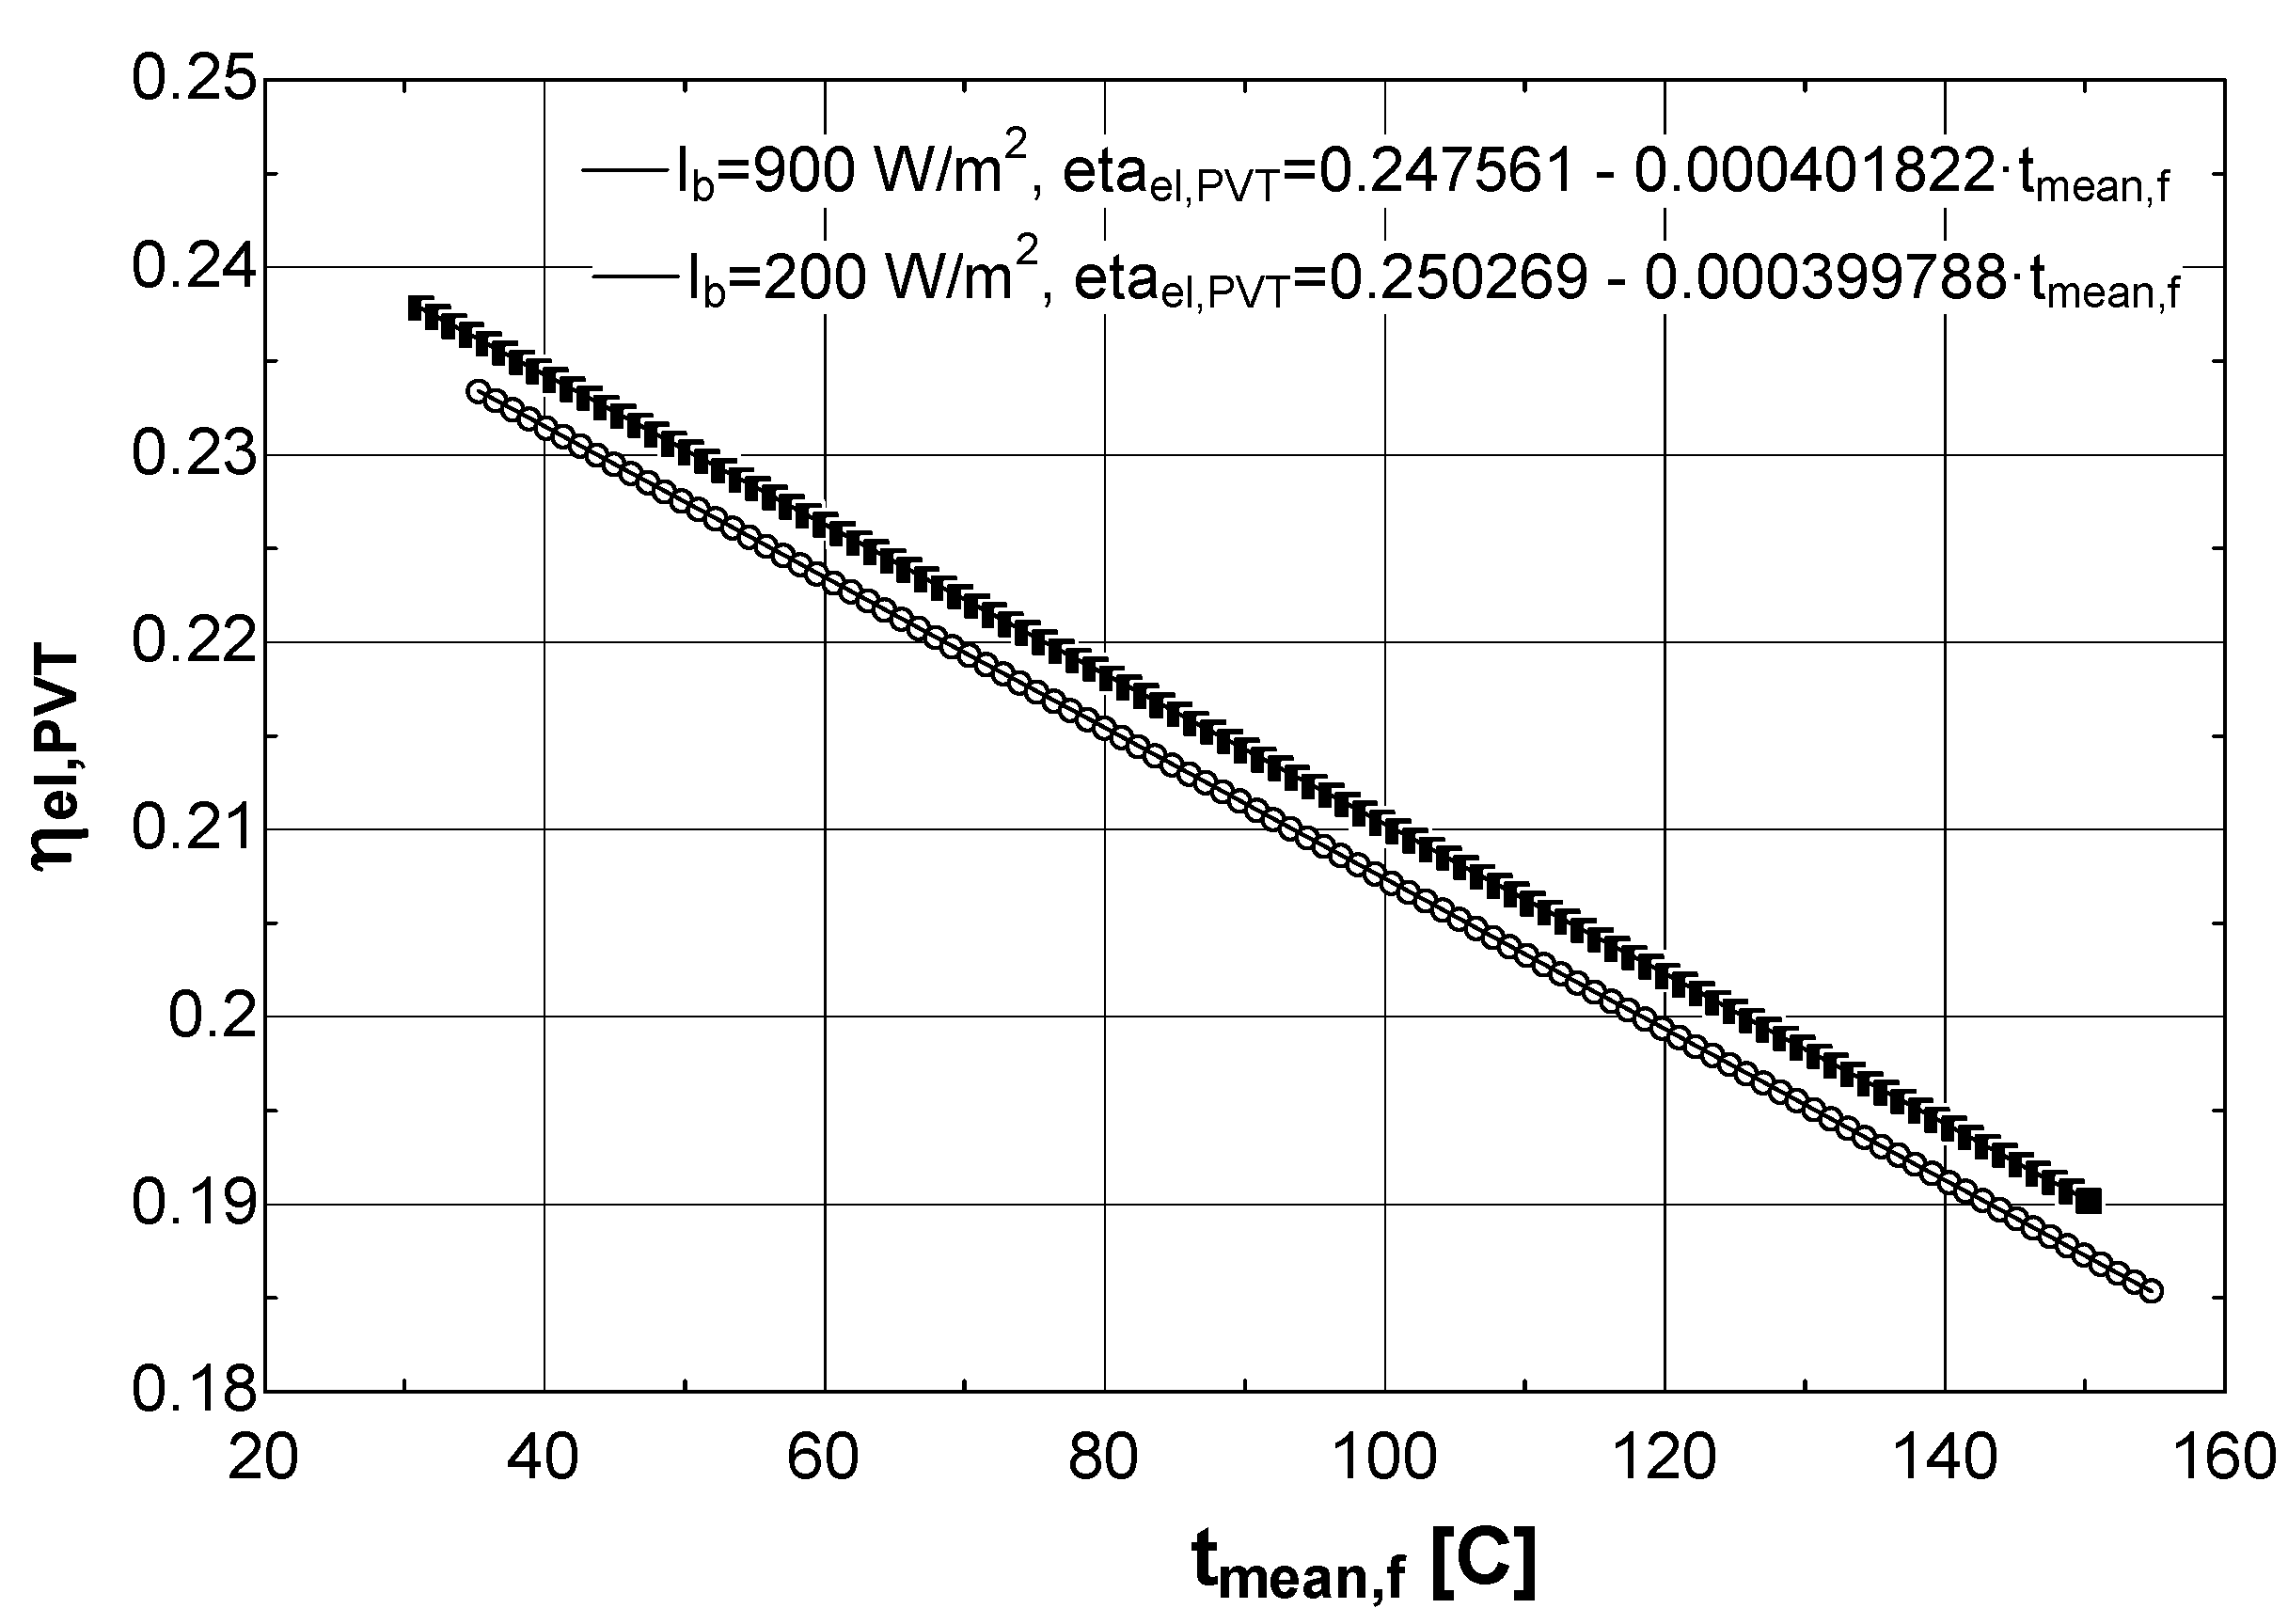
Conversely, there is not a good correlation between the electrical efficiency and the parameter shown in Equation (25). In fact, the electrical efficiency of the CPVT basically depends on the operating temperature of the PV layer and on the concentration ratio, as shown in Equation (11). In the case of the electrical efficiency it is common to show this parameter as a function of fluid average temperature [
20,
24,
28]. This graph is shown in
Figure 3, where the linear interpolating curve is also displayed. This figure shows that the electrical efficiency depends linearly on the fluid mean temperature since such temperature directly affects the PV layer temperature. Note also that the electrical efficiency scarcely depends on the incident beam radiation. In fact, a reduction of the beam radiation, for a given fluid average temperature, only determines a slight decrease of PV layer temperature, consequently causing a slight increase in CPVT electrical efficiency. The plots in
Figure 2 and
Figure 3 also show that the efficiency curve of the proposed CPVT is slightly different from the original model of the Bernardo
et al. [
24,
28] due to the use of triple-junction PV and to the absence of the covering glass. As a consequence, optical and electrical efficiencies are higher. In fact, this last efficiency ranges between 20% and 25% for the considered operating conditions. The use of a covering glass reduces the amount of radiation available for both electrical and thermal conversions but also reduce thermal losses. Higher electrical efficiency is often counterbalanced by a lower value of the thermal efficiency. However, thermal performance of the CPVT considered in this work is also very good due to the excellent radiative properties of the considered surfaces. Therefore, it can be concluded that the modifications in the layout of the CPVT considered in this work increase both thermal and electrical efficiency with respect to the values presented by Bernardo
et al. [
24,
28]. Obviously, this increase in efficiency is counterbalanced by a significantly higher capital cost due to the use of triple-junction PV layer. Therefore, the system considered in this work may be considered a suitable option for the next future when the cost of triple-junction PV is expected to dramatically decrease. In the next paragraphs a brief parametric study is performed, with the scope to analyze the thermal and electrical performance of the CPVT under different operating condition and varying some of its main design parameters. The study was performed considering the set of boundary conditions shown in
Table 3.
Figure 3.
CPVT electrical efficiency.
Figure 3.
CPVT electrical efficiency.
Table 3.
CPVT boundary conditions.
Table 3.
CPVT boundary conditions.
| Parameter | Value | Unit | Parameter | Value | Unit |
|---|
| tin | 70 | °C | wa | 5 | m/s |
| tsky | 25 | °C | Itot | 1000 | W/m2 |
| ta | 25 | °C | Ib | 800 | W/m2 |
| pa | 101 | kPa | θ | 0 | deg |
As mentioned, the layout of the system under investigation was derived by some prototypes previously developed and discussed in literature [
10,
20,
24,
28] and has been here modified in order to improve the electrical performance of the system and to achieve a good thermal performance at operating temperatures up to 90–100 °C. To this scope, some of the main geometrical parameters were varied from the initial configuration, in order to assess their impact on the overall performance of the system. First, the axial length (
Ltube) of the CPVT (including the axial lengths of the triangular receiver and of the parabolic concentrator) was varied in very large range.
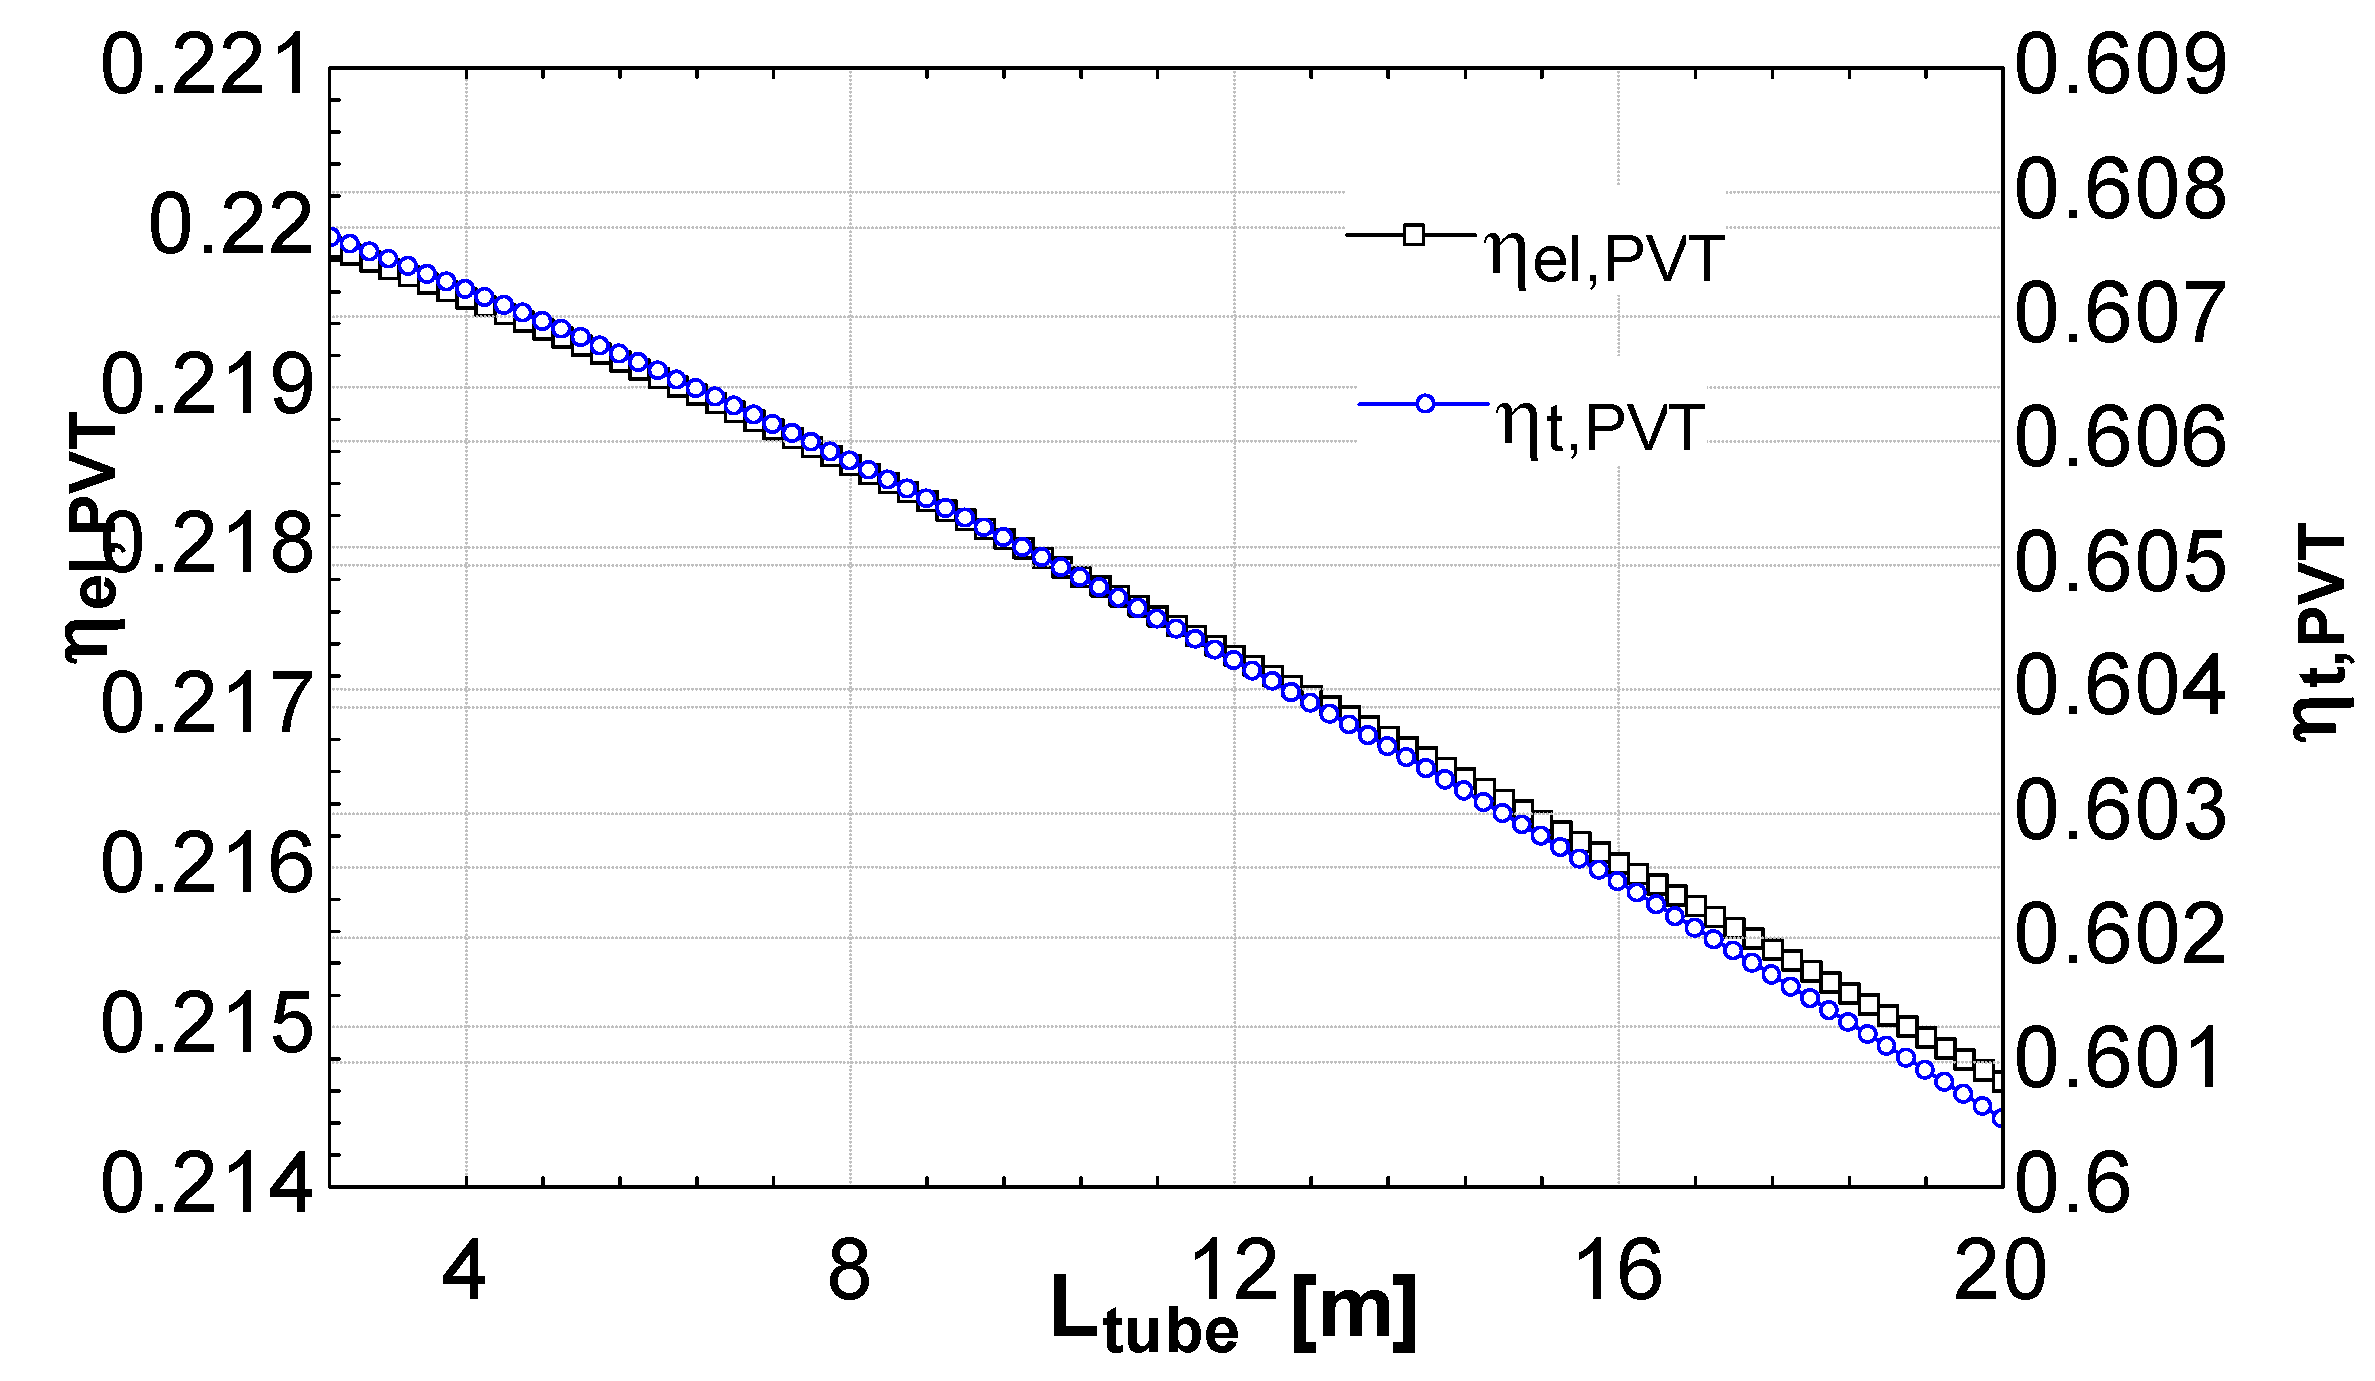
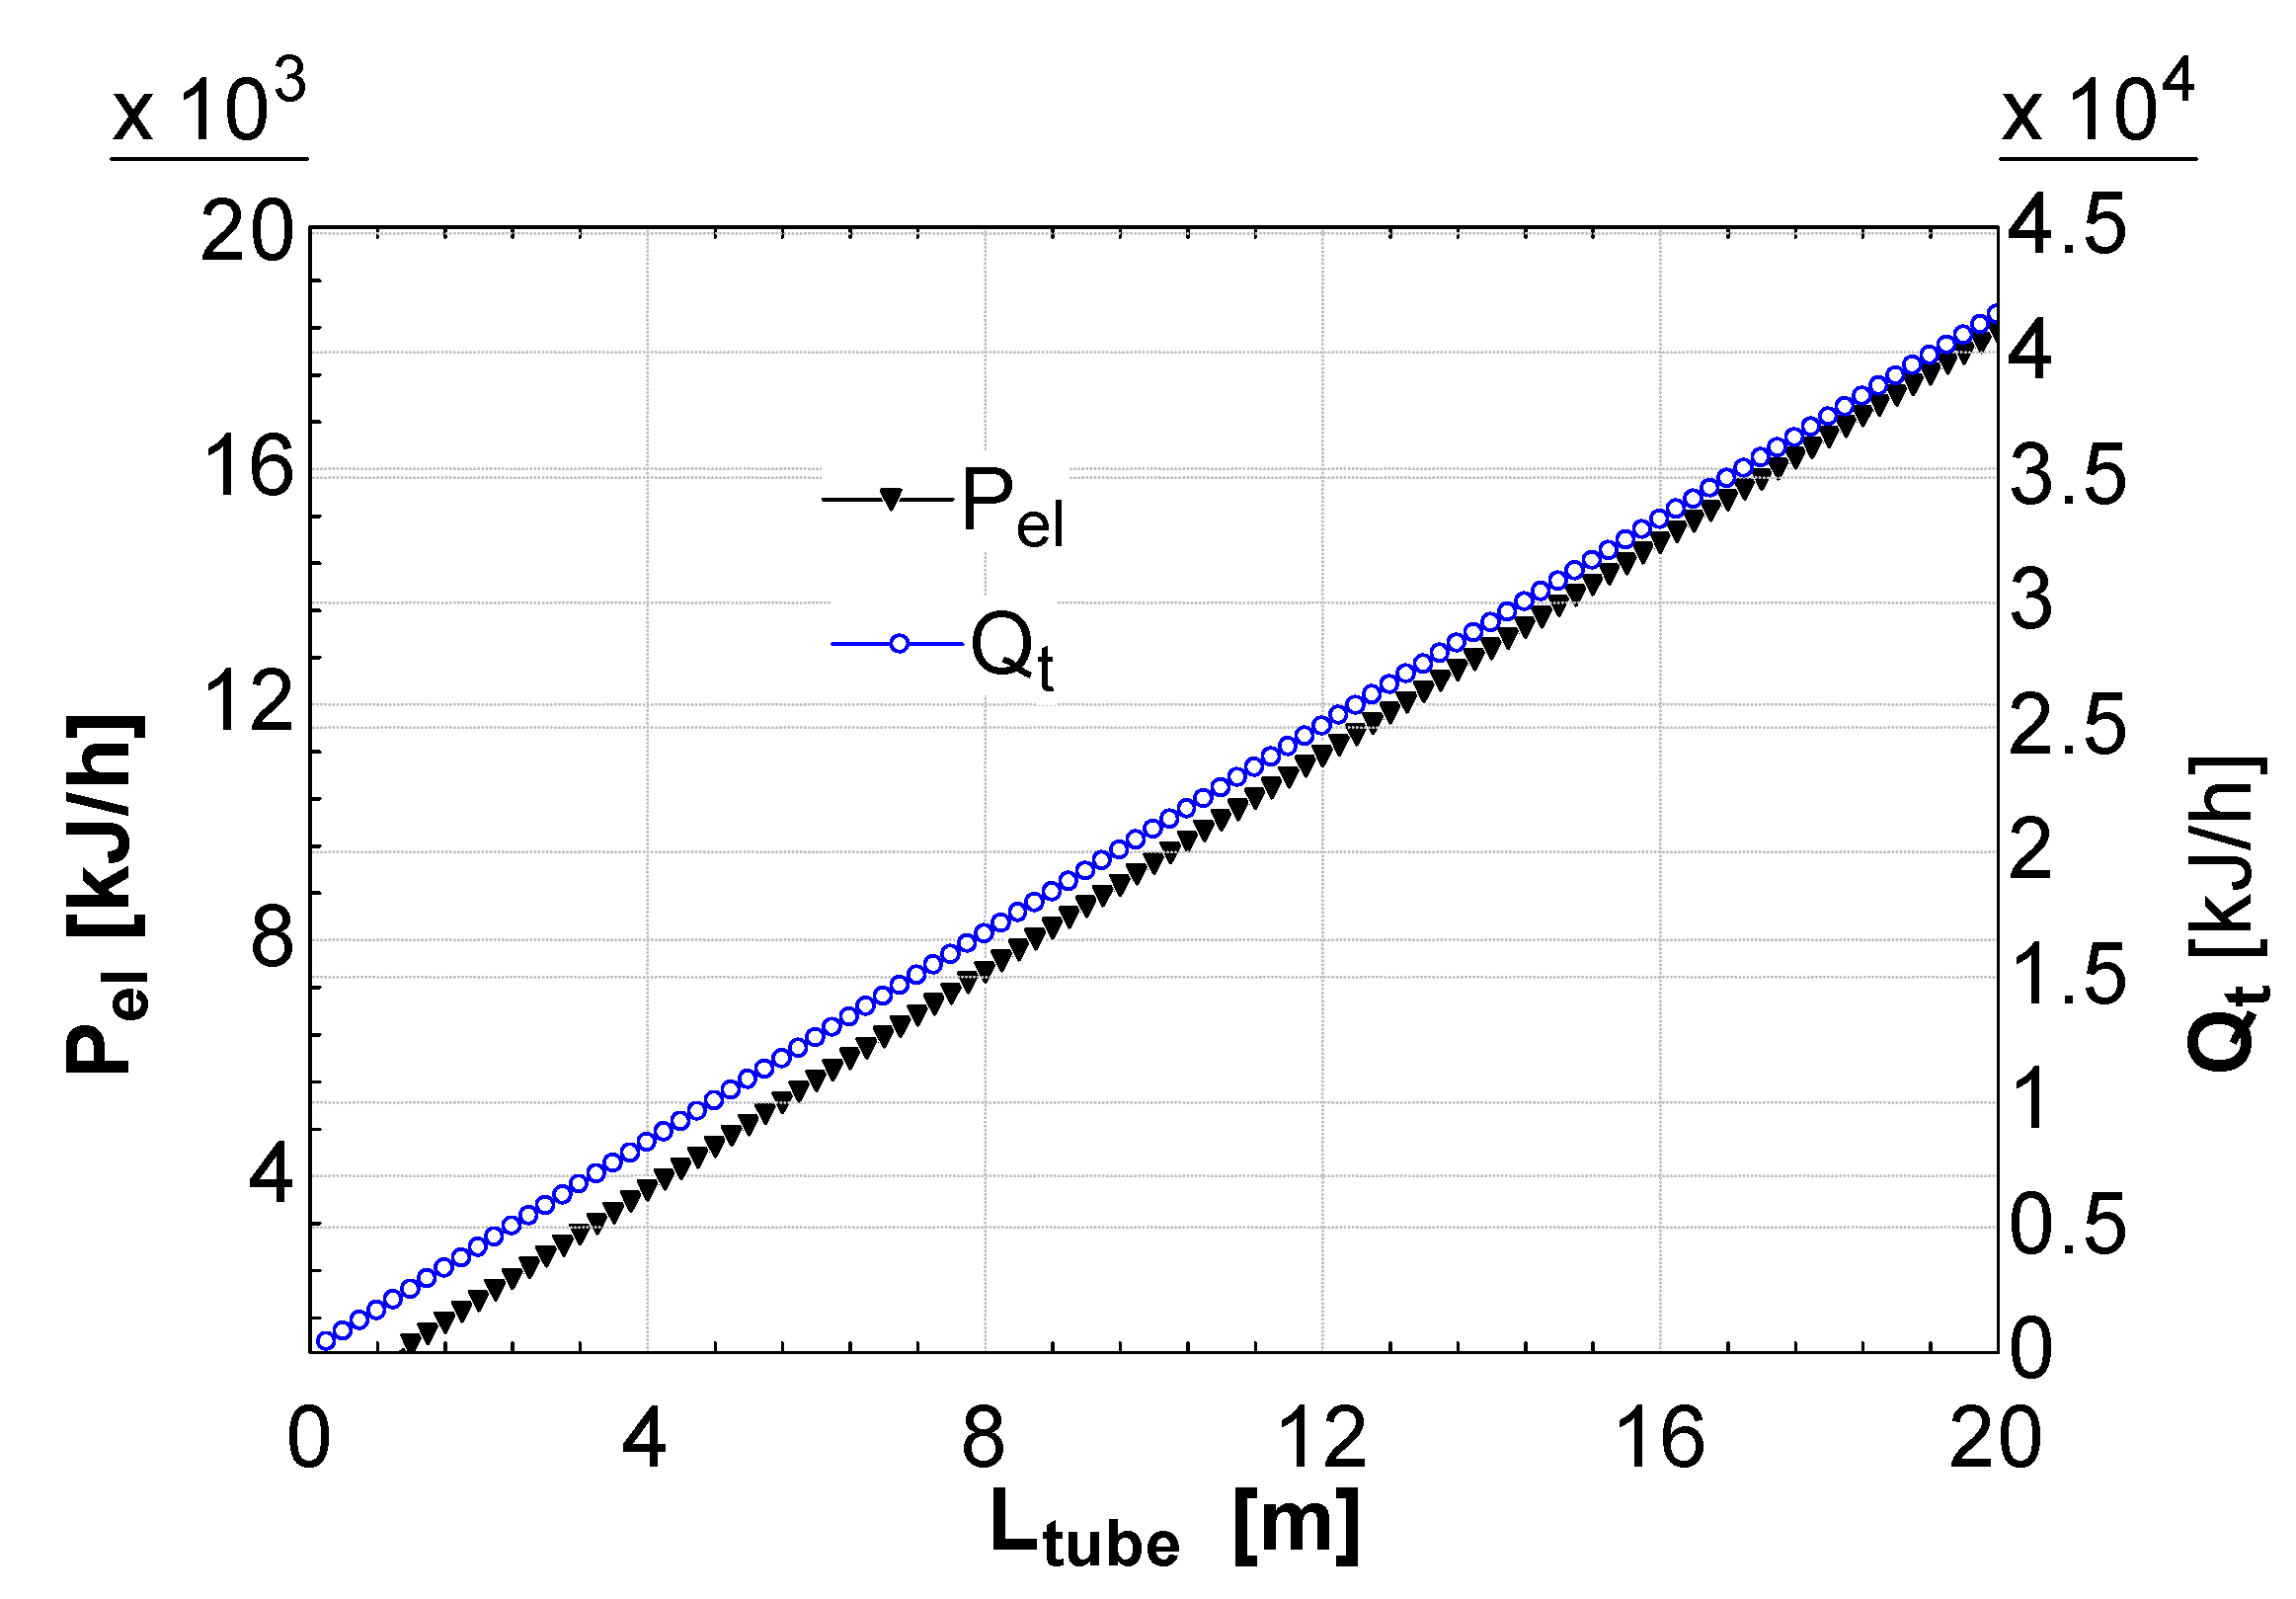
Figure 4 shows both thermal and electrical efficiencies as a function of this parameter. Here, it is clearly displayed that both efficiencies are slightly affected by the increase of CPVT length, showing a decrease for higher CPVT length. However, thermal and electrical efficiencies drops are lower than 1%. Obviously, an increase of CPVT length also determines a proportional increase of CPVT aperture area and of PV layer area. This linear relationship is clearly shown in
Figure 5, where both thermal and electrical powers are plotted as a function of the CPVT length. Note also that the slight decrease of efficiencies shown in
Figure 4 also determines a deviation of the plots of
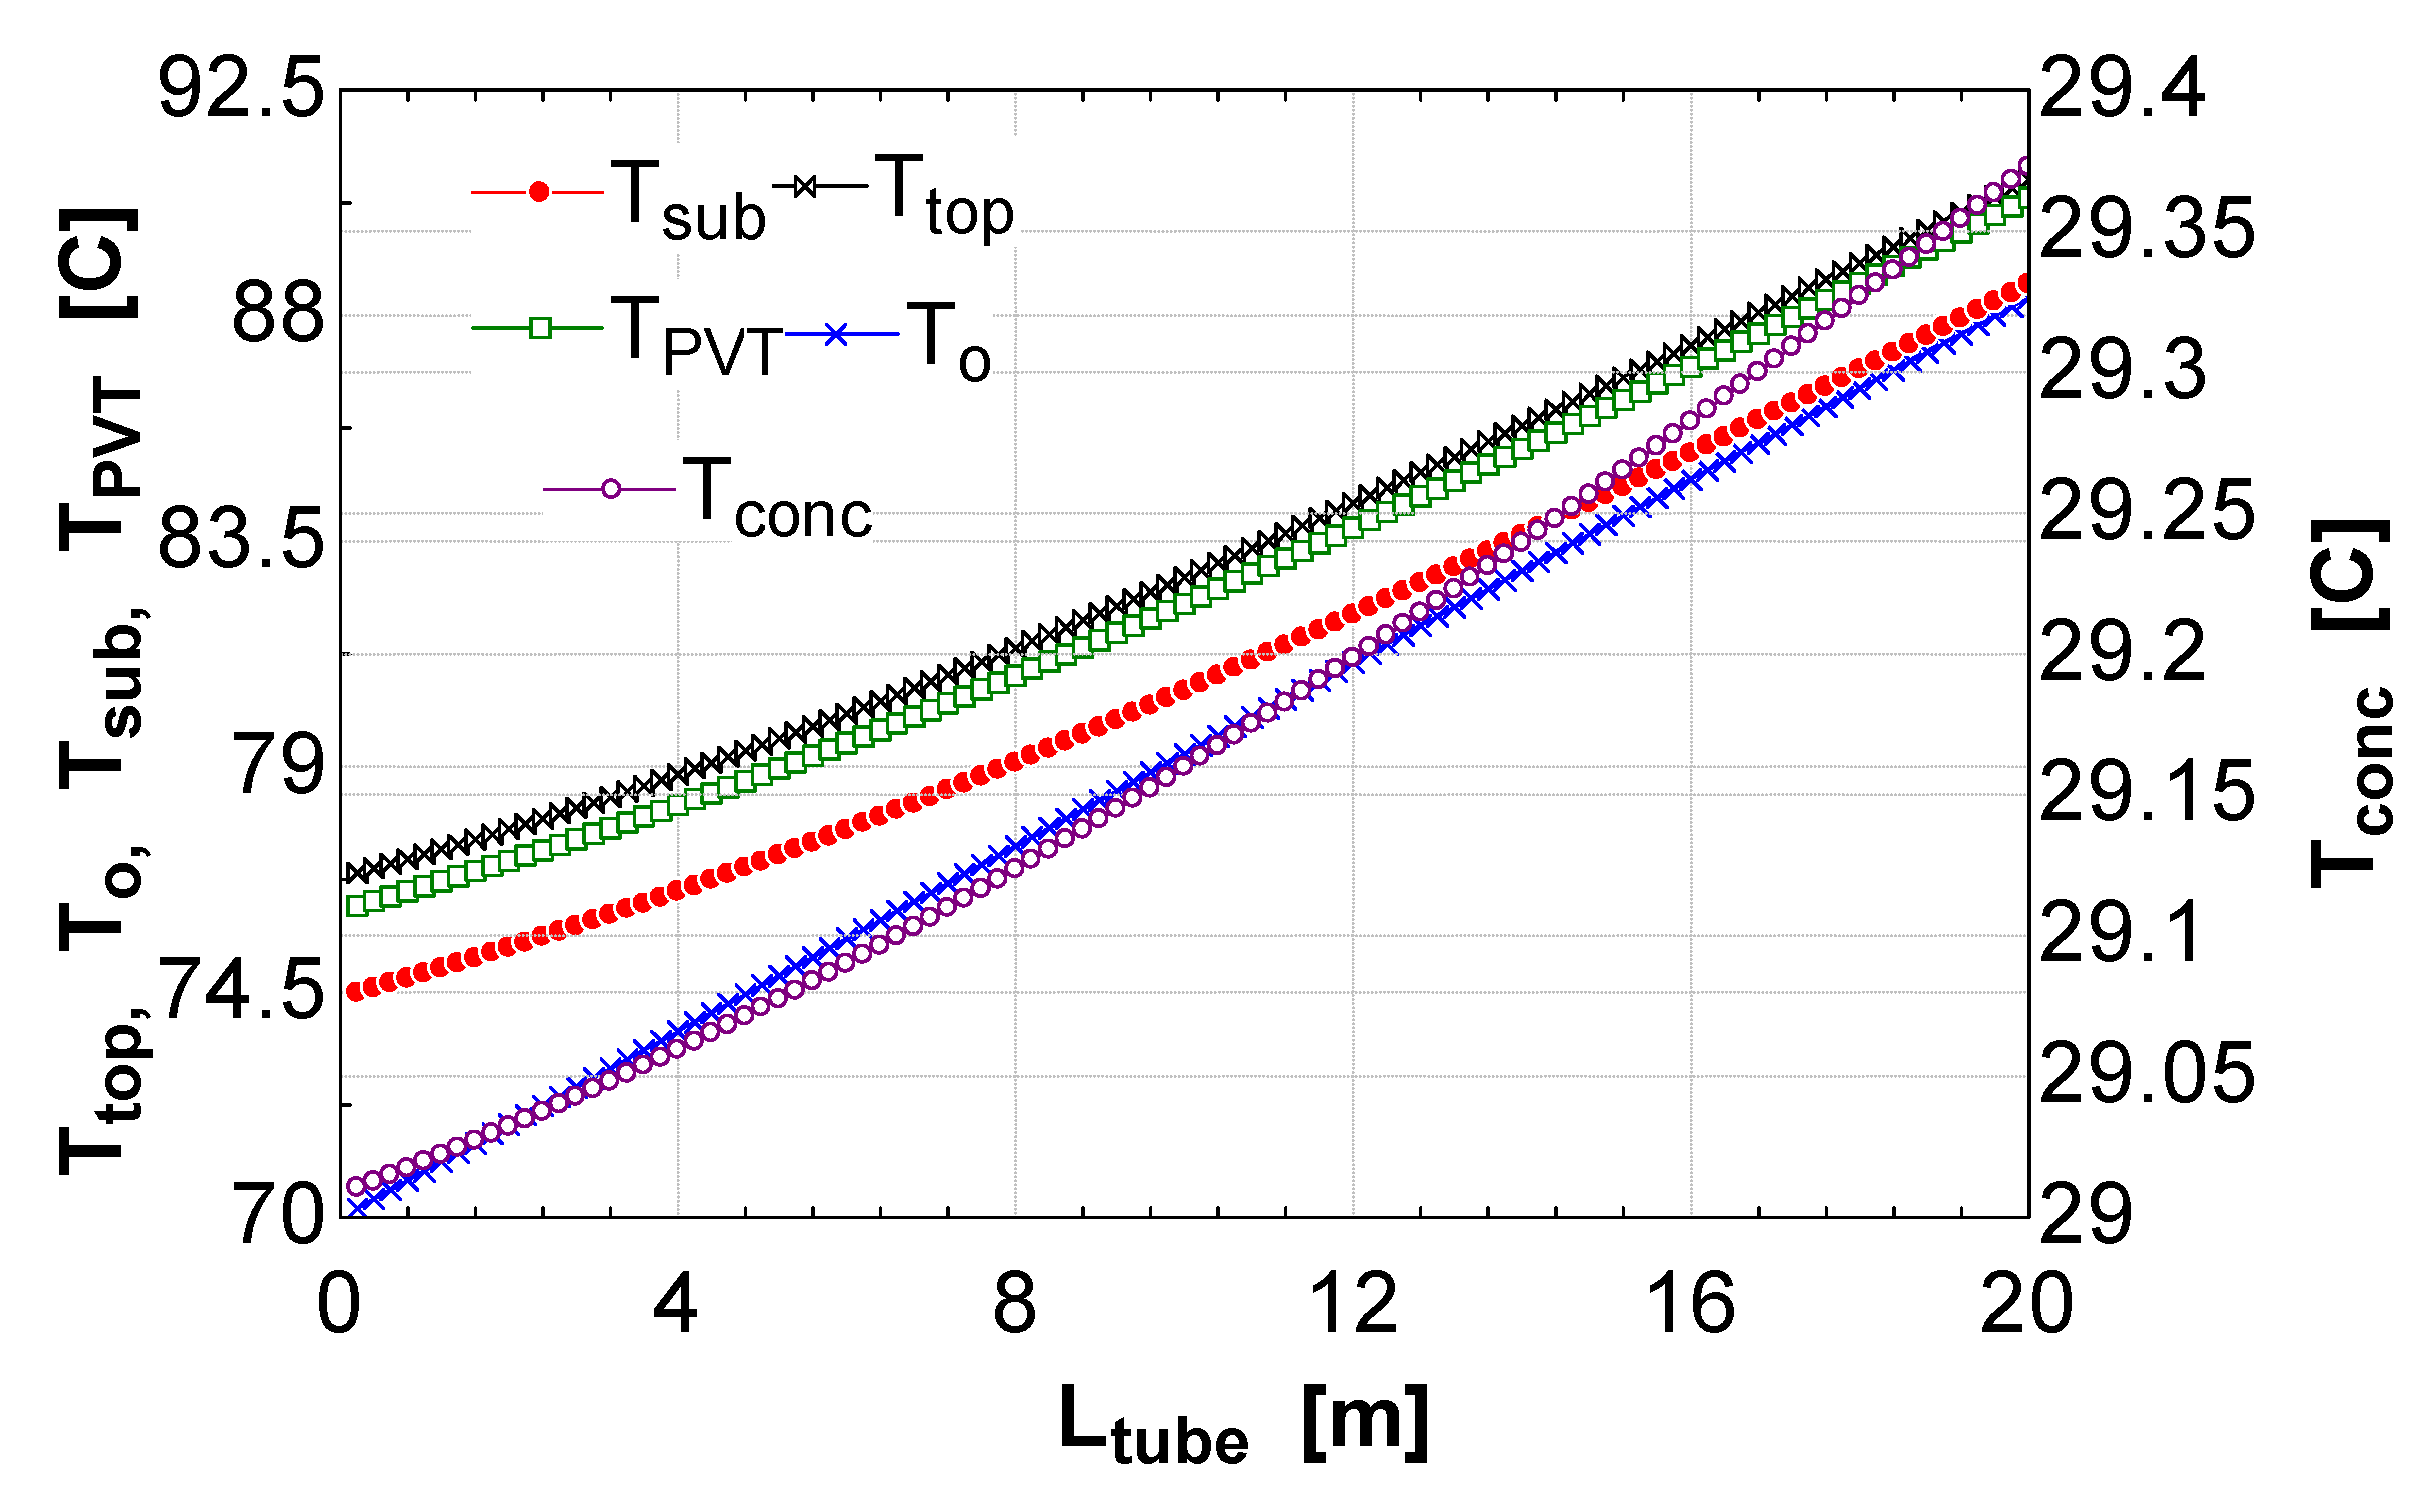
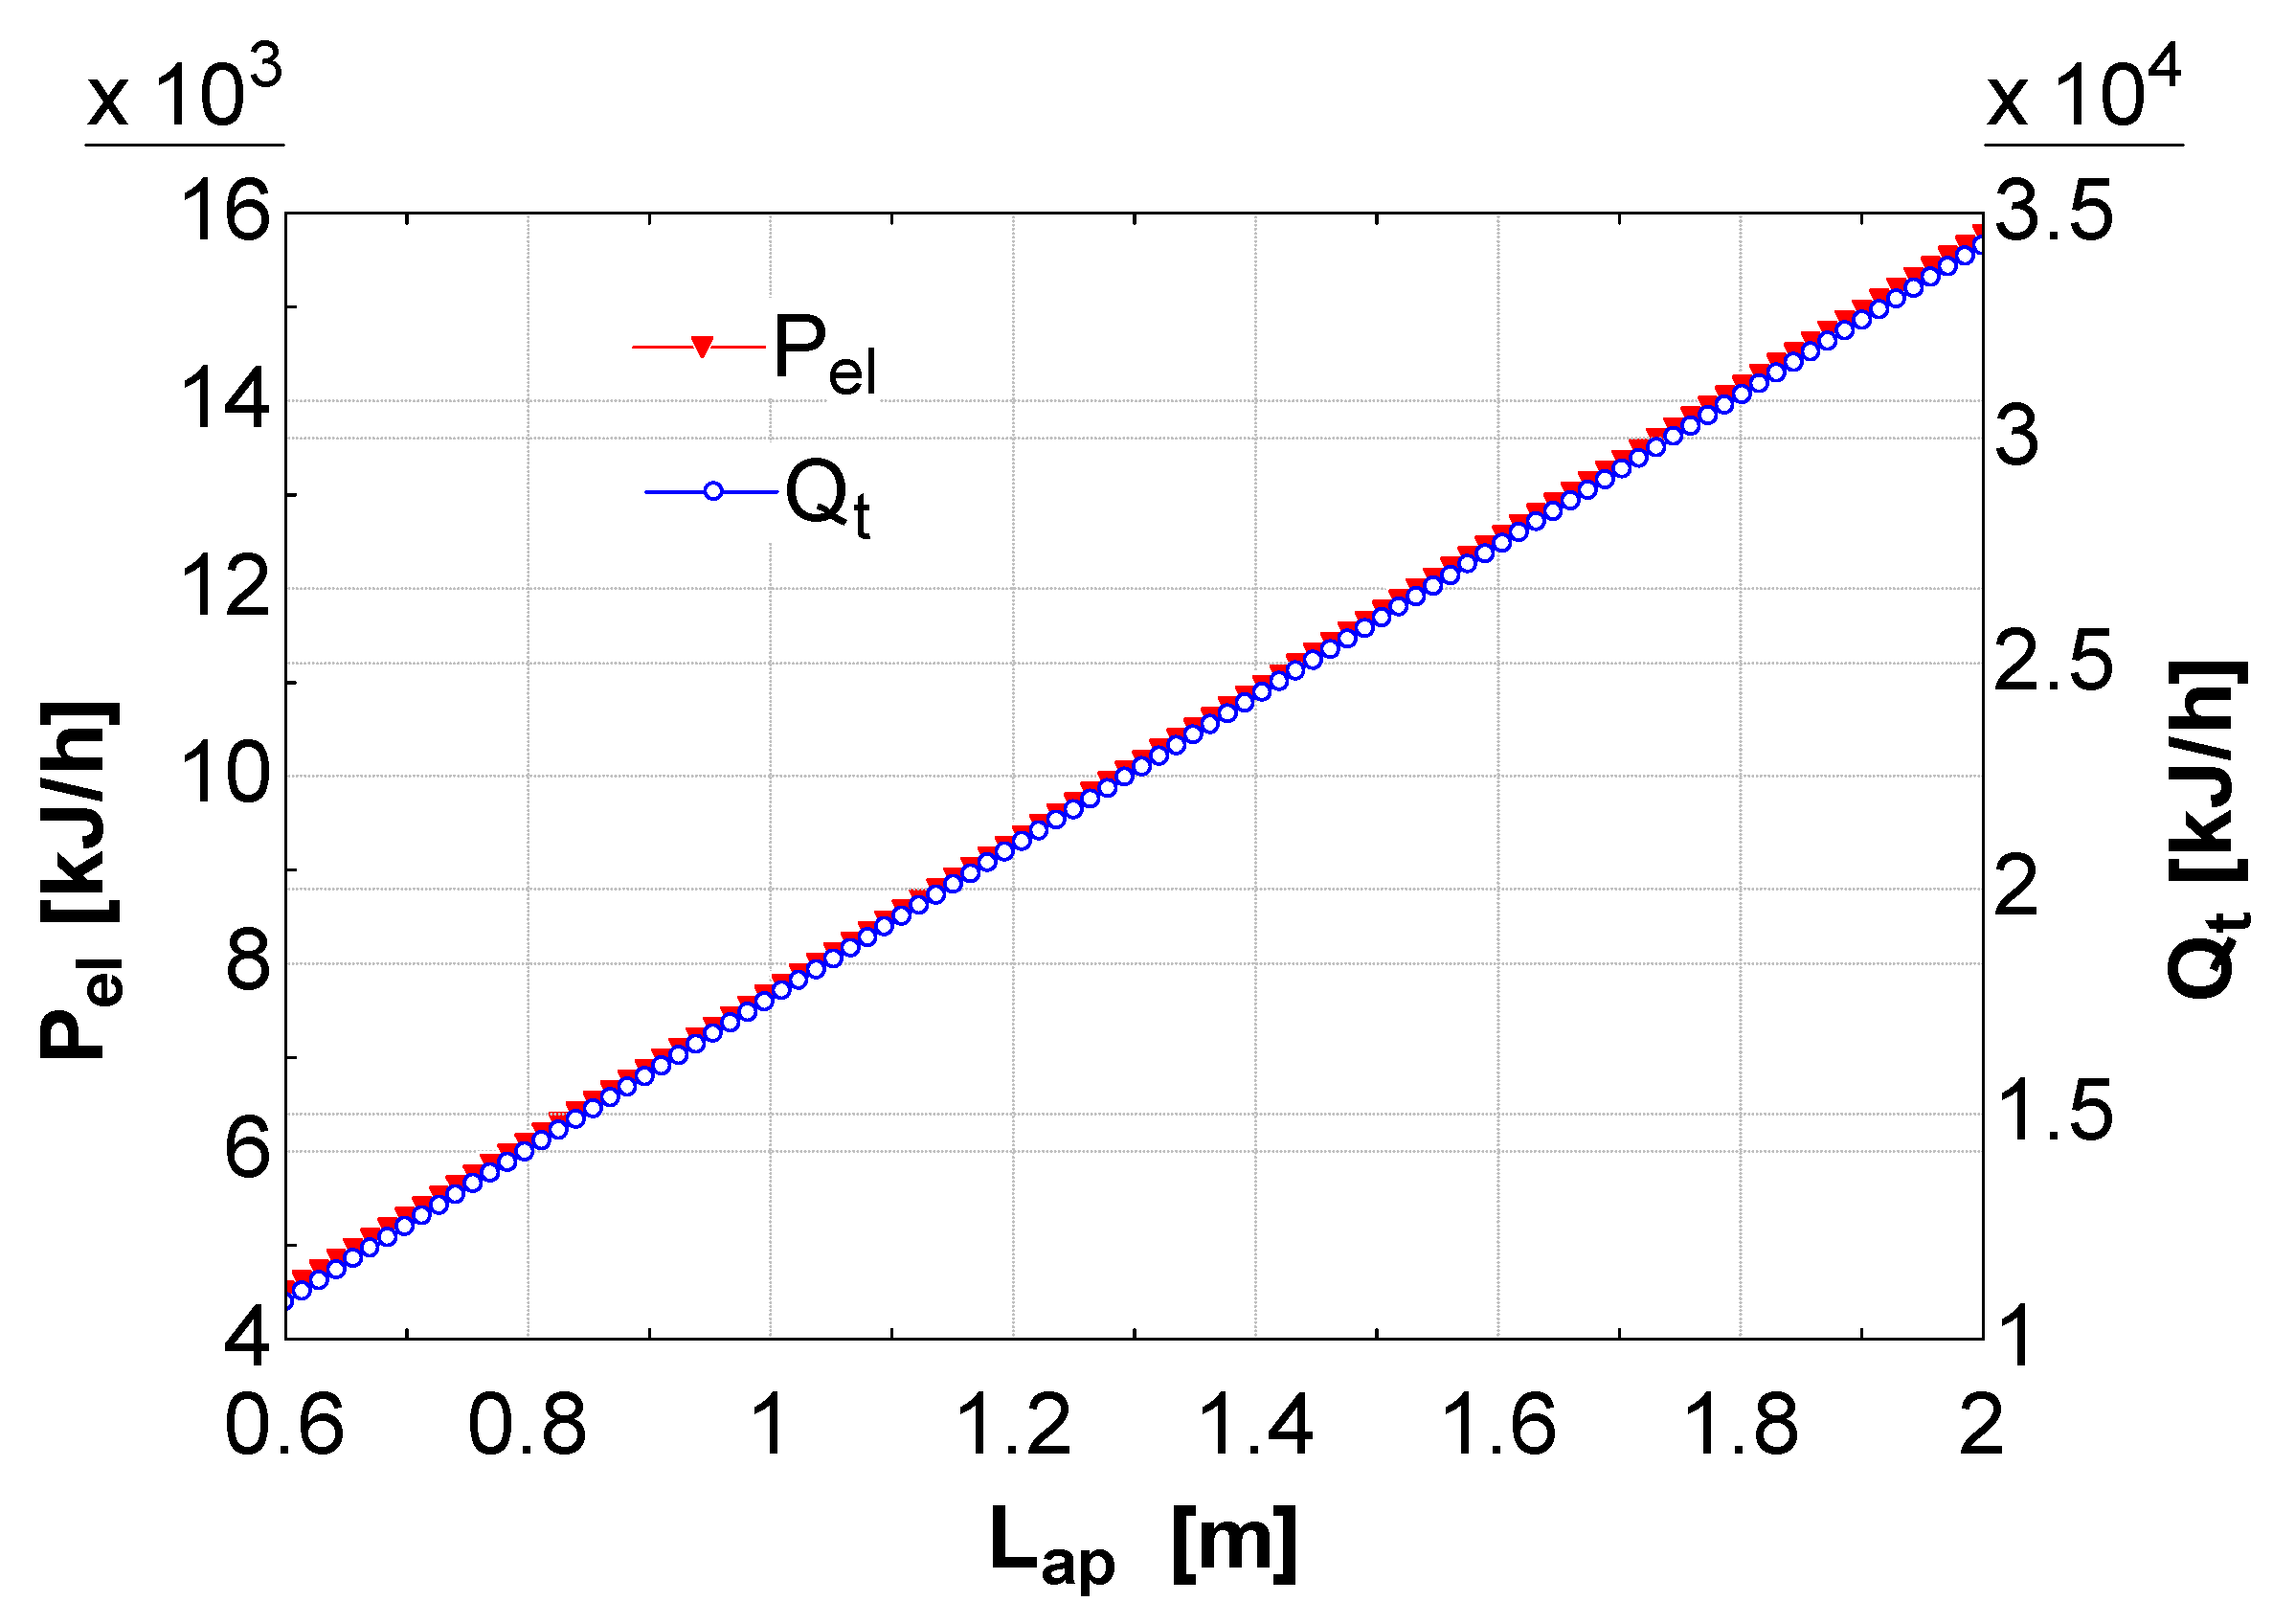
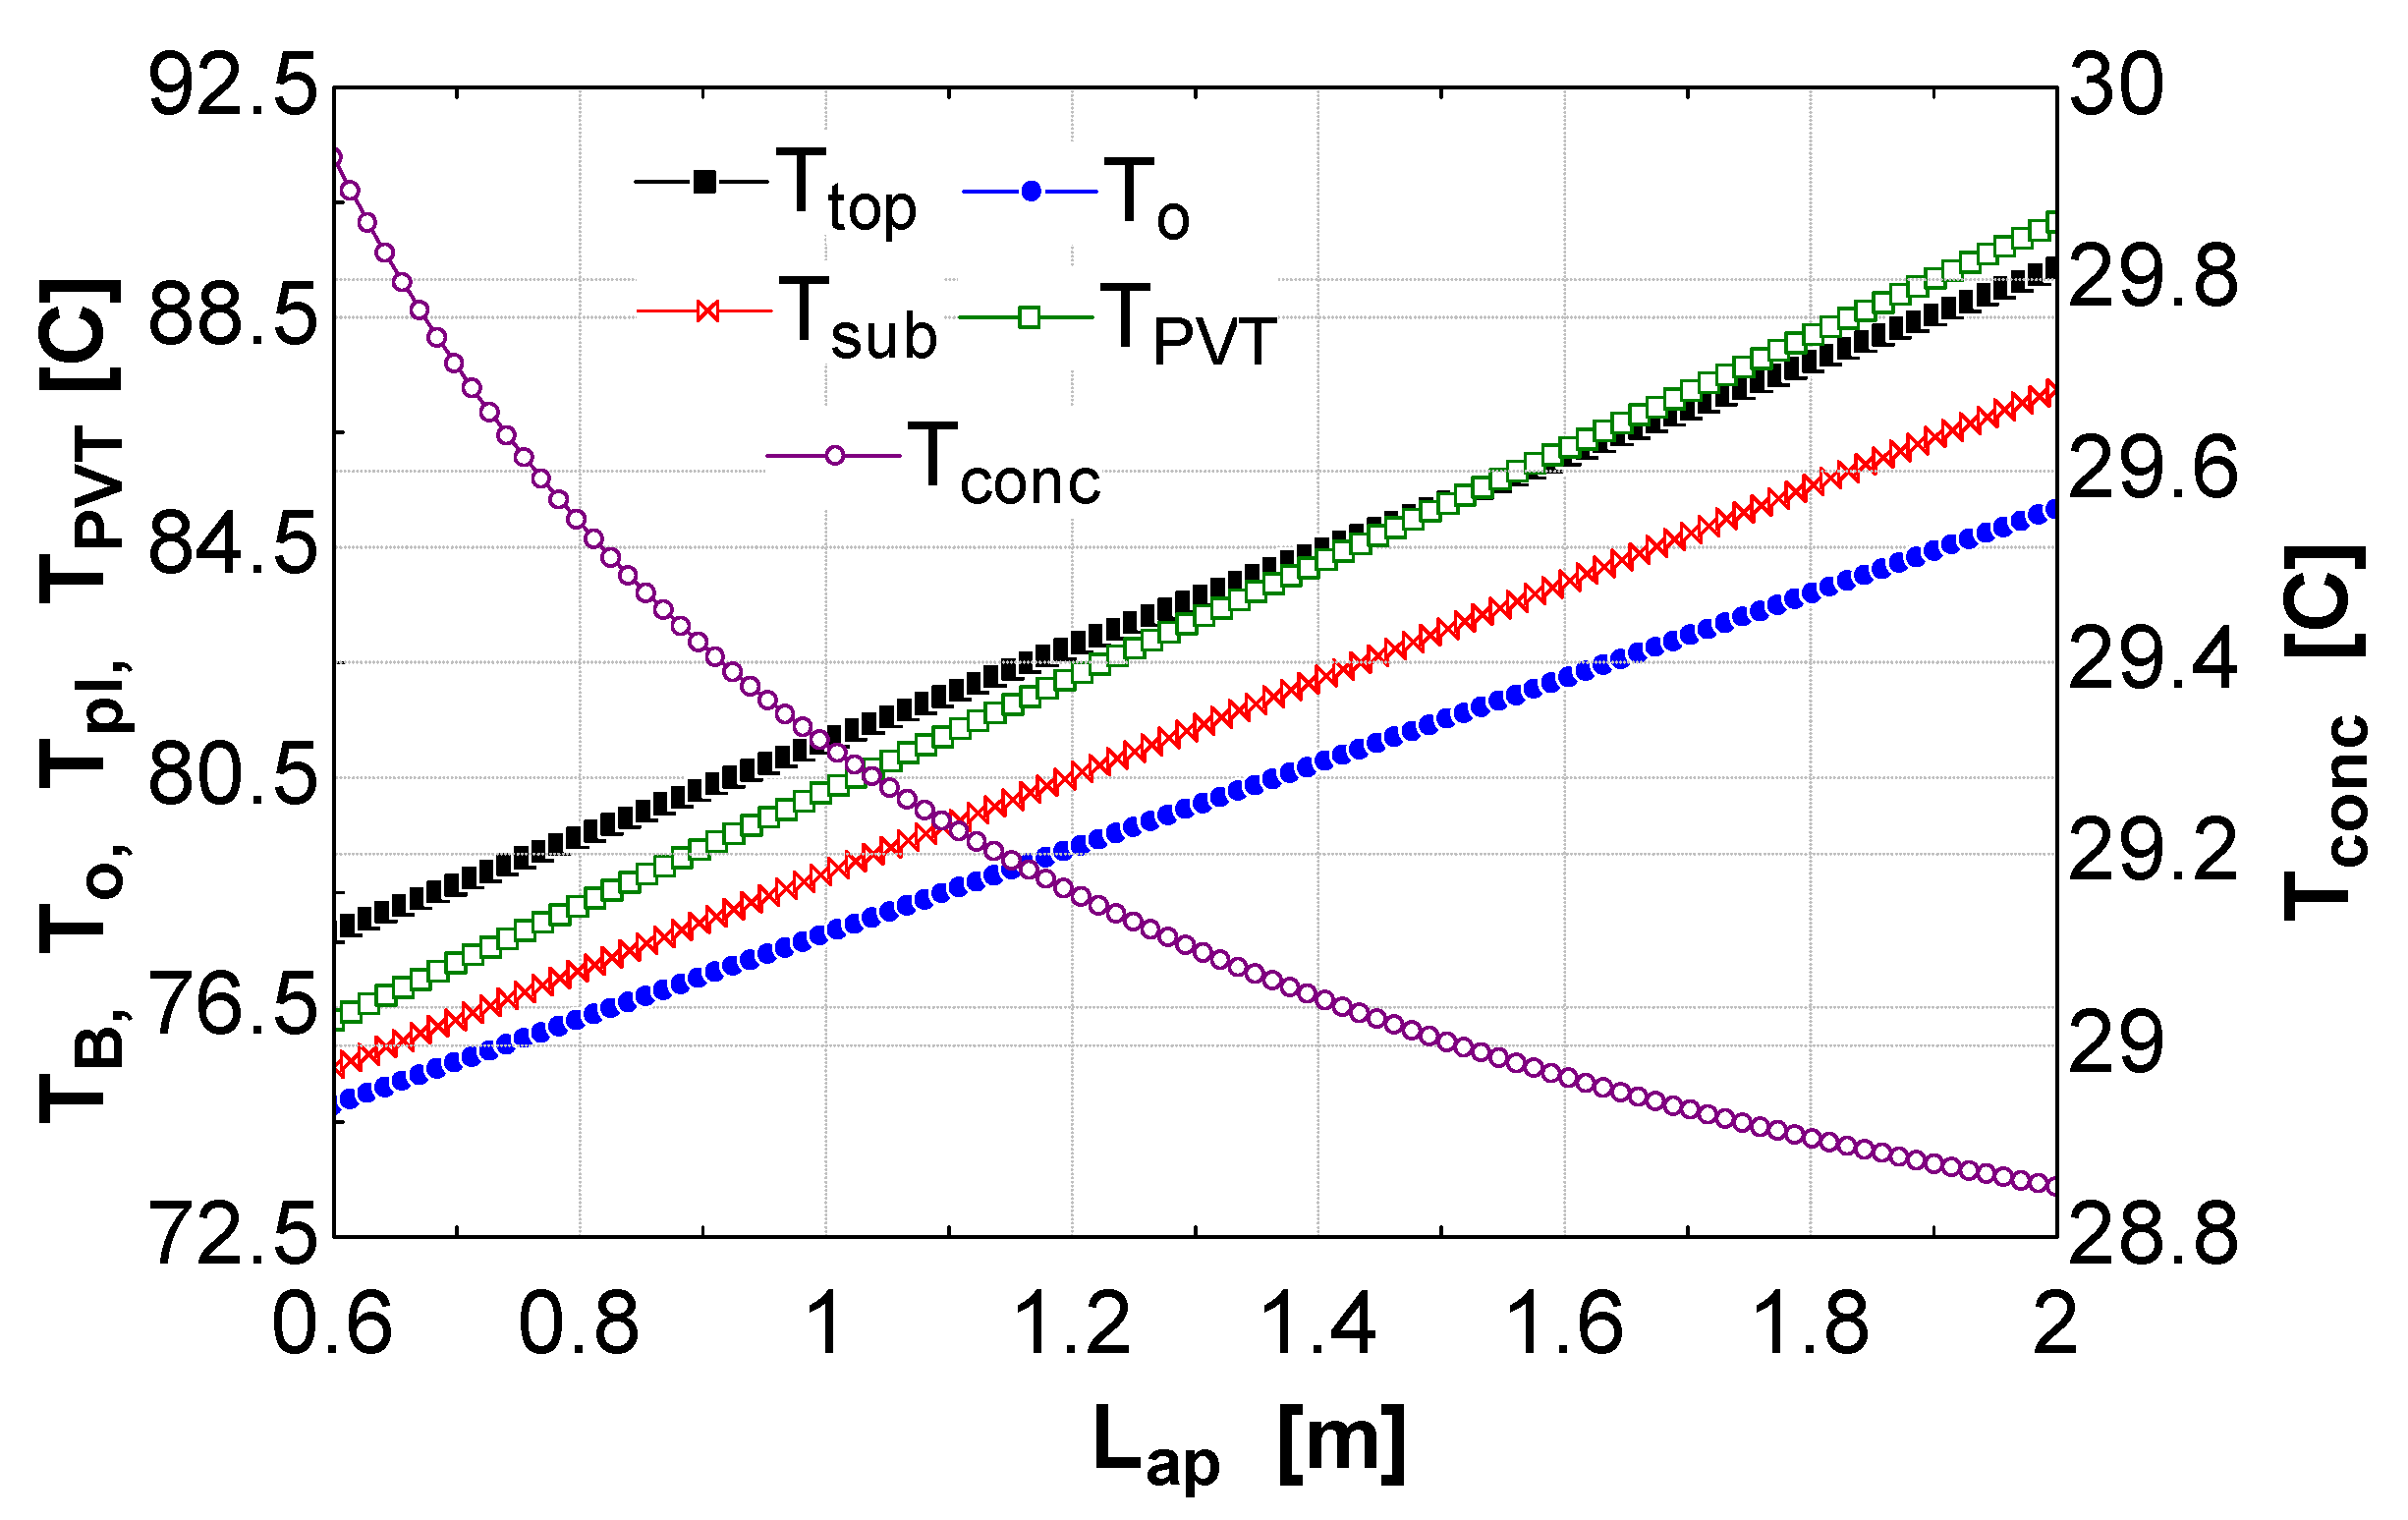
Figure 5 from an ideal proportional relationship. In fact, for a CPVT length of 4 m, thermal and electrical powers are 8320 kJ/h and 4531 kJ/h, respectively, whereas for 16 m these values increase up to 33,403 kJ/h and 15,178 kJ/h, which are slightly lower values than the ones expected in case of constant thermal and electrical efficiencies. This decrease may be explained by the temperature profiles shown in
Figure 6. Here, it is shown that higher lengths of the CPVT system also determine a slight increase of all the temperatures. In fact, an increase in the length also causes an increase of fluid outlet temperature that consequently determines an overall increase of the temperatures of the system. In particular, the increase in PV temperature determines the decrease of the electrical efficiency. Moreover, the increase of PV and top side temperatures also determines an increase of both convective and radiative losses, causing the slight reduction of thermal efficiency shown in the previous figure. Therefore, from this analysis it can be concluded that, for maximizing the efficiency of the CPVT the length of the system should be small and the temperature increase of the fluid should be also small. This result is in accordance with the expected behaviour of the system since an increase of the fluid mean temperature generally determines a decrease of both thermal and electrical performances.
Figure 4.
CPVT thermal and electrical efficiency vs. Ltube.
Figure 4.
CPVT thermal and electrical efficiency vs. Ltube.
Figure 5.
CPVT Electrical and Thermal Power vs. Ltube.
Figure 5.
CPVT Electrical and Thermal Power vs. Ltube.
Figure 6.
CPVT Temperatures vs. Ltube.
Figure 6.
CPVT Temperatures vs. Ltube.
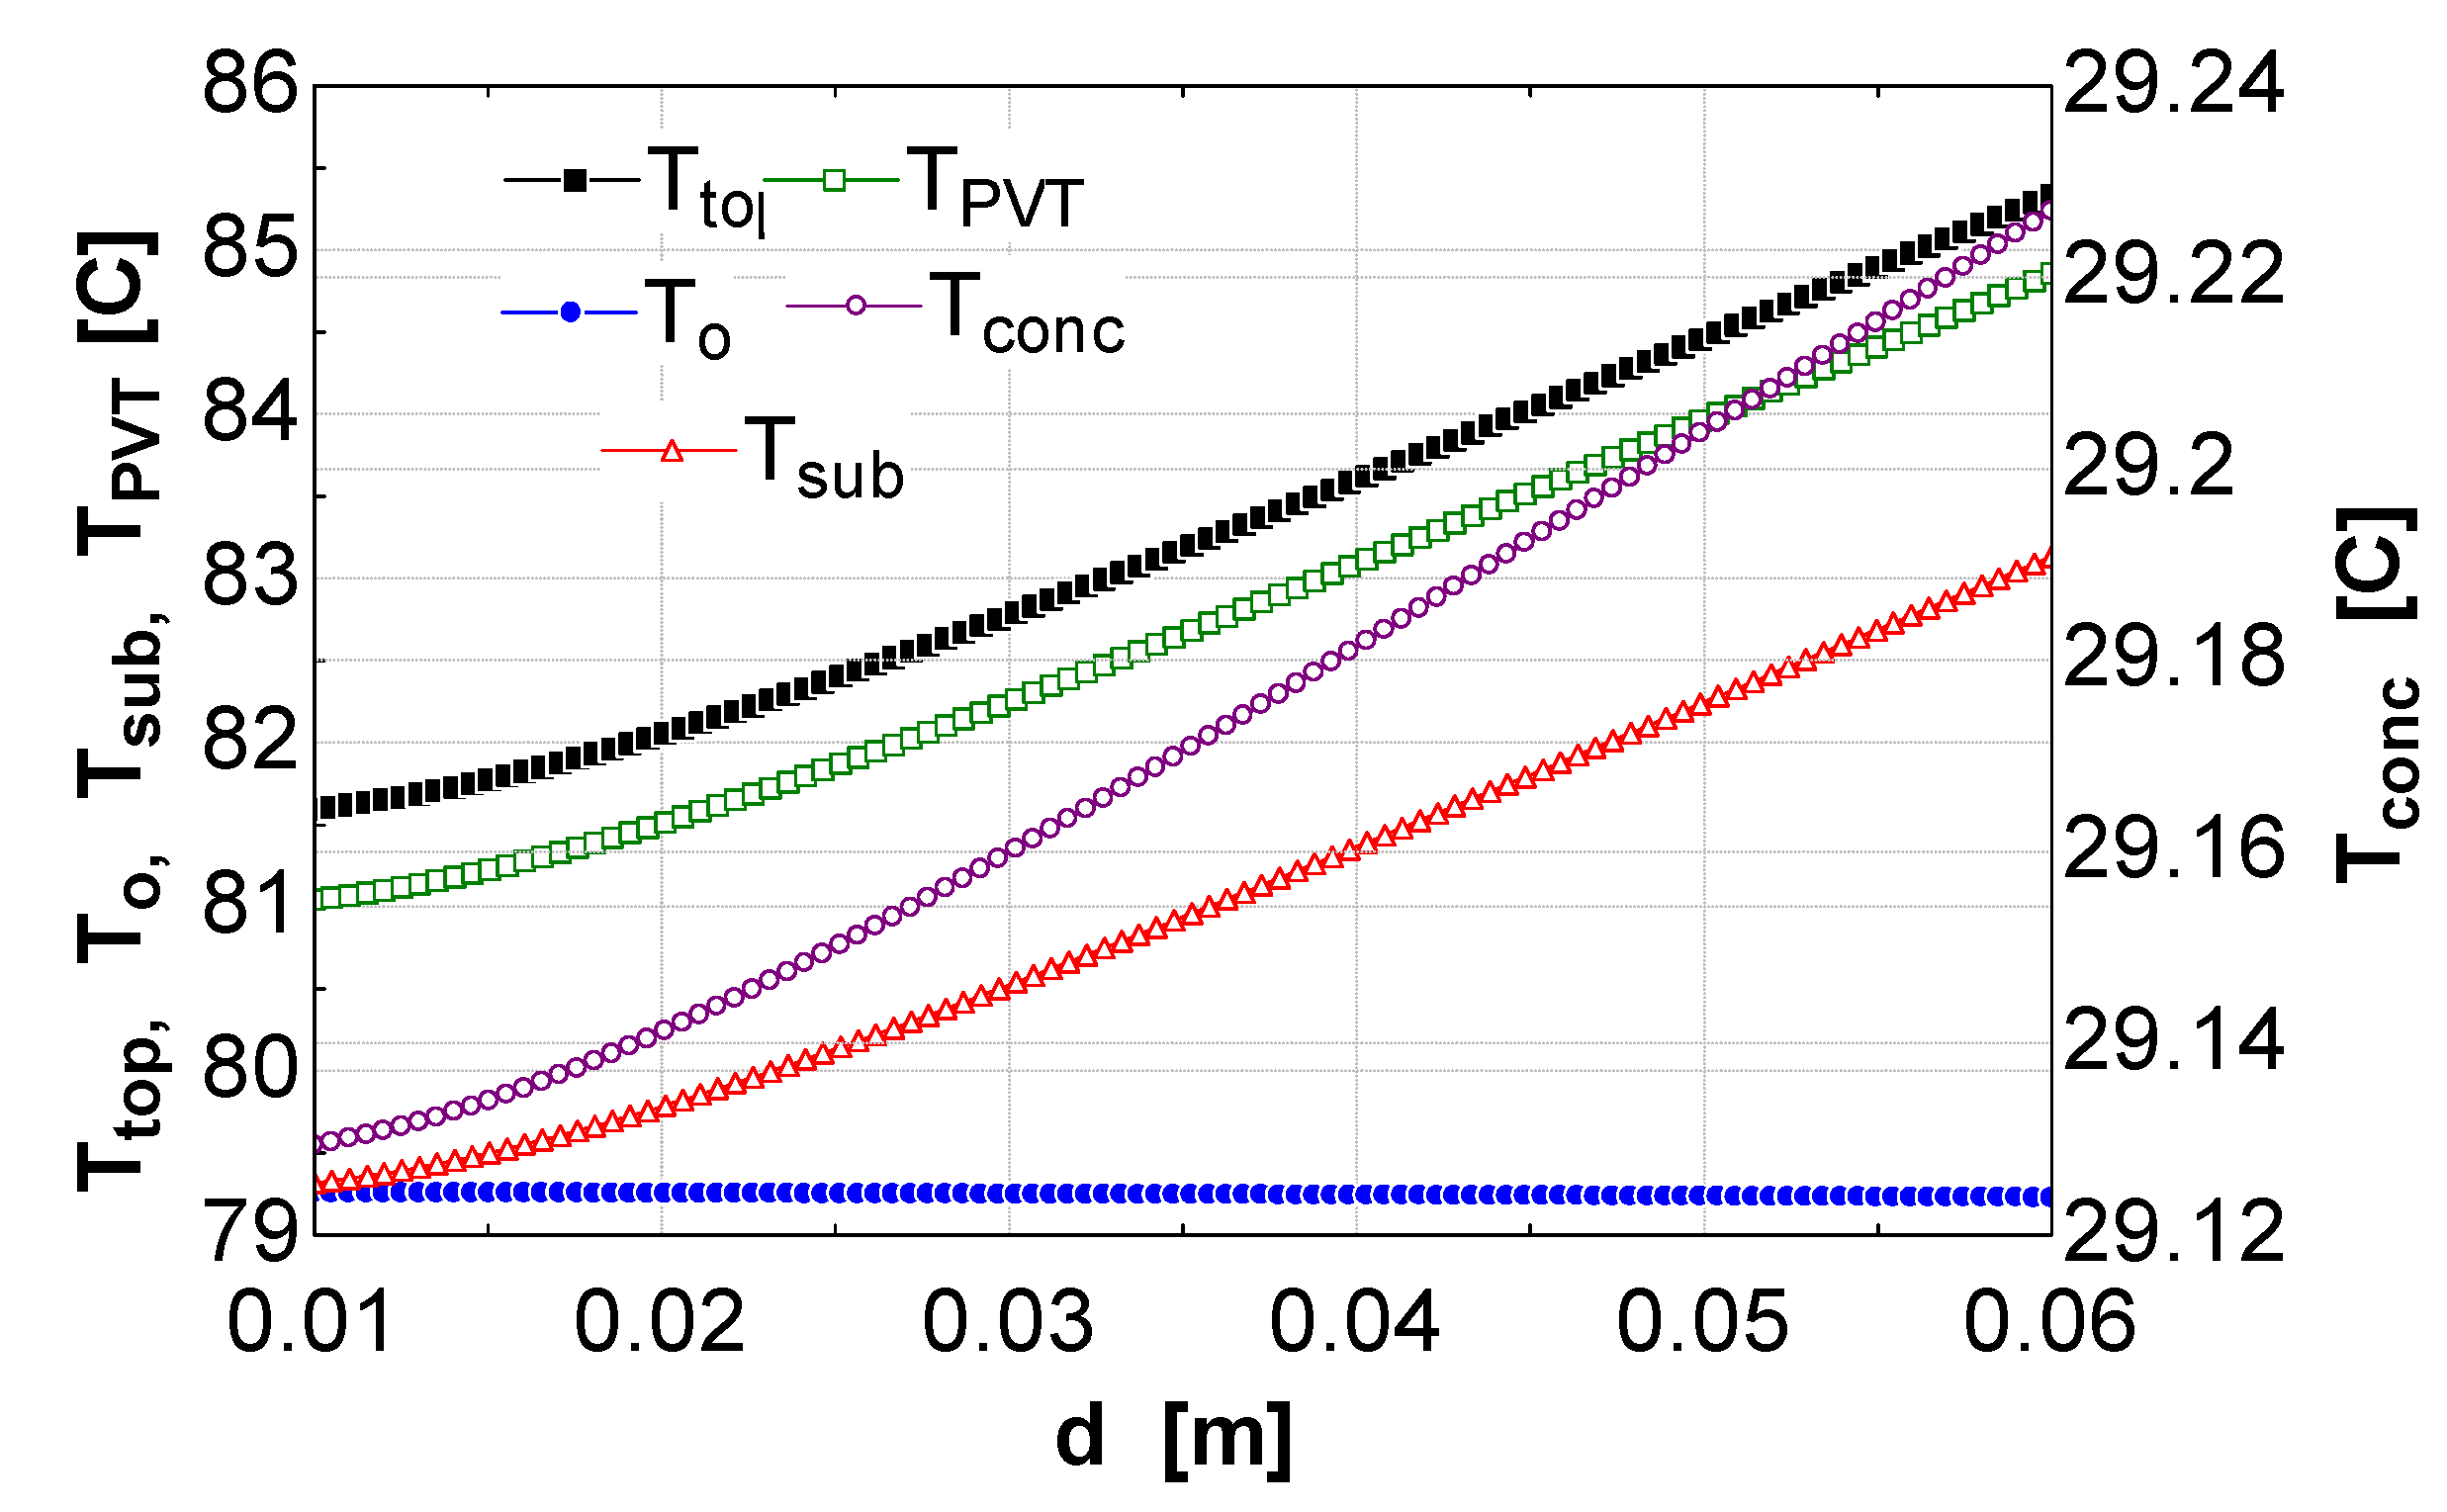
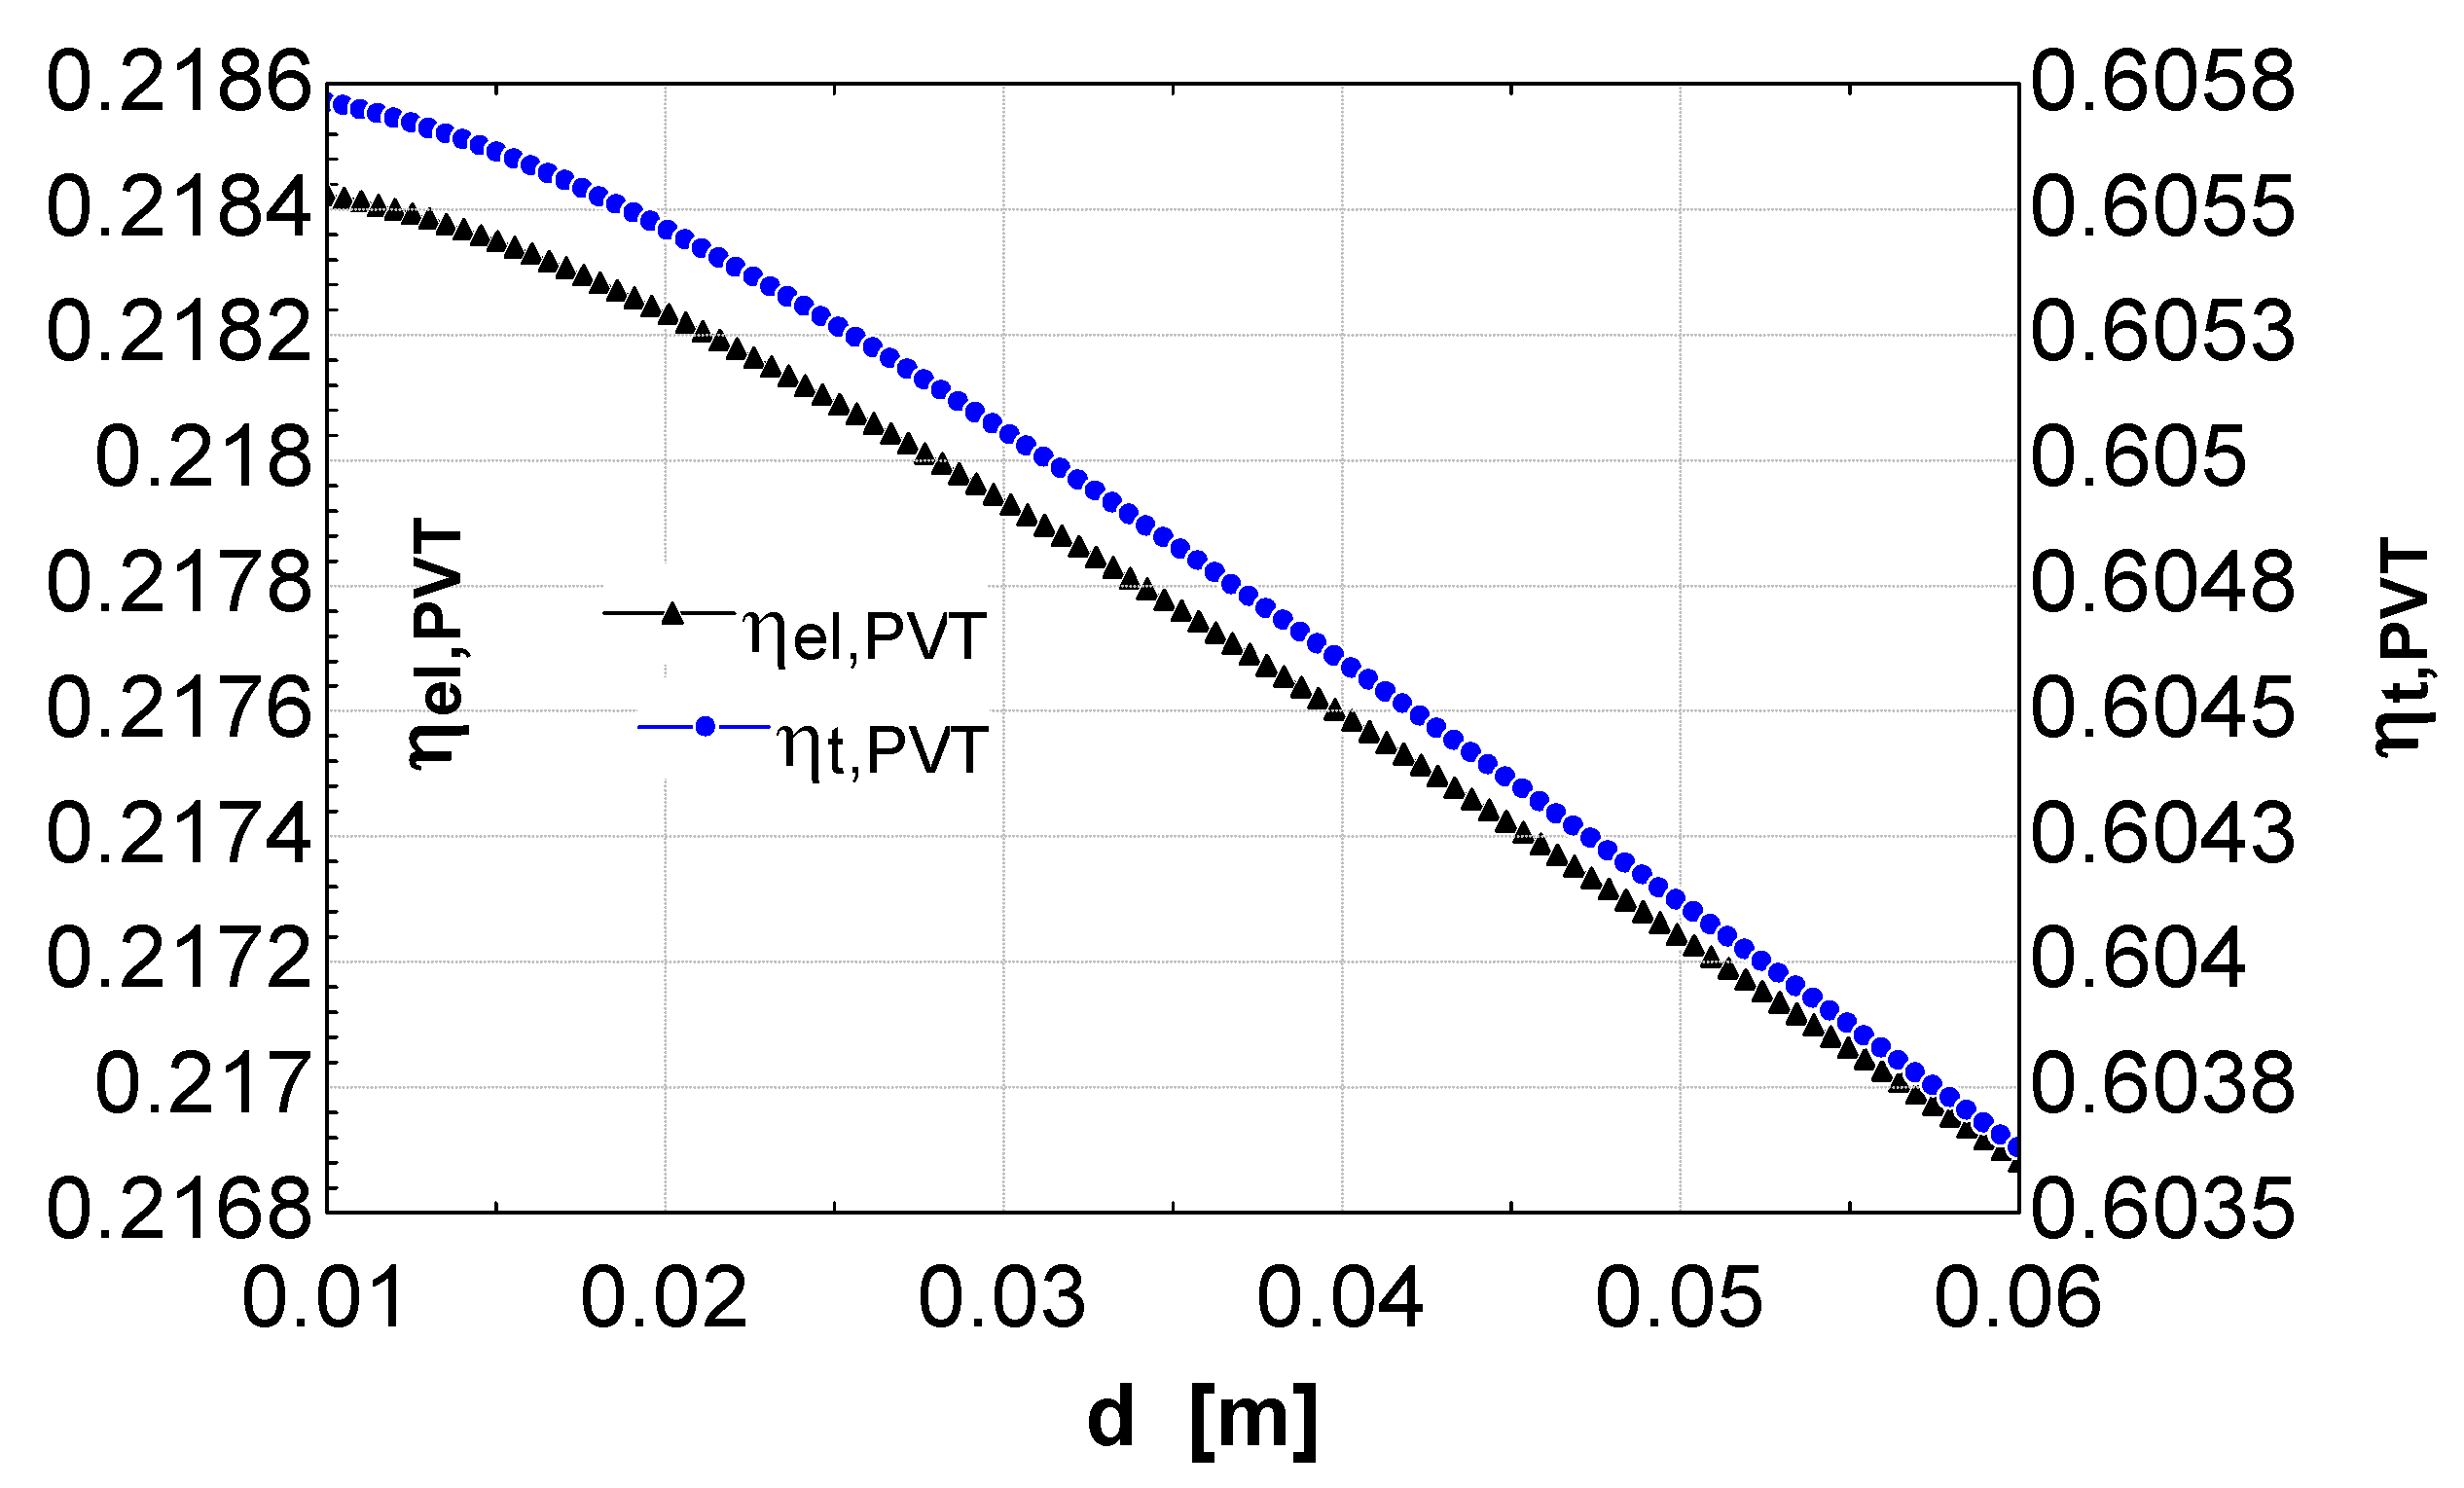
The variation of the diameter of the fluid channel does not significantly affect the overall performance of the system, being important only for the internal balance of the system. In fact,
Figure 7 clearly shows that an increase in channel diameter determines a slight decrease of electrical and thermal efficiencies. A similar decrease is also observed for both thermal and electrical powers produced by the CPVT. Conversely a variation in the diameter shows a significant impact on the temperatures of the layers of the CPVT, as shown in
Figure 8. Here, it is clearly shown that an increase of the diameter determines a general increase of the temperature of all the solid layers of the CPVT, whereas the outlet temperature of the fluid does not significantly vary. In fact, smaller diameters correspond to a higher velocity of the fluid which also determines an increase of its heat transfer coefficient. Simultaneously, the higher the diameter, the higher the heat exchange area. These two contrasting effects determine the temperature plot shown in
Figure 8.
Figure 7.
CPVT thermal and electrical efficiency vs. channel diameter.
Figure 7.
CPVT thermal and electrical efficiency vs. channel diameter.
Figure 8.
CPVT Temperatures vs. channel diameter.
Figure 8.
CPVT Temperatures vs. channel diameter.
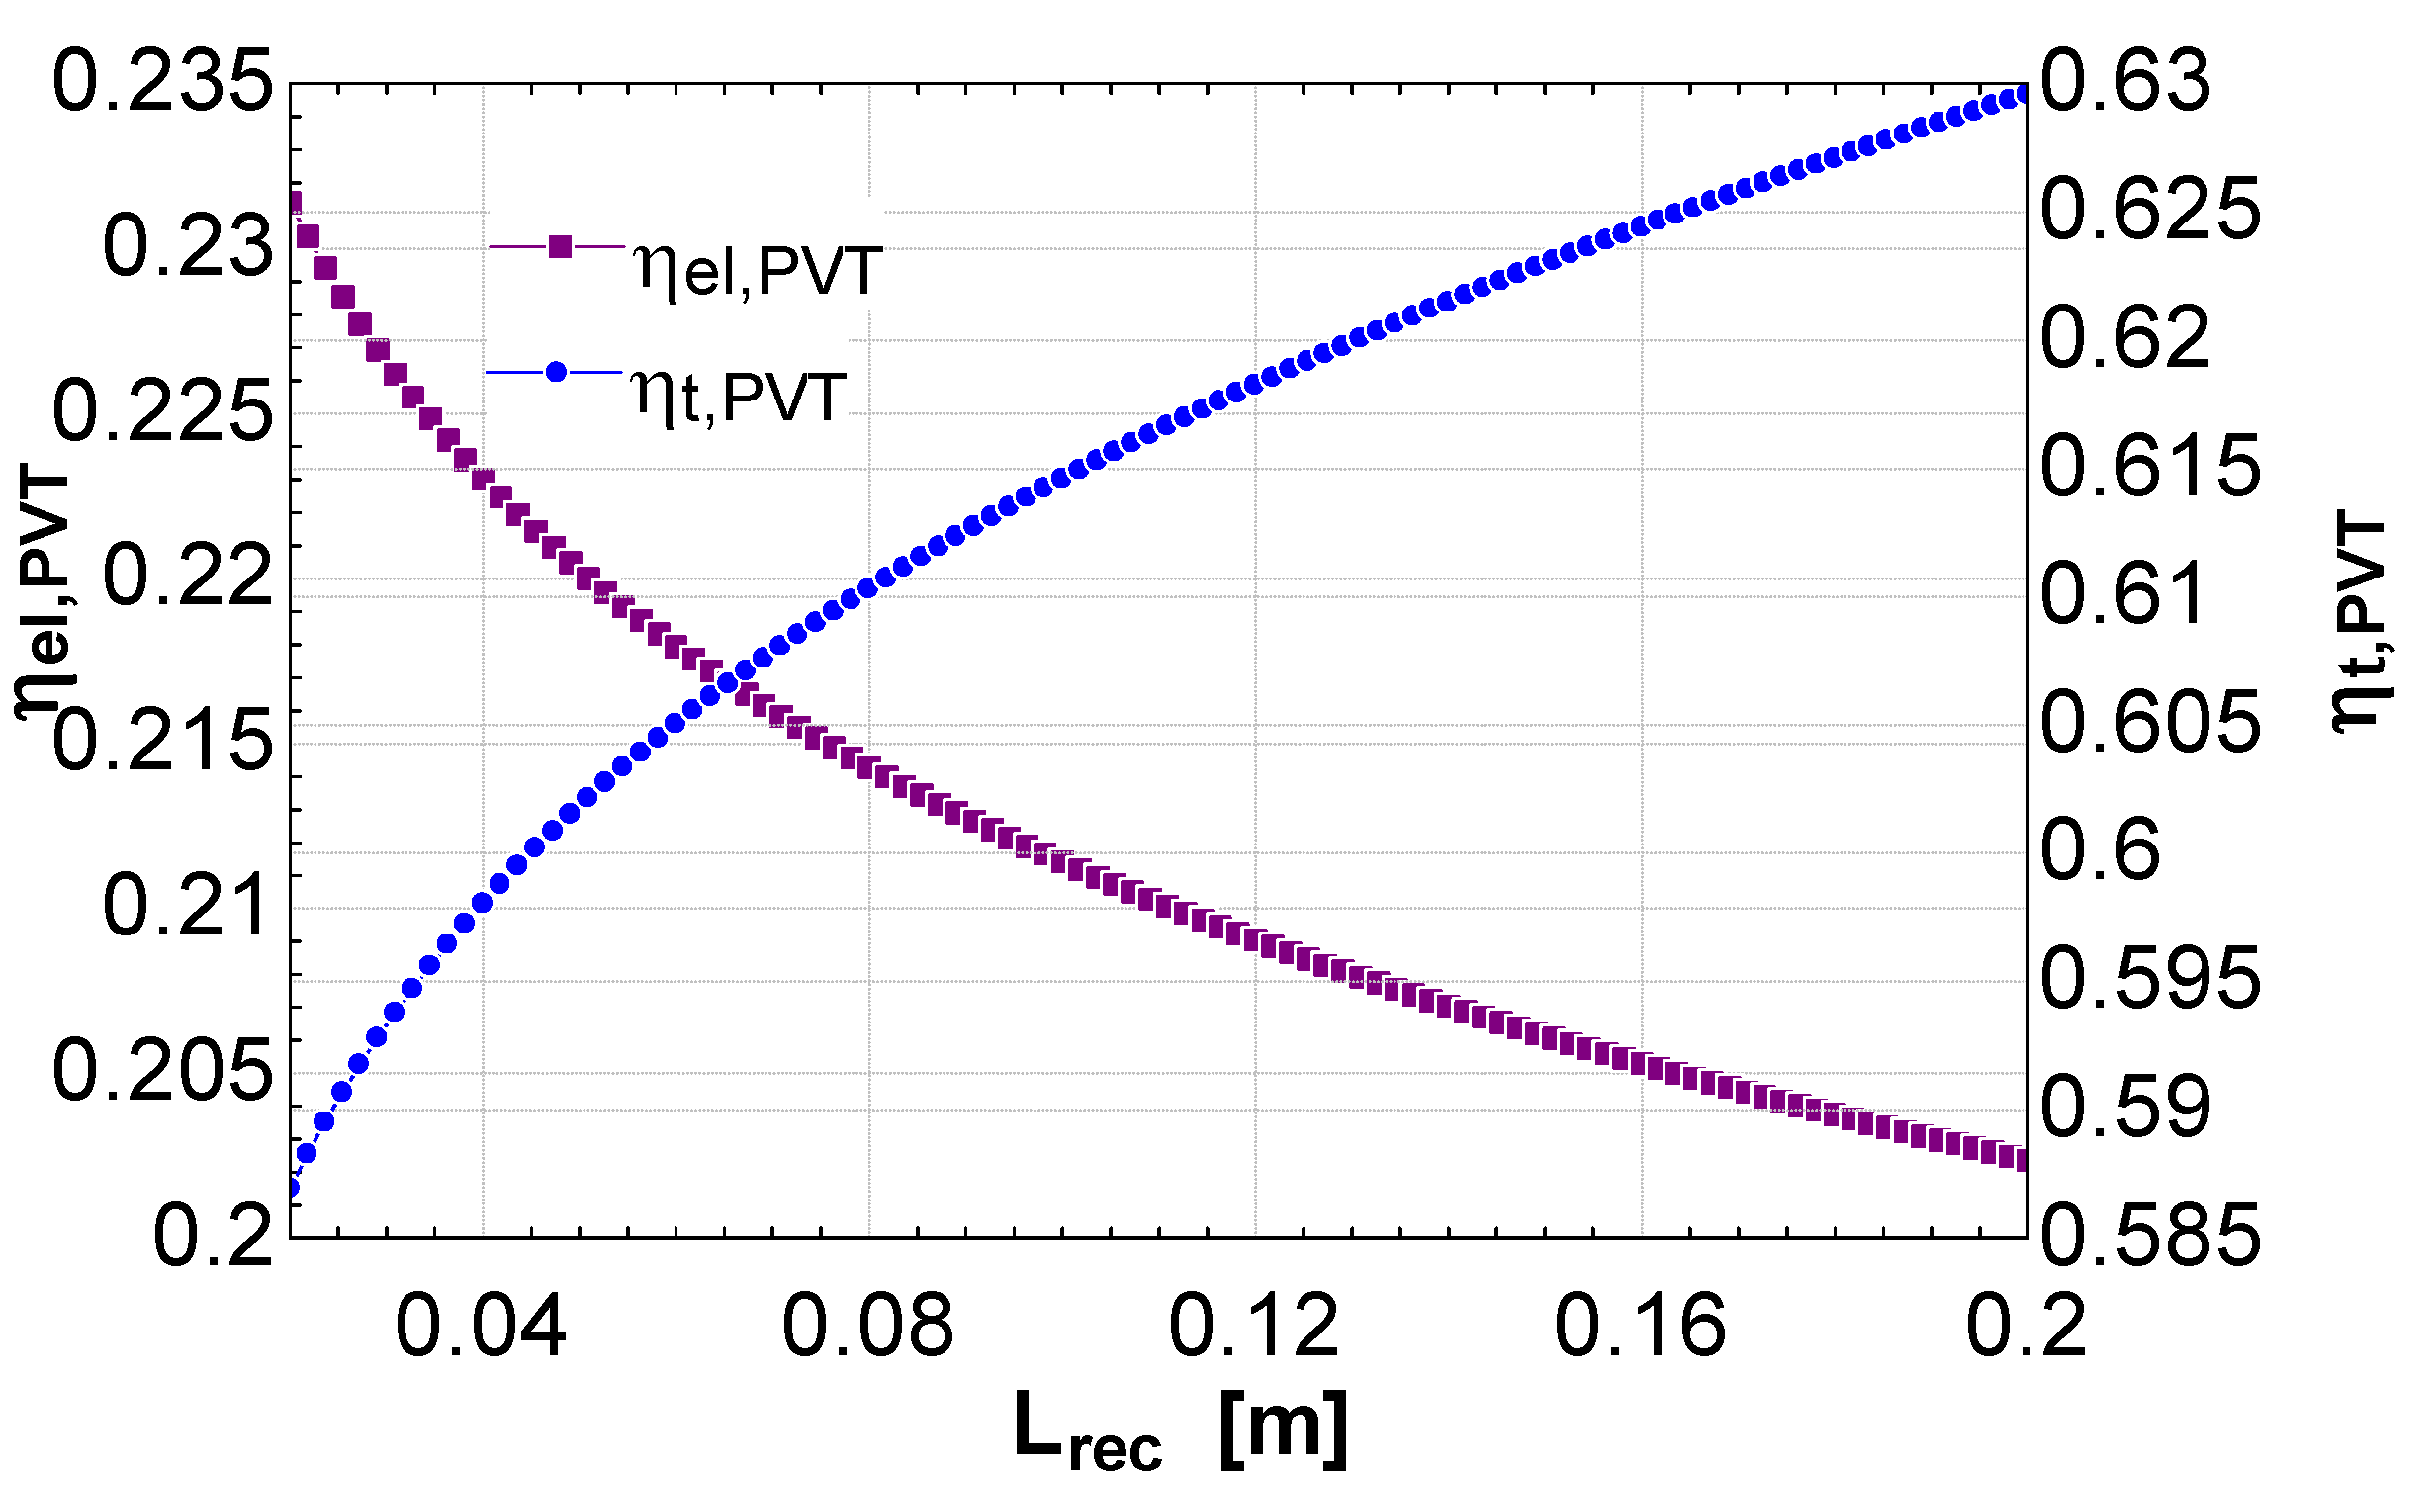
A further design parameter is the length of each of the three sides of the triangular receiver,
Lrec. The variation of this parameter is very important since affects: the concentration ratio, PV area and top absorber area. The length of the receiver significantly affects both thermal and electrical efficiencies, as it can be noticed in
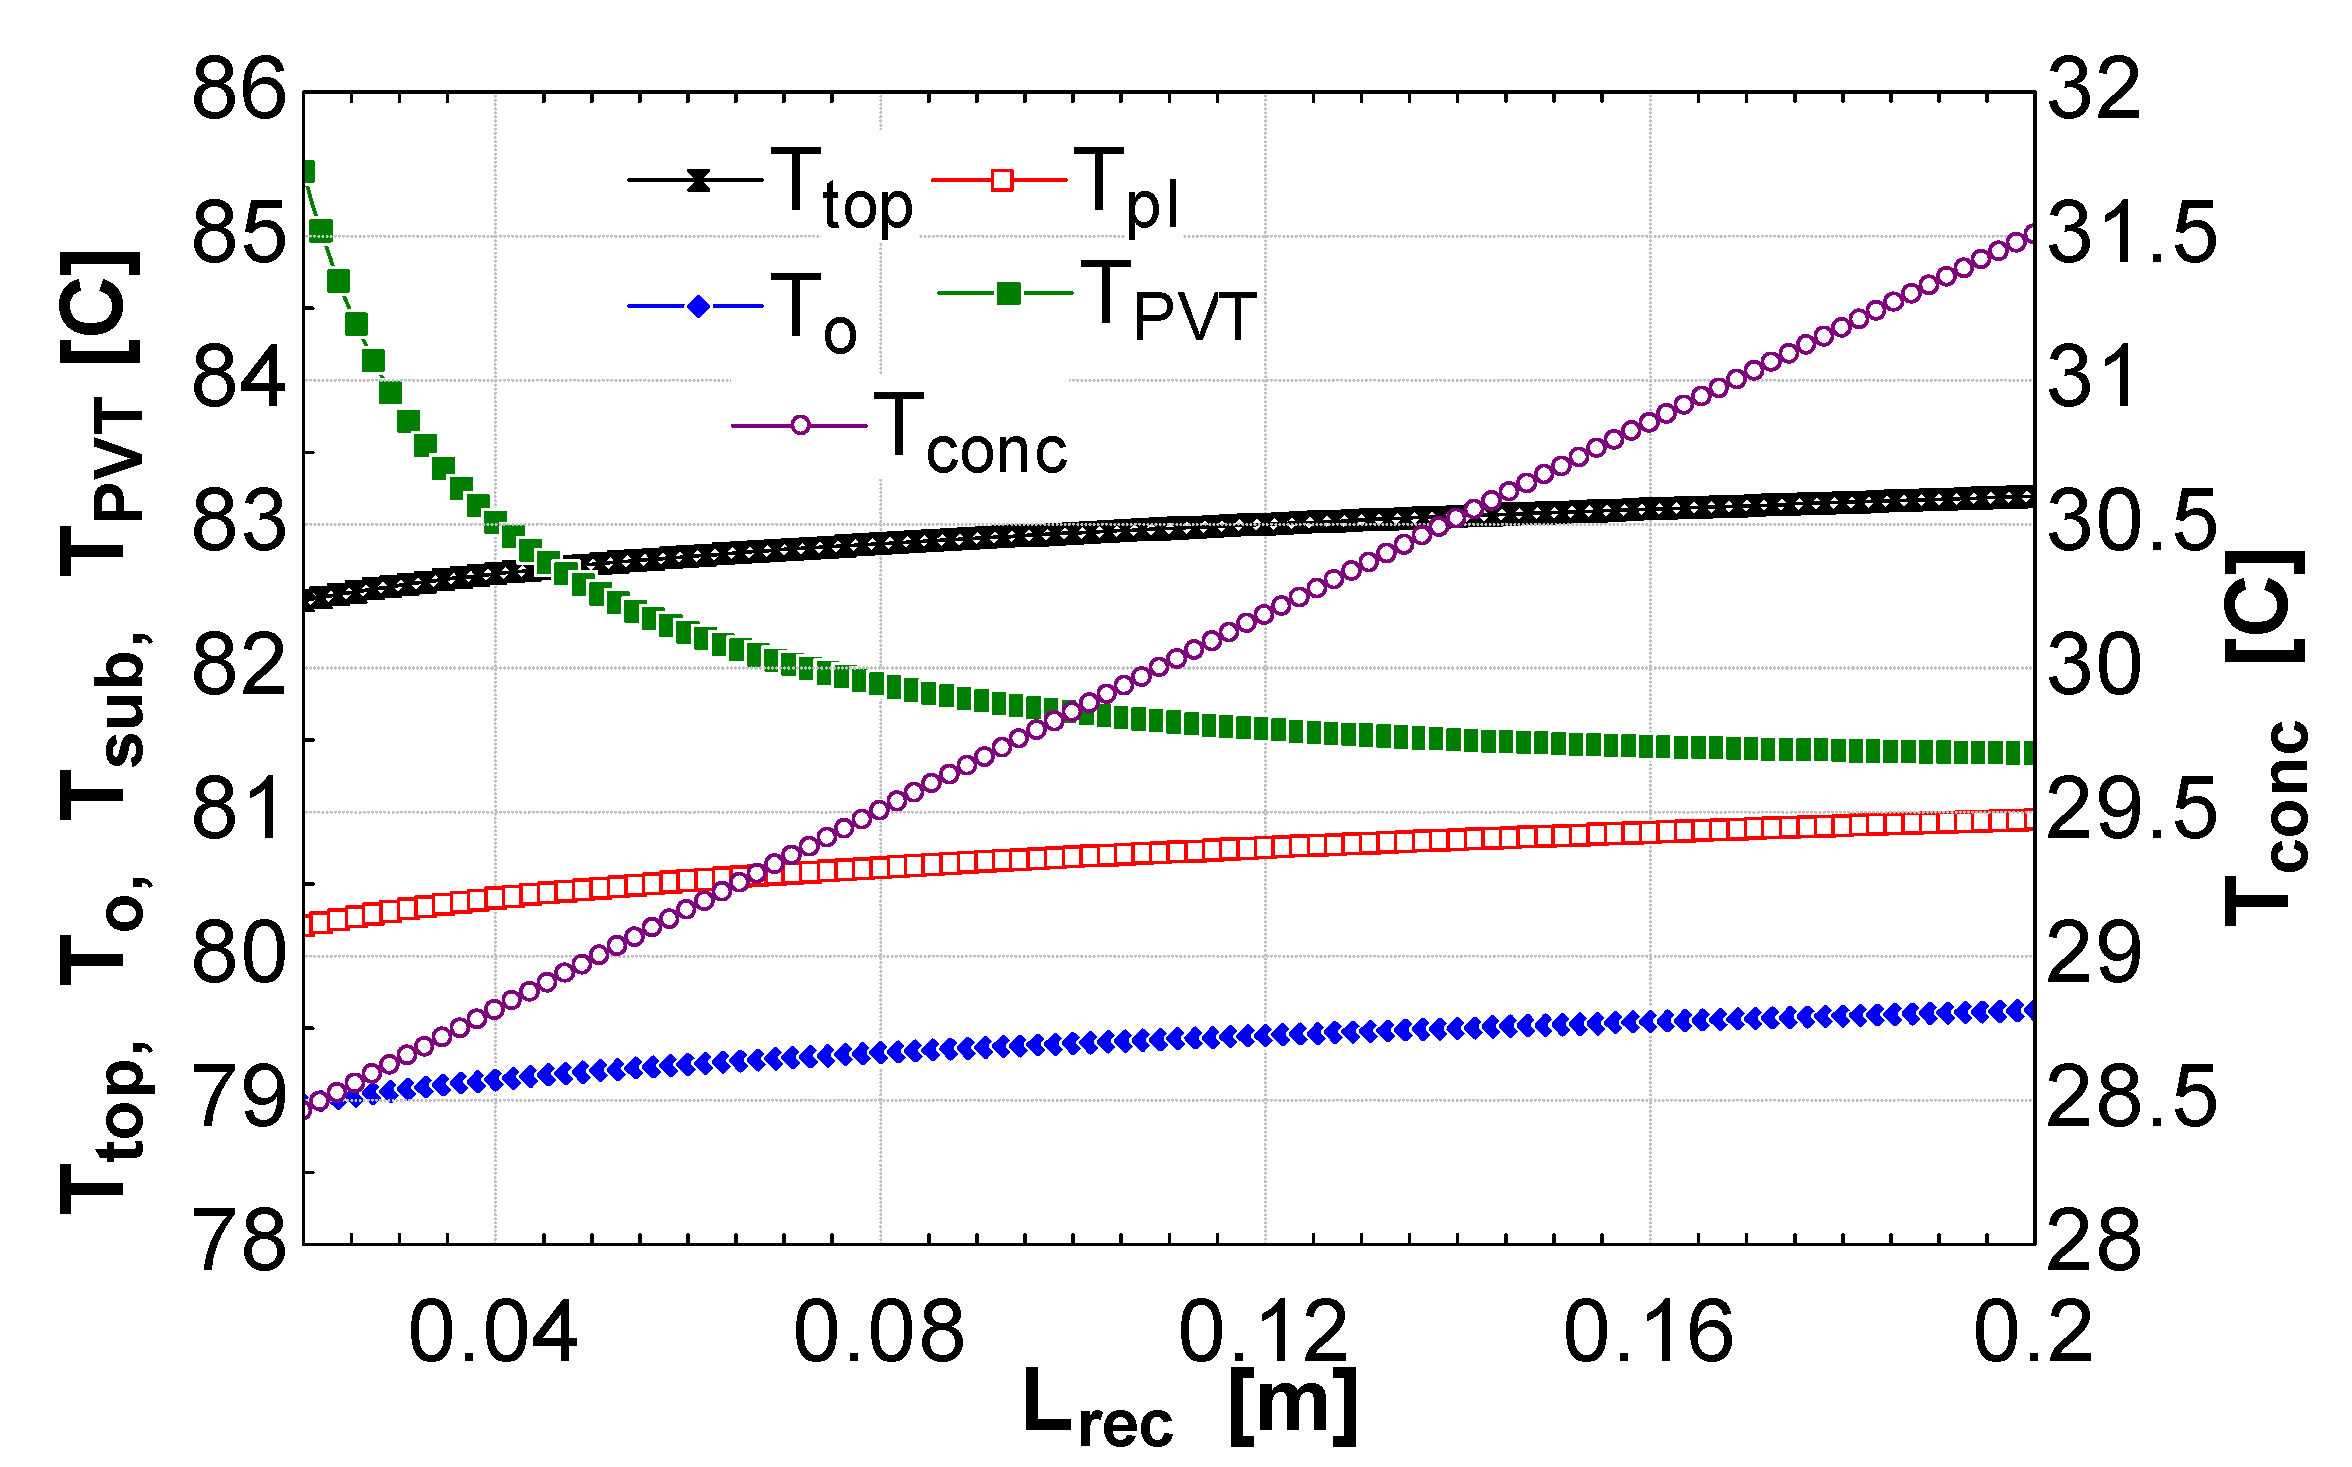
Figure 9 which shows that an increase in receiver length determines a decrease of the electrical efficiency and a simultaneous increase of the thermal efficiency. An increase of the length of the receiver determines a proportional decrease of the concentration ratio, reducing the radiative flow incident on the PV layer. This phenomenon determines, as expected, a decrease of PV layer temperature (
Figure 10). A reduction of the PVT temperature would suggest an increase of the electrical efficiency, in contrast to the trend shown in
Figure 9. This is due to the fact that the electrical efficiency of the triple-junction PV layer also depends on the concentration ratio, as shown in Equation (11). In particular, a reduction of the concentration ratio also determines a decrease of the of the PV electrical efficiency. This effect is dominant over the decrease of PV temperature, determining as overall result a significant decrease of PV electrical efficiency as shown in
Figure 9. Conversely, thermal efficiency increases faster than the electrical efficiency decreases. In fact, thermal efficiency increases for two simultaneous effects: (i) a lower electrical efficiency makes more heat available for thermal conversion; (ii) an increase of top absorber area improves the utilization of the total radiation. This is also clear in
Figure 10 that shows how an increase of the temperature length determines an increase of the top surface temperature, causing also an increase of the outlet temperature of the fluid. Therefore, it may be concluded that the length of the receivers plays an important role in the design of the CPVT system. If the goal is electrical efficiency maximization, this parameter should be as low as possible. Conversely, it should very high if the goal is to increase thermal efficiency.
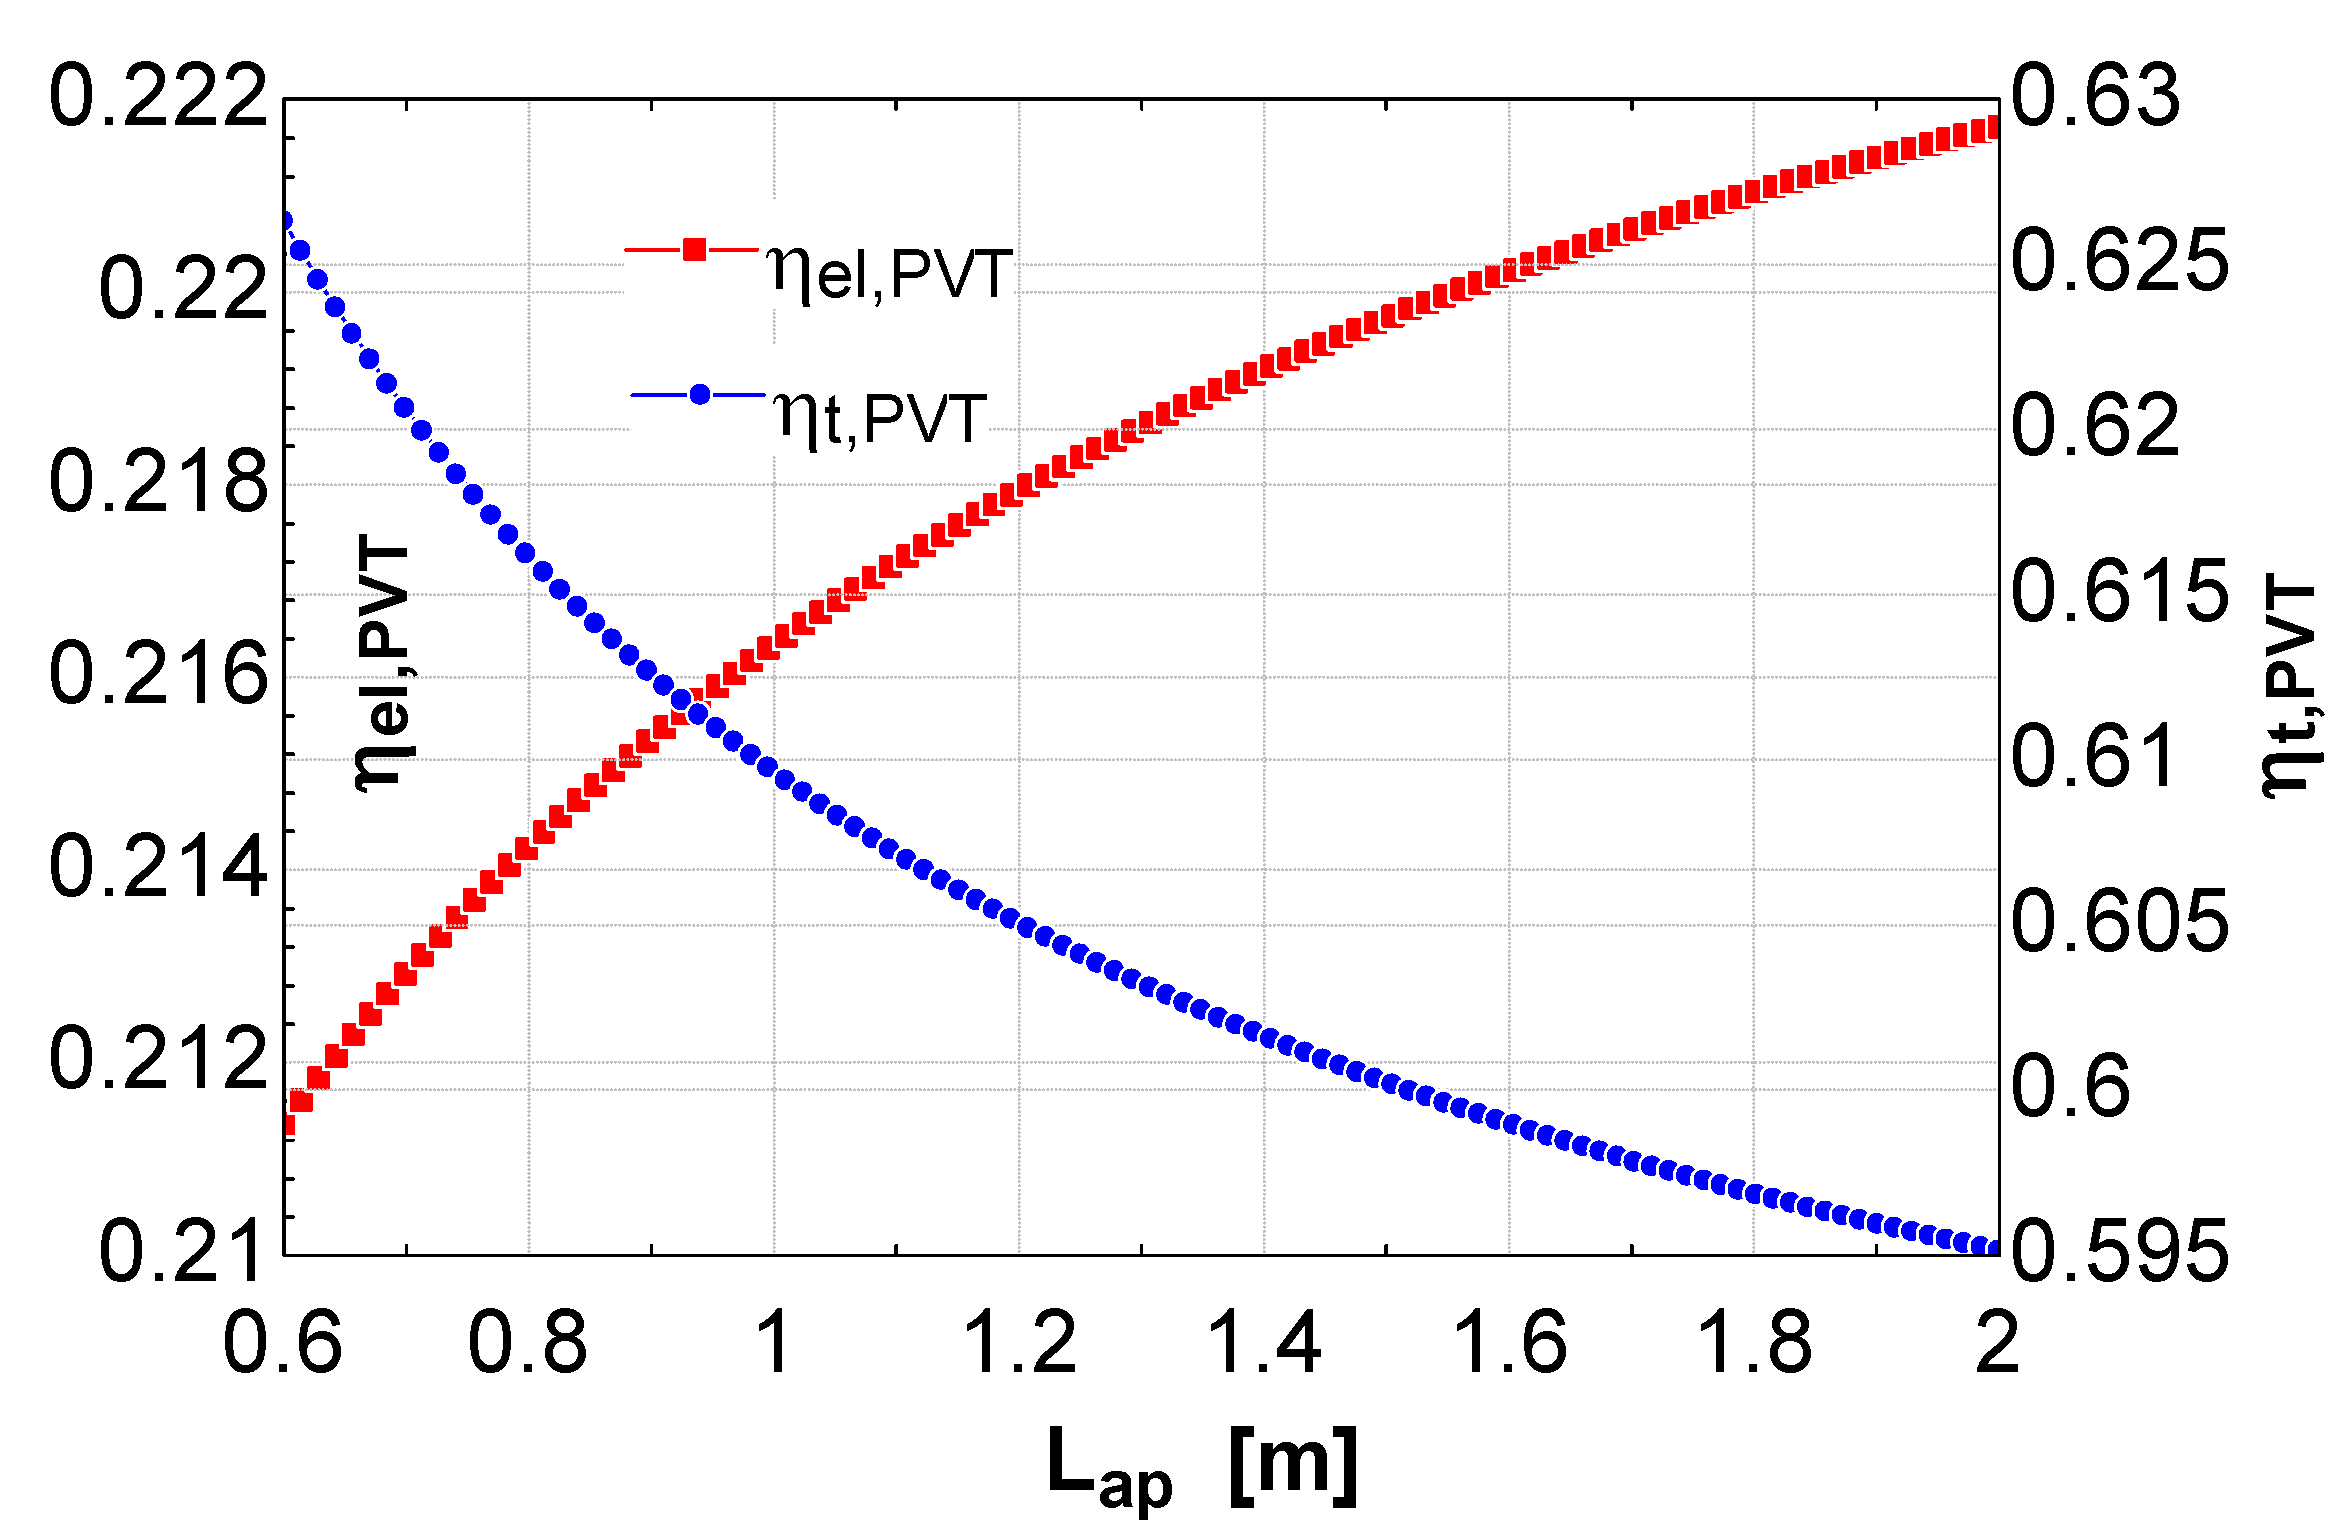
Opposite results are obtained by varying the aperture length,
i.e. the length of the aperture area in the radial direction. In fact, an increase of the aperture length determines a decrease of the thermal efficiency and a simultaneous increase of the electrical efficiency (
Figure 11). In addition, both thermal and electrical powers increase proportionally with the aperture length (
Figure 12). Note that the decrease of thermal efficiency is much larger than the increase in electrical one. In fact, thermal efficiency basically decreases as a consequence of the significant increase of both radiative and convective losses, due to the increase of both PV and top temperatures (
Figure 13). A temperature increase of the layers of the CPVT receiver is due to the increase of the radiative flow (higher concentration ratio).
Figure 9.
CPVT thermal and electrical efficiency vs. receiver length.
Figure 9.
CPVT thermal and electrical efficiency vs. receiver length.
Figure 10.
CPVT Temperatures vs. receiver length.
Figure 10.
CPVT Temperatures vs. receiver length.
Figure 11.
CPVT thermal and electrical efficiency vs. aperture length.
Figure 11.
CPVT thermal and electrical efficiency vs. aperture length.
Figure 12.
CPVT Electrical and Thermal Power vs. aperture length.
Figure 12.
CPVT Electrical and Thermal Power vs. aperture length.
This increase of the concentration ratio would also determine an increase of the electrical efficiency, as discussed before. However, this positive effect is partly counterbalanced by the increase in PVT temperature (
Figure 13), resulting in a slight overall increase of the electrical efficiency. Note also that this particular trend is achieved as a consequence of the high efficiency PV layer considered in this work. If a conventional silicon PV layer had been considered, the electrical efficiency would have dramatically reduced.
Figure 13.
CPVT Temperatures vs. aperture length.
Figure 13.
CPVT Temperatures vs. aperture length.
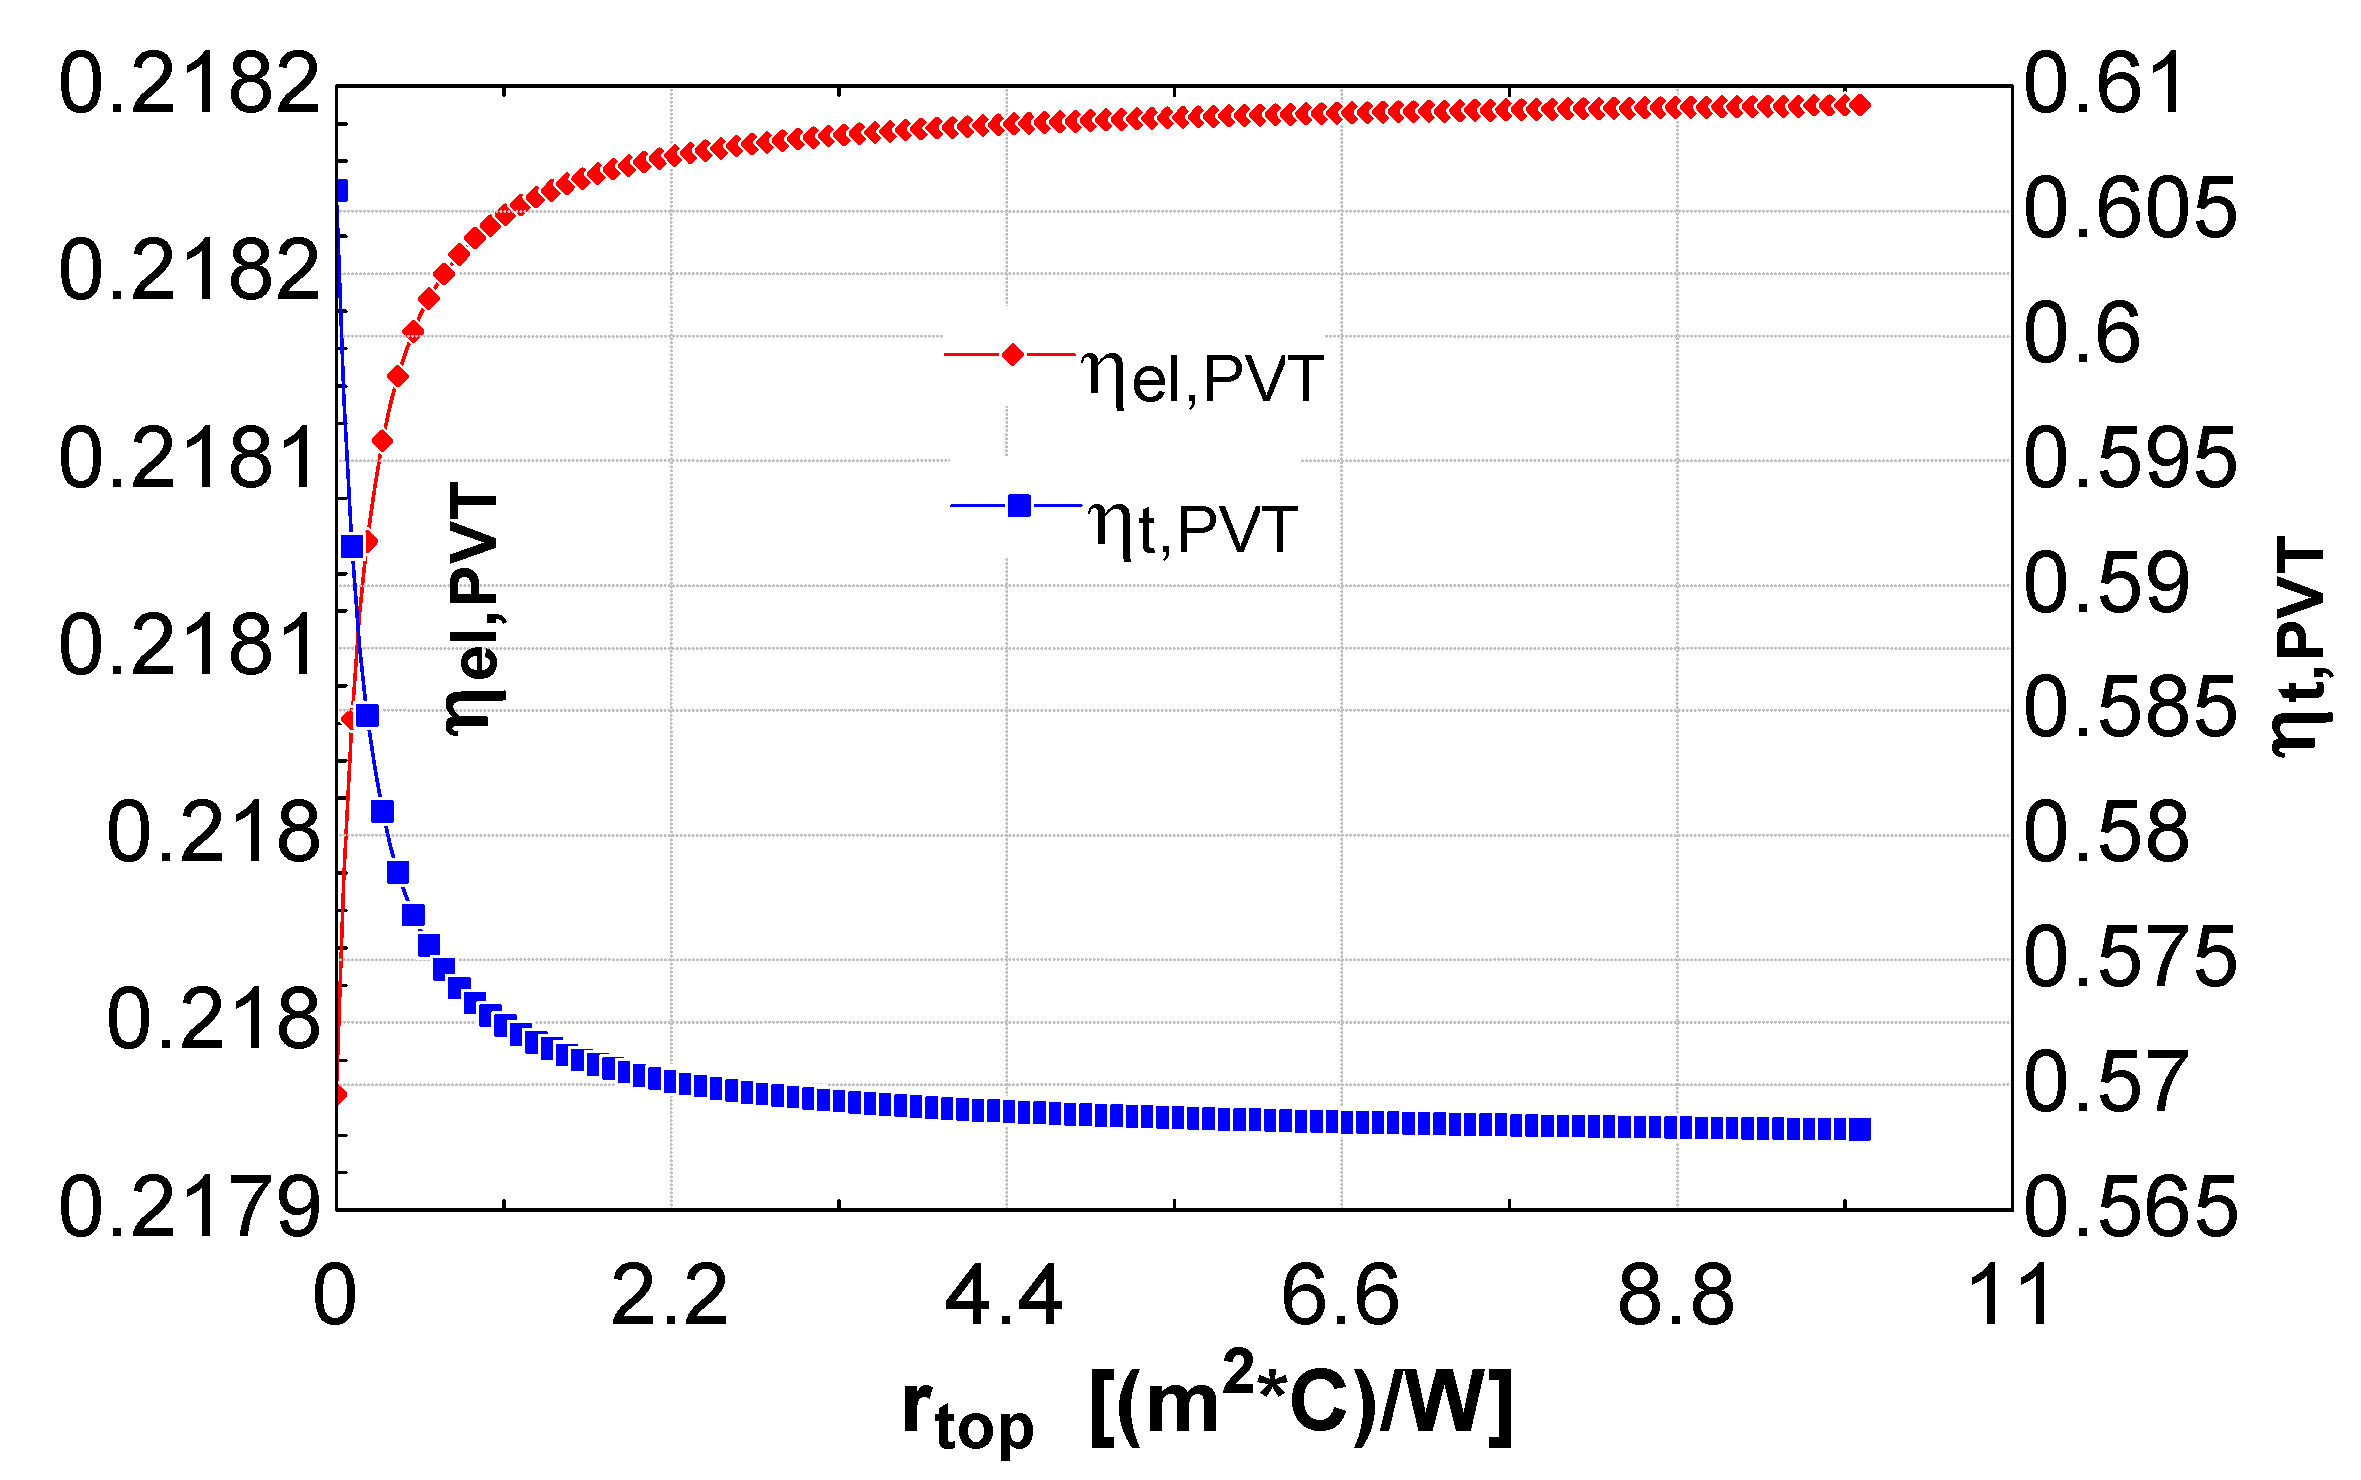
A possible alternative to the CPVT layout discussed in this paper may consist in a thermal insulation of the top surface of the receiver [
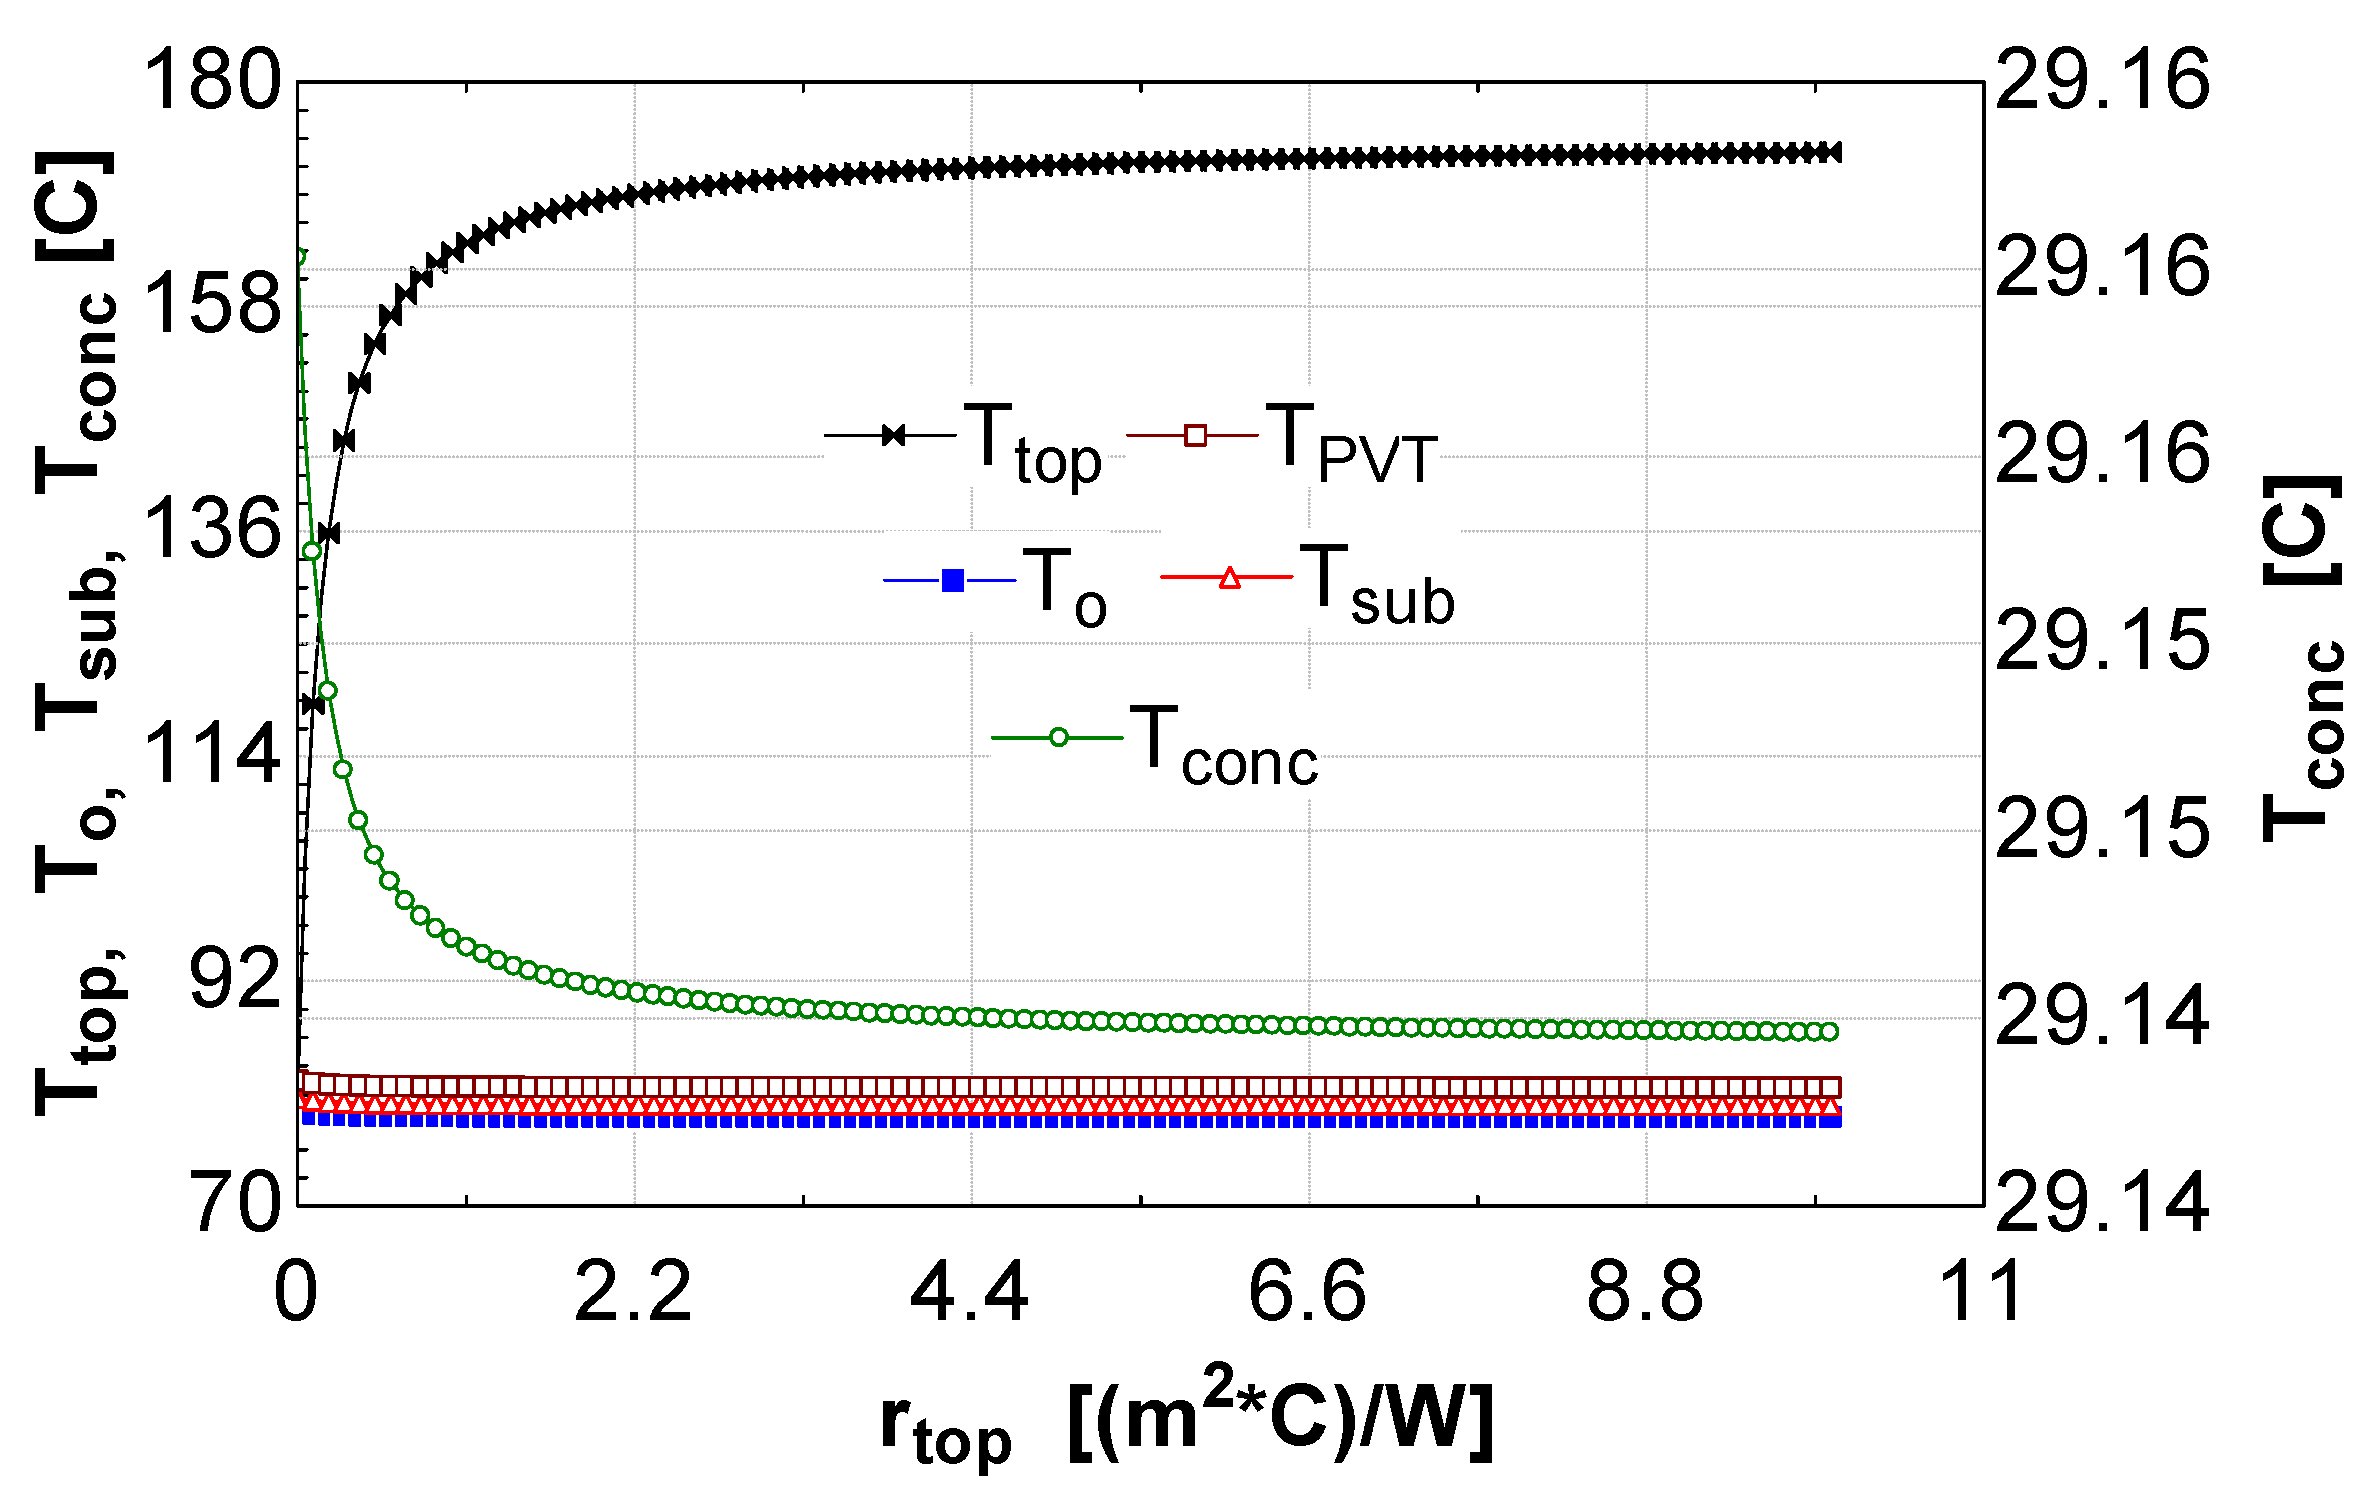
19]. This arrangement could reduce thermal losses but would also reduce the radiative heat absorbed by that surface. In order to analyze this possibility, the top thermal resistance was varied in a very wide range, whose lower bound could be representative of no insulation, whereas the upper bound is achieved only in case of good thermal insulation. The results of this analysis showed that both thermal efficiency and thermal power dramatically decrease with higher insulation (
Figure 14). Conversely, variations of electrical efficiency and electrical powers are marginal (
Figure 14). This is due to the fact that an increase of top insulation determines a dramatic increase of top surface temperature (
Figure 15) whereas the temperatures of the remaining layers of the CPVT do not significantly vary (
Figure 15 shows only a slight decrease). In fact, a higher insulation inhibits the heat transfer from the top surface to the cooling fluid, determining only an increase of the top surface temperature. As a consequence, increasing the insulation, the fluid is not capable to absorb the radiative heat coming from the top surface. This results in a local increase of the temperature in the top surface and in a general decrease of the CPVT temperatures (including the fluid outlet temperature) determining the decrease of thermal efficiency shown in
Figure 14. Therefore, the results presented would suggest that, for the boundary conditions assumed in this study, the option of insulating the top surface is not profitable for the layout under investigation. However, these results dramatically change if different values of irradiation are considered. This is clearly shown in
Figure 16, where thermal efficiency is plotted for different values of radiation and top resistance. For low irradiation, thermal efficiency increases in case of higher insulation whereas the opposite trend occurs in case of higher solar radiation. However, this type of CPVT is typically used for locations in which the average solar radiation is high, where the top insulation would not be profitable.
Figure 14.
CPVT thermal and electrical efficiency vs. top thermal resistance.
Figure 14.
CPVT thermal and electrical efficiency vs. top thermal resistance.
Figure 15.
CPVT Temperatures vs. top thermal resistance.
Figure 15.
CPVT Temperatures vs. top thermal resistance.
Figure 16.
Thermal efficiency vs. top thermal resistance and radiation.
Figure 16.
Thermal efficiency vs. top thermal resistance and radiation.


