Article

Cost Benefit Analysis of Using Clean Energy Supplies to Reduce Greenhouse Gas Emissions of Global Automotive Manufacturing

1
Department of Mechanical Engineering, University of Wisconsin Milwaukee, Milwaukee, WI 53201, USA
2
School of Mechanical Engineering, Chongqing University, Chongqing, 400044, China
3
Manufacturing Systems Research Lab, Global Research and Development, General Motors Company, Warren, MI 48090, USA
*
Author to whom correspondence should be addressed.
Energies 2011, 4(10), 1478-1494; https://doi.org/10.3390/en4101478
Submission received: 14 July 2011 / Revised: 19 September 2011 / Accepted: 22 September 2011 / Published: 28 September 2011
(This article belongs to the Special Issue Technologies to Achieve Greenhouse Gas Mitigation)

Abstract

:
Automotive manufacturing is energy-intensive. The consumed energy contributes to the generation of significant amounts of greenhouse gas (GHG) emissions by the automotive manufacturing industry. In this paper, a study is conducted on assessing the application potential of such clean energy power systems as solar PV, wind and fuel cells in reducing the GHG emissions of the global auto manufacturing industry. The study is conducted on the representative solar PV, wind and fuel cell clean energy systems available on the commercial market in six representative locations of GM’s global facilities, including the United States, Mexico, Brazil, China, Egypt and Germany. The results demonstrate that wind power is superior to other two clean energy technologies in the economic performance of the GHG mitigation effect. Among these six selected countries, the highest GHG emission mitigation potential is in China, through wind power supply. The maximum GHG reduction could be up to 60 tons per $1,000 economic investment on wind energy supply in China. The application of wind power systems in the United States and Germany could also obtain relatively high GHG reductions of between 40–50 tons per $1,000 economic input. When compared with wind energy, the use of solar and fuel cell power systems have much less potential for GHG mitigation in the six countries selected. The range of median GHG mitigation values resulting from solar and wind power supply are almost at the same level.

1. Introduction

Automotive manufacturing is energy-intensive [1]. Greenhouse Gases (GHGs) are generated in automotive manufacturing, from both the direct on-site consumption of fossil fuel energy and indirectly from consumption of purchased electricity. As estimated, the manufacture of a typical vehicle requires approximately 120 Giga Joules of energy input [2]. In 2007, GM consumed a total of 5.543 × 10¹⁶ Joules energy in its U.S. facilities, which includes 2.149 × 10¹⁶ Joules of energy supply from purchased electricity; the total energy consumption of GM generated 6.263 million metric tons of CO2 emissions, which includes 4.359 million metric tons from purchased electricity [3].
Aware of the significance of global warming resulting from GHG emissions, the global automotive industry has worked intensively to reduce the GHG emissions from their production facilities and manufacturing processes. The Alliance of Automobile Manufacturers (AAM), formed by such major global automotive manufacturers as GM, Ford, Chrysler, Toyota, Mitsubishi, Mercedes, Porsche, Volkswagen, Volvo, and Jaguar, committed to achieve a 10% reduction in greenhouse gas emissions per number of vehicles produced from their U.S. automotive manufacturing facilities by 2012 measured from a base year of 2002 [4]. During the time period between 2002 and 2005, the AAM members has already reduced the GHG emissions intensity of their U.S. facilities, measured as CO2 emissions per number of vehicles produced, by nearly 3% [4].
In reducing the GHG emissions, GM has implemented energy efficiency improvement efforts and conversions to lower GHG emitting fuels such as switching from coal to natural gas for the operation of boilers [3]. In statistics, GM facilities have participated in a total of 1753 improvement projects from 1991–2007, which led to a total reduction of GHG emissions of over 17 million metric tons CO2 equivalent [3]. Through such efforts, GM has significantly improved the capacity utilization of its facilities operations. In terms of the CO2 emission intensity of its facilities in the United States, GM has decreased its CO2 emission per vehicle built from 2.71 metric tons/vehicle in 1990 to 2.2 metric tons/vehicle in 2007 [3]. However, despite such significant efforts in GHG mitigation, the total CO2 emissions from GM’s U.S. facilities still stand at over 6.0 million metric tons each year, due to the large volume of production [3]. Further reduction of GHG emissions from GM’s production facilities is difficult since approximately 70% of the total energy consumption is from purchased electricity [3].
As the current electricity supply relies heavily on fossil fuel energy sources, further reduction of GHG emissions could be possibly achieved by using clean energy supplies to partially replace the current grid power supply of automotive production facilities, since the GHG emission intensity of clean energy technologies are much less than that of grid power supply [5]. In order to aid the global automotive industry in understanding the potential application of clean energy technologies in reducing the GHG facility emissions, a quantitative study is conducted in this project in cooperation with the General Motors Company on assessing the potential application of clean energy power systems in the efforts of GHG emission mitigation from the production facilities of global automotive manufacturers.
There are quite a few clean energy technologies for power generation available on the commercial market. Considering the specificity and requirements of automotive production facilities as well as the maturity and adaptability of the various clean energy technologies, three such clean energy power systems, namely solar PV, wind and fuel cells have good potential in stationary power supply and GHG emission reduction for automotive manufacturing industry [5]. In this study, we selected a number of representative power systems based on these three clean energy technologies to assess their potential application in GHG mitigation at automotive manufacturing facilities located at different global geographical locations.
The production facilities of global automotive manufactures are spread all over the world, with very different geographical conditions and power supply situations. For instance, GM as a leading global automotive manufacturer has its production facilities in 31 countries and has its business operations in 157 countries throughout the world [6]. In this study, we selected six representative locations from GM’s major global production facility list to represent the six different regions of the world, including Detroit (United States), Mexico City (Mexico), Sao Paulo (Brazil), Shanghai (China), Cairo (Egypt) and Bochum (Germany), as shown in Figure 1 below:
Figure 1. Six selected geographical locations of GM production facilities.
Energies 04 01478 g001
In this study, the cost benefit of using the three clean energy technologies, namely solar PV, wind, and fuel cells, was quantitatively assessed for their application in reducing the GHG emissions of automotive manufacturing facilities. The cost benefit analysis results are intended for decision support of global automotive manufacturers in selecting the appropriate clean energy technologies and optimizing the GHG mitigation effect of the same economic investment. The three clean energy technologies are benchmarked on their technology aspects, application potential (in terms of economic costs of GHG reduction) as well as the possible reduction range of GHG emissions at the six selected locations. The analysis results presented in this paper should be useful in providing detailed quantitative information, integrating the technology characteristics of clean energy power systems and geographical differences of local power generation and supply conditions, for robust decision support in GHG emission mitigation by the global automotive and similar manufacturing industries.

2. Clean Energy Power Systems

Solar PV, wind and fuel cells have seen rapid development and deployment in the past two decades. Statistical data shows that by the end of 2008, the worldwide installed wind power capacity had reached 121 GW, and the grid-connected solar PV capacity was 13 GW [7]. Between 2004 and 2008, the global annual production of solar PV increased nearly six-fold [7]. Applications of clean energy power systems are evolving in a wide range of industrial sectors and different geographical locations around the world. Solar PV, wind and fuel cells are considered as clean energies because these power systems produce fewer emissions than the conventional grid power supply industry. However, such clean energy technologies are not completely clean. Certain amounts of emissions are still produced in various phases of their life cycle, including raw material acquisition, manufacturing, end-of-life, etc. When it comes to employing such clean energy technologies to replace the conventional grid power supply for the global manufacturing industry, the lifecycle GHG emissions of such clean energy technologies must be considered in the assessment of the overall GHG mitigation potential of such applications. In the section below, we will briefly introduce the solar PV, wind and fuel cell power systems selected for this study and the associated life cycle emissions for power generation and supply used in this assessment.

2.1. Solar PV System

Solar photovoltaic systems use the photoelectric effect of semiconductor materials to convert sunlight directly into electricity. The major component of PV systems is the solar module, normally a number of cells connected in series. Solar PV power systems produce negligible emissions during their operation and maintenance, but there are still emissions associated with other lifecycle phases of a solar PV power system, including raw material acquisition and production, system manufacturing, and end-of-life.
The electricity generation of solar PV depends on the solar insolation level the PV system is exposed to, which is closely linked to the geographical location where the PV system is deployed. In general, the actual power output of a Solar PV system in terms of AC electricity supply can be calculated through the following expression:
A C o u t = n m × I a v e × A m × e m × f DC-AC
where:
  • ACout: actual power output, AC electricity (kWh)
  • nm: number of PV modules
  • Iave: average annual solar insolation (kWh/m2/year)
  • Am: surface area of one PV module (m2)
  • em: module efficiency
  • fDC-AC: DC-AC conversion efficiency
There are quite a number of commercial solar PV systems developed by various manufacturers. These solar PV modules have different technical power generation parameters, and accordingly selection of PV modules will have a direct influence on the GHG mitigation potential results. In this study we assume there is no preference for using a specific PV module for power supply in the global automotive manufacturing. We selected five multi-crystalline solar PV modules that are considered as representative PV modules in power plant development. These five PV modules selected are the top five modules in terms of their current production volume and installed capacity in the world [8]. The detailed product information and the technical specifications of the selected five PV modules are listed in Table 1 below. In the quantitative analysis, the technical parameters of the solar PV power supplies are taken as those average values of the technical specifications of the selected five solar PV modules.
Table 1. Selected solar PV module for power supply in global automotive manufacturing.
Solar PV ModuleManufacturerRated Module Power (W)Module EfficiencyModule Surface Area (m2)
Suntech STP210-18/UdSuntech21014.30%1.47
Sharp ND-224uC1Sharp22413.74%1.63
Qcells Q.BPPARROSOE 225Q-Cells22517.00%1.67
YL 210 P-26b/1495x990Yingli Solar21014.20%1.48
Trina Solar TSM-PC05Trina Solar23014.70%1.64

2.2. Wind Energy

Wind is another form of solar energy, generated by uneven solar heating of the earth’s land and sea surfaces. Among the new renewable energy sources (excluding large hydropower), wind power is the largest addition to the renewable energy capacity [7]. Statistical data shows that the wind power installations have increased significantly in recent years, with a 29% increase in 2008, and reaching a total of 121 GW, while the installed wind power capacity in 2004 was only 48 GW [7]. The rapid increase of wind power capacity in 2008 came mainly from the increased number of installations in such countries as the United States (8.4 GW added), China (6.3 GW), India (1.8 GW), and Germany (1.7 GW) [7].
Wind power output is dependent on the wind energy density of the geographical location where the wind turbine is installed. At a specific location, environmental parameters such as wind speed and air density (related to temperature, atmospheric pressure and altitude) jointly determine the wind energy density. The wind speeds vary with the height above the surface of the earth, and the wind speed values obtained from the public reports are typically for 10 or 50 m height above the ground. Wind speed at other heights can be obtained by using the following transformation [9]:
v z = v 0 ( z z 0 ) k
where:
  • vz: wind speed at z m height above the ground (m/s)
  • v0: wind speed at specified height of z0 (m/s)
  • z0: specified height (m)
  • k: Hellman exponent (k = 0.34)
In Equation (2), the Hellman exponent value is a key parameter. The k value depends on the location and the shape of the terrain on the ground and the stability of the air [10]. In urban areas, the k = 0.34 value is usually selected for the condition of neutral air above human inhibited areas [10]. As a result, the wind power density can be calculated through the following expression [11]:
W = P A = 1 2 ρ × v z 3 × Γ ( λ + 3 λ )
where:
  • W: wind power density (W/m2)
  • P: air pressure (Pa or N/m2)
  • A: area (m2)
  • ρ: air density (kg/m3)
  • vz: wind speed at z m height (m/s)
  • λ: the dimensionless Weibull shape parameter
On the commercial market, there are quite a large number of wind turbines developed with different power capacity levels for use under different wind energy density conditions. Typical power capacity of a wind turbine for industrial scale application ranges from 1.0 MW to 4.0 MW. Different wind turbines operate differently under different wind speeds and have different power outputs corresponding to the wind speed input. As the analysis conducted in this project is to partially supply the energy needs of automotive manufacturing facilities, the wind turbines are selected on the lower end of the rated power range. In this analysis, four wind turbines of 1.5 MW rated power output are selected for analysis of their potential application in reducing the GHG emissions of the global automotive manufacturing industry. These four wind turbines are considered representative of the wind turbines at their level of capacity based on the fact that these four wind turbines have the largest installed capacity throughout the world [12]. Although wind technology is considered more environmentally benign than the conventional grid power supply, there are still environmental emissions associated with the life cycle of a wind turbine. The detailed product information and the technical specifications of the four wind turbines are shown in Table 2 below. In the analysis, we use the average values of the technical specifications of these four wind turbines as representative parameters of wind power system at the 1.5 MW level.
Table 2. Selected wind turbines for power supply in global automotive manufacturing.
Wind TurbineManufacturerRated Capacity (kW)Rotor Diameter (m)Sweep Area (m2)
1.5XLEGE150082.55346.00
SL1500/77Sinovel150077.44705.13
S82 1.5 MWSuzlon1500825281.02
S77 1.5 MWNordex1500825281.02

2.3. Fuel Cell

Fuel cells are electrochemical devices. A fuel cell is very much similar to a battery in its mode of electricity generation. The major difference between a fuel cell and a battery is that a fuel cell needs a continuous supply of fuels to produce electricity, while a battery has chemicals stored inside that react and produce electricity.
Fuel cells can be used for large-scale industrial power supply when sufficient amounts of fuels are supplied continuously into the system. Typical fuel cells are developed to use hydrogen (or hydrogen fuels) to produce electricity. Taking hydrogen as an example, the chemical reaction within the fuel cell system can be described as follows:
Anode side:
2 H 2 4 H + + 4 e
Cathode side:
O 2 + 4 H + + 4 e 2 H 2 O
Net reaction:
2 H 2 + O 2 2 H 2 O
When using hydrogen as fuel, a fuel cell power system only produces water emissions during operation, and no GHG emissions. Accordingly, the use of fuel cell power systems can significantly reduce the GHGs emissions compared to conventional power supplies. However, currently there are quite a number of challenges associated with hydrogen fuel production, storage and use in fuel cells. As a result, natural gas is more commonly used in stationary fuel cell power systems. Although the natural gas consumed in a fuel cell power system is only involved in the oxidation process, instead of burning, the carbon elements of natural gas are still converted into CO2 emissions from the following reaction process:
C H 4 + 2 H 2 O = C O 2 + 4 H 2
If a natural-gas based fuel cell power system will be used, a quantitative trade-off analysis must be conducted to evaluate the GHG mitigation potential of the fuel cell power system, between the life cycle GHG emissions of a fuel cell power system and the GHG emissions of the conventional grid power supply, based on the same amount of electricity consumption.
Fuel cells have an advantage over solar and wind energy in that fuel cells are not limited by geographical conditions. The power efficiency of the fuel cell power systems can always be maintained at the rated output level and it can provide a steady power supply as long as sufficient fuels are supplied continuously into the system. Currently, fuel cells are mainly developed as mobile energy sources for transportation applications. For stationary power generations, there are only a few models available in the United States. In this analysis, two fuel cell stationary power systems are selected, with one system using hydrogen fuel, and the one using natural gas. The selected fuel cell power systems are listed in Table 3 below, with their detailed product information and technical specifications.
Table 3. Selected fuel cell stationary power system for electricity generation.
Stationary Fuel CellsManufacturerFuel TypeRated Power (kW)
PureCell 200UTC PowerNatural gas200
Nedstack PS100NedstackHydrogen100

3. GHG Emission Mitigation through Clean Energy Supply
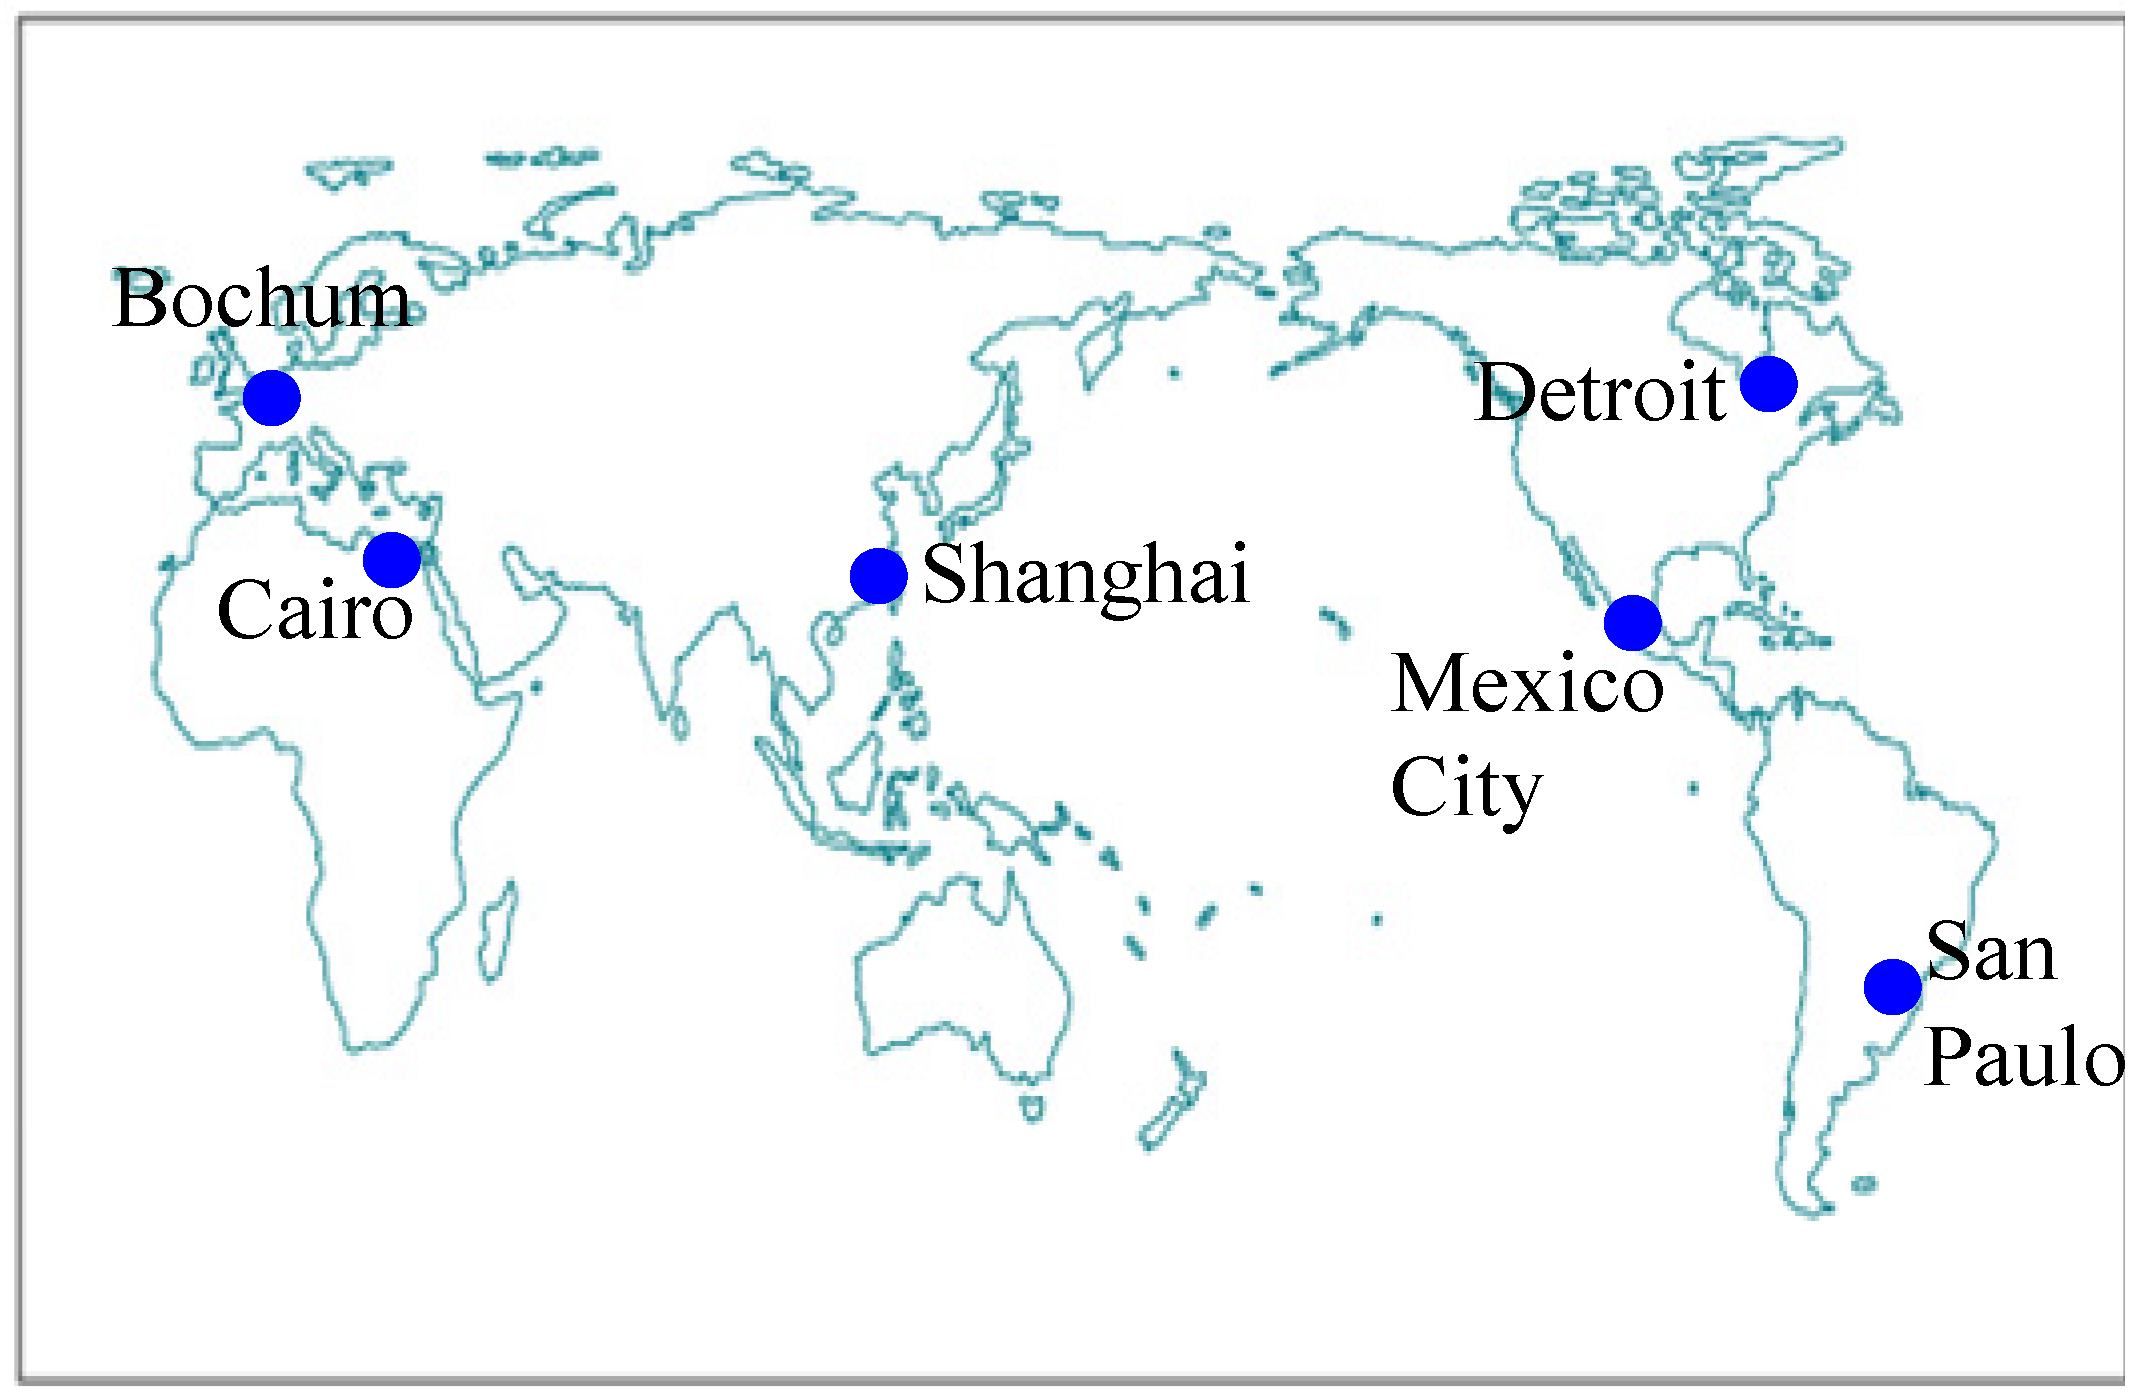
The selected three clean energy technologies have different GHG mitigation potential at different locations. Solar PV and wind power systems are dependent on geographical conditions in particular. During the assessment of the application potential of the three clean power systems, the geographical conditions of these six locations are integrated into the analysis to calculate the actual power output of solar PV and wind power systems. The application potential of the three clean power systems are analyzed in three aspects: capacity factor of the clean energy power system, amount of GHG reduction on a unit economic cost scale, and the potential reduction range of each clean energy system in the six countries selected.
The geographical differences of solar energy among the six selected cities are characterized by the average amount of the total solar radiation incident on a horizontal surface on an annual base. The solar insolation data used in this analysis were the data collected by NASA for that geographical location during a 22-year time period (from July 1983 to June 2005) [13]. The solar PV module efficiency used in the analysis is the average of the five efficiency values of the selected solar PV modules in Table 1, namely 14.79%, as a representative of solar PV in that class. Since the solar PV power system produces DC power output, for supplying automotive manufacturing the solar PV DC power output must be converted to AC power prior to its actual use. In this analysis, the conversion efficiency from DC to AC power supply is taken as the typical value of 77% [14].
The geographical differences of wind energy are characterized by the differences of wind speed and wind power density among the six selected locations. The wind speed data for the six selected cities are the data collected by NASA during a 10-year time period (from July 1983 to June 1993) [15]. The NASA wind speed data are collected only for 50 m height above the ground, while the average height of the selected four wind turbines is 80 m. In our analysis, the NASA 50 m data are transformed to 80 m wind speed data using Equation (2):
The solar and wind power density values for the six selected cities are shown in Table 4 below. For solar energy application, the results show that Cairo has the highest potential while Bochum has the lowest; for wind energy, Bochum has the highest potential while Mexico City has the lowest. Since fuel cell power systems depend on fuel supply instead of geographical conditions, they are not listed here.
Table 4. Solar and wind power density in the selected six locations [9].
DetroitMexico citySao PauloShanghaiCairoBochum
Solar insolation (kw/m2/year)1269.901890.701661.361410.731929.03986.11
Wind power density (w/m2)356.3676.50116.59352.08213.01591.78

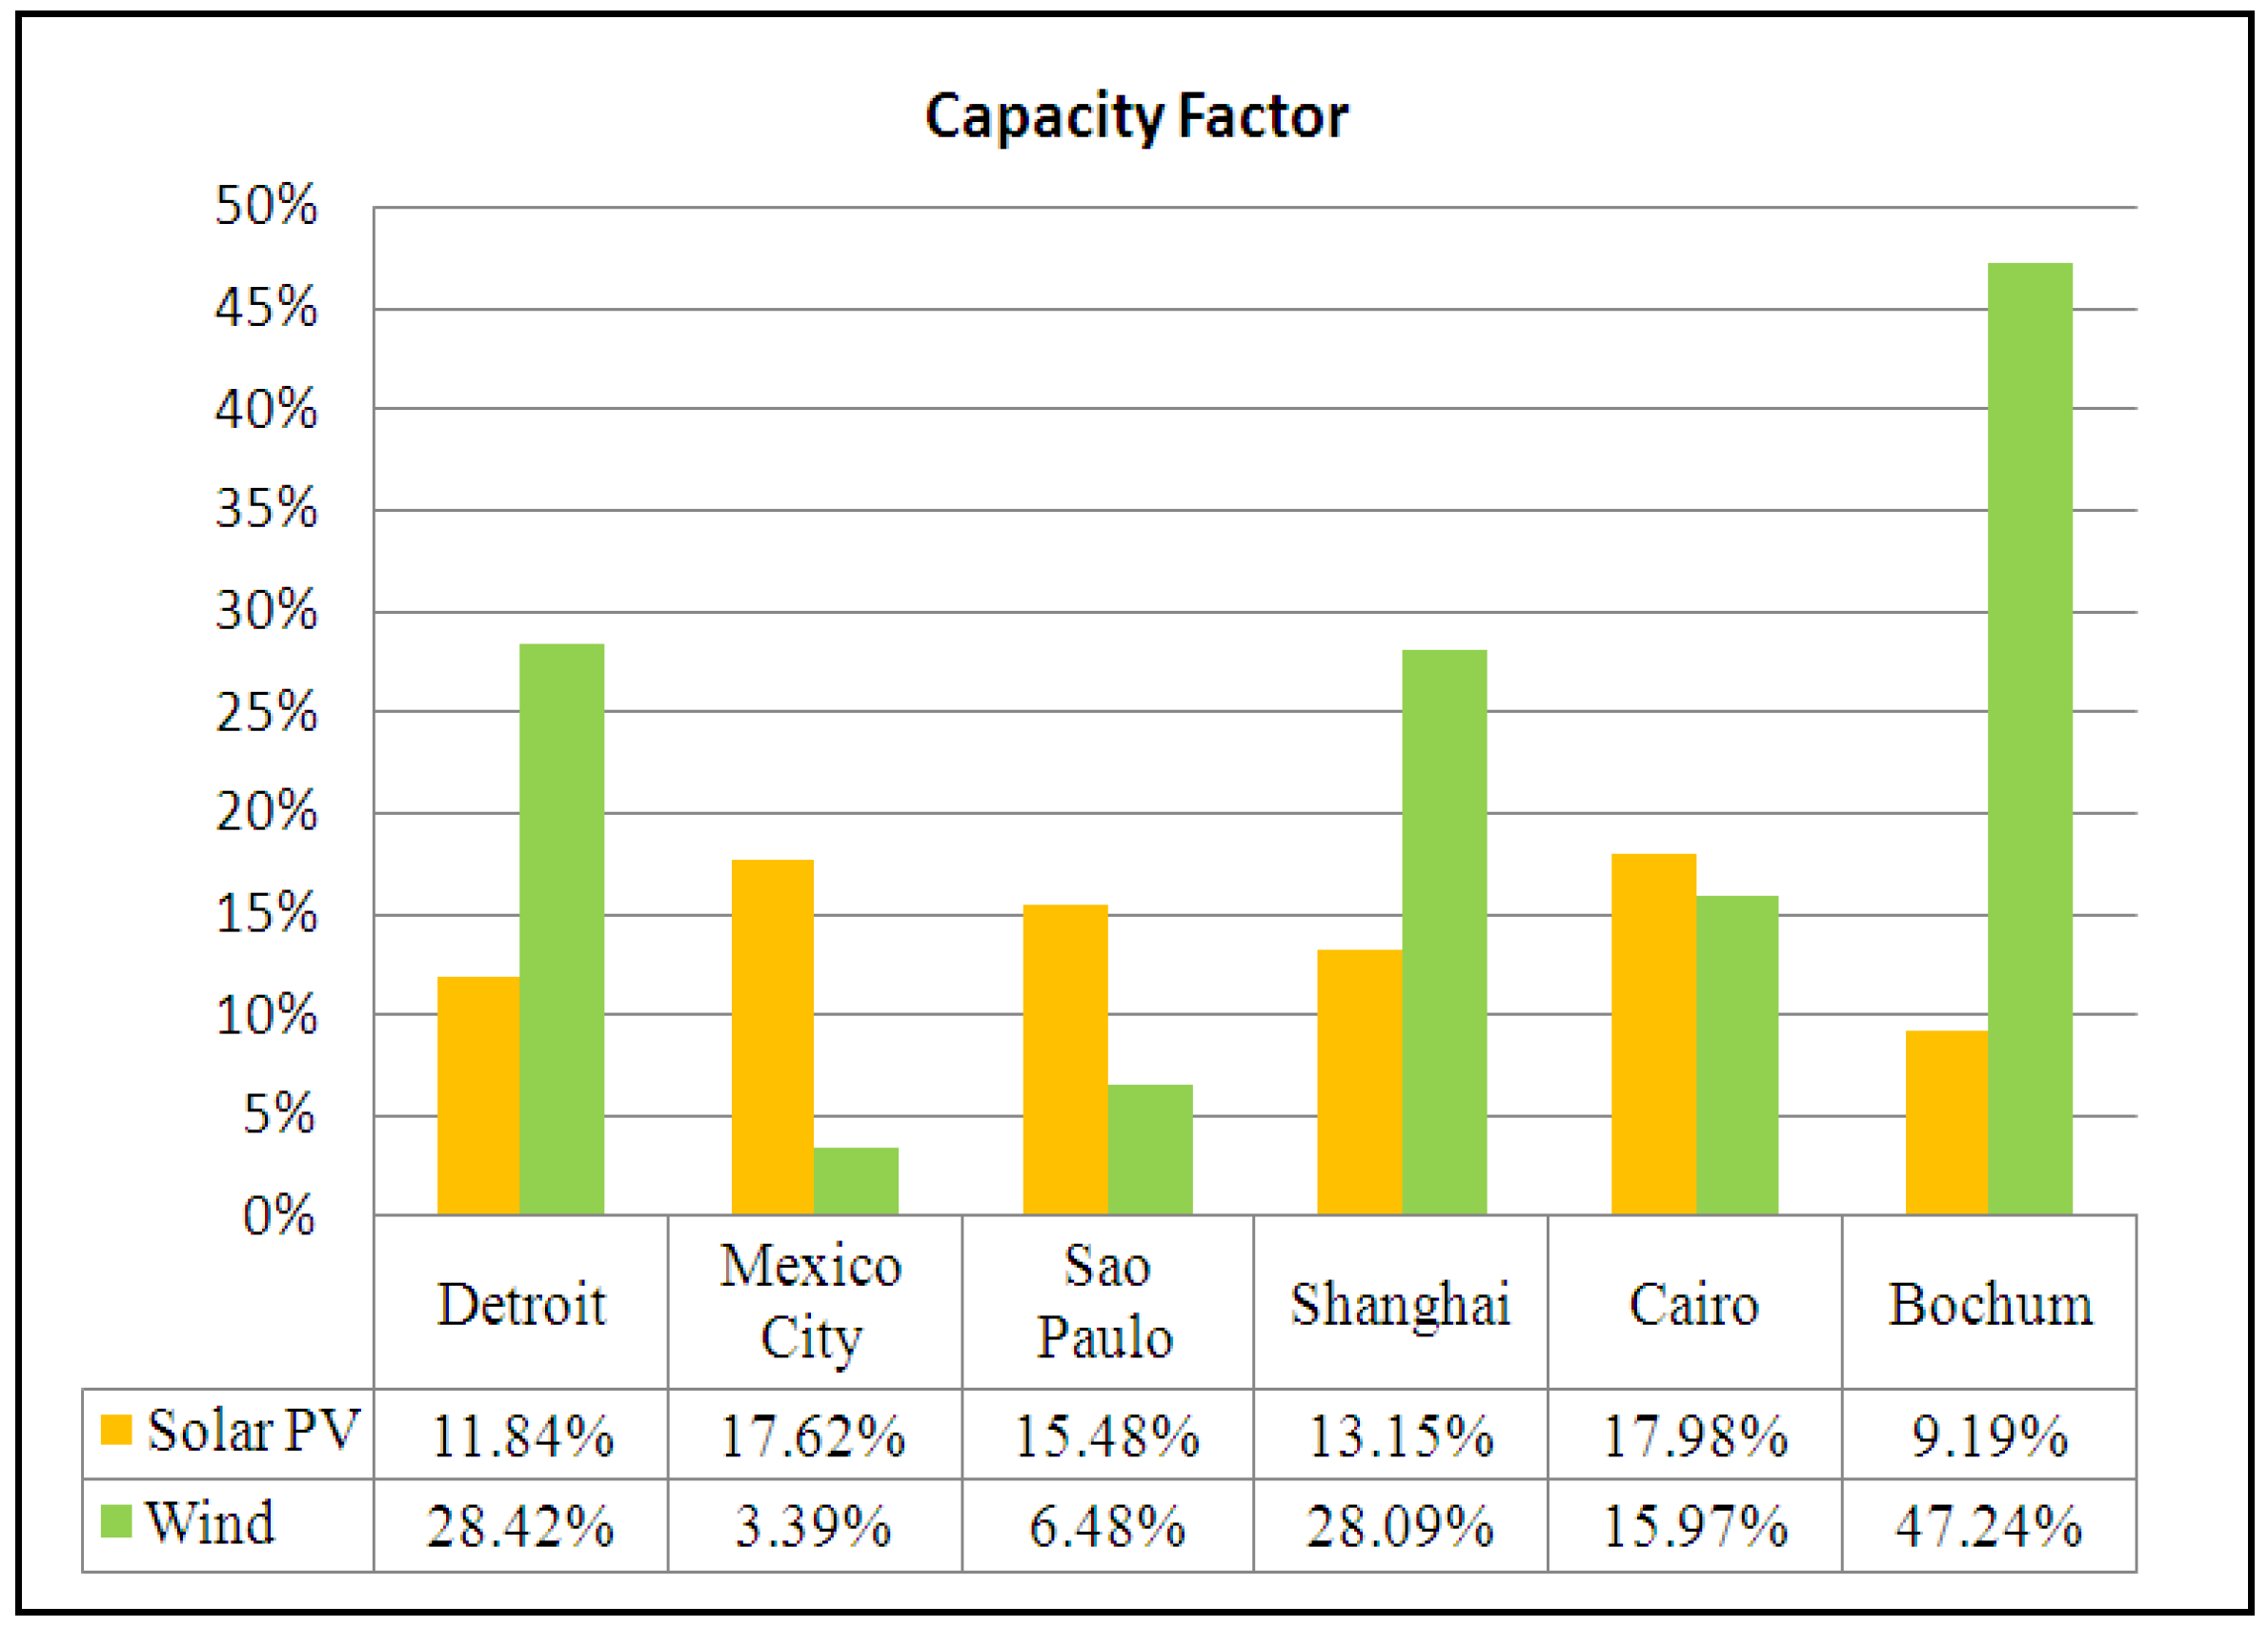
3.1. Capacity Factor of Solar and Wind Power Systems

Although the energy density information can serve as the basic indicator of the application potential of clean energy power systems, further analyses are needed to understand more about the actual implementation of these clean energy power systems in different geographical locations. For solar and wind energy, we employ the capacity factor, a meaningful metric to assess their actual application potential in a specific geographic location, to assess the performance the clean energy systems at the selected locations. The capacity factor is defined as the ratio between the actual power output and the total rated power of the system available for the power generations. The expression of capacity factor is shown in Equation (4) below:
C F = P o u t p u t P s y s t e m × 100 %
where:
  • CF: capacity factor of a power supply system
  • Poutput: actual power output of the supply system (kW)
  • Psystem: rated power of the supply system (kW)
The calculated capacity factors for solar PV and wind power systems at the six selected geographical locations are shown in Figure 2. The actual power output for solar PV system is calculated by multiplying the local annual solar insolation, the module area, module numbers, module efficiency and the DC to AC conversion efficiency. The actual power output for wind turbines is calculated by applying the power curve of the wind turbine model. The power curve of a specific model of wind turbine is fitted by the power output values at different wind speeds supplied by the wind turbine manufacturer. The results demonstrate that for current solar PV power systems, the actual capacity factors are all below 20% at these six selected locations; while the capacity factor of wind can reach up to 47% at the six selected locations, depending on the local wind energy resources.
Figure 2. Capacity factor of solar PV and wind power systems at the six selected locations.
Energies 04 01478 g002
From Figure 2, we can see that Cairo has the largest capacity factor for solar PV at 17.98%, followed by Mexico City (17.62%) and Sao Paulo (15.48%). The capacity factors for solar PV in Shanghai, Detroit and Bochum are 13.15%, 11.84% and 9.19%, respectively. From the comparison of the capacity factors at the six locations, it can be concluded that Cairo has the largest technical potential, followed by Mexico City, Sao Paulo, Shanghai, Detroit and Bochum.
For wind power systems, we find that Bochum has the largest wind capacity factor at 47.24%, followed by Shanghai (28.09%), Detroit (28.42%), Cairo (15.97%), Sao Paulo (6.48%) and Mexico City (3.39%). For the Equation (5) used in capacity factor calculations, we use the rated power as the denominator, which means for the same rated power, the larger the output power, the larger the capacity factor. For a wind turbine, the input power can be simply estimated by the following equation:
P i = D w × A S
where:
  • Pi: input power of a wind turbine (W)
  • Dw: the wind power density (W/m2)
  • AS: the sweeping area of turbine blades (m2)
From Equation (5), it can be seen that the larger the wind power density, the larger the input power. Obviously, for two wind turbines with the same efficiency, the output power is positively correlated with the input power under the wind speed conditions before the rated power is reached. From this point of view, the geographical locations with a high wind power density can lead to a large power output of a wind turbine and accordingly produce a large capacity factor. In the previous energy density analysis as indicated in Table 4, the results demonstrate that Bochum has the highest wind power density, followed by Shanghai, Detroit, Cairo, Sao Paulo and Mexico City. The capacity factor analysis results as shown in Figure 2 are consistent with the energy density results shown in Table 4.

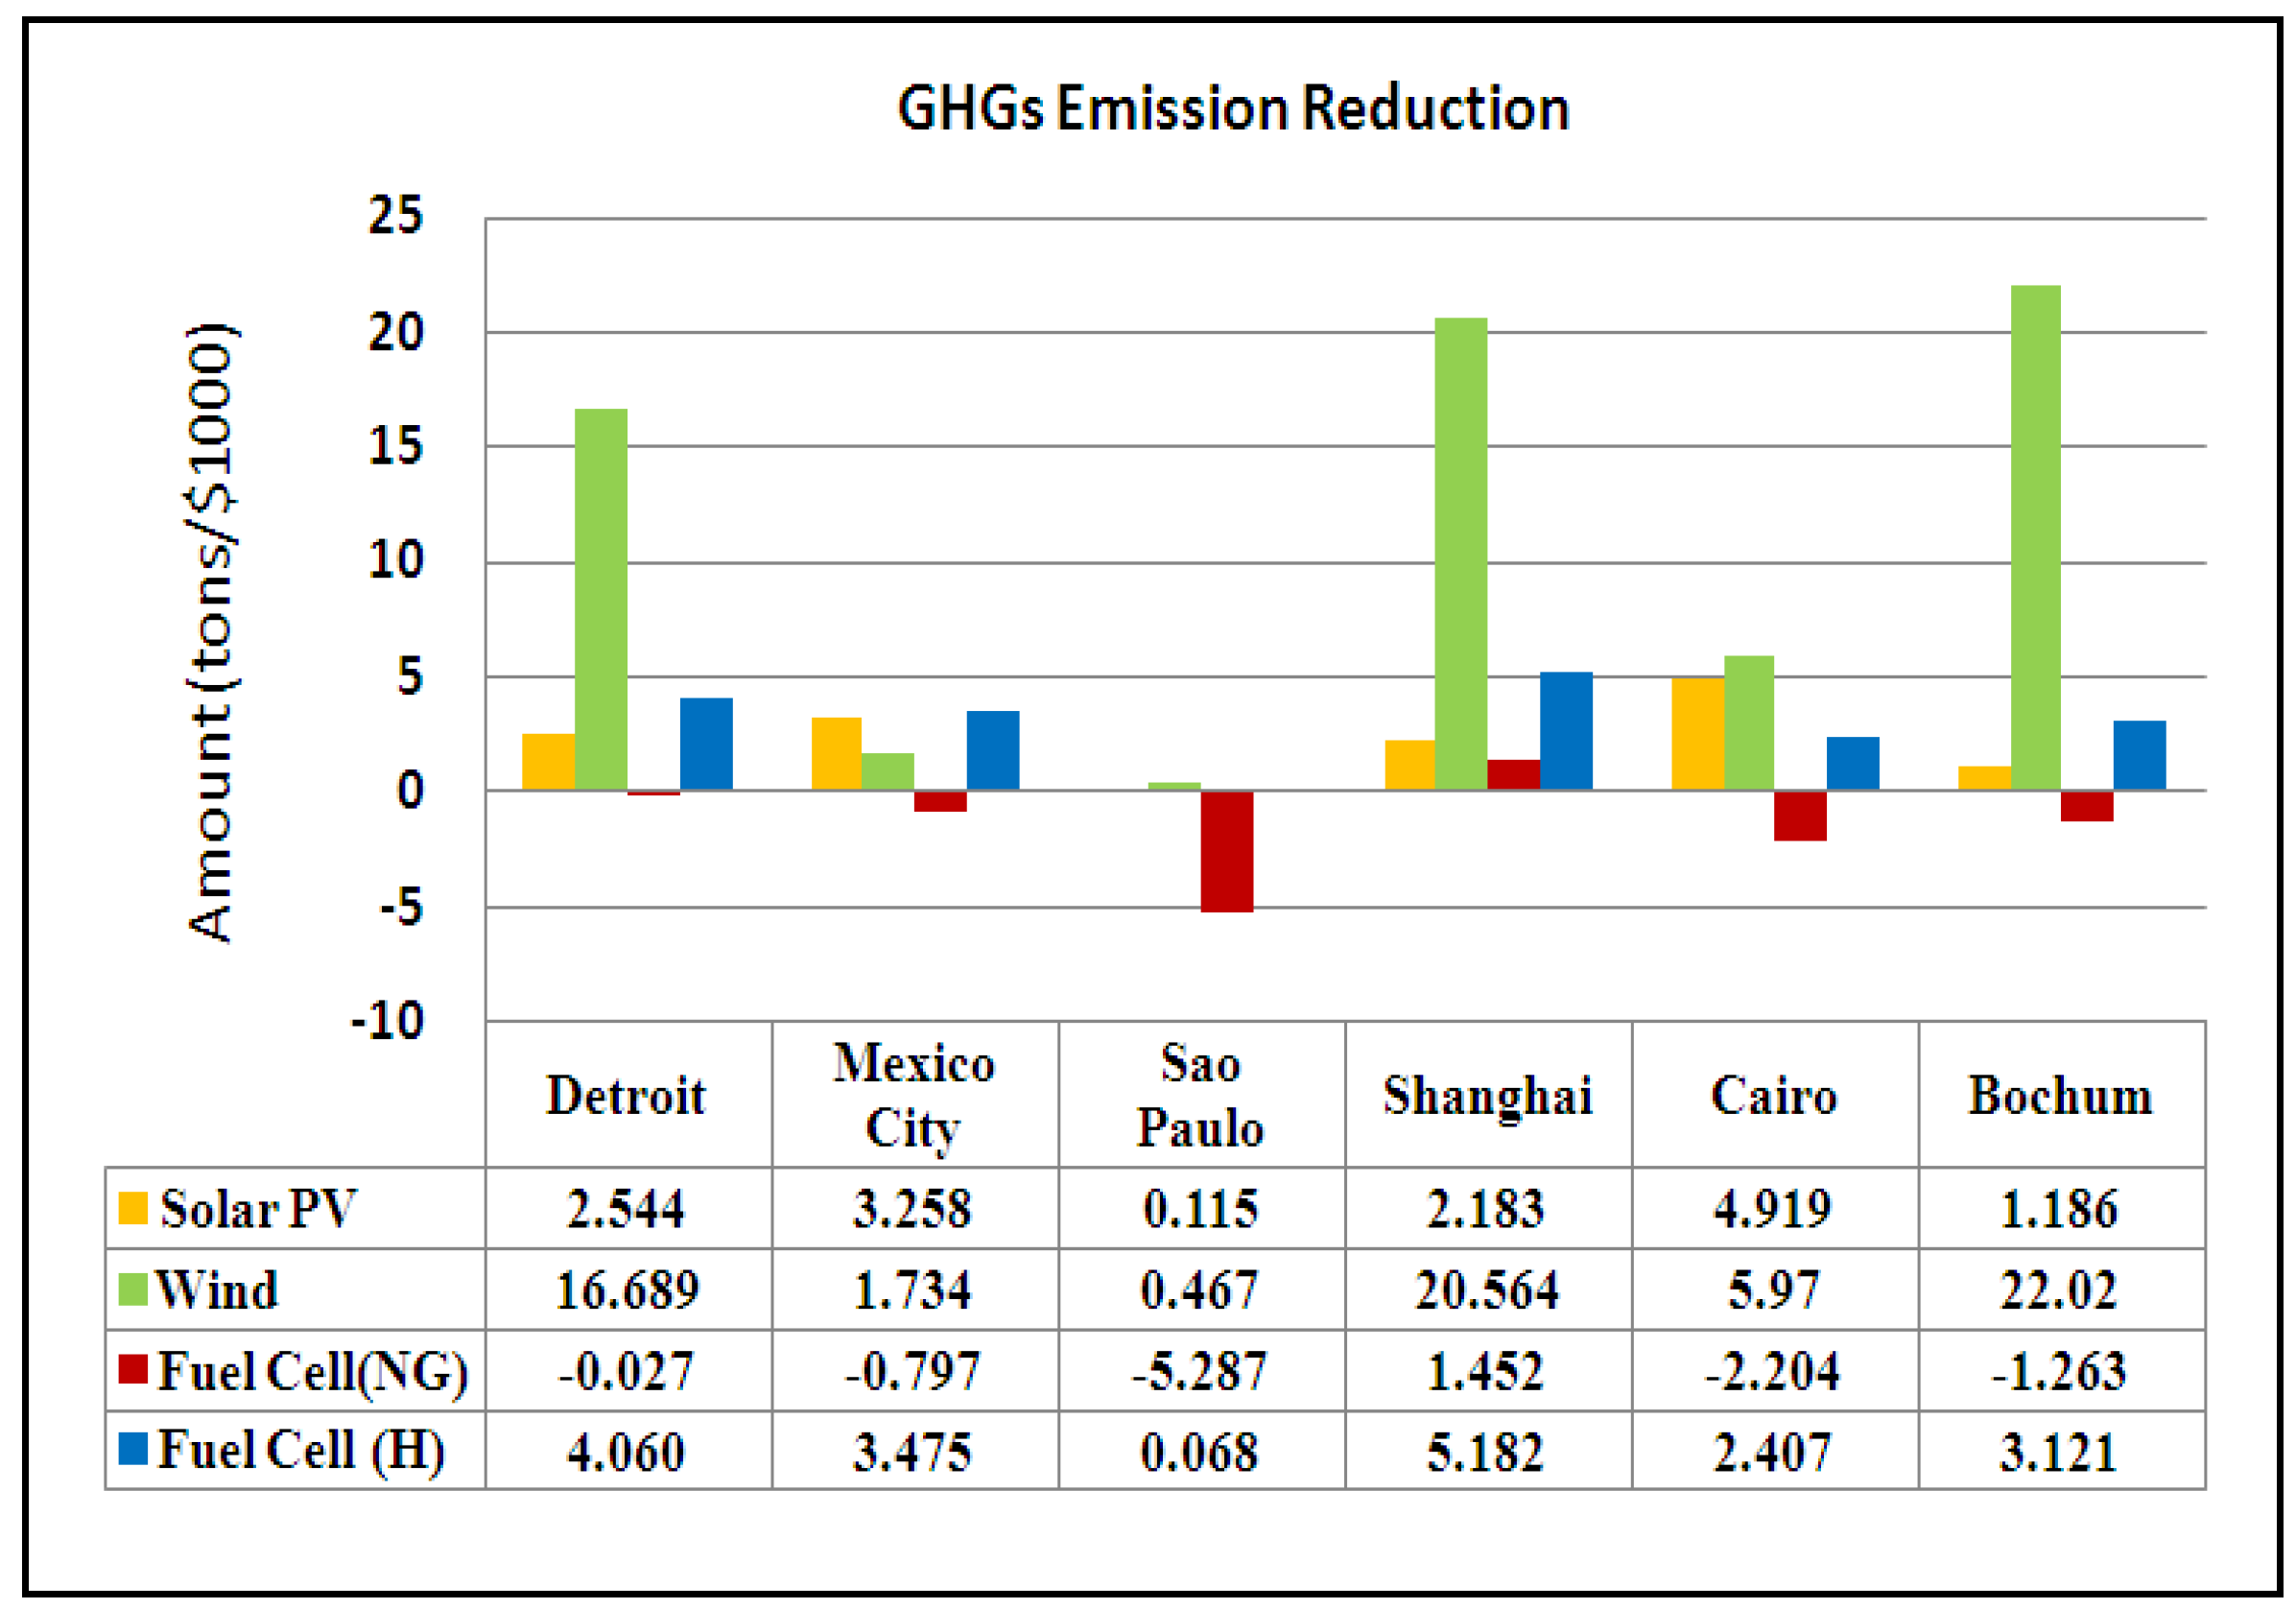
3.2. Economic Analysis of GHG Mitigation

To promote the application of clean energy supply in industrial operations for GHG mitigation, the economic performance of the mitigation efforts must be understood and quantitatively assessed to assist decision-making in industrial sustainability management and practices. In this section, we provide quantitative assessment of the GHG mitigations through the three clean energy supply patterns at the six selected geographical locations, in terms of the amount of GHGs to be reduced on a base scale of $1,000 economic input (tons GHG reduction/$1,000).
Currently, the economic costs of solar PV, wind and fuel cells are very different, but the economic costs of clean power systems within the same category, such as the five selected solar PV modules, are approximately on the same level due to the international competition between their manufacturers. In this analysis, the clean energy power systems are selected as average of the representative power systems of each clean energy type available on the commercial market. For the economic costs of each type of clean power system, we use the average economic costs data statistically collected and recently released by U.S. Energy Information Administration (EIA) for estimating the economic performance of GHG mitigation efforts through clean energy supply [16]. The economic cost data used on the solar PV, wind, and fuel cell power systems include overnight cost of each clean power system and the associated variable and fixed O&M costs [16]. The economic costs and the LCA GHG emissions used on the three clean energy power systems are shown in Table 5 below.
Table 5. Costs and GHG emissions of clean energy power systems.
Overnight Cost ($/kW)Variable O&M ($/kWh)Fixed O&M ($/kW)LCA GHG Emissions (g/kWh)
Solar PV61710.0011.9472.4 1
Wind19660.0030.9810.84 2
Fuel Cell (NG)54780.0495.78683 3
Fuel Cell (H2)10,735 50.00 52147 583 4
1 Multicrystalline Si Solar Cell, LCA result from reference [17]; 2 1.5 MW onshore wind turbine, LCA result from reference [18]; 3 Stationary Fuel Cell (natural gas), LCA result from reference [19]; 4 Stationary Fuel Cell (hydrogen), LCA result from reference [20]; 5 The cost data for hydrogen PEM fuel cells, from reference [21].
As a result, the cost benefit of the GHG mitigation through clean energy supply is assessed by using the following expression:
G = ( E l o c a l E i ) × A i × T i ( C N i + C F i ) × A i + C V i × ( T i × A i )
where:
  • G: the amount of GHG reduction (ton/$1,000)
  • Elocal: emission factor of GHGs from local grid power supply (kg/kWh)
  • Ei: the life cycle GHG emissions of clean energy i (kg/kWh)
  • Ai: total installed capacity of clean energy power system i
  • Ti: operational life time of clean power system i (h)
  • CNi: overnight cost of clean power system i ($/kW)
  • Cvi: variable O&M cost of clean power system i ($/kWh)
  • CFi: fixed O&M cost of clean power system i ($/kWh)
The GHG emission factors, Elocal, used in the economic analysis are the total CO2eq values calculated based on the IPCC Global Warming Potential (GWP), as shown in Table 6 below for the six selected cities.
Table 6. GHG emission factors of local grid power supply.
RegionEmission Inventory (g/kWh)
CO2CH4N2OCO2eq 3
USA 16760.018150.01053680
Mexico 25930.016760.00230594
Brazil 2930.002510.0010693
China 28390.014580.01841845
Egypt 24360.013650.00177437
Germany 25390.006370.00779542
1 The U.S. electricity emission factors are from reference [22]. 2 The international electricity emission factors are from reference [23]. 3 The CO2eq are calculated based on the GWP values from reference [24].
In the economic analysis, the amounts of GHG reductions are calculated separately for natural-gas fuel cells, and hydrogen fuel cells. The results (tons GHG reduction/$1,000 economic input) are shown in Figure 3 below. The calculated results in Figure 3 show the different mitigation effects of clean energy supply patterns based on the same amount of investment scenario at the six selected global locations.
Figure 3. Economic analysis of GHG mitigation through clean energy supply.
Energies 04 01478 g003
The calculated results in Figure 3 indicate that wind has the greatest application potential among the three types of clean energy power systems for GHG emission mitigation, in particular at those locations with high wind energy density and/or high GHG emissions from local grid power supply. Application of wind in Bochum and Shanghai can achieve a GHG reduction over 20 tons per $1,000 economic input, while the application of wind in such cities as Mexico City and Sao Paulo has almost negligible mitigation effects.
Although solar PV systems are considered very clean in the usage phase, the high cost of PV systems and the relatively high emissions from their manufacturing and material production stages make solar PV much less preferable than wind for GHG emission mitigation. From Figure 3, the best mitigation effects from solar PV systems are only at the level of a quarter of the mitigation effects from wind applications, based on the same economic input scale.
The economic performance of fuel cell power systems is closely related to the type of fuel used. The natural gas based fuel cells, due to the CO2 emission from the consumed natural gas, in most cases will further increase the total GHG emissions. The results in Figure 3 indicate that the GHG mitigation through natural gas based fuel cell power system is only feasible in Shanghai, China, because of the high GHG emission factor of local power supply industry [23]. In all other five locations, using natural gas based fuel cell power systems will increase the amount of GHG emissions.
The hydrogen fuel cell power system, based on the calculated results in Figure 3, can achieve a mitigation effect on GHG emissions between solar and wind at the six selected locations. This is partially due to the high cost of the hydrogen based fuel cell power systems and the high energy density required for hydrogen production. It is expected that in the future the hydrogen powered fuel cells would have a greater application potential as the economic costs of the systems are lowered further and after better ways for hydrogen production and storage are identified.
As there are technical variations among the selected clean energy power systems, the cost benefit of using a specific clean energy technology might be different from each other. In order to characterize the sensitivity and uncertainty of using a specific power system among the selected models for each clean energy technology, the range of GHG reduction, in the unit of tons/$1,000, for the selected clean energy power systems are calculated for their applications at the six selected locations. The results are shown in Figure 4 below, with the median value indicated for each mitigation range.
Figure 4. Range of GHG mitigation potential through clean energy supply at the selected six locations.
Energies 04 01478 g004
Figure 4 demonstrates that the selected wind power systems have the highest GHG mitigation potential among the three clean energy technologies, in particular for application in Detroit, Shanghai and Bochum. The highest GHG reduction from wind application in Shanghai can reach 30 tons per $1,000 economic input. Wind power supply in Bochum and Detroit can achieve up to 29 tons and 24 tons of reduction, respectively, per $1,000 economic input. As quantitatively indicated, the minimum amounts of GHG reduction from adoption of the selected wind turbines in Detroit, Shanghai and Bochum are still more than 13, 15, and 17 tons, respectively, per $1,000 economic input. When compared, the application of the selected solar PV models can only reduce an amount of GHG emissions less than 6 tons per $1,000 economic input. Fuel cell power systems are almost at the same level of GHG mitigation effect with solar PV systems. If using natural gas based fuel cell power systems, GHG mitigation is only feasible in Shanghai, China.

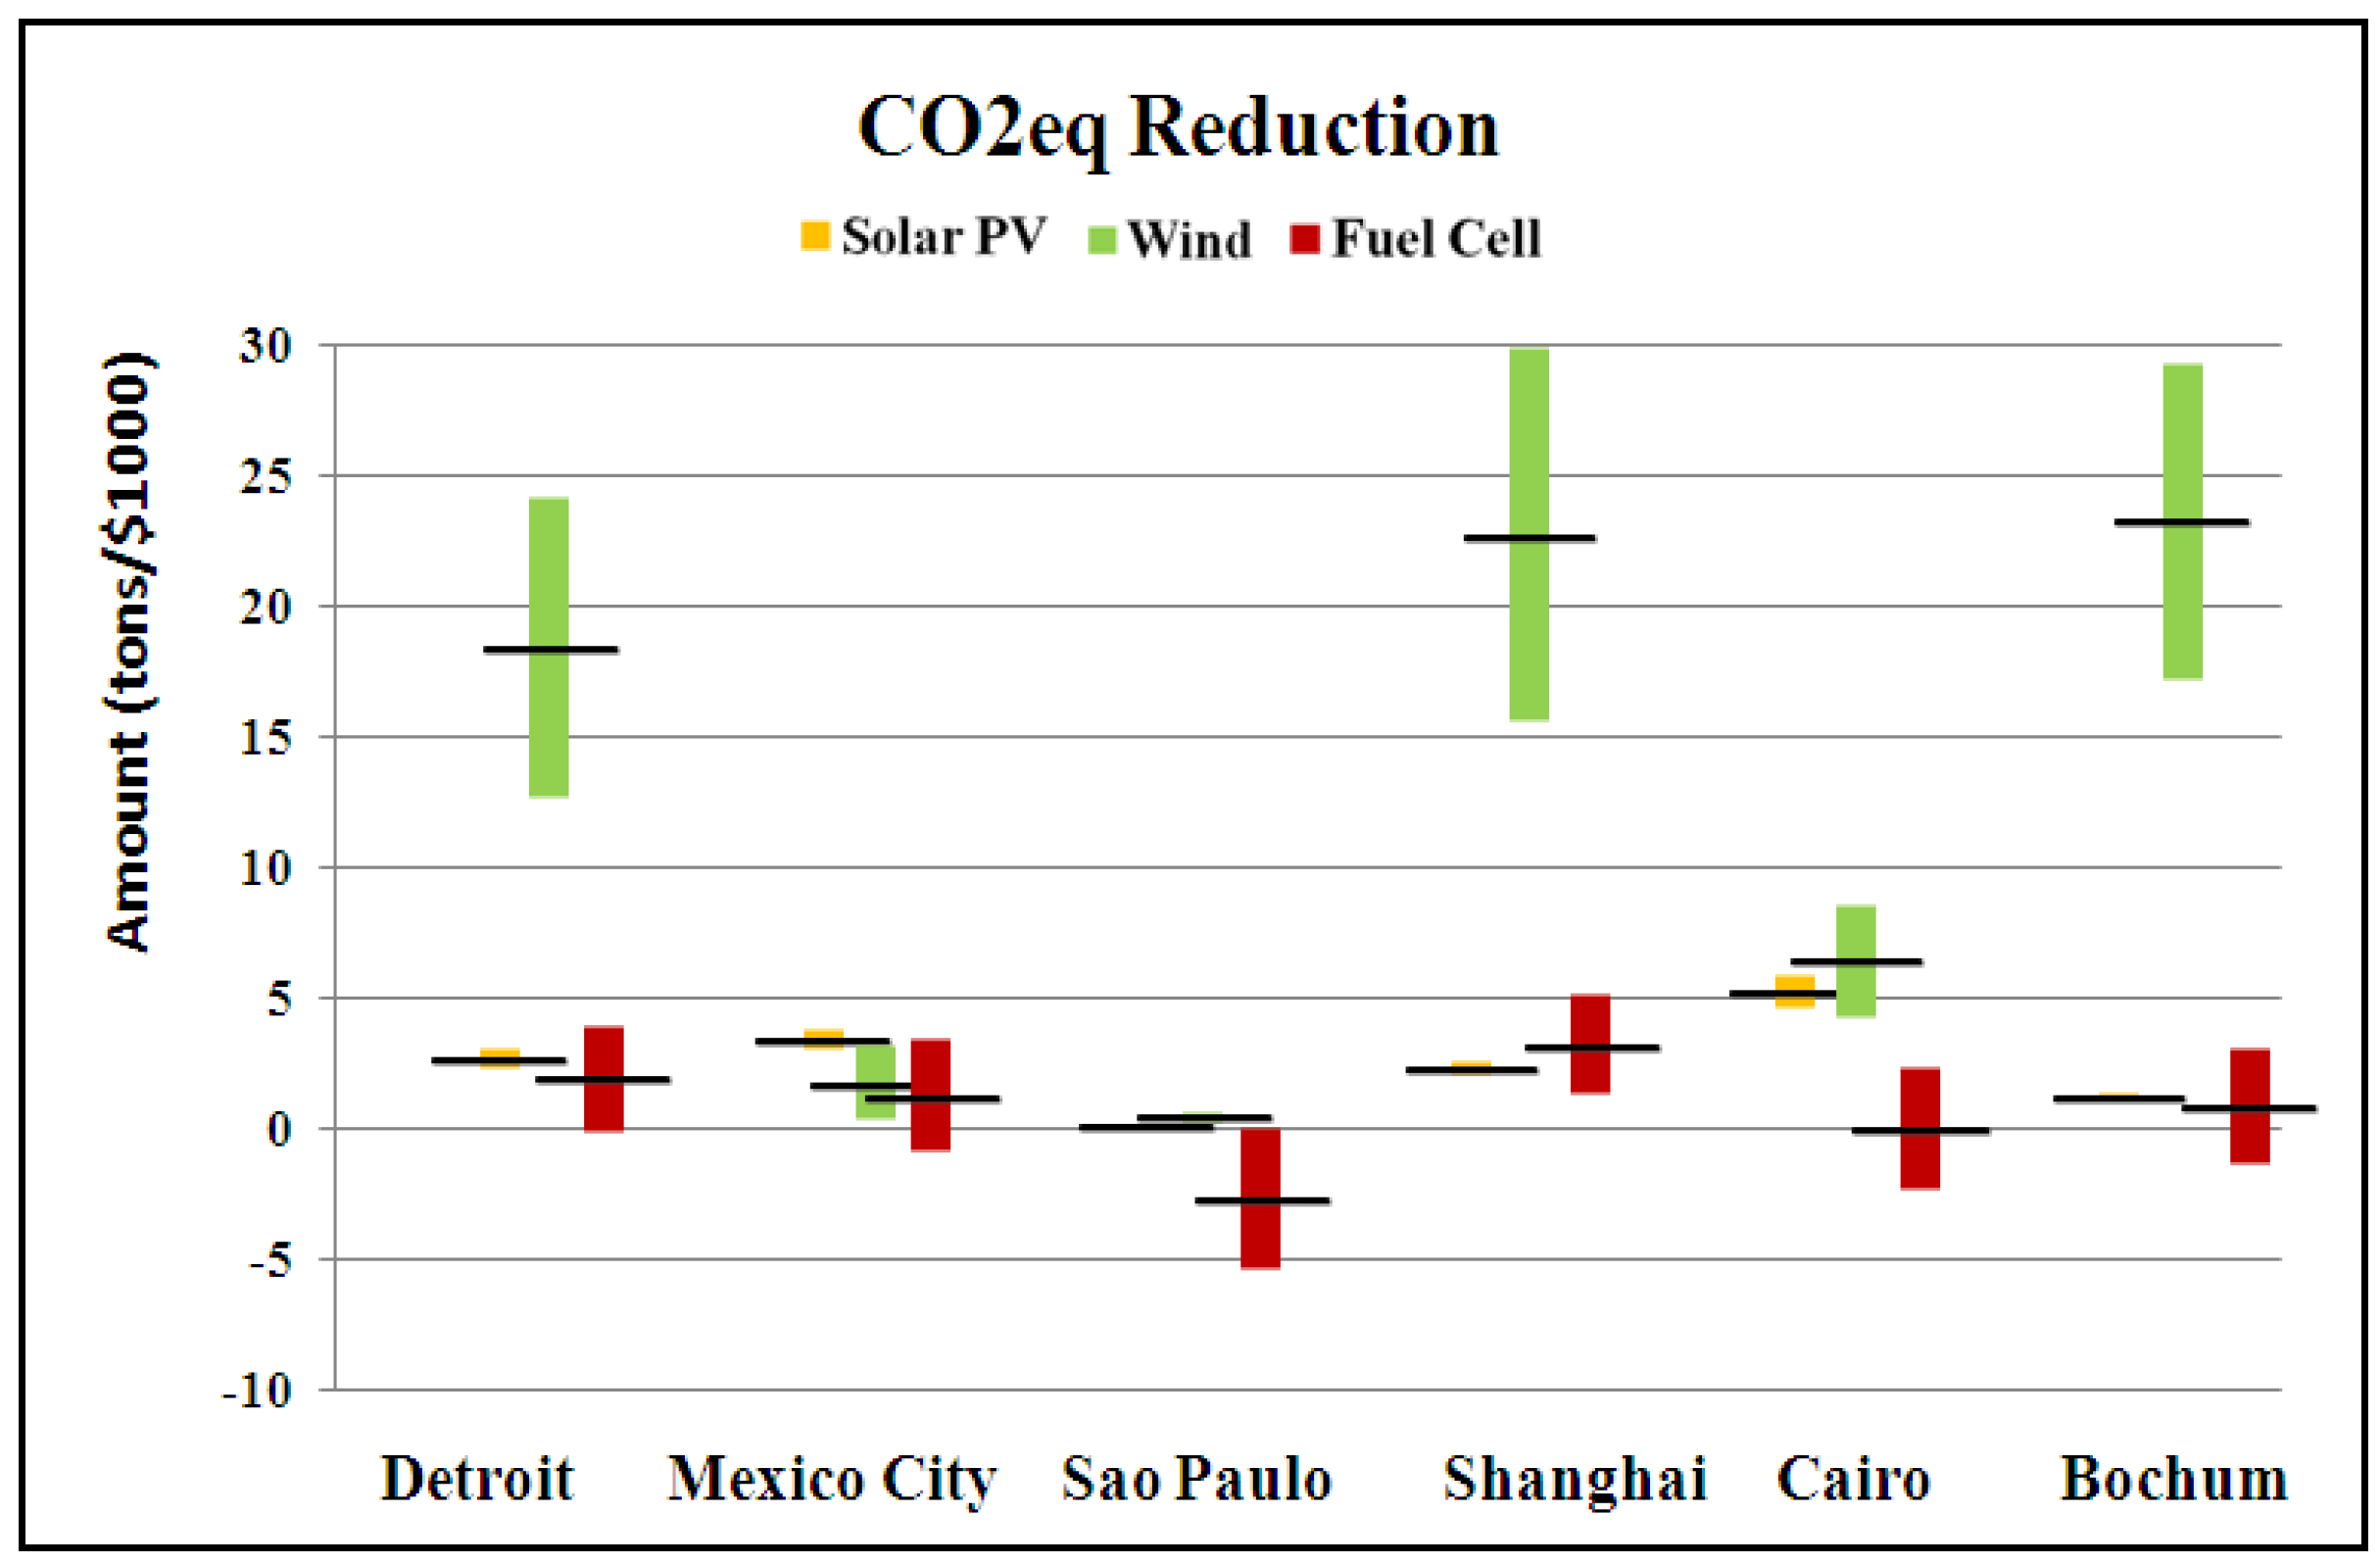
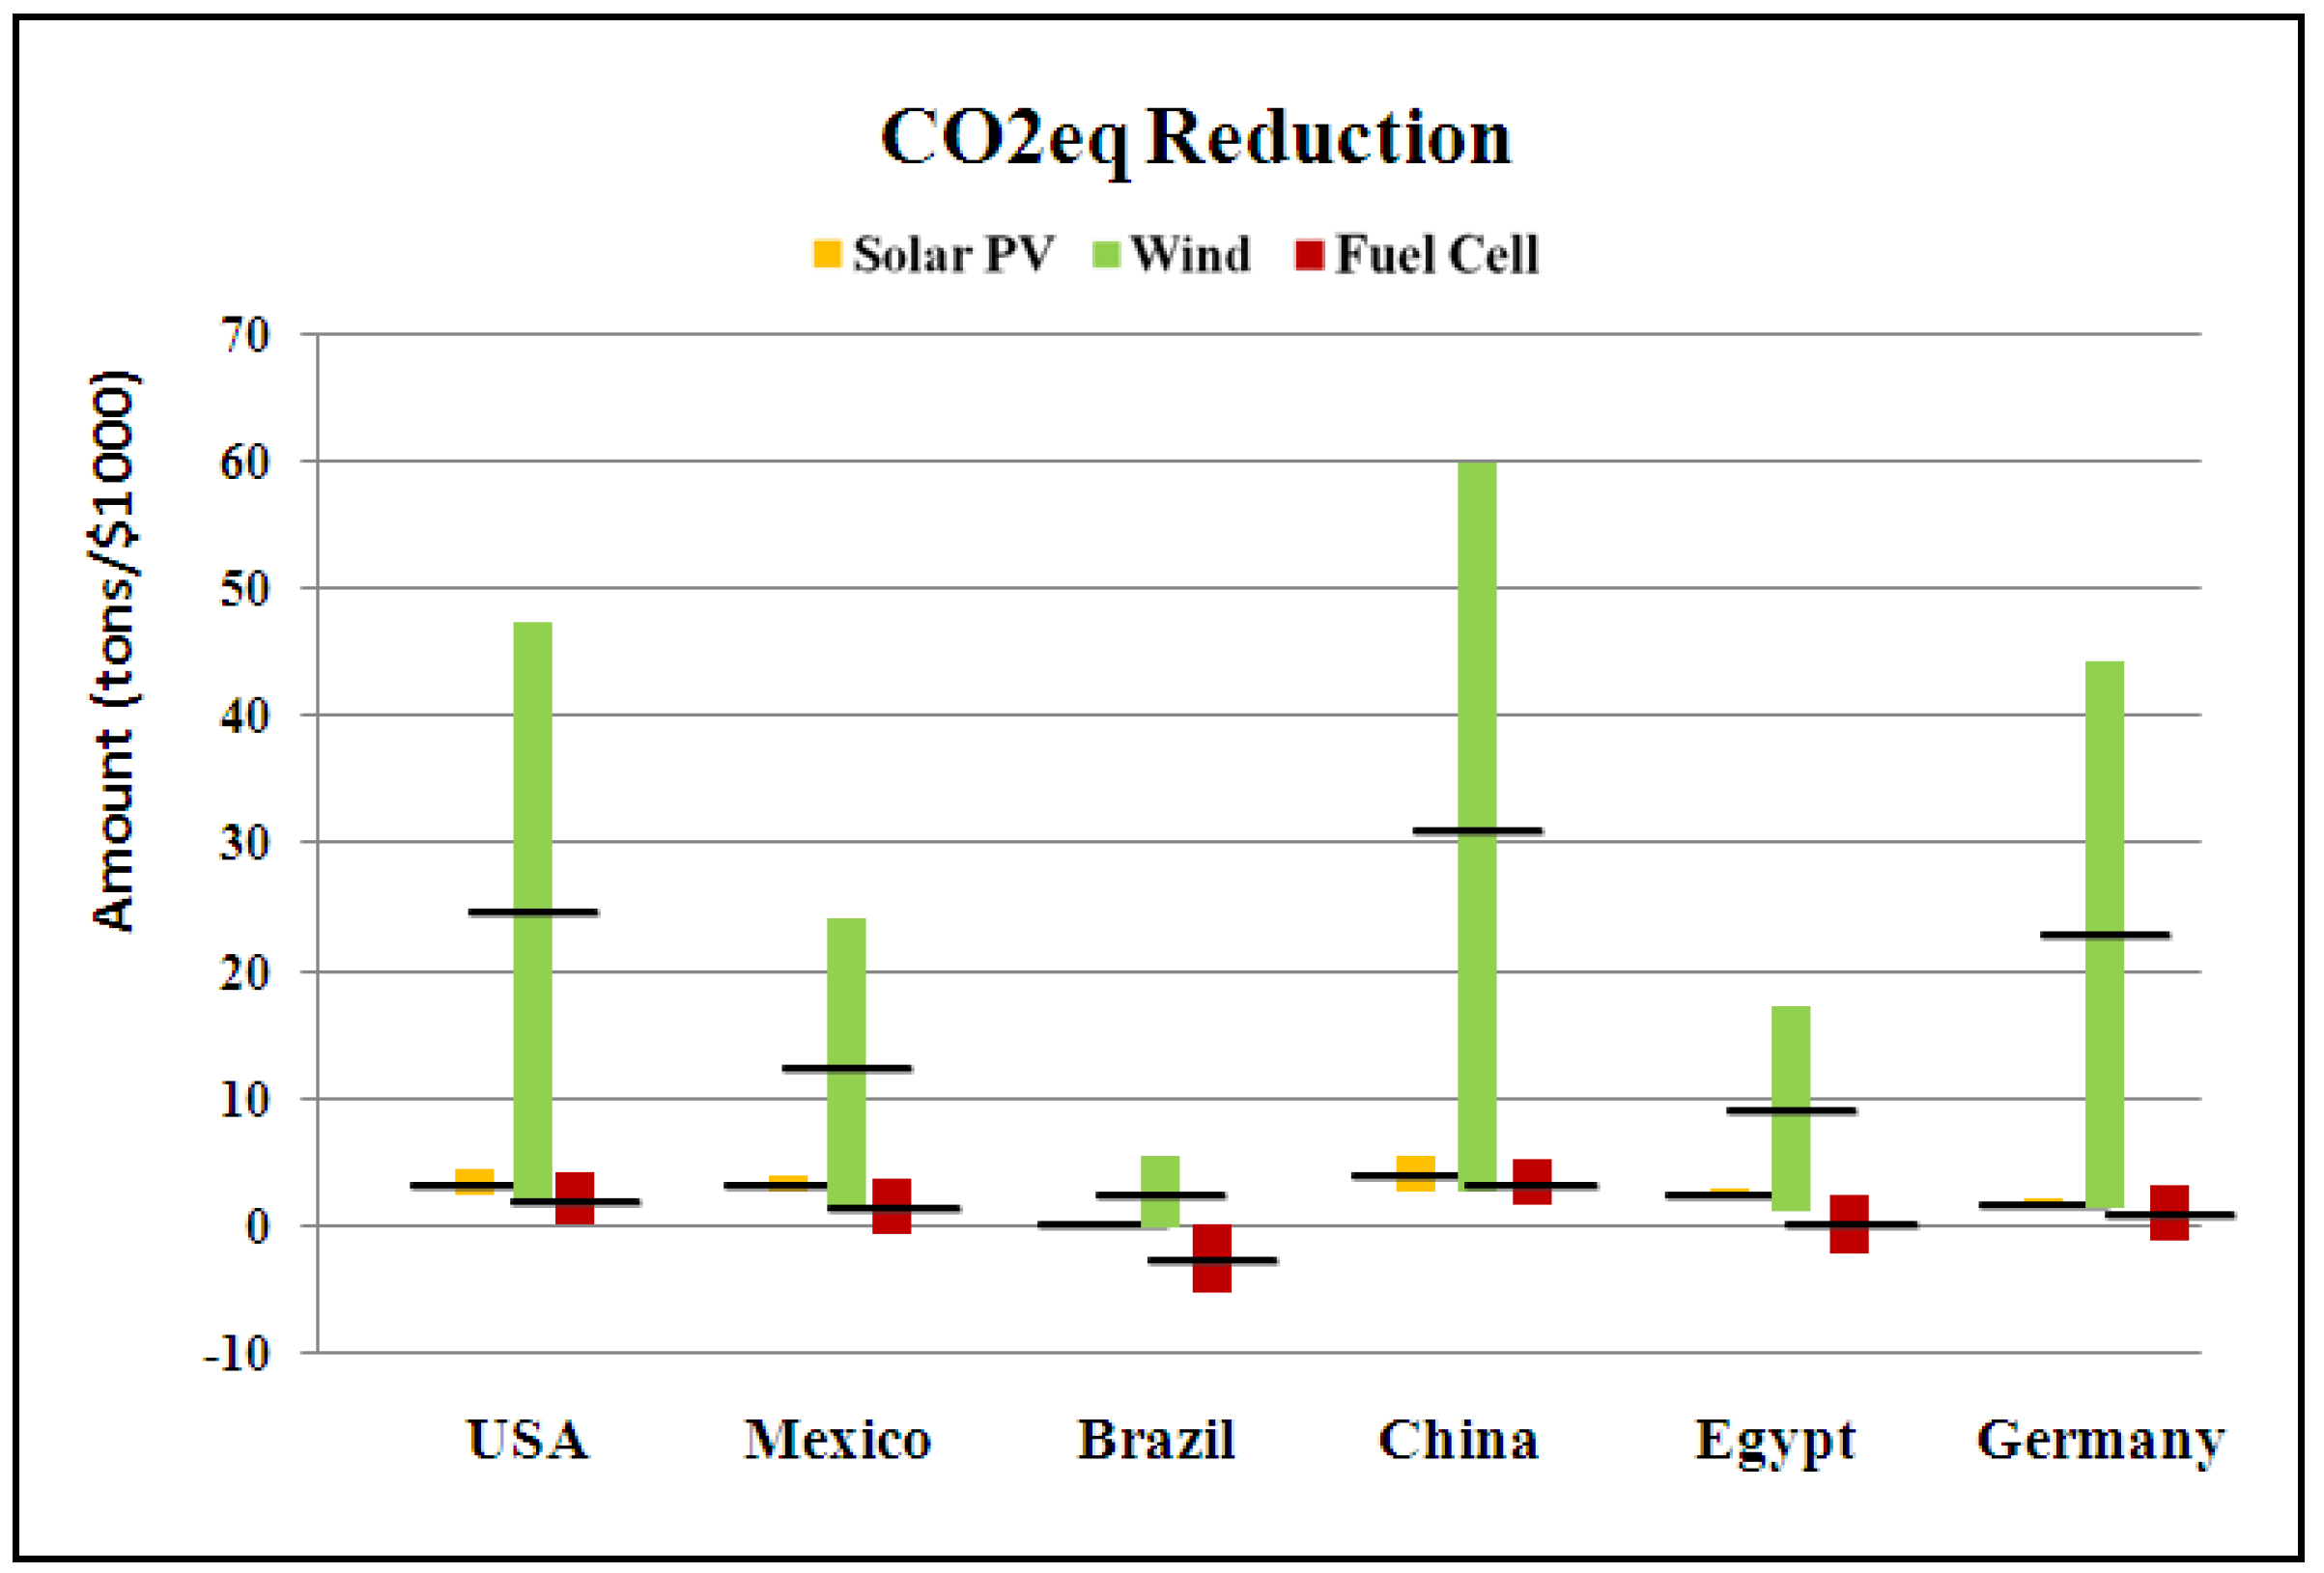
3.3. Range of GHG Mitigation Potential at Different Regions

The above analysis results are on applications of the selected representative clean power systems at specific geographical locations (cities). In order to understand the GHG mitigation potential of clean energy supply for broader areas, we have extended the analysis results to the country-wide geographical area, and assessed the range of GHG mitigation potential in the six countries selected for this study. The range of GHG mitigation potential are calculated for solar PV and wind power systems based on the selected average technical parameters shown in Table 1 and Table 2 above. The range of GHG mitigations from solar PV power supply is calculated by considering the best and worst power generation scenarios under the highest and lowest solar insolation conditions within the geographical boundary of the selected country. The range of GHG mitigation from wind power supply is calculated by considering the best and worst power generation scenarios under the highest wind energy density of that country and the minimum wind speed (4.47 m/s) required for wind turbine installation [25]. The range of GHG mitigation from fuel cell power supply is calculated by considering the fuel differences of the power systems based on the technical parameters shown in Table 3. The calculated range of GHG mitigation potential gives the maximum and minimum amount of GHGs which can be mitigated through each clean energy supply pattern in these six countries on the basis of the same economic input. The results are shown in Figure 5 below, with the median value indicated for each mitigation range.
Figure 5. Range of GHG mitigation potential through clean energy supply in the selected six countries.
Energies 04 01478 g005
The calculated results in Figure 5 demonstrate that the best GHG mitigation opportunity is in China. With $1,000 economic investment, the maximum amount of GHG reduction can be as high as 60 tons, while application of wind power systems in the United States and Germany can also obtain a maximum GHG reduction of between 40 and 50 tons. When compared with the wind supply pattern, application of solar and fuel cell power systems has much less potential for GHG mitigation in each country. The median values of GHG mitigation range from fuel cells and wind power supply are almost at the same level.
The maximum reduction of GHG emissions through clean energy supply depends on many factors. From the results of our analysis, the most important factors for an optimal GHG mitigation are on the selection of the clean energy technology and the geographical location for system installation. In this analysis, the technical differences of the selected power systems in each clean energy category are not fully assessed and benchmarked, but such differences are believed having very small influences on the decision-making in clean energy technology selections.

4. Concluding Remarks

GHG emissions are a global issue due to the long persistence time of GHGs in the atmosphere. Any emissions generated at different locations in the world ultimately contribute to the same global warming problem. Clean energy systems have been recognized widely for their potential in mitigating the GHG emissions from the current grid power supply. However, due to the differences of energy supply structure and geographical conditions of different regions, application of clean energy systems in different locations can result in different mitigation effects.
Application of clean energy power systems to partially supply the energy needs of global automotive and similar manufacturing facilities can greatly reduce the significant amount of GHG emissions from these production facilities and manufacturing processes. However, there is a lack of cost benefit data and information for decision support in sustainable practices of global manufacturing industry. In this paper, we present our study on the GHG mitigation potential of supplying clean energy power systems such as solar PV, wind and fuel cells for the global automotive manufacturing industry, in cooperation with the General Motors Company.
The study is performed on the representative clean energy power systems currently available on the market. The selected geographical locations, including Detroit (United States), Mexico City (Mexico), Sao Paulo (Brazil), Shanghai (China), Cairo (Egypt) and Bochum (Germany) are major production centers for GM and are considered representatives of each geographical region in the World in this analysis. The mitigation potential of each clean energy system is quantitatively investigated with consideration of both geographical conditions of each location and technical characteristics of each clean power system.
The study of GHG mitigation potential through clean energy supply is conducted in three aspects: capacity factor of each clean energy system at the different locations, economic performance of GHG mitigation efforts, and the maximum mitigation potential in the selected country. The results demonstrate that wind power is superior to other two clean energy technologies in the economic performance of the mitigation effect, particularly in those regions with high wind energy density (such as Bochum) and/or high GHG emission factor (such as Shanghai).
Considering the overall conditions for GHG mitigation and the economic cost factor, the study shows that the highest mitigation potential of GHG emissions among these six selected countries is in China, through wind power supply. The maximum GHG reduction could be as high as 60 tons per $1,000 economic cost investment in wind energy supply in China. The application of wind power systems in the United States and Germany may also achieve a maximum of GHG reduction of between 40 and 50 tons per $1000 economic input. When compared with the wind energy supply, application of solar and fuel cell power systems has much less potential for GHG mitigation in the six countries selected for study. The median values of GHG mitigation range resulting from solar and wind power supply are almost at the same level.

Acknowledgements

The financial support from the internal funding of the University of Wisconsin, MI, General Motors Company, and the Chinese NSFC (Project No. 51075415) are greatly appreciated.

References

  1. Yuan, C.; Zhang, T.; Rangarajan, A.; Dornfeld, D.; Ziemba, B.; Whitbeck, R. A decision-based analysis of compressed air usage patterns in automotive manufacturing. J. Manuf. Syst. 2006, 25, 293–300. [Google Scholar] [CrossRef]
  2. Maclean, H.; Lave, L. A life-cycle model of an automobile. Environ. Policy Anal. 1998, 3, 322A–330A. [Google Scholar]
  3. General Motors Company. Public Policy Center Environment and Energy. Voluntary Reporting of General Motors Corporation United States Greenhouse Gas (GHG) Emissions for Calendar Year (1990–2007). 2008. Available online: http://www.gm.com/corporate/responsibility/environment/reports/greenhouse_gas_emissions/ghgreport_2007.pdf (accessed on 5 October 2010).
  4. U.S. D.O.E. (Department of Energy). Climate Vision Progress Report 2007. Available online: http://www.doe.gov/media/Climate_Vision_Progress_Report.pdf (accessed on 2 October 2010).
  5. Yuan, C.; Dornfeld, D. Reducing the environmental footprint and economic costs of automotive manufacturing through an alternative energy supply. Trans. North Am. Manuf. Res. Inst. 2009, 37, 427–434. [Google Scholar]
  6. General Motors Company. General Motors: About GM 2010. Available online: http://www.gm.com/corporate/about/ (accessed on 12 October 2010).
  7. REN21. Renewables Global Status Report. 2009. Available online: http://www.ren21.net/pdf/RE_GSR_2009_Update.pdf (accessed on 4 October 2010).
  8. Renewable Energy World. Top 10: Ten Largest Solar PV Companies, 2010. Available online: http://www.renewableenergyworld.com/rea/blog/post/2010/06/top-10-ten-largest-solar-pv-companies (accessed on 23 October 2010).
  9. Simiu, E.; Scanlan, R.H. Wind Effects on Structures; Wiley: New York, NY, USA, 1978; p. 47. [Google Scholar]
  10. Kaltschmitt, M.; Streicher, W.; Wiese, A. Renewable Energy: Technology, Economics, and Environment; Springer: New York, NY, USA, 2007; p. 55. [Google Scholar]
  11. Chang, T.J.; Wu, Y.T.; Hsu, H.Y.; Chu, C.R.; Liao, C.M. Assessment of wind characteristics and wind turbine characteristics in Taiwan. Renew. Energy 2003, 28, 851–871. [Google Scholar] [CrossRef]
  12. My Wind Power System. The 10 Major Wind Power Companies in the World. Available online: http://www.mywindpowersystem.com/2009/04/the-10-major-wind-power-companies-in-the-world/ (accessed on 23 October 2010).
  13. NASA Atmospheric Science Data Center. Surface Meteorology and Solar Energy, A Renewable Energy Resource Web Site (Release 6.0), 2008. Available online: http://eosweb.larc.nasa.gov/cgi-bin/sse/sse.cgi?na+s01+s06#s01 (accessed on 12 October 2010).
  14. Marion, B.; Anderberg, M.; Gray-Hann, P. Recent Revisions to PVWATTS. NREL/CP-520-38975; National Renewable Energy Laboratory: Golden, CO, USA, 2005.
  15. NASA Atmospheric Science Data Center. Surface Meteorology and Solar Energy, A Renewable Energy Resource Web Site (release 5 Data Set), 2005. Available online: http://eosweb.larc.nasa.gov/sse/global/text/10yr_wspd50m (accessed on 12 October 2010).
  16. U.S. E.I.A. (Energy Information Administration). Cost and Performance Characteristics of New Central Station Electricity Generating Technologies, 2010. Available online: http://www.eia.doe.gov/oiaf/aeo/excel/aeo2010%20tab8%202.xls (accessed on 12 September 2010).
  17. Azzopardi, B.; Mutale, J. Life cycle analysis for future photovoltaic systems using hybrid solar cells. Renew. Sustain. Energy Rev. 2010, 14, 1130–1134. [Google Scholar] [CrossRef]
  18. Pehnt, M. Dynamic life cycle assessment (LCA) of renewable energy technologies. Renew. Energy 2006, 31, 55–71. [Google Scholar] [CrossRef]
  19. Jaap, V.; Rooijen, A. Life Cycle Assessment of the PureCellTM Stationary Fuel Cell System: Providing a Guide for Environmental Improvement. M.Sc. Thesis, Delft University of Technology, Delft, The Netherlands, 2006. [Google Scholar]
  20. Viebahn, P.; Krewitt, W. Environmental and Ecological Life Cycle Inventories for Present and Future Power Systems in Europe (ECLIPSE); European Commission, DG Research (Project No. NNE5-2001-00071): Brussels, Belgium, 2003. [Google Scholar]
  21. Gerboni, R.; Pehnt, M.; Viebahn, P.; Lavagno, E. Final Report on Technical Data, Costs and Life Cycle Inventories of Fuel Cells. New Energy Externalities Developments for Sustainability (NEEDS); NEEDS Project: Rome, Italy, 2008; Available online: http://www.needs-project.org/RS1a/RS1a%20D9.2%20Final%20report%20on%20fuel%20cells.pdf (accessed on 15 September 2011).
  22. U.S. E.I.A. (Energy Information Administration). Domestic Electricity Emission Factors, 1999–2002; EIA: Washington, DC, USA, 2007. Available online: http://www.eia.doe.gov/oiaf/1605/excel/electricity_factors_99-02region.xls (accessed on 10 September 2010).
  23. U.S. E.I.A. (Energy Information Administration). International Electricity Emission Factors by Country, 1999–2002; EIA: Washington, DC, USA, 2007. Available online: http://www.eia.doe.gov/oiaf/1605/excel/electricity_factors_99-02country.xls (accessed on 10 September 2010).
  24. IPCC. IPCC Fourth Assessment Report (AR4) by Working Group 1 (WG1); IPCC: Geneva, Switzerland, 2007; Available online: http://www.ipcc.ch/pdf/assessment-report/ar4/wg1/ar4-wg1-chapter2.pdf (accessed on 10 September 2010).
  25. American Wind Energy Association (AWEA). 2010. Available online: http://www.awea.org/faq/rsdntqa.html (accessed on 13 September 2010).

