2. Numerical Model
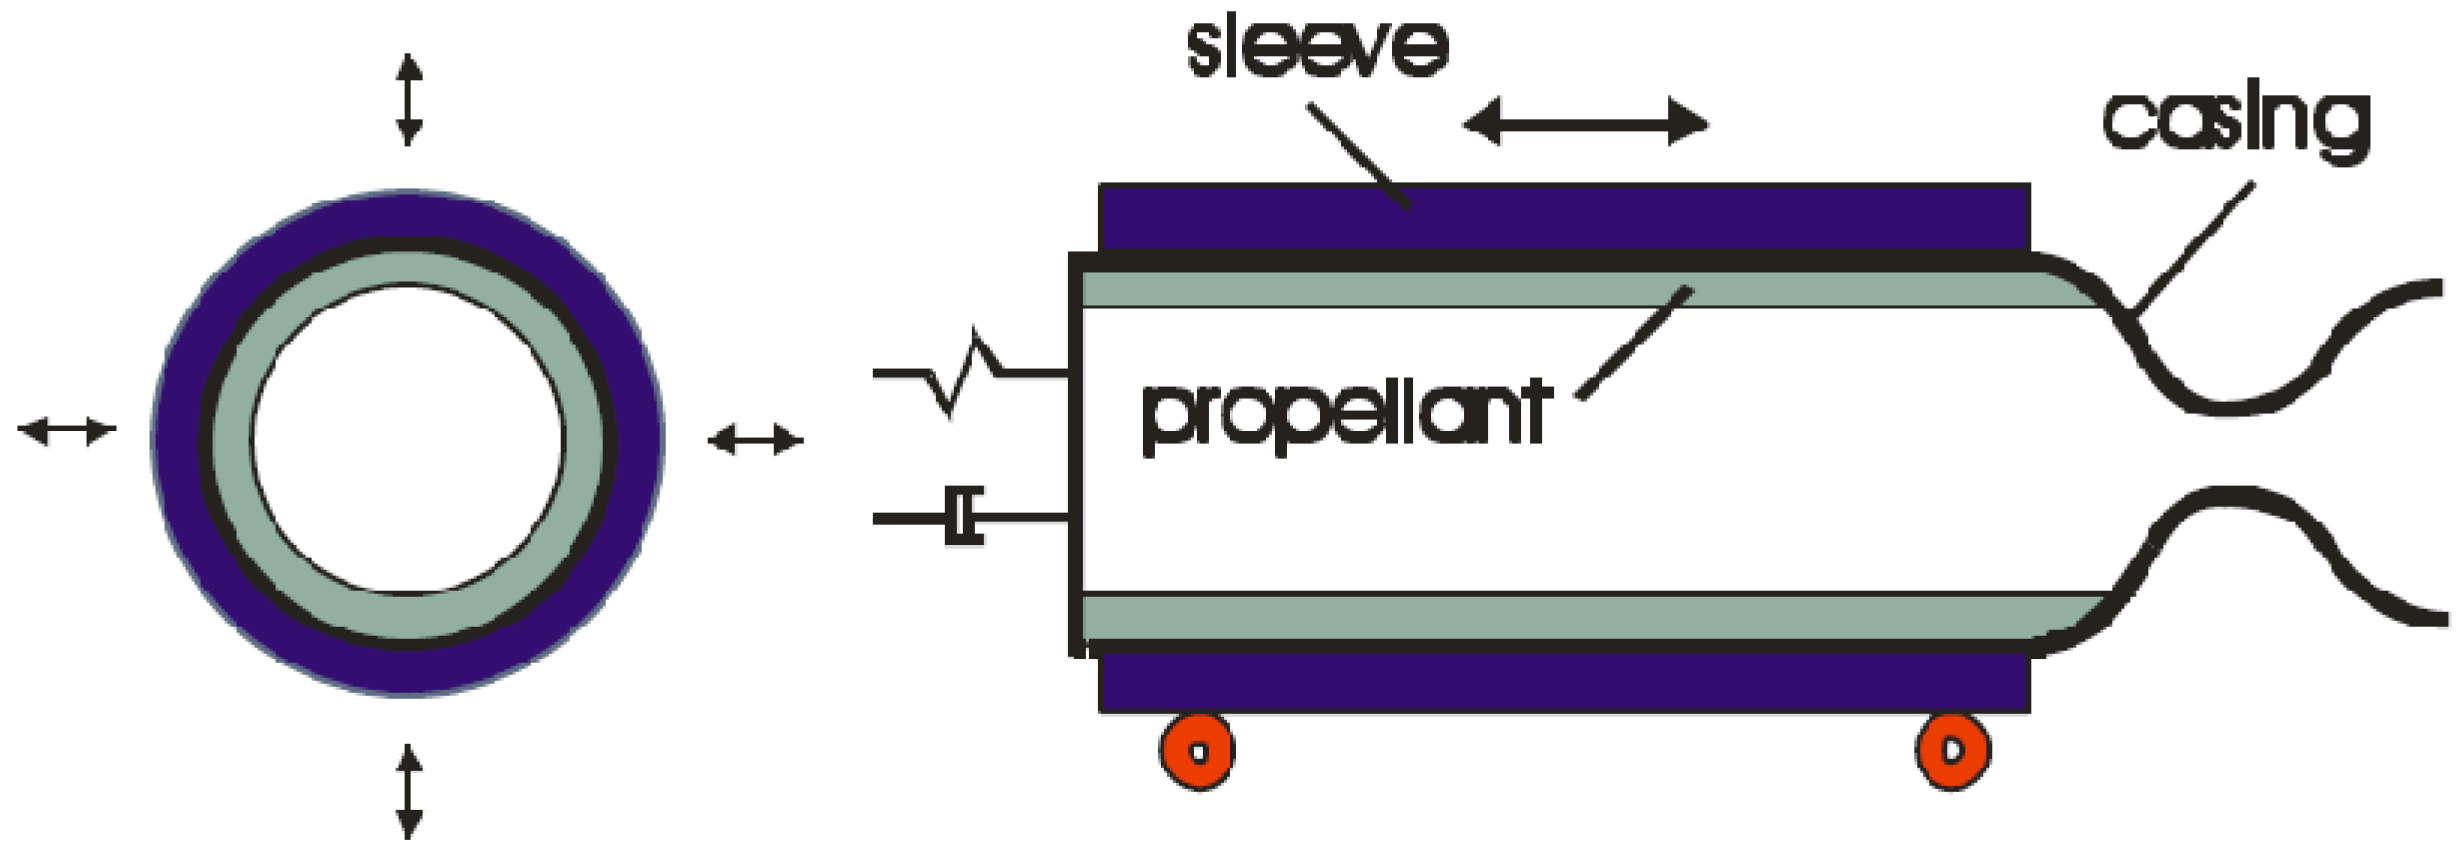
In the present investigation, the SRM is assumed to be positioned on a static test stand, as schematically represented in
Figure 1. In this case, the cylindrical-grain motor is free to vibrate radially without any external constraint (
i.e., only constrained in some cases by the thick steel static-test sleeve surrounding the aluminum flightweight motor casing), while axial motion is constrained to a large degree by the thrust-measuring load cell (represented in the predictive model as a spring/damper system) at the lefthand boundary of the motor’s head end. Under normal (nominal) quasi-equilibrium operating conditions, the internal gas flow (or gas-particle flow, if two-phase) moves smoothly from the burning propellant surface into the axial flow, from left-to-right as per
Figure 1 through and beyond the exhaust nozzle.
Figure 1.
Reference SRM model setup, for static test firing in laboratory.
Figure 1.
Reference SRM model setup, for static test firing in laboratory.
The equations of motion describing the nonsteady core flow within the SRM must be solved in conjunction with the local surface regression rate
rb of the solid propellant, and the surrounding structure’s instantaneous geometric deformation. As pertains to the present study of a motor having a larger length-to-diameter ratio, the quasi-one-dimensional hydrodynamic conservation equations for the axial gas flow are given below:
Here, the total specific energy of the gas is defined for an ideal gas as
E =
p/[(−1)
ρ] +
u2/2. The viscous interaction between the gas and particle phases is represented by the drag force
D, and the heat transfer from the core flow to the particles is defined by
Q (in this format, assuming one inert [unchanging] particle size; [
8]). Here, longitudinal acceleration
appears in the gas momentum and energy equations as a body force contribution within a fixed Eulerian reference (fixing of
x = 0 to motor head end,
x positive moving right on structure; acceleration of local surrounding structure rightward is designated positive
), and may vary both spatially along the length of the motor and with time. The effects of such factors as turbulence can be included through one or more additional equations that employ the information from the bulk flow properties arising from the solution of the above one-dimensional equations of motion. The principal differential equations themselves can be solved via a higher-order random-choice method (RCM) approach [
3,
4,
5,
9]. Given that the current investigation will not be incorporating particles within the flow (particle loading mass fraction
ap ≈ 0%), for brevity, the particle-phase differential equations of motion are not presented here; the reader is referred to [
8].
Structural vibration can play a significant role in nonsteady SRM internal ballistic behavior, as evidenced by observed changes in combustion instability symptoms as allied to changes in the structure surrounding the internal flow (e.g., propellant grain configuration, wall thickness, material properties). The level of sophistication required for modeling the motor structure (propellant, casing, static-test sleeve, nozzle) and applicable boundary conditions (load cell on static test stand) can vary, depending on the particular application and motor design. Montesano
et al [
4] employed a finite-element approach towards the structural modeling of the given motor configuration. In the present study, a cylindrical-grain configuration allows for a simpler approach via thick-wall theory, as reported in [
3]. The radial deformation dynamics of the propellant/casing/sleeve are modelled by a series of independent ring elements along the length of the motor. With that representation, the following ordinary differential equation applies for the movement of a radial position
r within the assembly:
where
ro is the reference radius under no chamber pressure, and
ψ is the local instantaneous radial displacement under static loading. Equation 4 may be solved using a backward difference scheme. Allowing for viscoelastic behavior,
ξR is the radial damping ratio. The fundamental natural radial frequency,
ωnR, of the sleeve/casing/propellant assembly may be determined using a commercial finite element analysis software program, if the theoretical approximation is not considered adequate.
Axial motion along the length of the structure is modelled via beam theory, and bounded by the spring/damper load cell at the motor’s head end. Viscous damping is applied in both the radial and axial directions. Reference structural properties are assumed for an ammonium-perchlorate/hydroxyl-terminated polybutadiene (AP/HTPB) composite propellant surrounded by an aluminum casing and steel sleeve.
With respect to transient, frequency-dependent burning rate modeling that allows one to solve for the local
rb value for the burning propellant surface at a given time, a generalized Z-N solid-phase energy conservation approach is used in the present simulation program. It may be represented by the following time-dependent temperature-based relationship [
6]:
where
rb,qs is the quasi-steady burning rate (value for burning rate as estimated from steady-state information for a given set of local flow conditions above the propellant surface),
Ti is the initial propellant temperature (e.g., room or outside air temperature), and in this context, ∆
T = T(
y,
t)
− Ti is the temperature distribution in moving from the burning propellant surface at
y = 0 (and
T = Ts) to that spatial location in the propellant where the temperature reaches
Ti. One may note the inclusion of a net surface heat release term, Δ
Hs, in the calculations, to allow for a better comparison to transient-response experimental data. This term is commonly included as an add-on correction to the solid-phase energy contribution in an energy-conservation model involving solid propellants (e.g., see Equation 12 below for erosive burning). On a pragmatic level, adjusting the value of Δ
Hs positively upward (more exothermic contribution) increases the burning response magnitude of the propellant at a given frequency, and visa versa for a more endothermic contribution, which acts to deaden the response [
6]. For the numerical solution of the integral of Equation 5, the transient heat conduction in the solid phase can be solved by an appropriate finite-difference scheme. One needs to take care in setting the solid-phase spatial increment Δ
y, to be in accordance with the Fourier stability limit Δ
yFo, which is a function of the chosen time increment Δ
t [
6]. The time increment itself must be coordinated between the flow and structural model solution systems [
6]. In Equation 5,
rb* is the nominal (unconstrained) instantaneous burning rate. The actual instantaneous burning rate
rb may be found as a function of
rb* through the rate limiting equation provided below [
6],
The rate limiting coefficient
Kb effectively damps (“slows down”) the unconstrained burning rate
rb* to allow for a better comparison to experimental transient response data, and to prevent artificial burning-rate divergence (“runaway”), when for a finite time increment Δ
t:
A higher value for
Kb, moving closer to but still less than 1/Δ
t, tends to shift the peak combustion response frequency
fr to a higher value. Adjusting the value for
Kb and Δ
Hs permits one to better compare to a given solid propellant’s experimentally observed transient response behaviour, for example as determined from a T-burner [
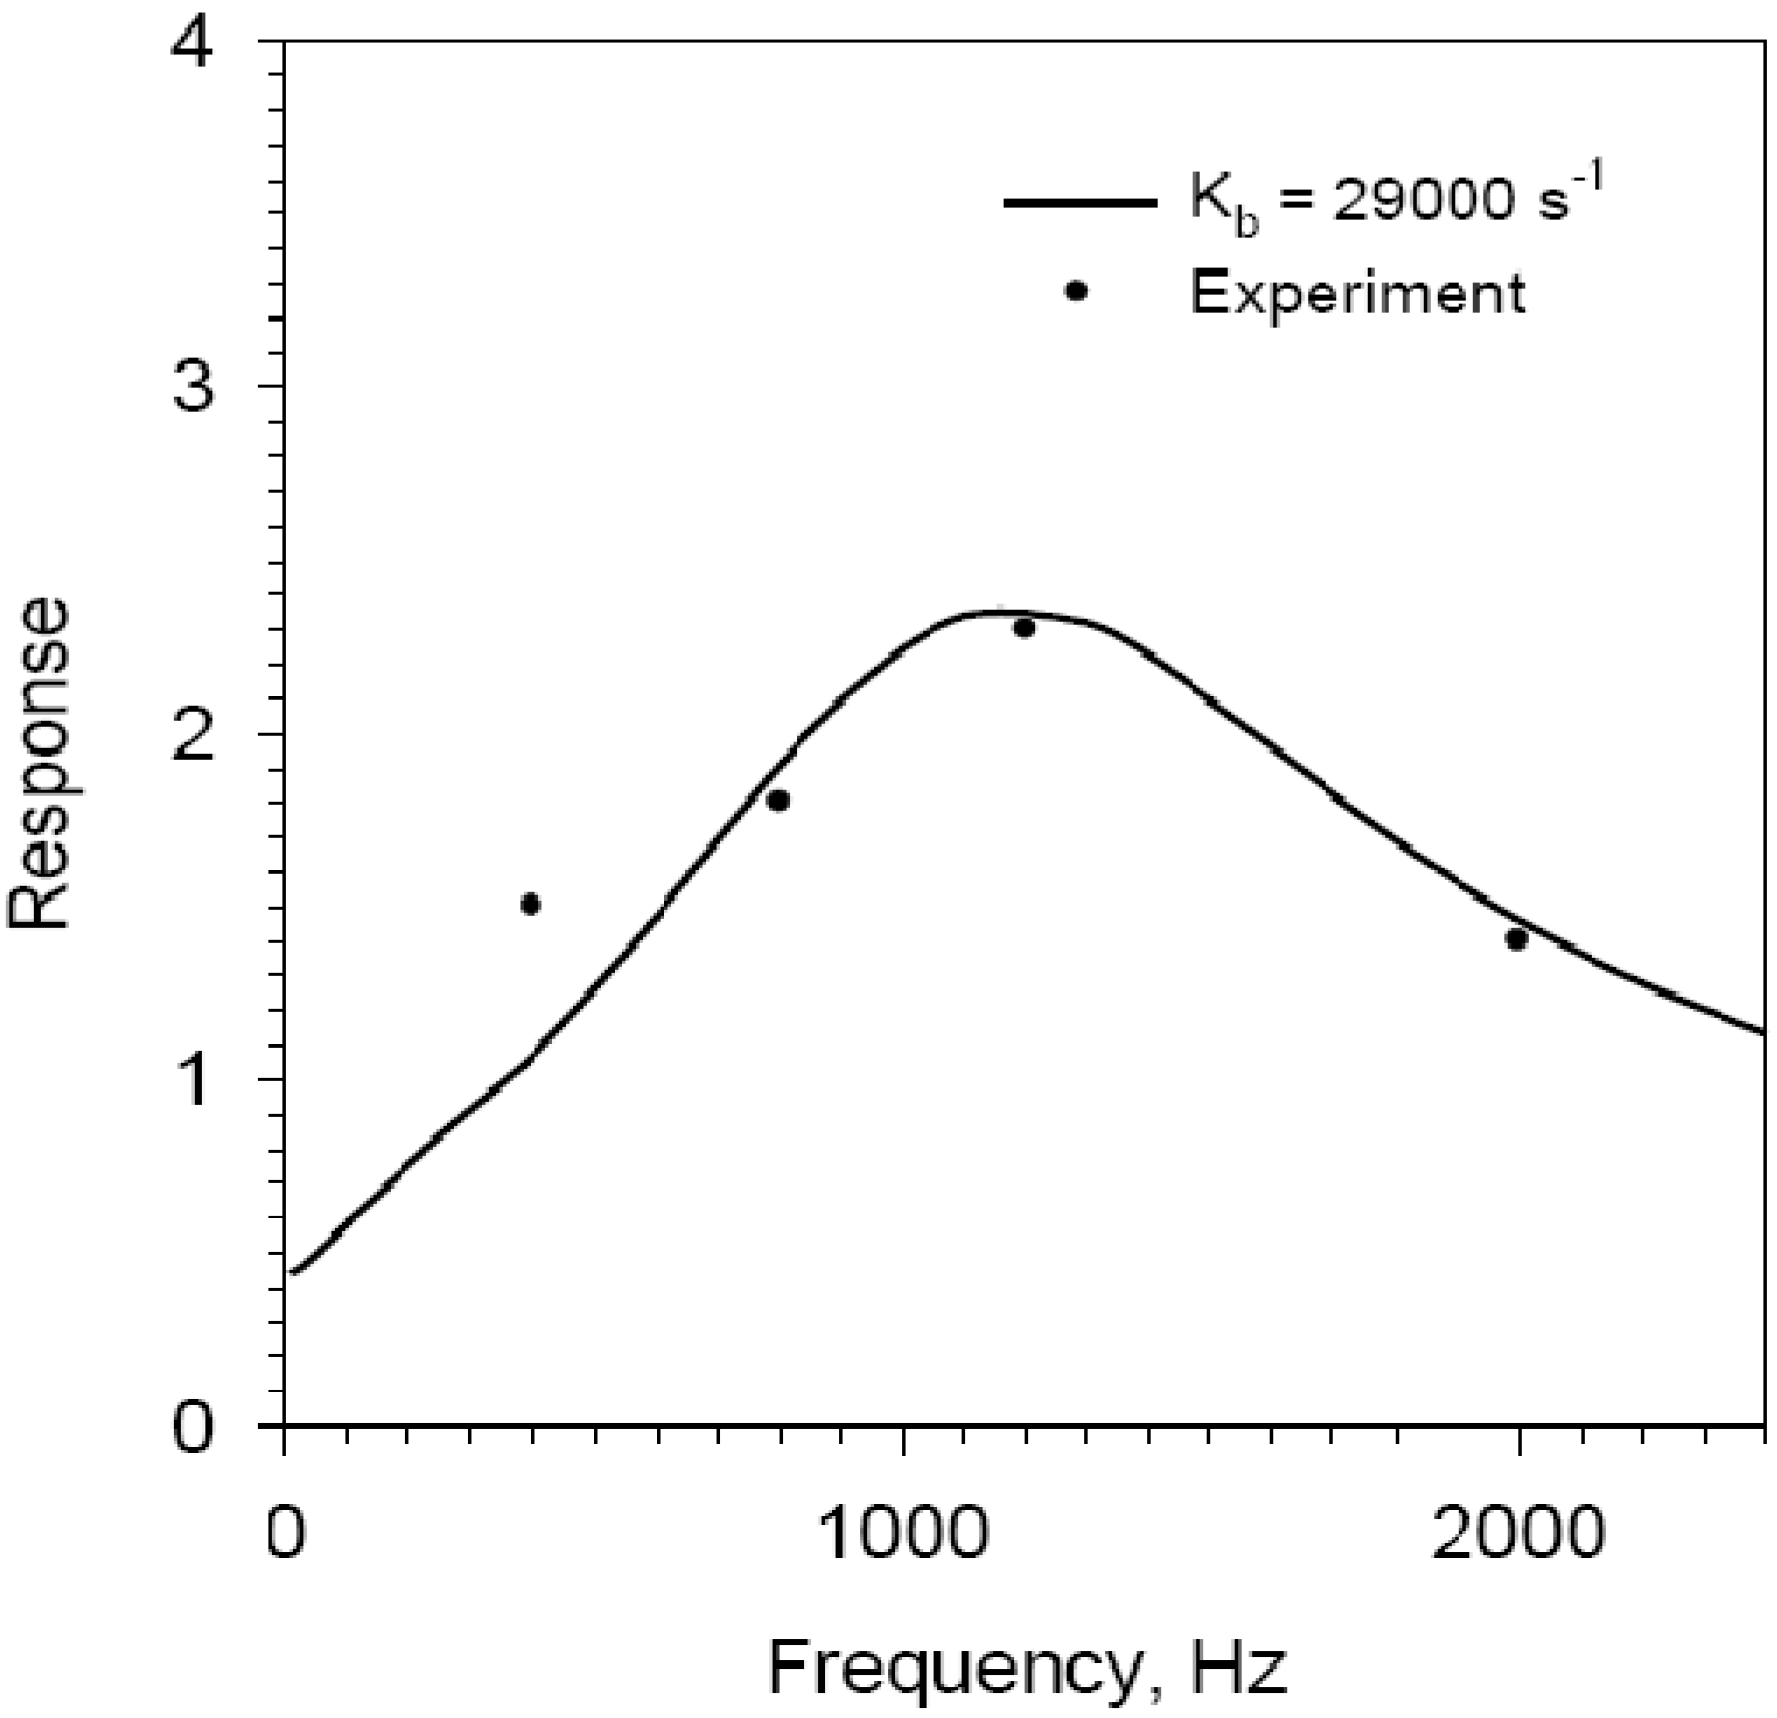
1]. An example result, with a comparison to corresponding experimental data for the pressure-based combustion response of a conventional composite solid propellant, is provided in
Figure 2. The value for
fr is around 1150 Hz in that example.
Figure 2.
Frequency response of AP/HTPB propellant, theory (
Kb = 29,000 s
−1; Δ
Hs = +75,000 J/kg) and experiment [
10], for chamber pressure at 1200 psig (8.27 MPa). Displayed response is the real part of the pressure-based combustion response function [
6].
Figure 2.
Frequency response of AP/HTPB propellant, theory (
Kb = 29,000 s
−1; Δ
Hs = +75,000 J/kg) and experiment [
10], for chamber pressure at 1200 psig (8.27 MPa). Displayed response is the real part of the pressure-based combustion response function [
6].
The quasi-steady burning rate may be ascertained as a function of various parameters; in this study, as a function of local static pressure
p and core flow velocity
u (erosive burning component), such that:
While some solid propellants can also exhibit a strong sensitivity to normal acceleration as relates to burning [
5], this component will be left out of the present study, for brevity. The pressure-based burning component may be found through de St. Robert’s empirical law:
The coefficient
C will tend to vary somewhat with the propellant’s initial temperature
Ti, getting lower as
Ti gets lower in value. The flow-based erosive burning component (negative and positive) is established through the following expression [
7]:
where at lower flow speeds, the negative component resulting from a stretched combustion zone thickness (
δr >
δo) may cause an appreciable drop in the base burning rate
ro, which in this study is the pressure-dependent burning component. The stetching of the flame zone at low speed may be viewed as being the result of a laminar-like sliding process of the local axial flow in the boundary layer acting to extend and curve the path of a representative particle moving up from the burning surface towards the flame front, such that the effective reactive length is increased. From [
7], in the low-speed regime, the following expression may be applied, such that the core flow Darcy-Weisbach friction factor
f is below the limit value
flim at which point negative erosive burning is no longer in effect:
The parameter
Kδ is a shear layer coefficient, whose value set at 2600 m
−1, along with a value for
flim of 2.5 × 10
−4, produced a good comparison to experimental data for various propellants and motors [
7]. At higher flow speeds, the positive erosive burning component
re, which can be established from a phenomenological convective heat feedback premise [
7], should dominate:
For practical modelling purposes, the value for net surface heat release term Δ
Hs as specifically employed in Equation 12 is usually small in comparing well to available experimental quasi-steady erosive burning data [
7], and thus is commonly set to zero when calculating
re (as is done in this study). The comparable Δ
Hs term in Equation 5, for transient combustion response, is treated separately, and may have a significant positive or negative value to better compare to transient experimental data. One can find the effective convective heat transfer coefficient
h of Equation 12 as a function of the zero-transpiration (zero blowing) value
h* and overall propellant burning rate
rb [
7]:
In turn, the value for
h* may be found as a function of the zero-transpiration Darcy-Weisbach friction factor
f*, via Reyonolds analogy [
7]:
In the realm of fully-developed turbulent flow, Colebrook’s [
11] semi-empirical expression for
f* has proven accurate over a wide range of Reynolds numbers:
Through Equation 15, one can see the correlation of propellant surface roughness height ε and grain port diameter dp in influencing the magnitude of flow-dependent erosive burning. With composite propellants using ammonium perchlorate crystals, roughness height can commonly be correlated to the AP crystal size.
With respect to the solid propellant’s burning surface temperature
Ts, one has the option of treating it as constant, or allowing for its variation, depending on the phenomenological approach being taken, and solution closure requirements, for estimating the local burning rate
rb [
6]. In practice,
Ts tends to increase with increasing burning rate (although in relative terms, the numerical value change is typically small), as may be expressed as a function of burning rate via the following Arrhenius relation for solid pyrolysis [
12]:
where
is the universal gas constant,
Eas is the activation energy, and
As is the Arrhenius coefficient. In this example, the effect of local static pressure
p is also included in the Arrhenius equation,
i.e.,
ns ≠ 0, as occasionally done in the literature [
12,
13]. Based on good comparisons in general to experimental data as reported in [
6], a constant
Ts was employed in the Z-N phenomenological combustion model, for the present investigation.
3. Results and Discussion
The characteristics of the baseline reference motor for this study are listed in
Table 1. In the case where the given propellant characteristic was not directly measurable or available, such as mean propellant burning surface temperature
TS, assigned values are estimates, for the most part taken from the open or confidential literature, for comparable propellants. Some of the structural properties listed in
Table 1, such as damping values, are estimations arising from previous studies involving comparisons to experimental vibration data. The motor, based in large measure on a similar experimental motor [
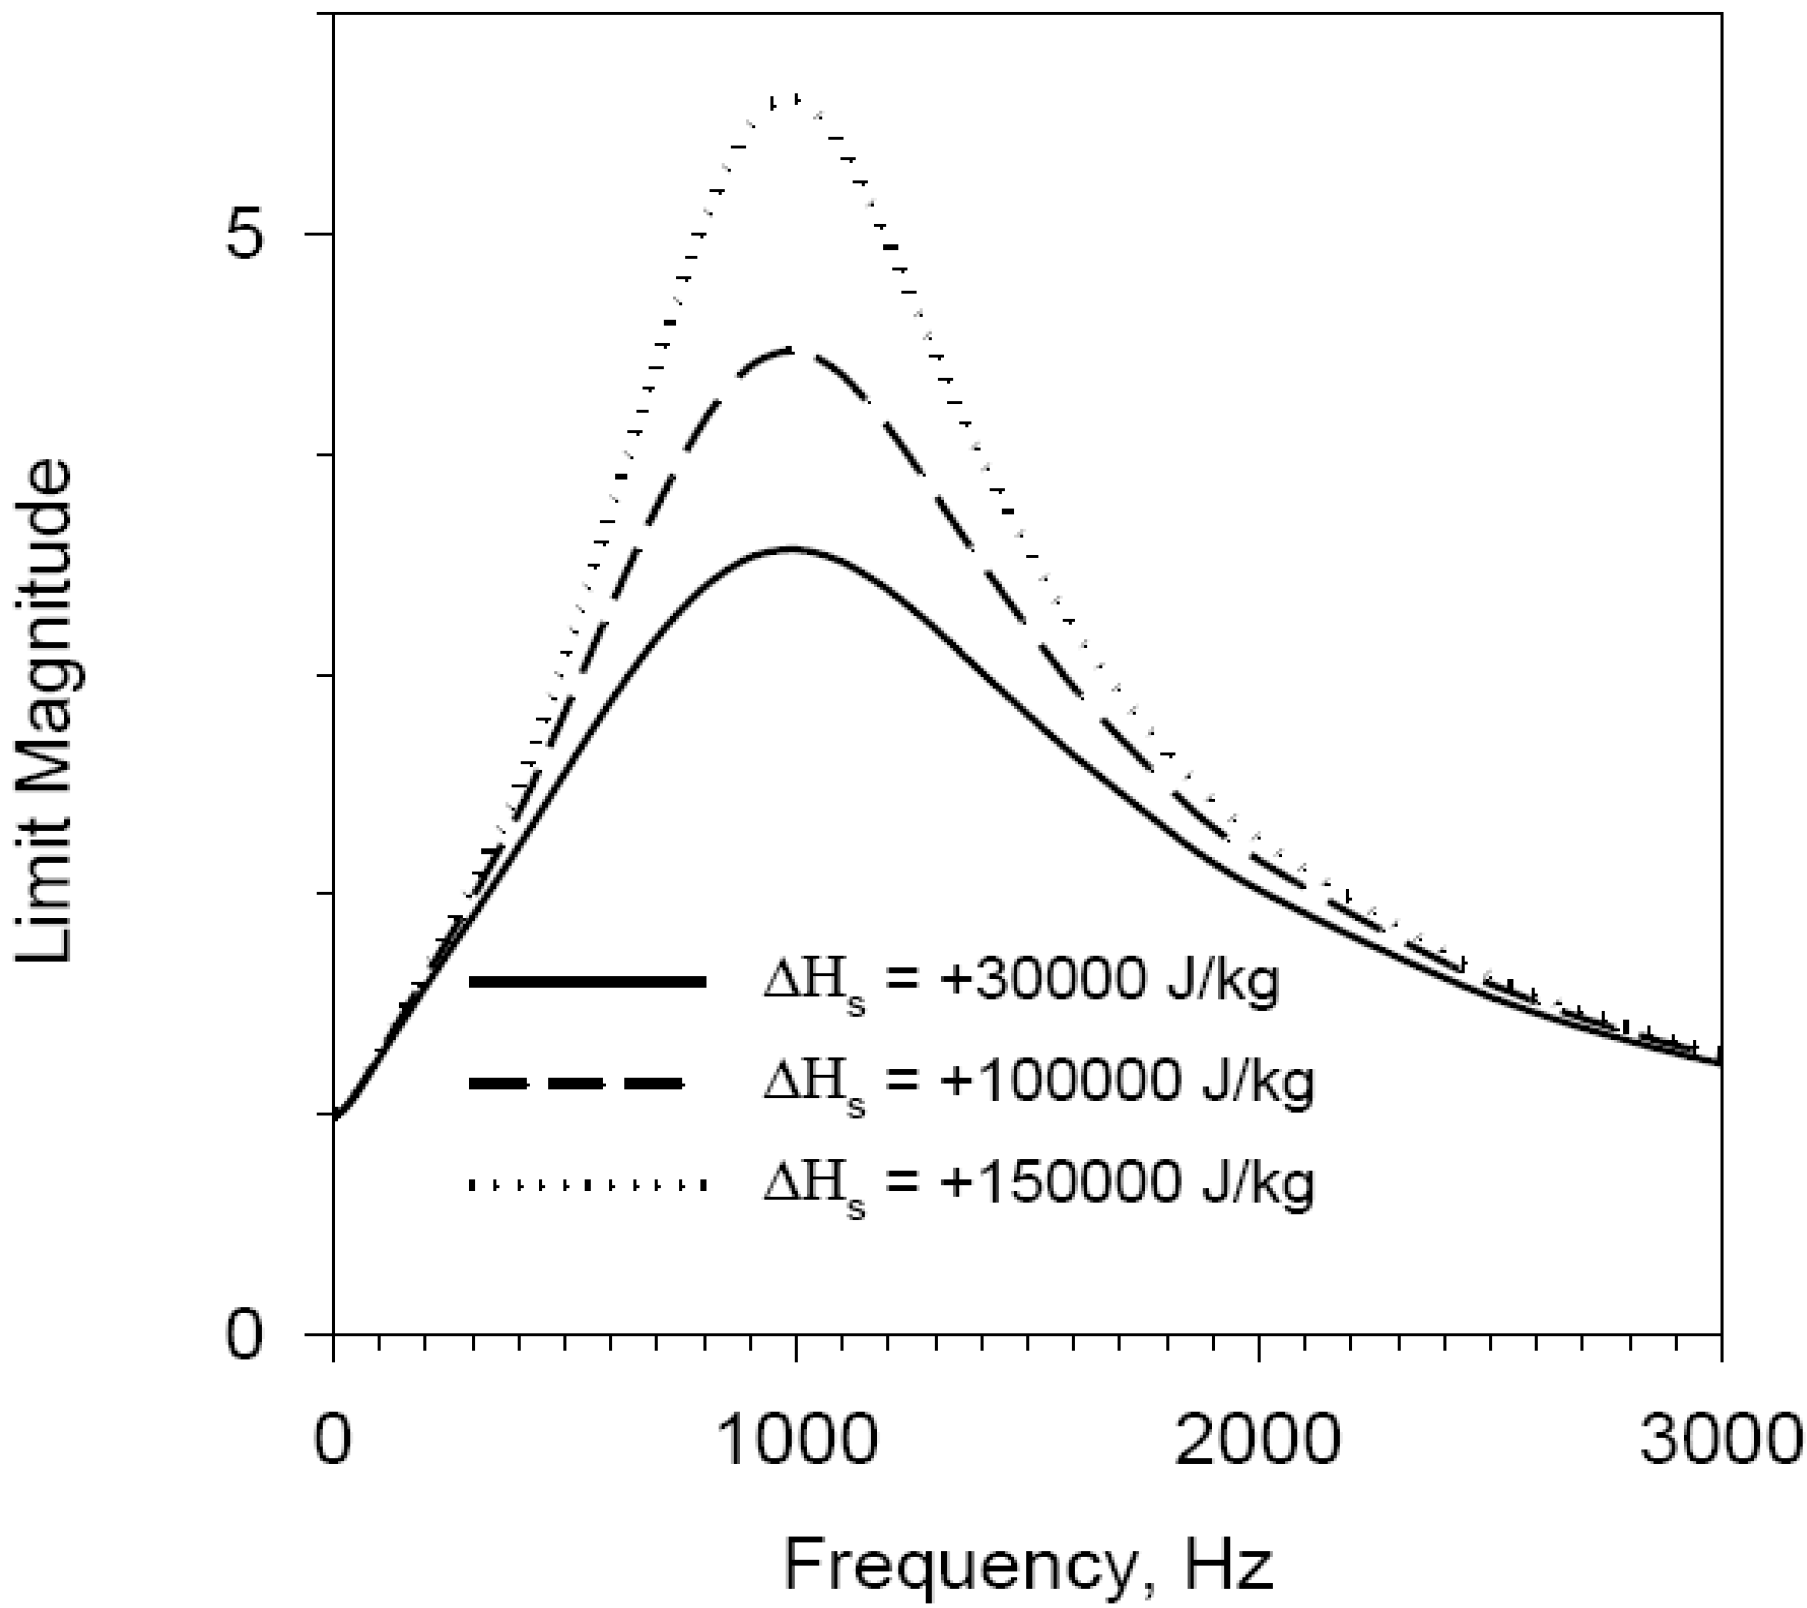
3], is a smaller cylindrical-grain design with an aluminum casing and static-test steel sleeve, with a relatively large length-to-diameter ratio. The motor at the time of pulsing has a moderate port-to-throat area ratio, with a considerable propellant web thickness remaining. As noted earlier, the focus of the present study will be on cases involving single-phase flow (no substantial inert or reactive particle loading). The predicted frequency response for the AP/HTPB propellant at three different settings for the net surface heat release value may be viewed in
Figure 3 (positive value for Δ
Hs, exothermic heat release). The general response is given in terms of the nondimensional limit magnitude
, defined by
where the reference burning rate
rb,o in this case is the motor’s approximate mean burn rate at the point of pulsing (1.27 cm/s). The propellant’s resonant frequency
fr is set via the value of
Kb (20,000 s
−1) to be on the order of 1 kHz (a value within the range of what might be expected for this type of composite propellant at that base burning rate). This value for
fr is in fact relatively close to the fundamental longitudinal acoustic frequency
f1L of the combustion chamber, in providing examples later in this paper that are close to the worst-case scenario for susceptibility to axial combustion instability symptoms.
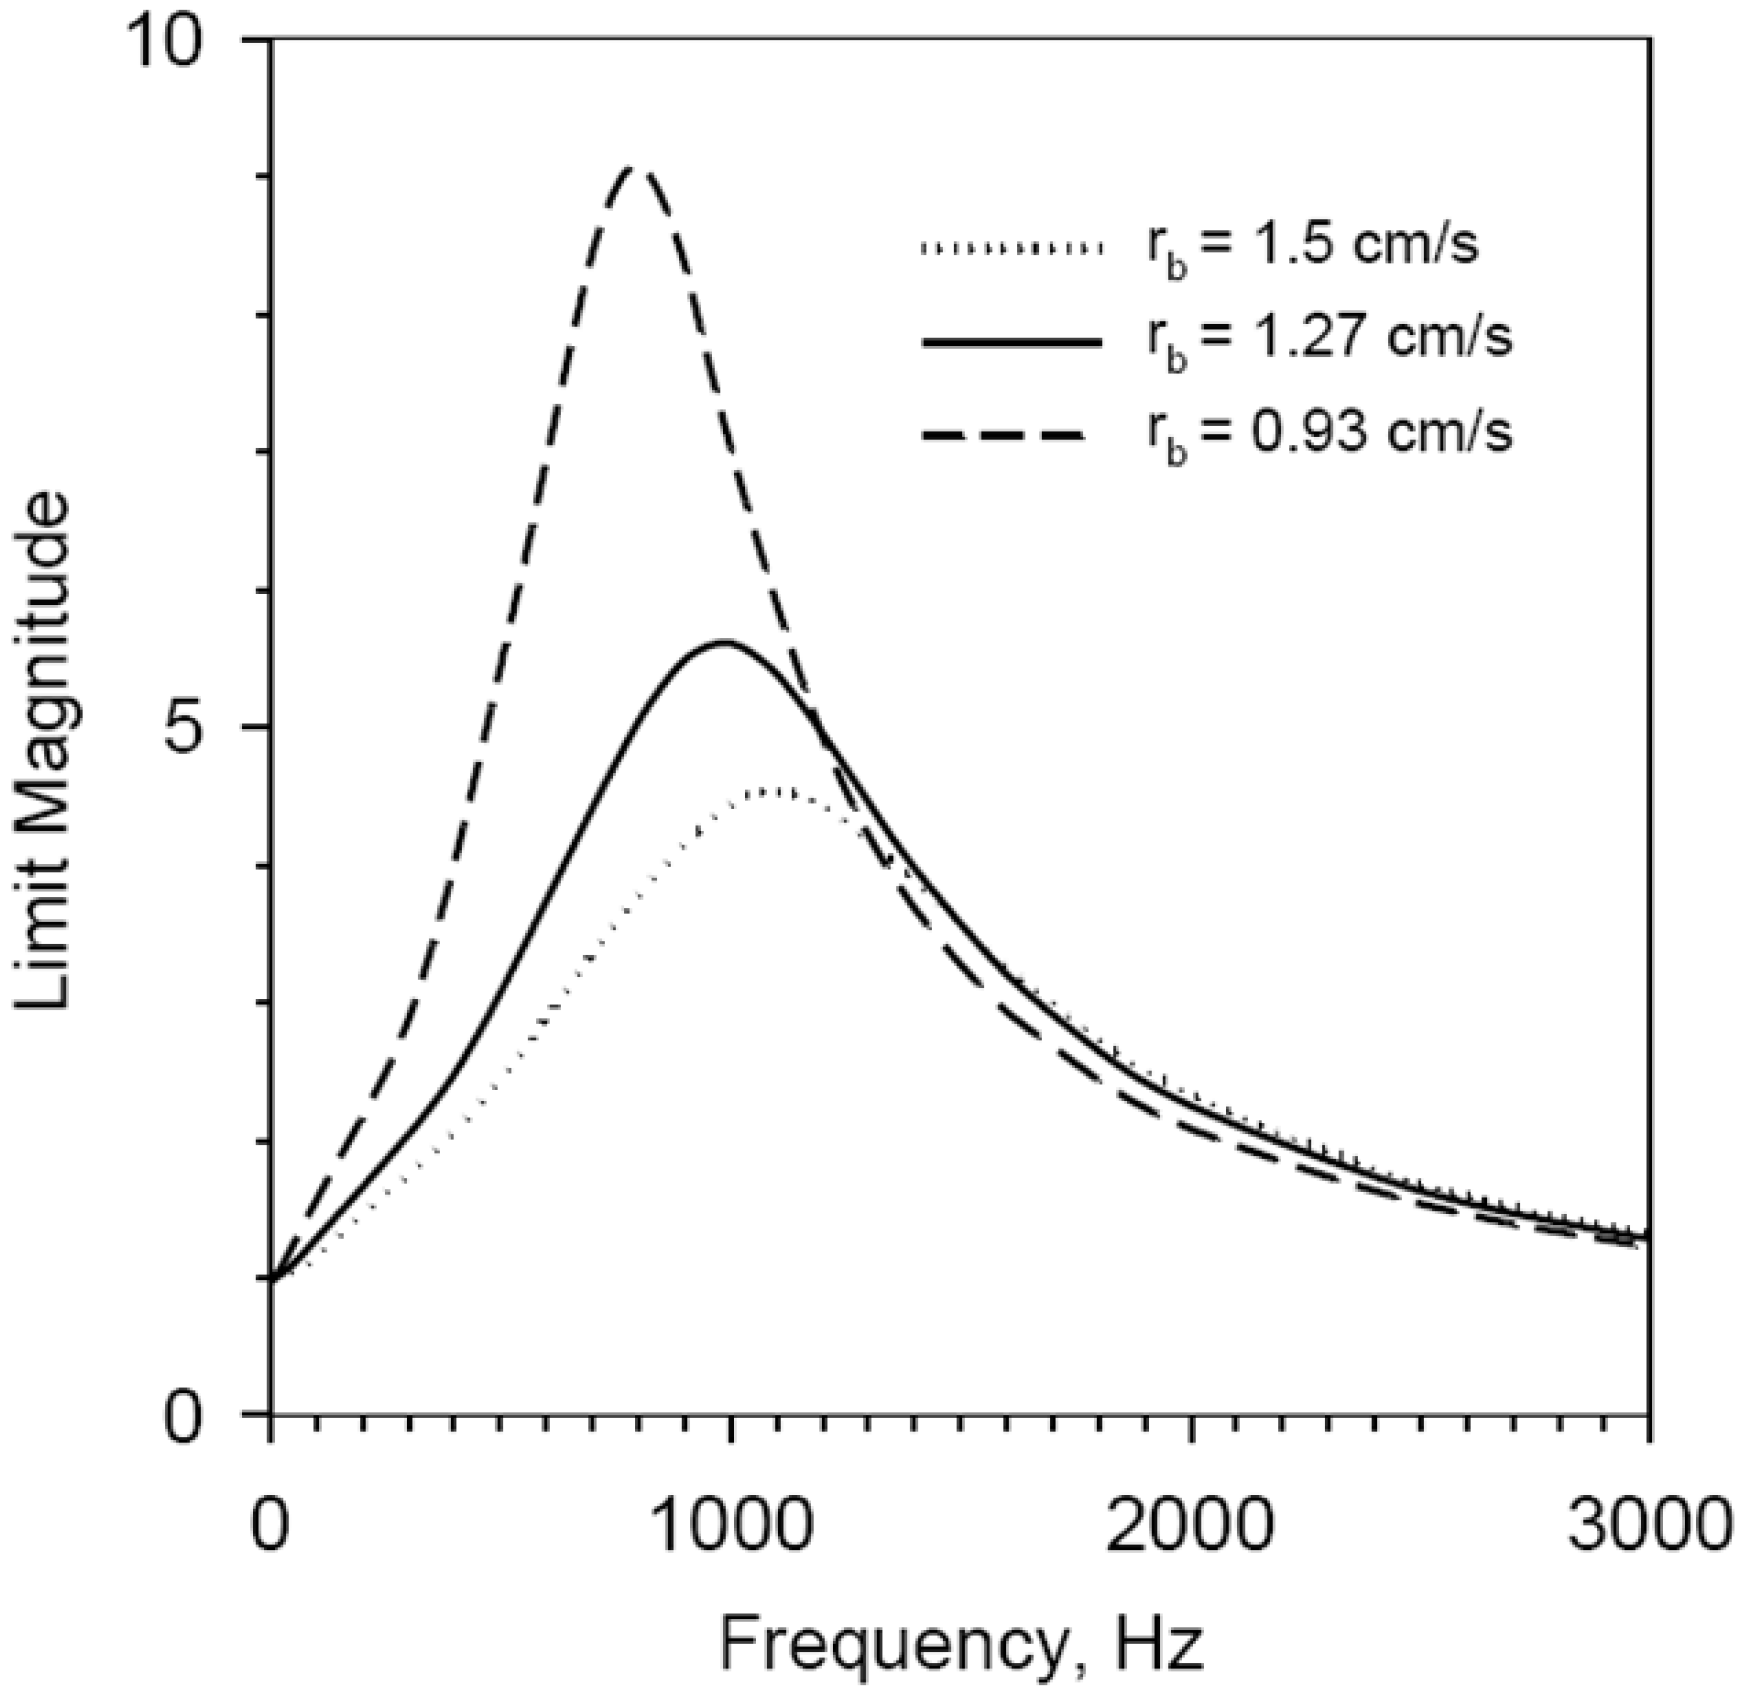
Figure 4 illustrates the effect of changing the base burning rate, whereby a lower base rate increases the propellant’s transient response, and lowers the resonant frequency thereof. The selected base burning rate values used for
Figure 3 are relevant to results presented later in this paper.
Table 1.
Reference motor characteristics.
Table 1.
Reference motor characteristics.
| Characteristic | Value |
|---|
| Propellant grain length, | 52 cm |
| Initial port diameter, dp,i | 3.6 cm |
| Nozzle throat diameter, dt | 1.6 cm |
| Grain/nozzle-convergence length ratio, | 16:1 |
| Propellant specific heat, Cs | 1500 J/kg·K |
| Propellant density, ρs | 1730 kg/m3 |
| Propellant thermal conductivity, ks | 0.4 W/m·K |
| Propellant thermal diffusivity, αs | 1.54 × 10⁻⁷ m2/s |
| Propellant flame temperature, Tf | 3000 K |
| Propellant surface temperature, Ts | 1000 K |
| Propellant initial temperature, Ti | 294 K |
| Gas specific heat, Cp | 1,920 J/kg·K |
| Specific gas constant, R | 320 J/kg·K |
| Gas thermal conductivity, k | 0.2 W/m·K |
| Gas absolute viscosity, μ | 8.07 × 10⁻⁵ kg/m·s |
| Gas specific heat ratio, γ | 1.2 |
| De St. Robert exponent, n | 0.35 |
| De St. Robert coefficient, C | 0.05 cm/s·(kPa) n |
| Particle mass fraction, αp | 0% |
| Propellant elastic modulus, EA | 45 MPa |
| Propellant Poisson’s ratio, υA | 0.497 |
| Casing inner wall radius, rm | 3.24 cm |
| Casing wall thickness, hB | 0.127 cm |
| Casing material density, ρB | 2700 kg/m3 |
| Casing elastic modulus, EB | 80 GPa |
| Casing material Poisson’s ratio, υB | 0.33 |
| Sleeve wall thickness, hC | 0.47 cm |
| Sleeve material density, ρC | 7850 kg/m3 |
| Sleeve elastic modulus, EC | 200 GPa |
| Sleeve material Poisson’s ratio, υC | 0.30 |
| Casing/prop. rad. damping ratio, ξR | 0.35 |
| Casing/prop. long. damping ratio, ξL | 0.10 |
Figure 3.
Frequency response of reference propellant (Kb = 20,000 s−1; differing values for ΔHs; rb,o = 1.27 cm/s) in terms of nondimensional limit magnitude.
Figure 3.
Frequency response of reference propellant (Kb = 20,000 s−1; differing values for ΔHs; rb,o = 1.27 cm/s) in terms of nondimensional limit magnitude.
Figure 4.
Frequency response of reference propellant (Kb = 20,000 s−1; ΔHs = 150,000 J/kg; differing values for rb,o) in terms of nondimensional limit magnitude.
Figure 4.
Frequency response of reference propellant (Kb = 20,000 s−1; ΔHs = 150,000 J/kg; differing values for rb,o) in terms of nondimensional limit magnitude.
Pertinent key factors can be varied in a series of test simulations, and evaluated for any identifiable trend as relates to the prediction of axial combustion instability symptoms in actual motors.
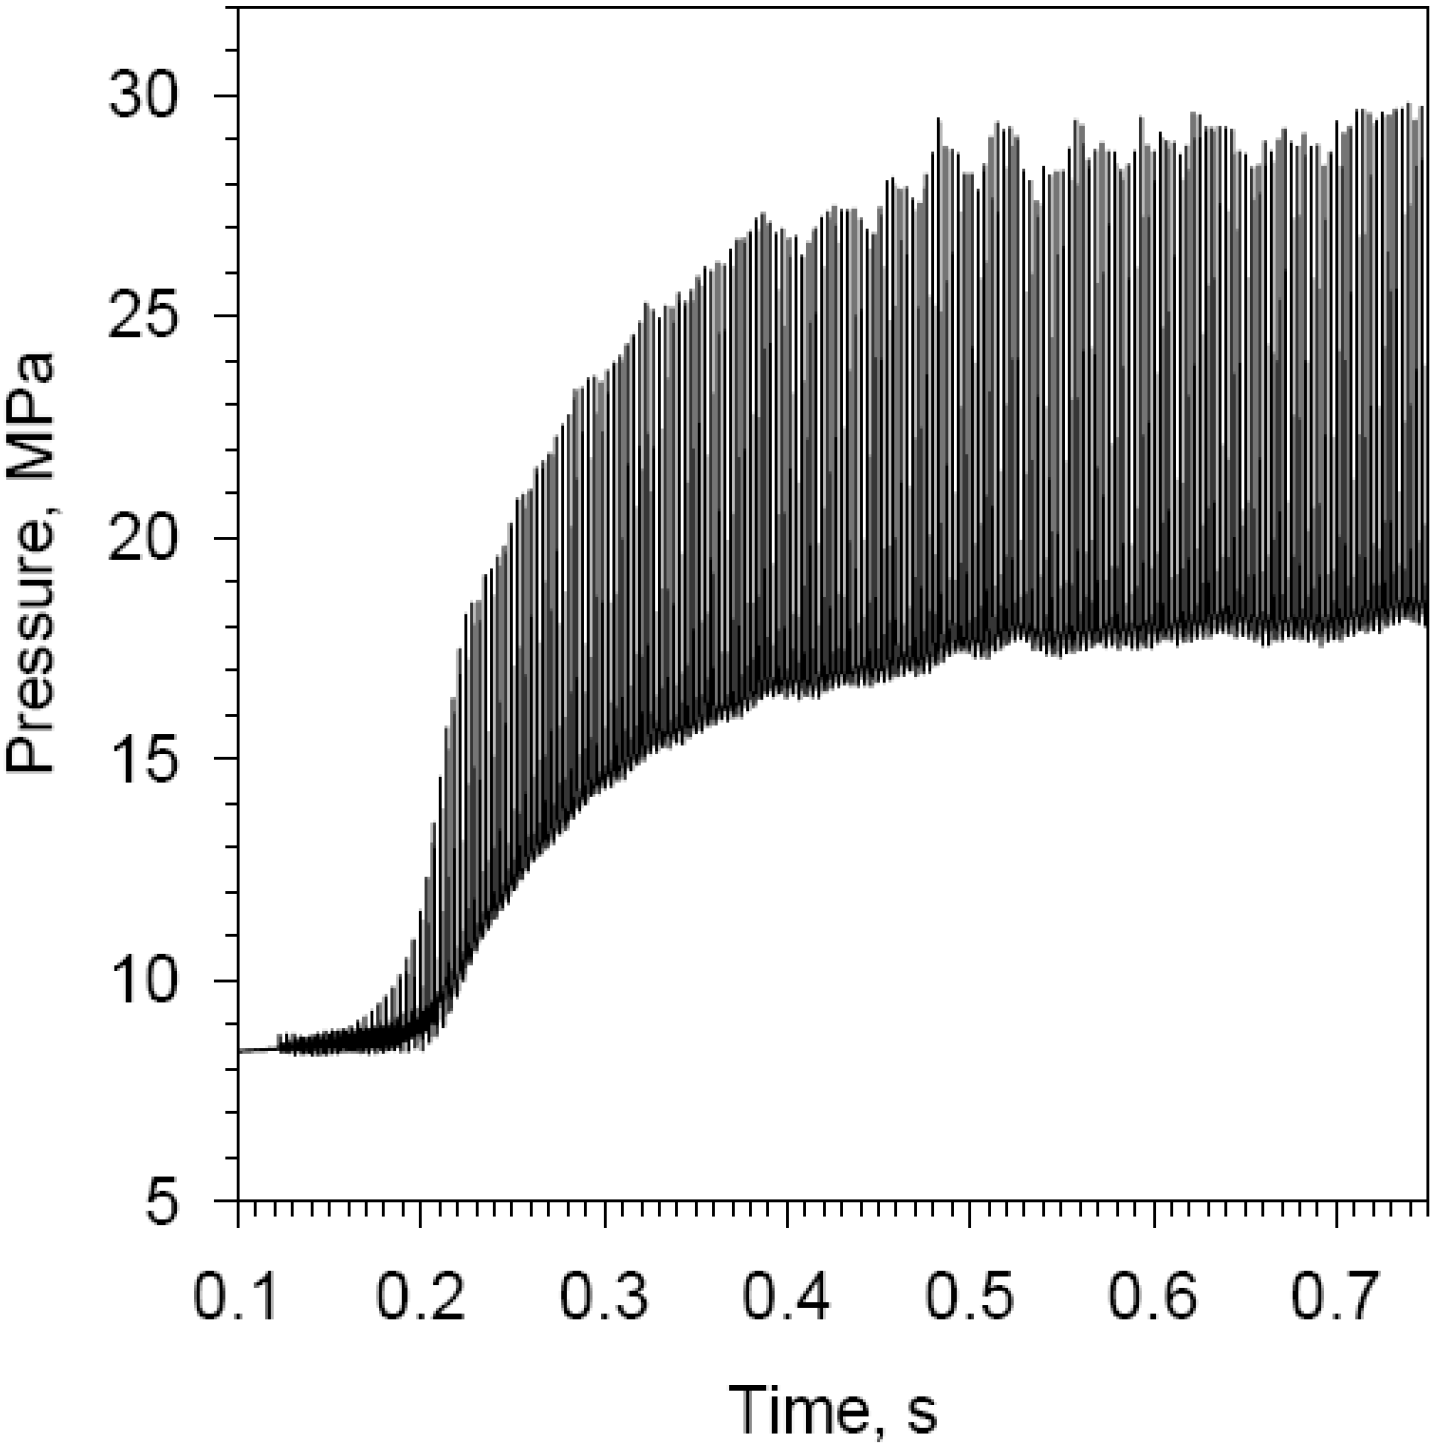
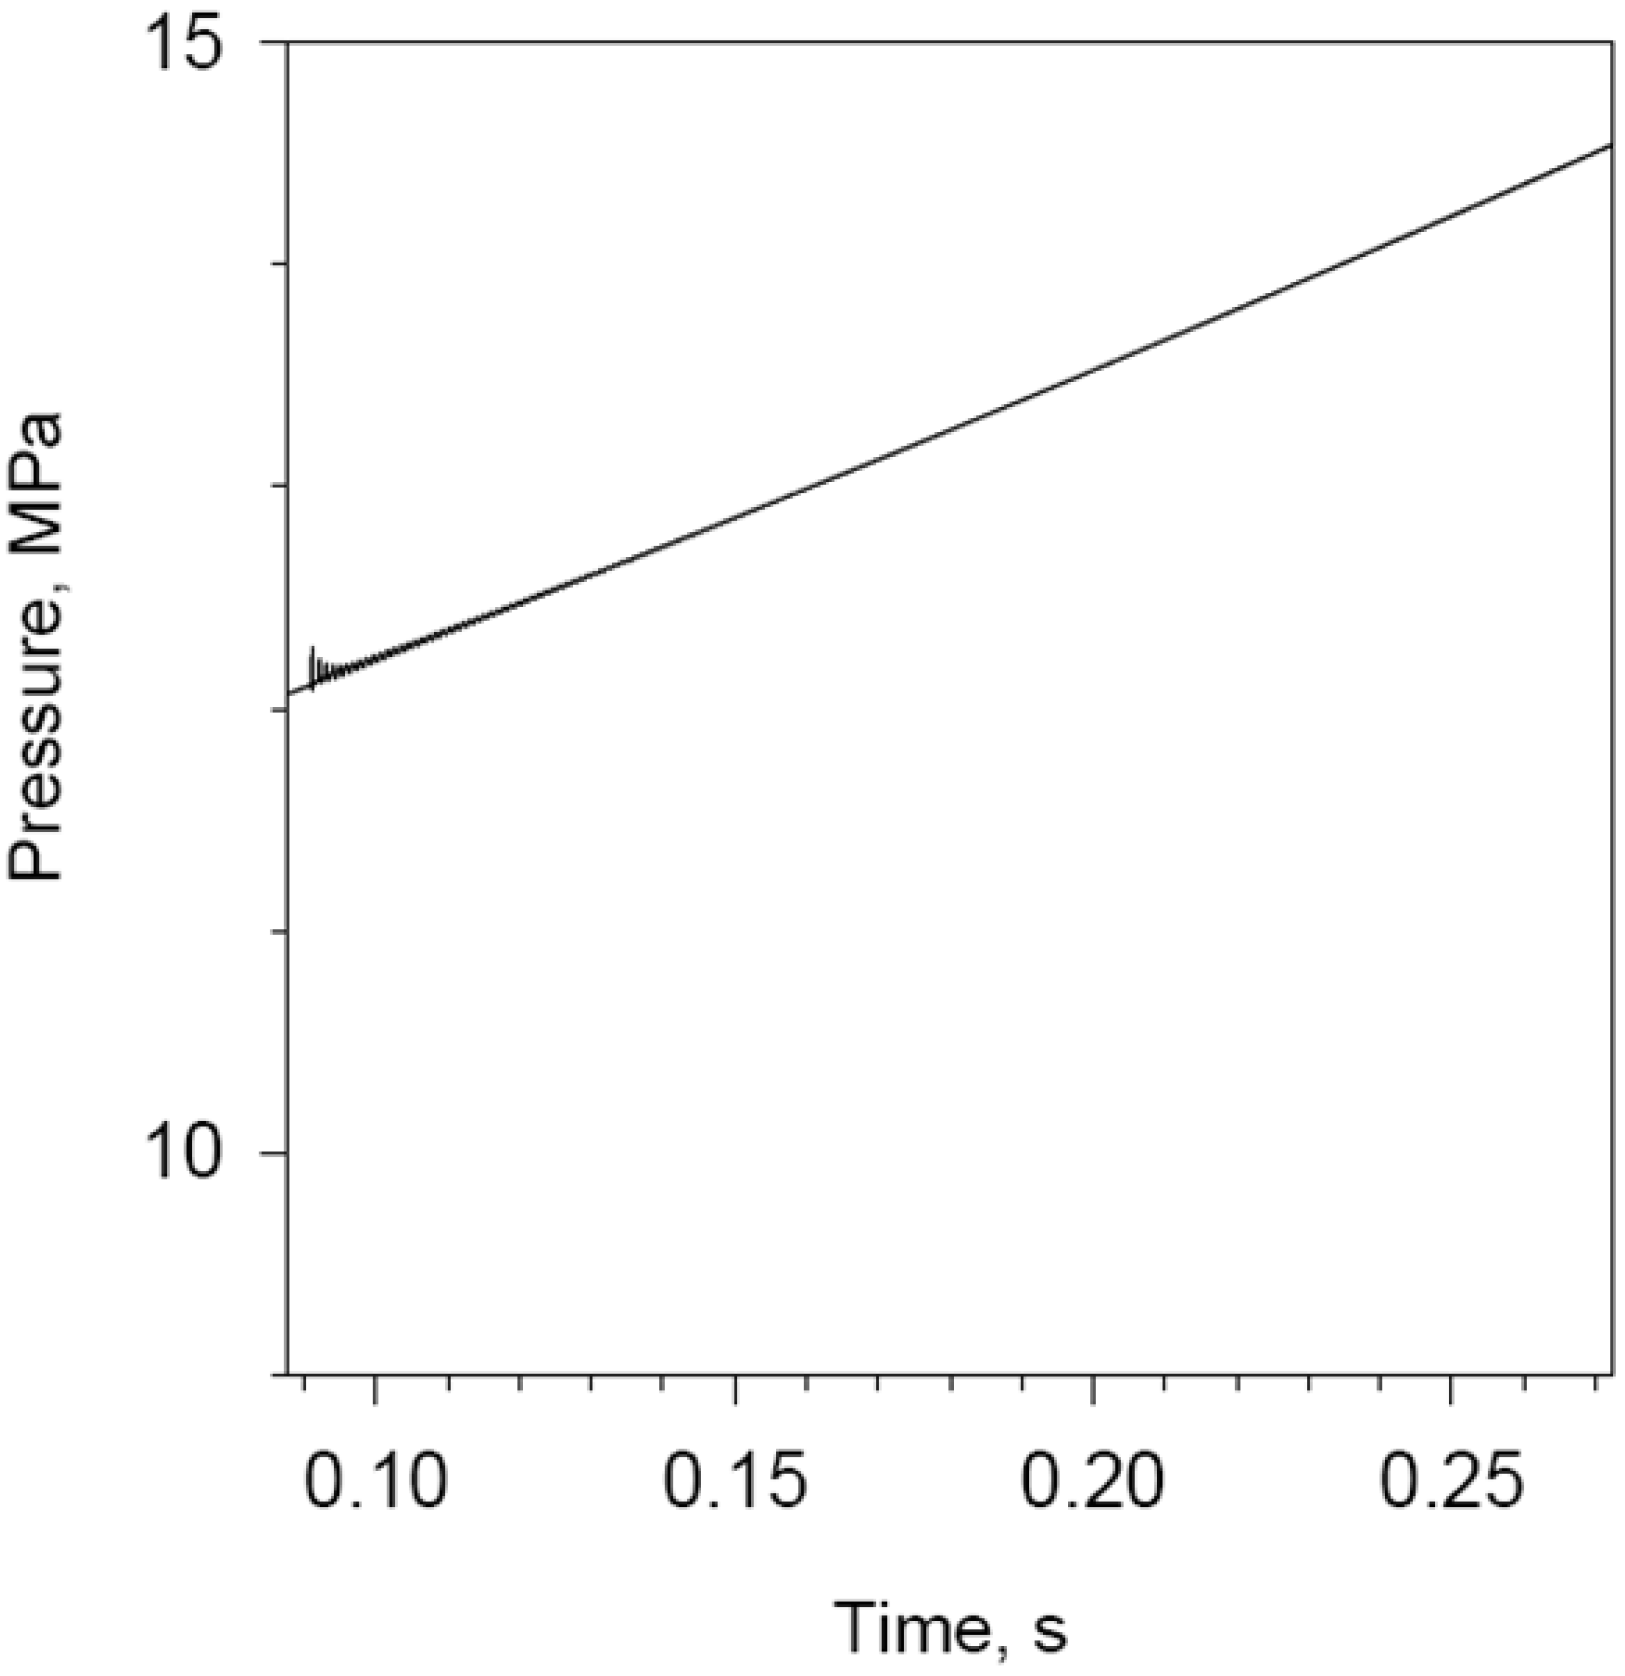
Figure 5 illustrates a segment of a simulated reference motor firing’s head-end pressure-time profile, showing a sustained axial wave system after the initial 2-atm pulse disturbance is introduced. In this case (and for subsequent runs, in order to narrow the scope of the present paper), the effect of acceleration [
5] on the combustion process has been nullified. The sustained pressure wave is not shock-fronted [
5], and one can note the apparent absence of an appreciable dc shift (rise in base chamber pressure).
Figure 5.
Predicted head-end pressure-time profile, reference motor (C = 5.0 × 10⁻⁴ m/s kPan; ΔHs = 150,000 J/kg; Δpd = 2 atm), acceleration nullified.
Figure 5.
Predicted head-end pressure-time profile, reference motor (C = 5.0 × 10⁻⁴ m/s kPan; ΔHs = 150,000 J/kg; Δpd = 2 atm), acceleration nullified.
Moving to a somewhat higher base pressure-dependent burning rate (approx. 1.5 cm/s
vs. 1.27 cm/s) by increasing de St. Robert coefficient
C (where
rb,o =
Cpn) , one can clearly see the result on the pressure-wave profile as provided in
Figure 6, for the case of acceleration being nullfied. After the intial disturbance, the axial pressure wave essentially dies out. At least two factors are at play in reducing the wave strength: (1) the combustion response resonant frequency
fr has been shifted higher, away from the acoustic chamber frequency
f1L, and (2) the combustion response magnitude has been lowered at
f1L , due to the higher base burning rate, as reflected by
Figure 4.
Figure 6.
Predicted head-end pressure-time profile, reference motor (C = 5.5 × 10⁻⁴ m/s·kPan; ΔHs = 150,000 J/kg; Δpd = 2 atm), acceleration nullified.
Figure 6.
Predicted head-end pressure-time profile, reference motor (C = 5.5 × 10⁻⁴ m/s·kPan; ΔHs = 150,000 J/kg; Δpd = 2 atm), acceleration nullified.
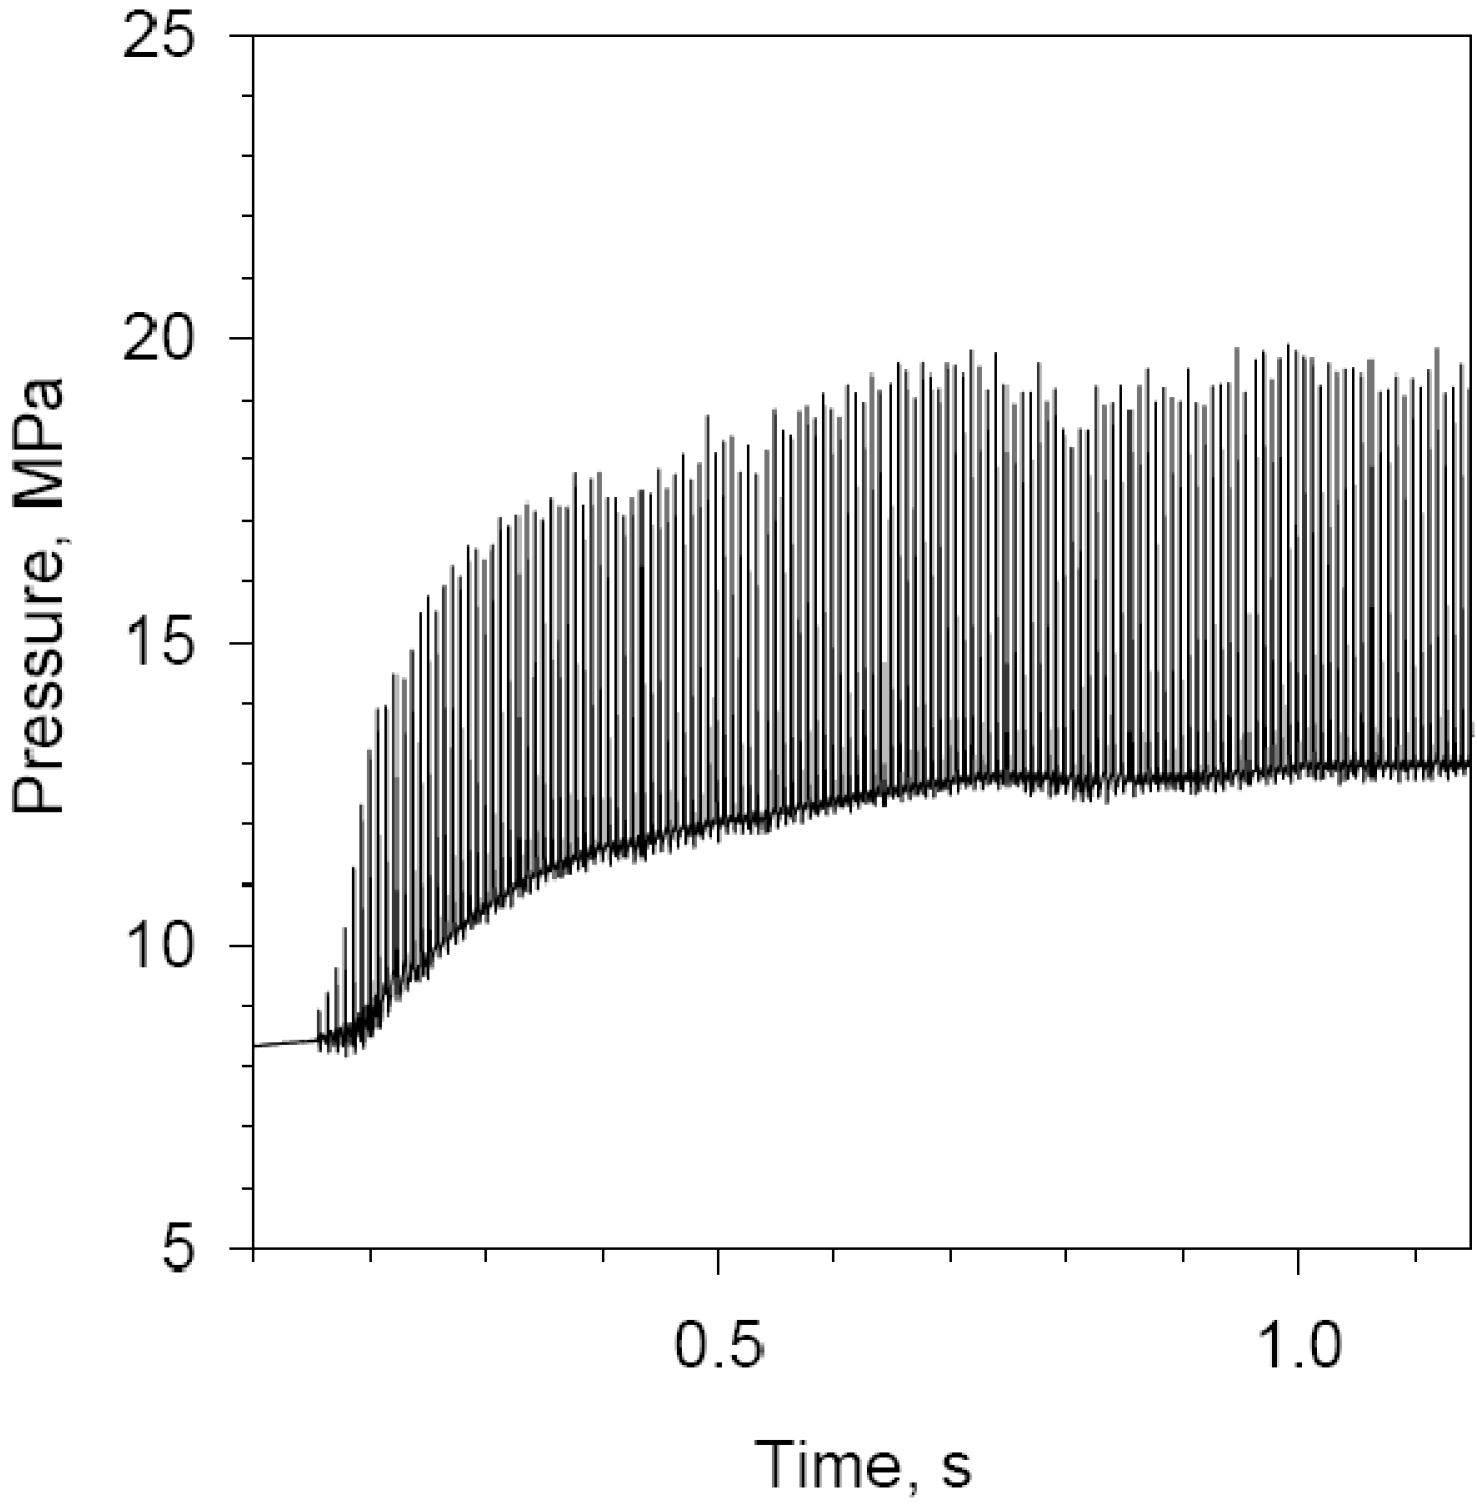
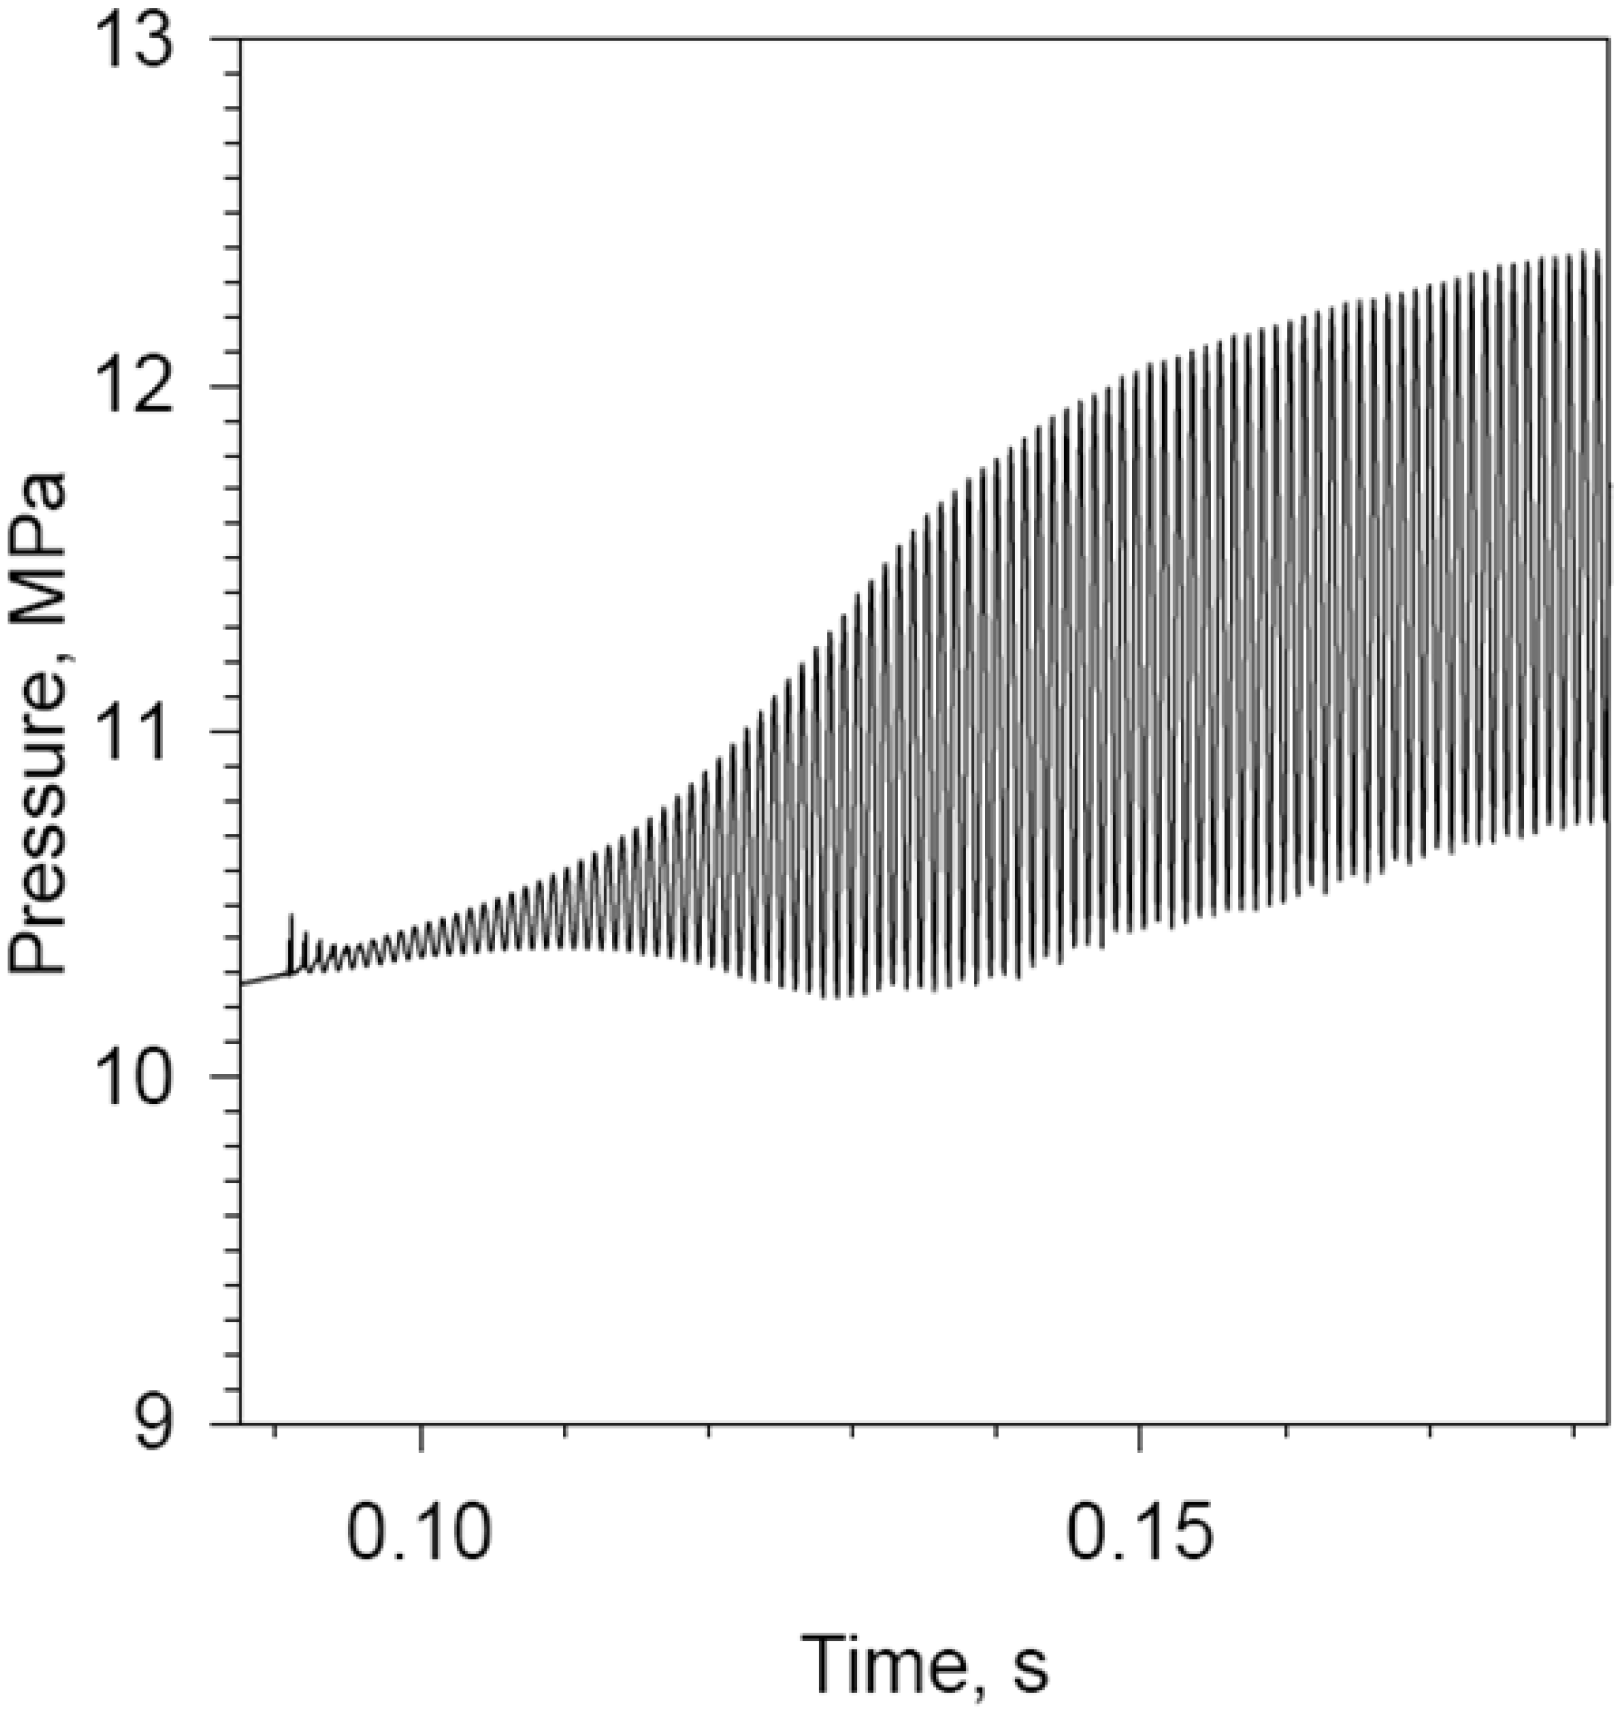
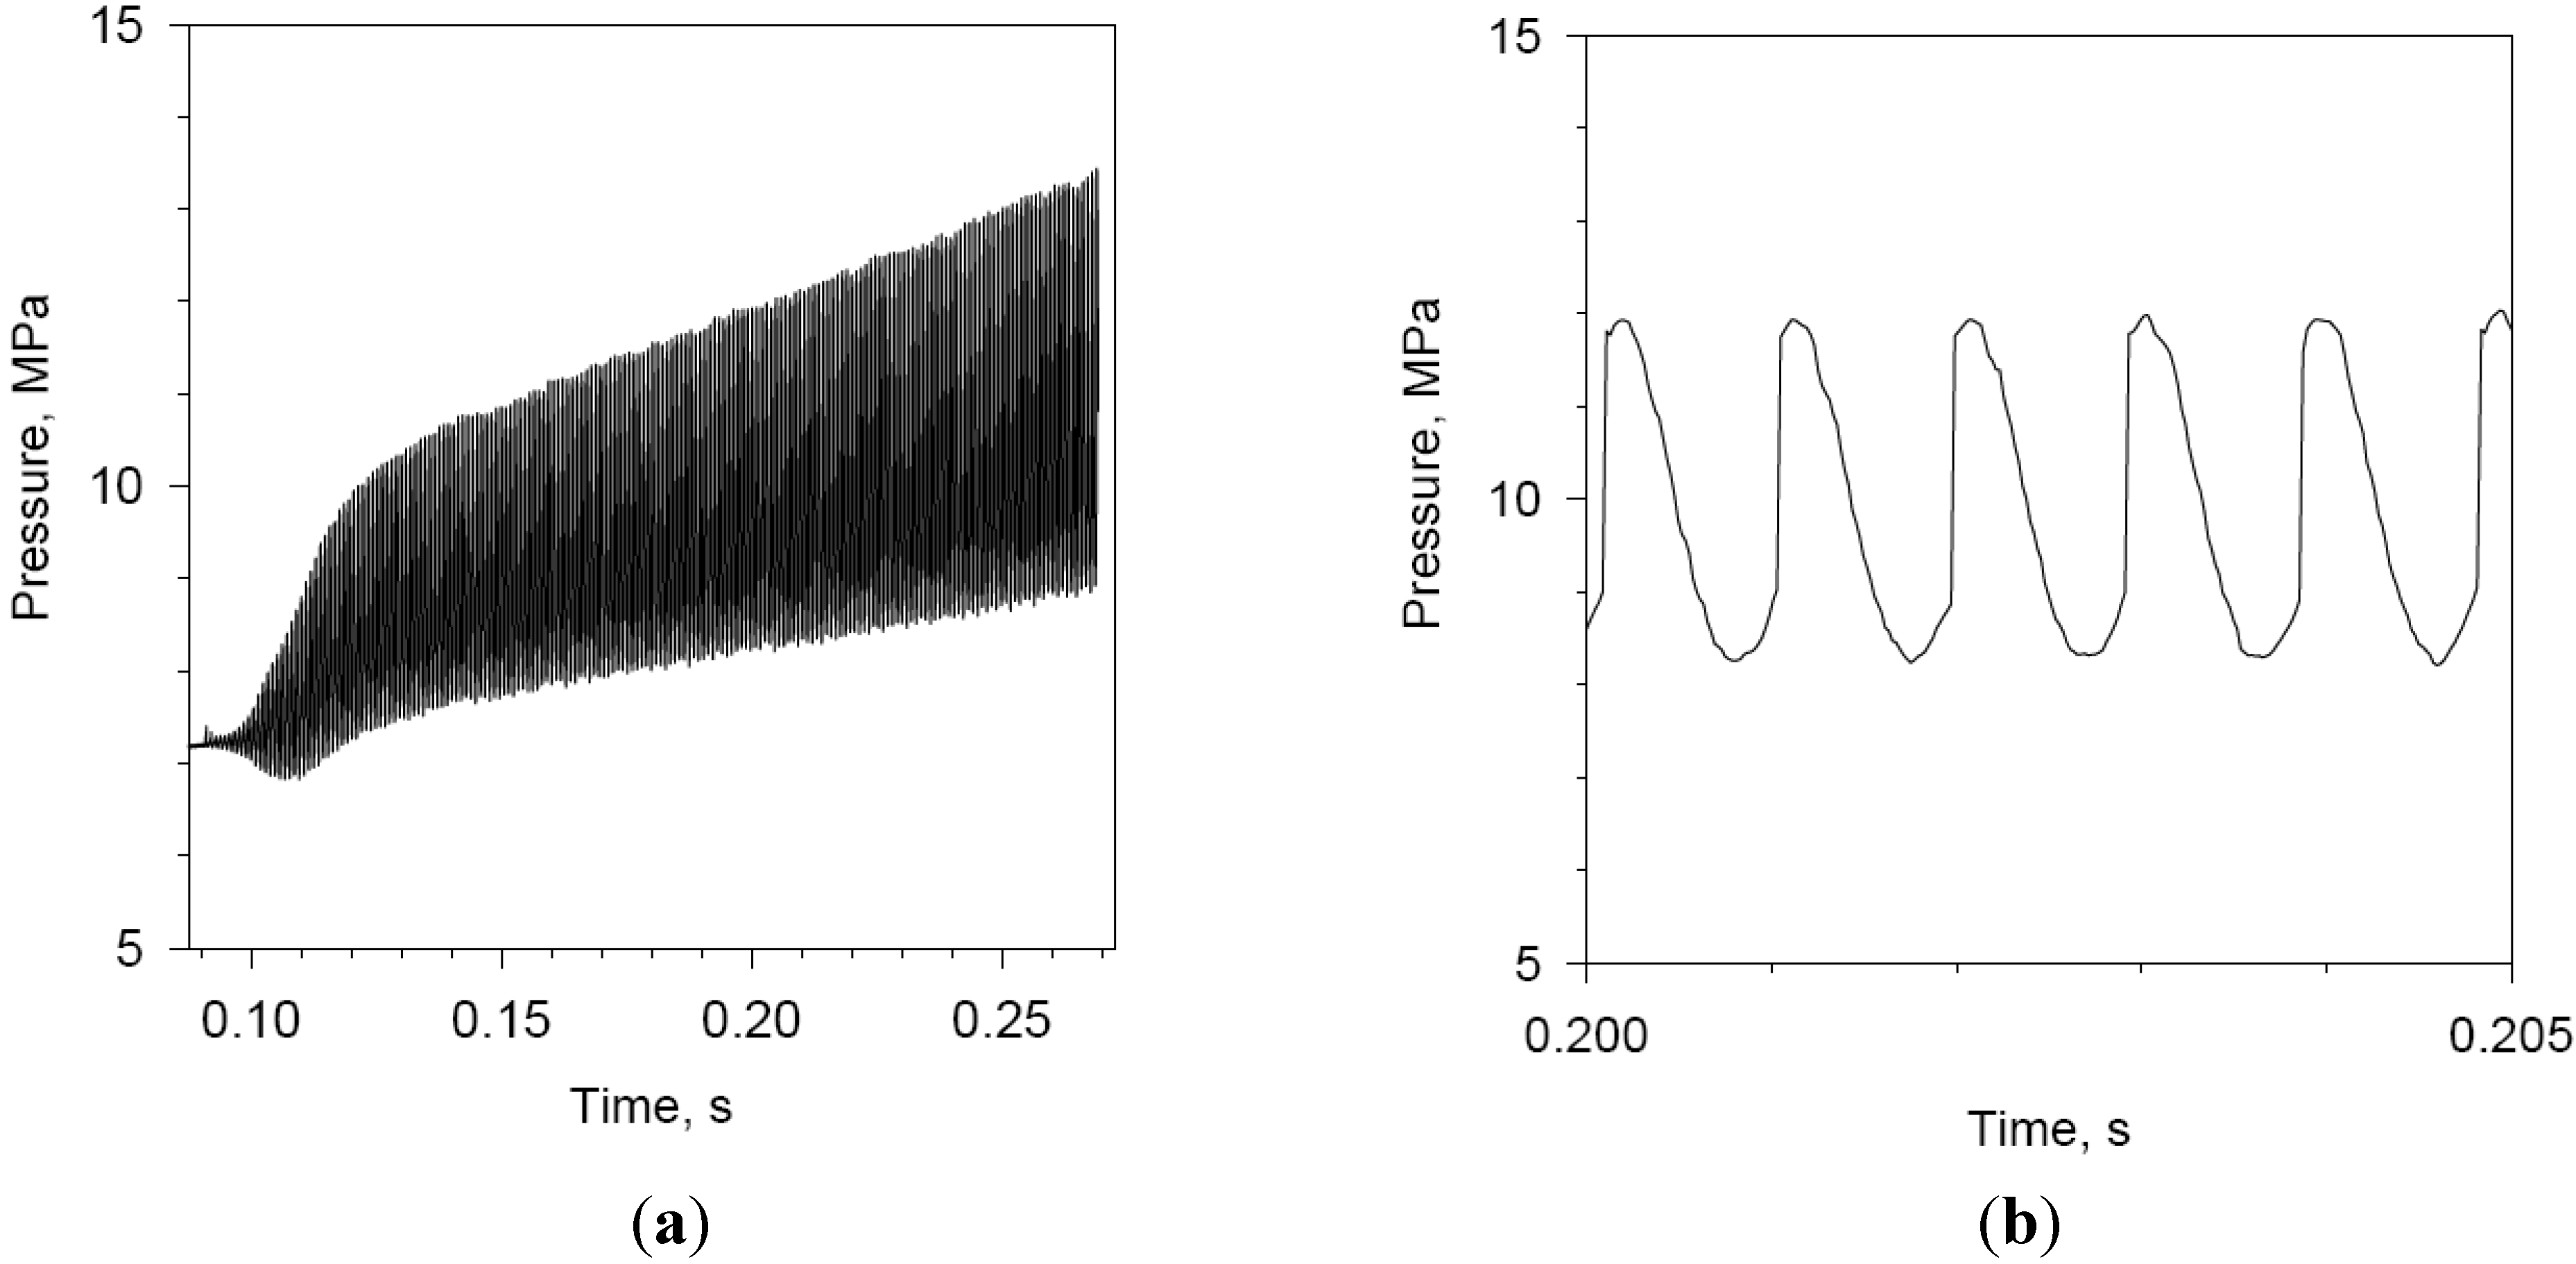
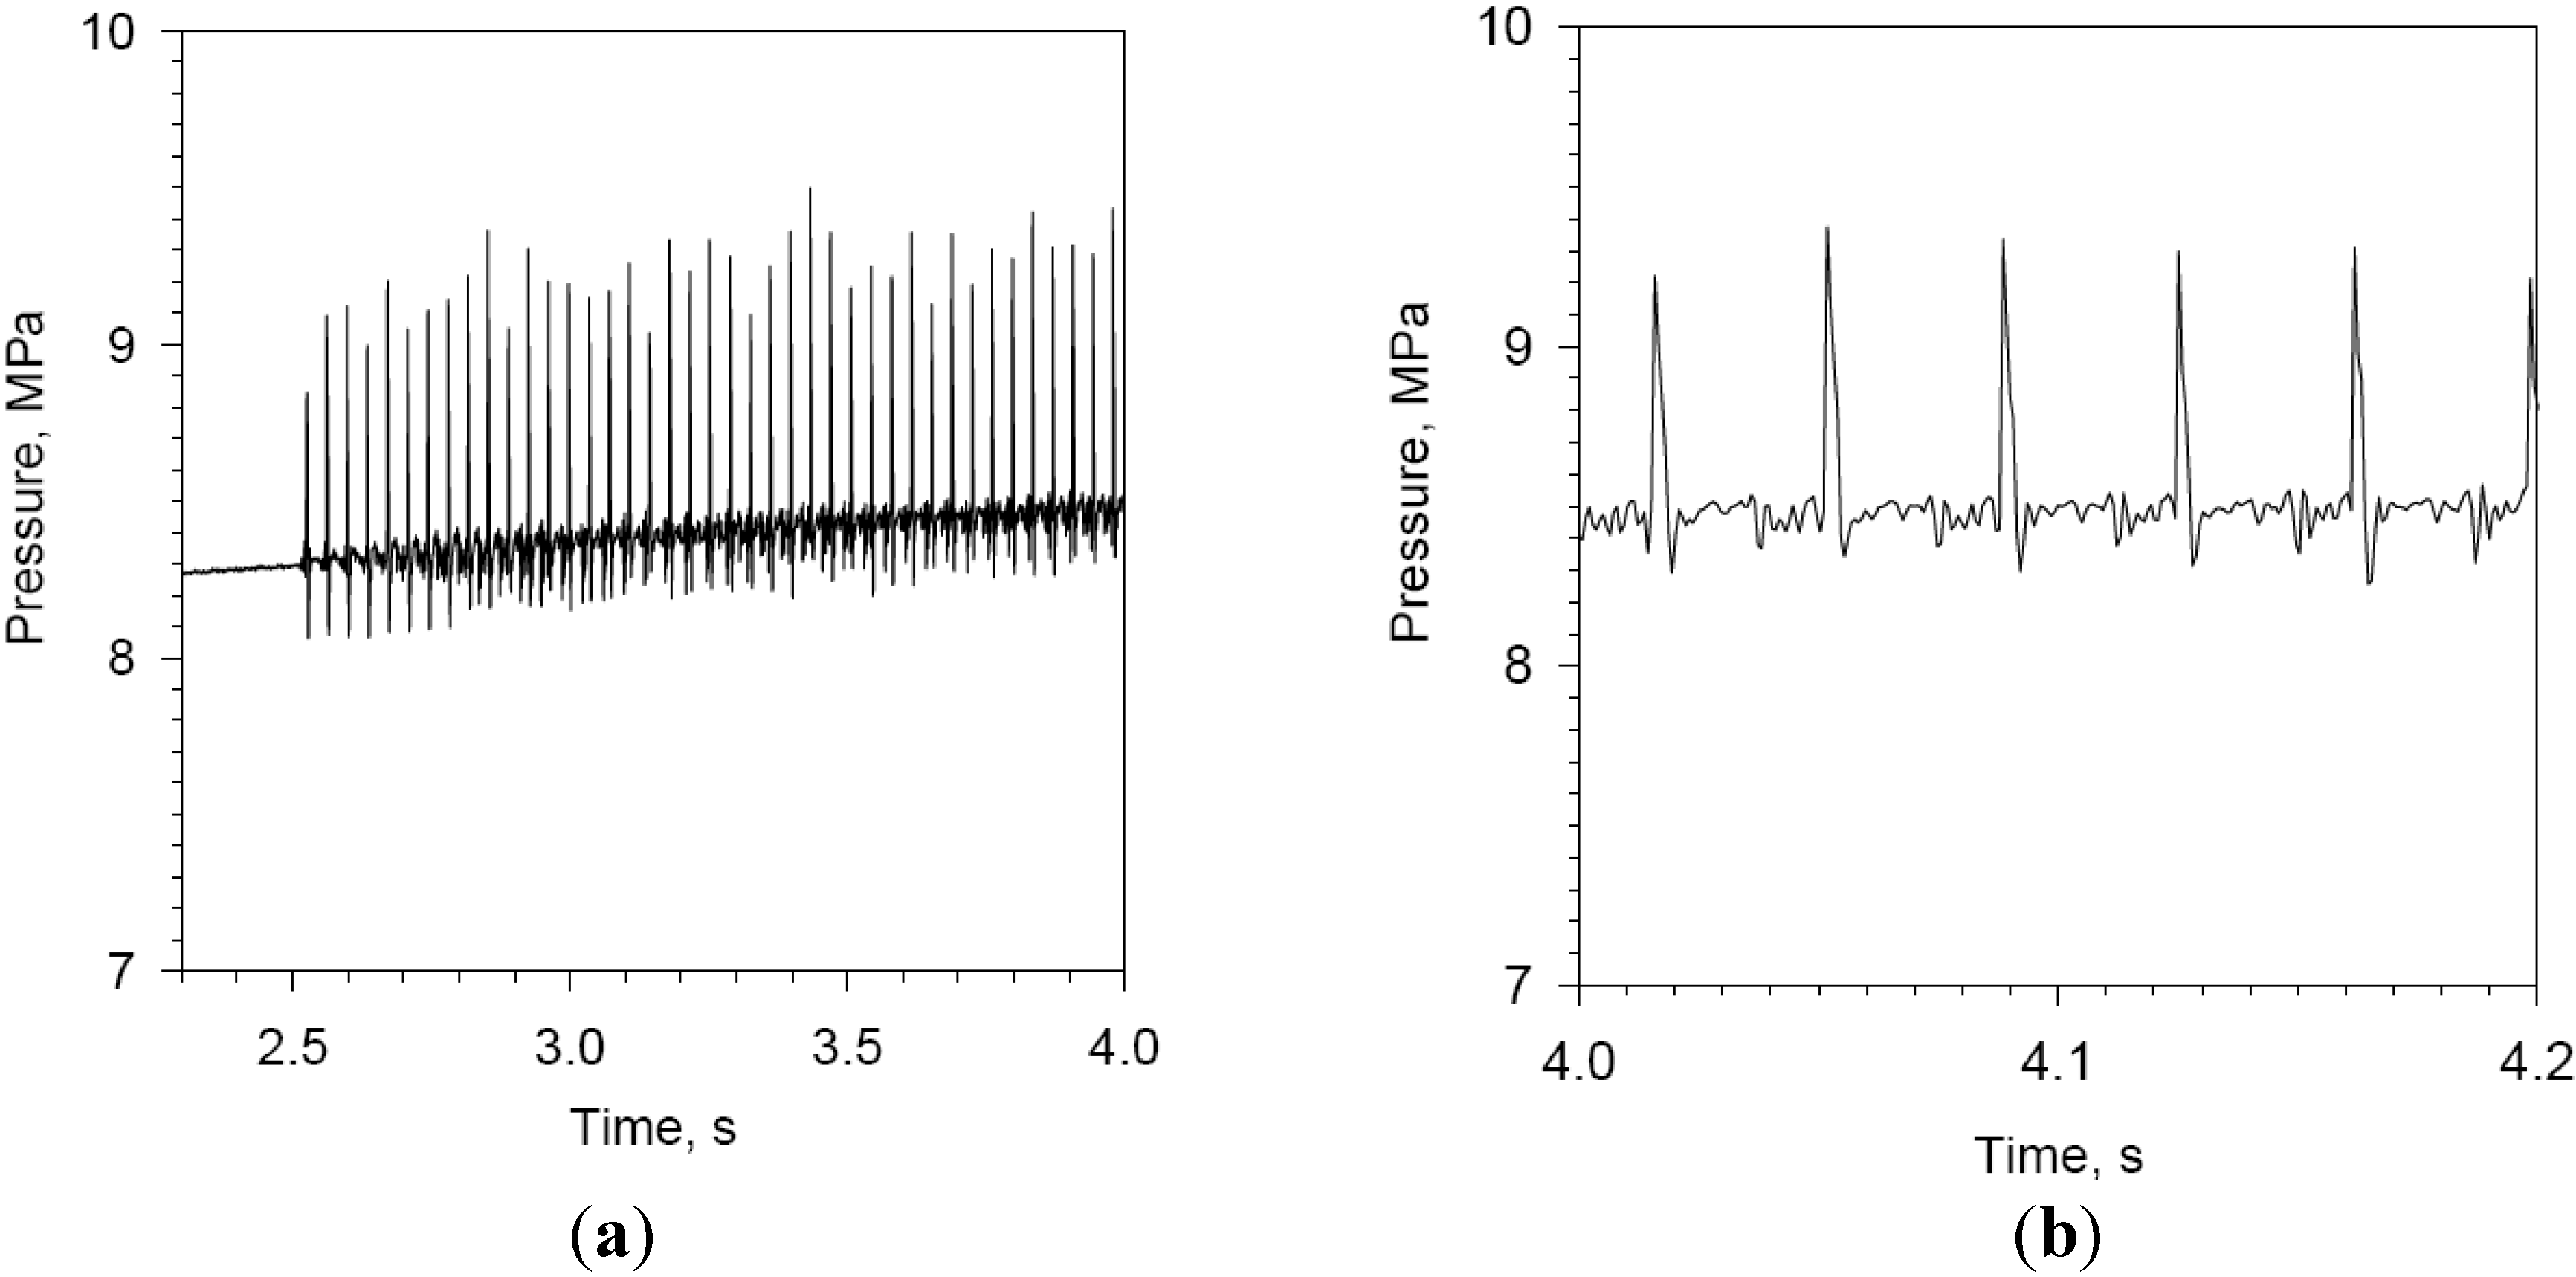
Moving to a lower base pressure-dependent burning rate (approx. 0.93 cm/s
vs. 1.27 cm/s) by lowering de St. Robert coefficient
C, one can observe the reverse from that seen earlier. The result is shown in
Figure 7. The limit pressure-wave magnitude later into the firing is now approaching 5 MPa, as compared to about 1.4 MPa for the case of
Figure 5. The 1L (fundamental longitudinal acoustic resonance) axial pressure wave becomes shock-fronted as observed in
Figure 7(b), and there is now also a substantial dc shift, even though no acceleration effects are being included. Thus, although the lower base rate will shift the combustion response resonant frequency to a value lower than
f1L, the combustion response magnitude is heightened sufficiently at
f1L to produce a substantial increase in limit pressure wave amplitude Δ
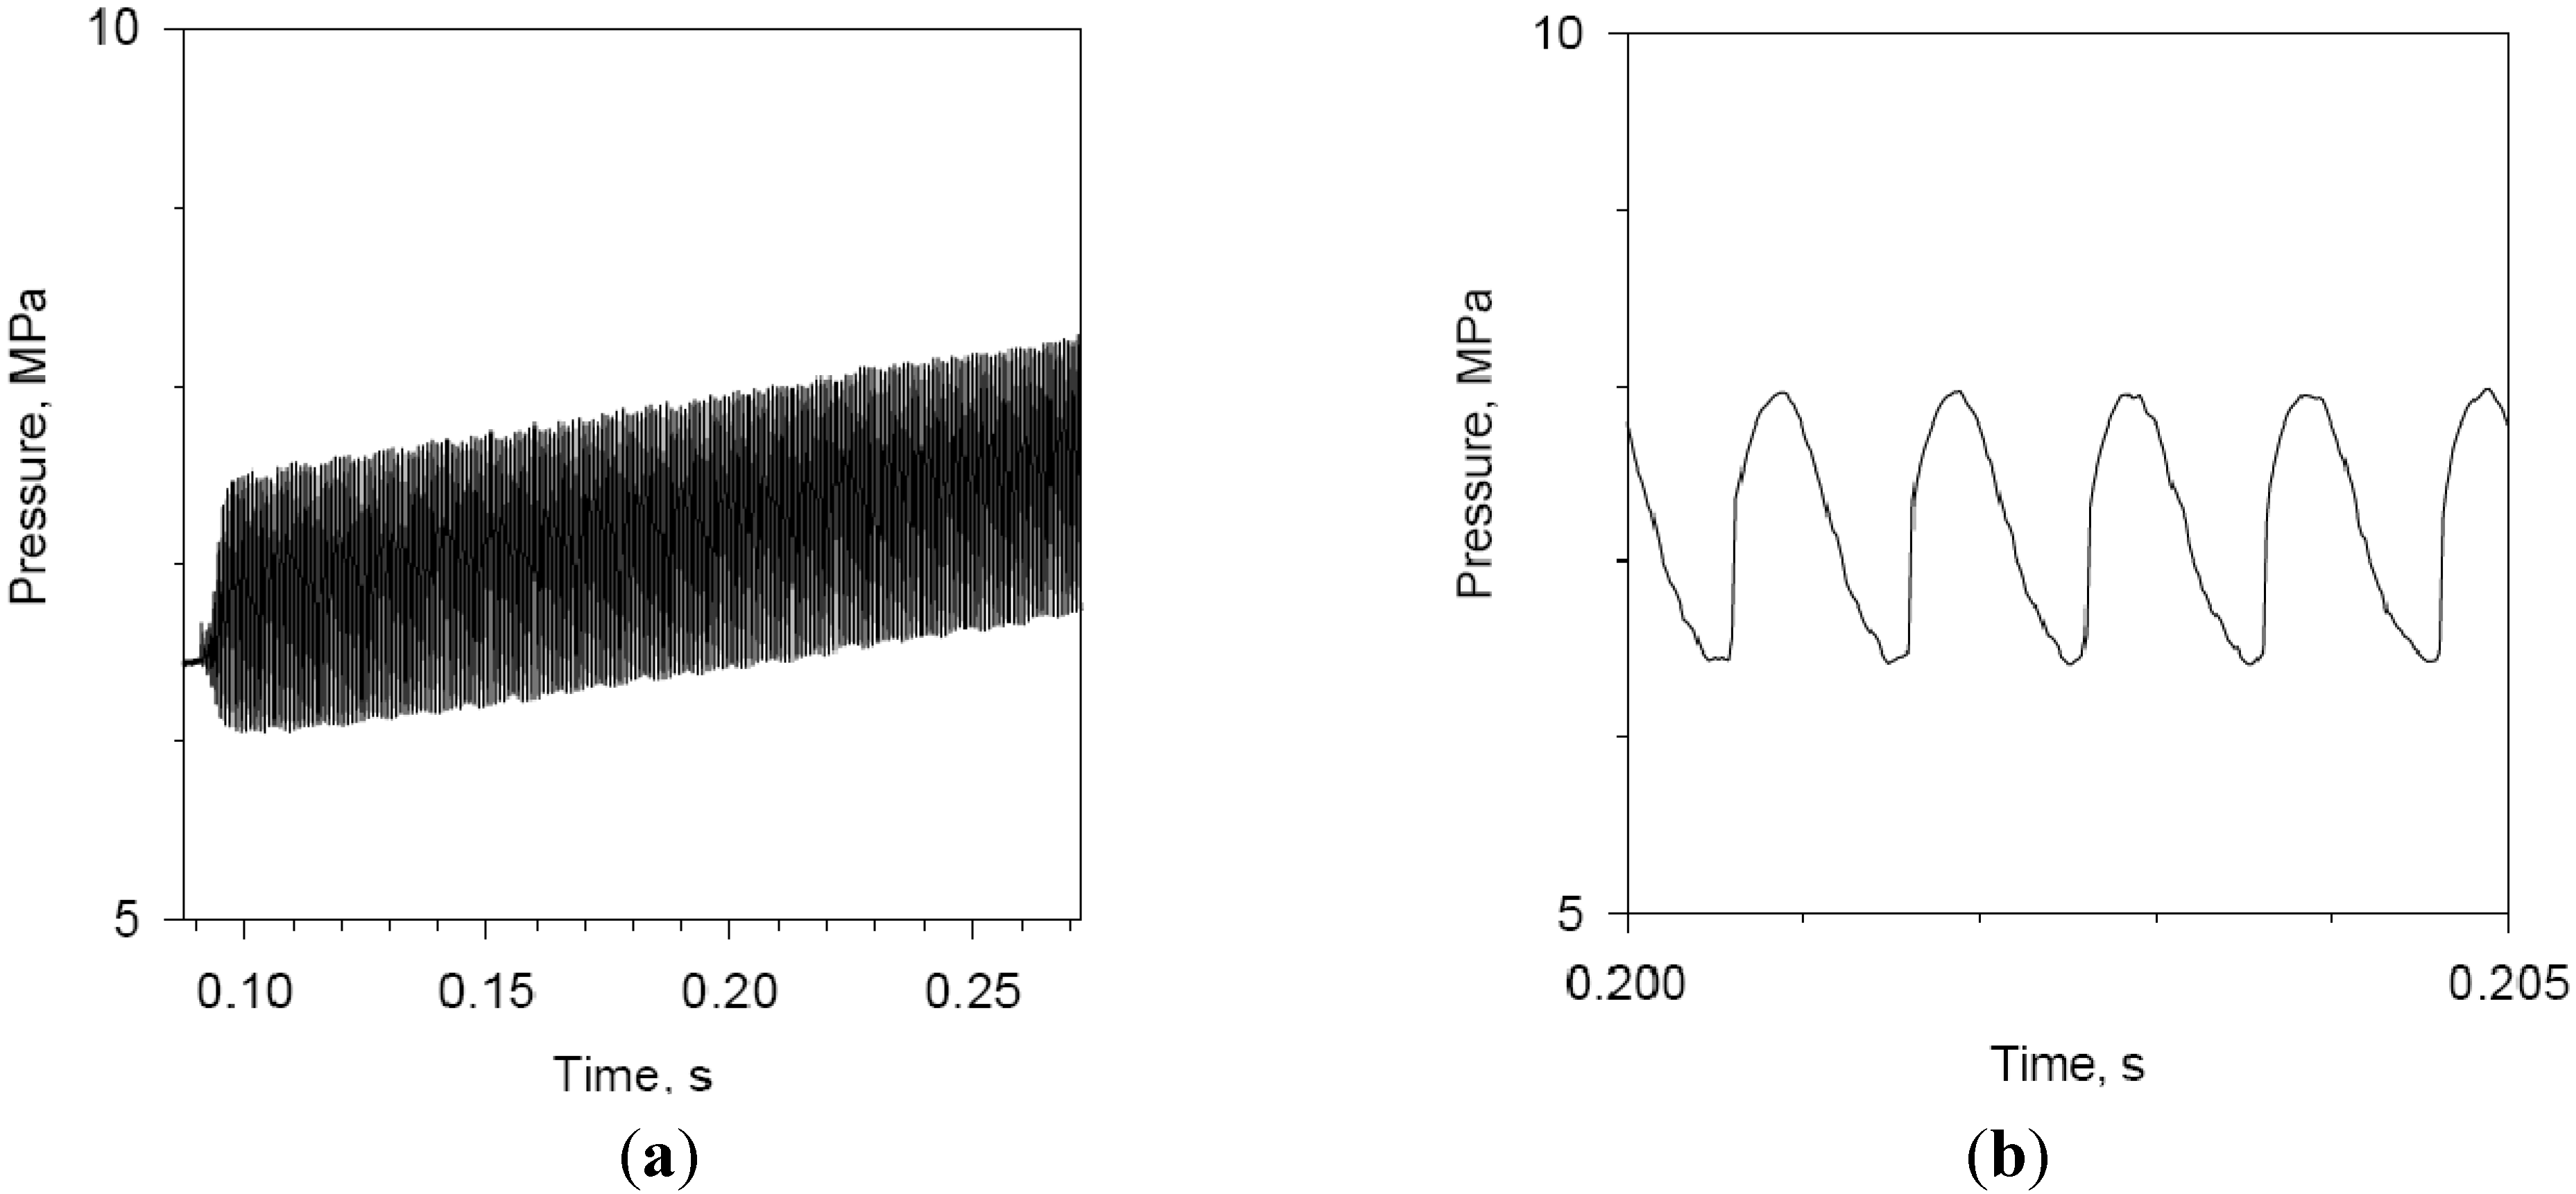
pw, relative to the earlier cases. In addition, because erosive burning becomes more pronounced at lower base burning rates, it is likely also contributing to this increase in wave strength and in turn the dc shift, noting that there will be a substantial induced flow behind the traveling axial pressure wave’s compression front. With respect to erosive burning, the propellant surface roughness is set at 400 :m for this case, a relatively high value that will certainly encourage a higher erosive burning component [
7]. By comparison, looking at the above case but with a lower propellant surface roughness of 100 :m, one can observe in
Figure 8a lower limit pressure wave magnitude (1.5 MPa), and significantly diminished dc shift. However, unlike the case of
Figure 5, the pressure wave does retain a shock front (albeit a relatively weak one), as may be seen in
Figure 8(b).
Figure 7.
(a) Predicted head-end pressure-time profile, reference motor (C = 4.0 × 10⁻⁴ m/s·kPan; ΔHs = 150,000 J/kg; Δpd = 2 atm; ε = 400 μm), acceleration nullified; (b) Predicted pressure wave profile.
Figure 7.
(a) Predicted head-end pressure-time profile, reference motor (C = 4.0 × 10⁻⁴ m/s·kPan; ΔHs = 150,000 J/kg; Δpd = 2 atm; ε = 400 μm), acceleration nullified; (b) Predicted pressure wave profile.
Figure 8.
(a) Predicted head-end pressure-time profile, reference motor (C = 4.0 × 10⁻⁴ m/s·kPan; ΔHs = 150,000 J/kg; Δpd = 2 atm; ε = 100 μm), acceleration nullified; (b) Predicted pressure wave profile.
Figure 8.
(a) Predicted head-end pressure-time profile, reference motor (C = 4.0 × 10⁻⁴ m/s·kPan; ΔHs = 150,000 J/kg; Δpd = 2 atm; ε = 100 μm), acceleration nullified; (b) Predicted pressure wave profile.
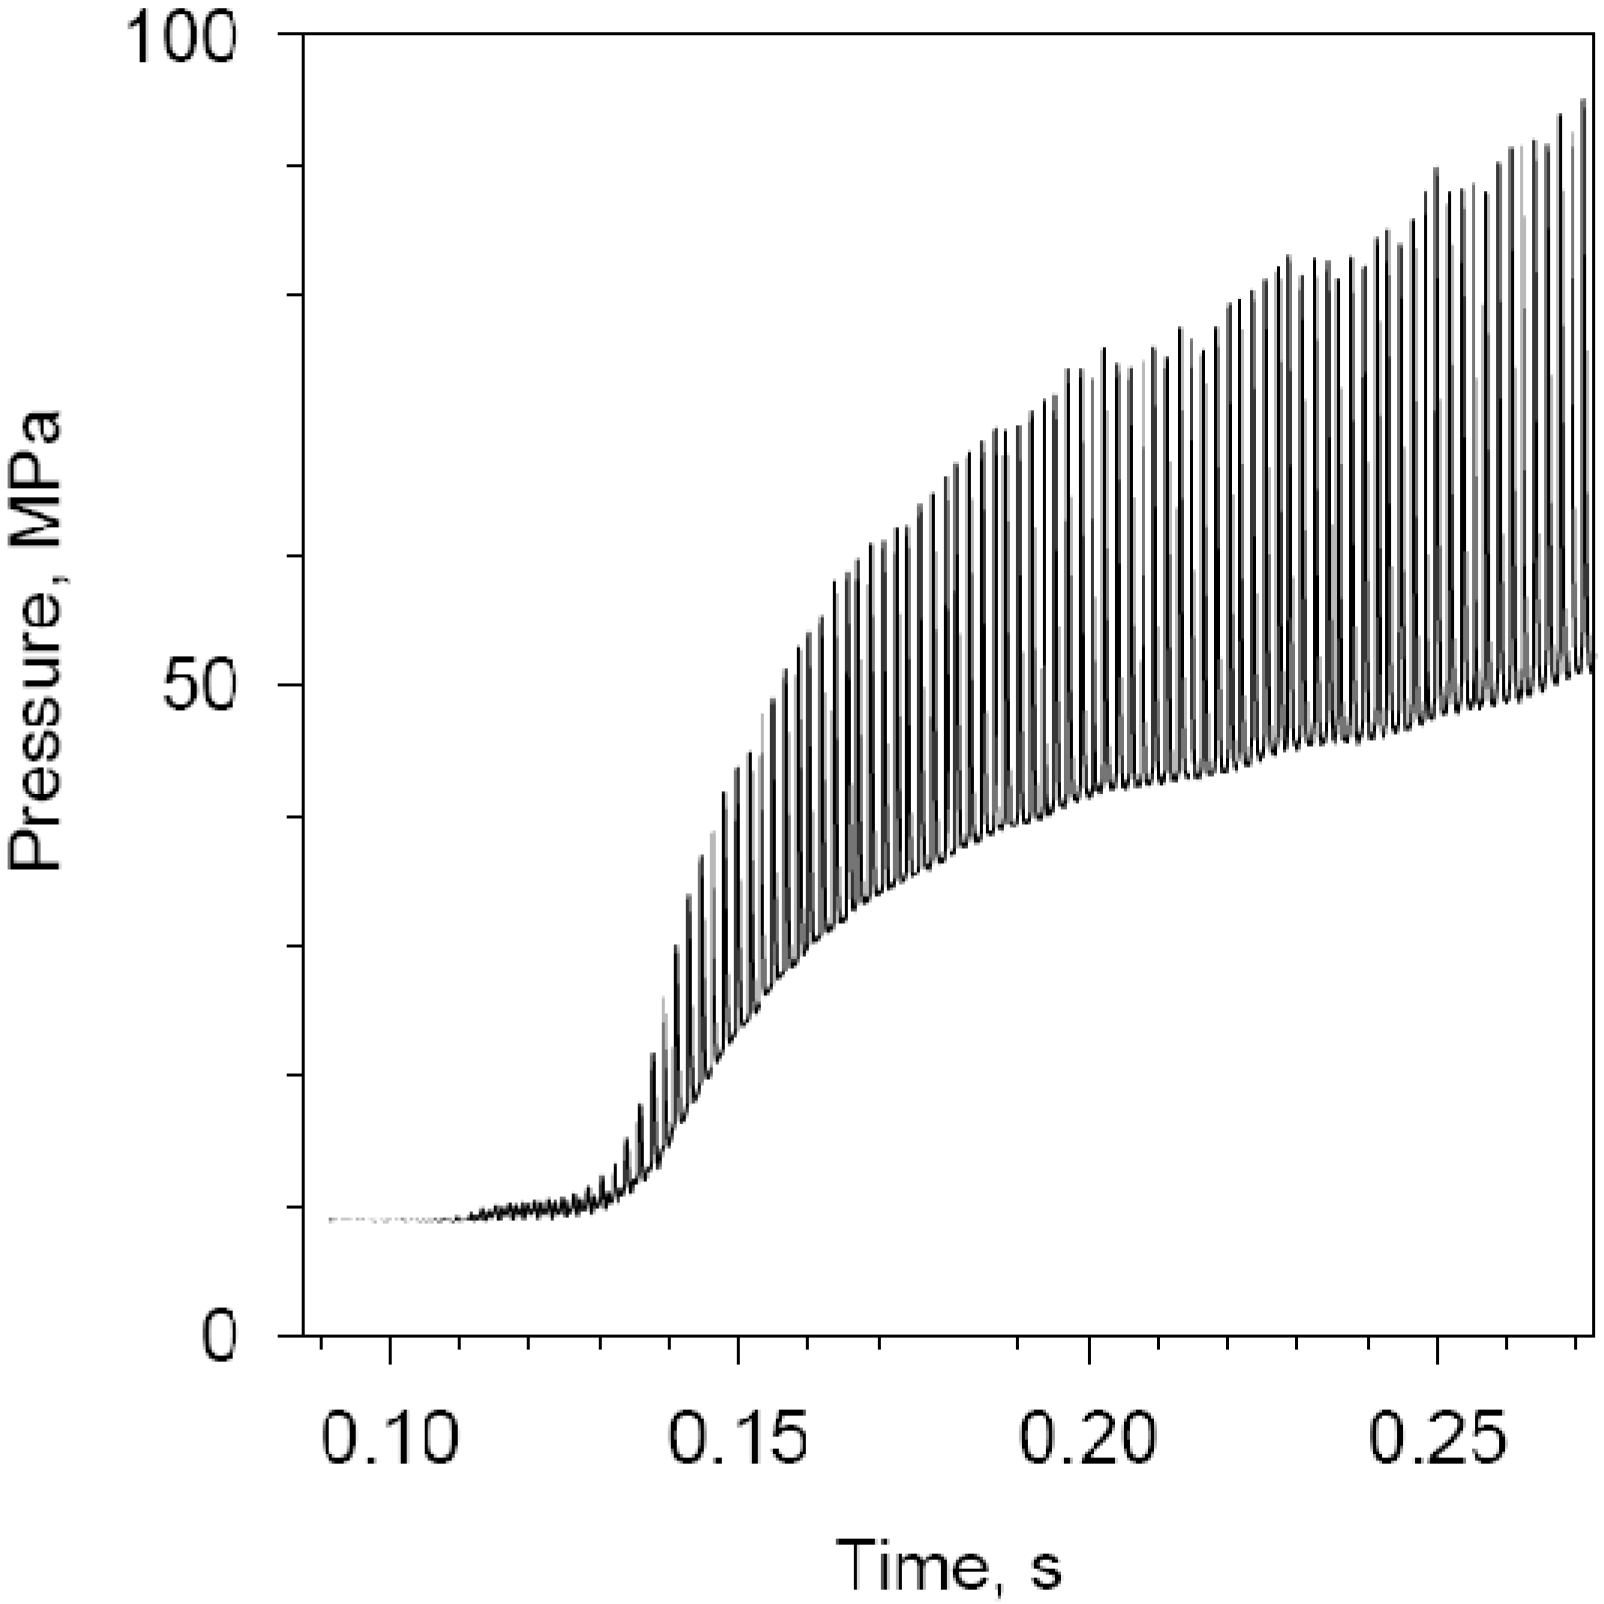
At this juncture, returning to the reference propellant surface roughness setting, one can now look at the effects of scaling the motor up in size, beginning with doubling the length of the reference motor’s propellant grain. In order to retain the same reference base chamber pressure of about 9 MPa, one can lower the de St. Robert coefficient C down to 0.02 cm/s·(kPa)
n. The resulting mean pressure dependent burning rate of about 0.5 cm/s is relatively low as a result, bringing the motor well into the domain of high combustion instability (c.i.) sensitivity, even with acceleration effects nullified. In order to reduce the resulting c.i. response somewhat as shown by
Figure 9, the setting for the net surface heat of reaction Δ
Hs has been lowered to 30,000 J/kg (from 150,000). The resonant transient combustion response frequency of 500 Hz corresponds closely to the acoustic 1L frequency for the 1-m long motor (peak response
of 7.675), to further exacerbate the result (high, and growing, limit shock-fronted pressure wave magnitude, and high corresponding dc shift). Like the result of
Figure 7, the limit pressure wave magnitude grows with time, as the port diameter increases. One factor likely contributing to this trend is the increasing port-to-throat area ratio producing a stronger reflected shock wave, even though the erosive burning component induced by the gas velocity behind the 1L shock wave front may be less with the higher port diameter. In other cases, one might in fact observe the reverse trend, due (at least in part) to the dominant effect of the lowered erosive burning with the increasing port diameter.
Figure 9.
Predicted head-end pressure-time profile, reference motor length doubled ( = 1.036 m, dp,i = 3.6 cm, dt = 1.6 cm, C = 2.0 × 10⁻⁴ m/s·kPan; ΔHs = 30,000 J/kg; Δpd = 2 atm; ε = 400 μm), acceleration nullified.
Figure 9.
Predicted head-end pressure-time profile, reference motor length doubled ( = 1.036 m, dp,i = 3.6 cm, dt = 1.6 cm, C = 2.0 × 10⁻⁴ m/s·kPan; ΔHs = 30,000 J/kg; Δpd = 2 atm; ε = 400 μm), acceleration nullified.
The result of further doubling the length of the above motor, to approximately 2 m, but also increasing the starting port diameter and nozzle throat diameter to retain the same approximate base chamber pressure of 9 MPa, may be seen in
Figure 10. The limit 1L pressure wave magnitude and dc shift are approximately one-quarter that seen earlier in the simulated firing for the smaller motor of
Figure 9, with the quasi-equilibrium limit wave magnitude not growing nearly as much with time as seen in
Figure 9. Given that the acoustic
f1L for the present motor is now approximately 250 Hz (as compared to resonant combustion
fr being 500 Hz, at a base burning rate of approximately 0.5 cm/s, as before), one thus sees the effect of a reduced combustion response
of 4.47 at 250 Hz. A further increase in motor size, as illustrated in
Figure 11, shows a further reduction in the magnitude of the c.i. symptoms. The limit 1L pressure wave magnitude and corresponding dc shift are now about half the previous motor’s, given the reduced combustion response
of 2.77 at 125 Hz. While not shown, it can be noted that the breadth of the 1L wave (from shock front down the expansion tail to a return to the base pressure level, relative to the full cycle period) is thinner here (about one-third of the cycle period), as compared to earlier cases like
Figure 7(b), where the breadth is on the order of half the cycle period.
Figure 10.
Predicted head-end pressure-time profile, reference motor length and initial port diameter increased ( = 2.072 m, dp,i = 14.4 cm, dt = 3.9 cm, C = 2.0 × 10⁻⁴ m/s·kPan; ΔHs = 30,000 J/kg; Δpd = 2 atm; ε = 400 μm), acceleration nullified.
Figure 10.
Predicted head-end pressure-time profile, reference motor length and initial port diameter increased ( = 2.072 m, dp,i = 14.4 cm, dt = 3.9 cm, C = 2.0 × 10⁻⁴ m/s·kPan; ΔHs = 30,000 J/kg; Δpd = 2 atm; ε = 400 μm), acceleration nullified.
Figure 11.
Predicted head-end pressure-time profile, reference motor length and initial port diameter increased ( = 4.144 m, dp,i = 28.8 cm, dt = 7.5 cm, C = 2.0 × 10⁻⁴ m/s·kPan; ΔHs = 30,000 J/kg; Δpd = 2 atm; ε = 400 μm), acceleration nullified.
Figure 11.
Predicted head-end pressure-time profile, reference motor length and initial port diameter increased ( = 4.144 m, dp,i = 28.8 cm, dt = 7.5 cm, C = 2.0 × 10⁻⁴ m/s·kPan; ΔHs = 30,000 J/kg; Δpd = 2 atm; ε = 400 μm), acceleration nullified.
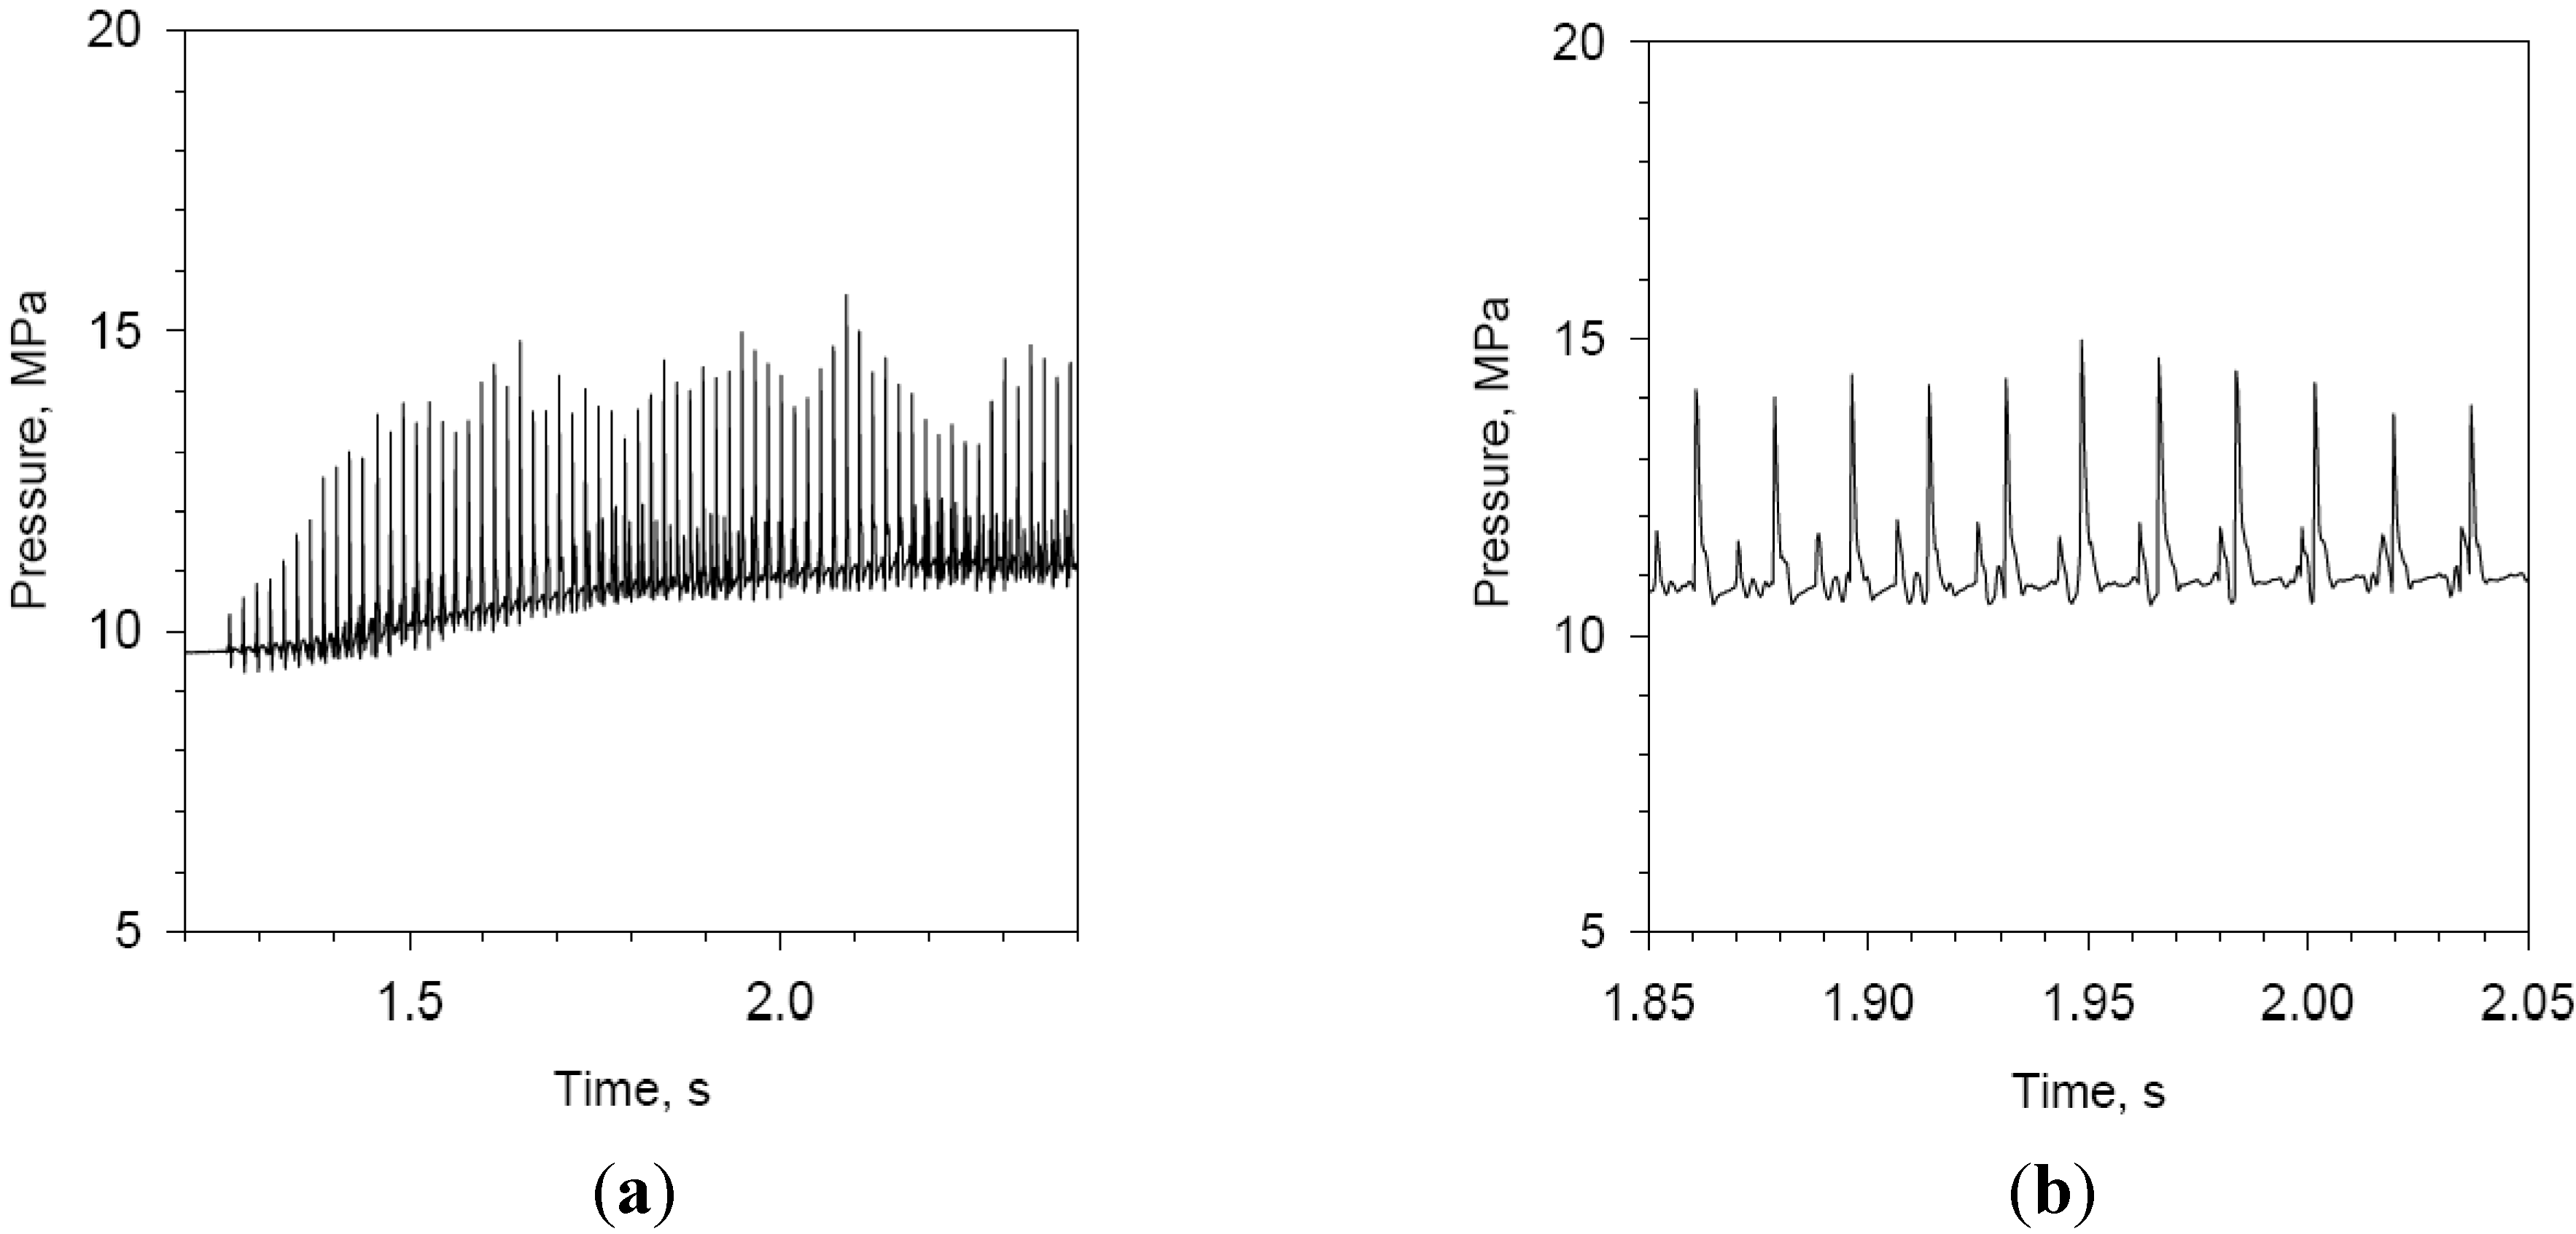
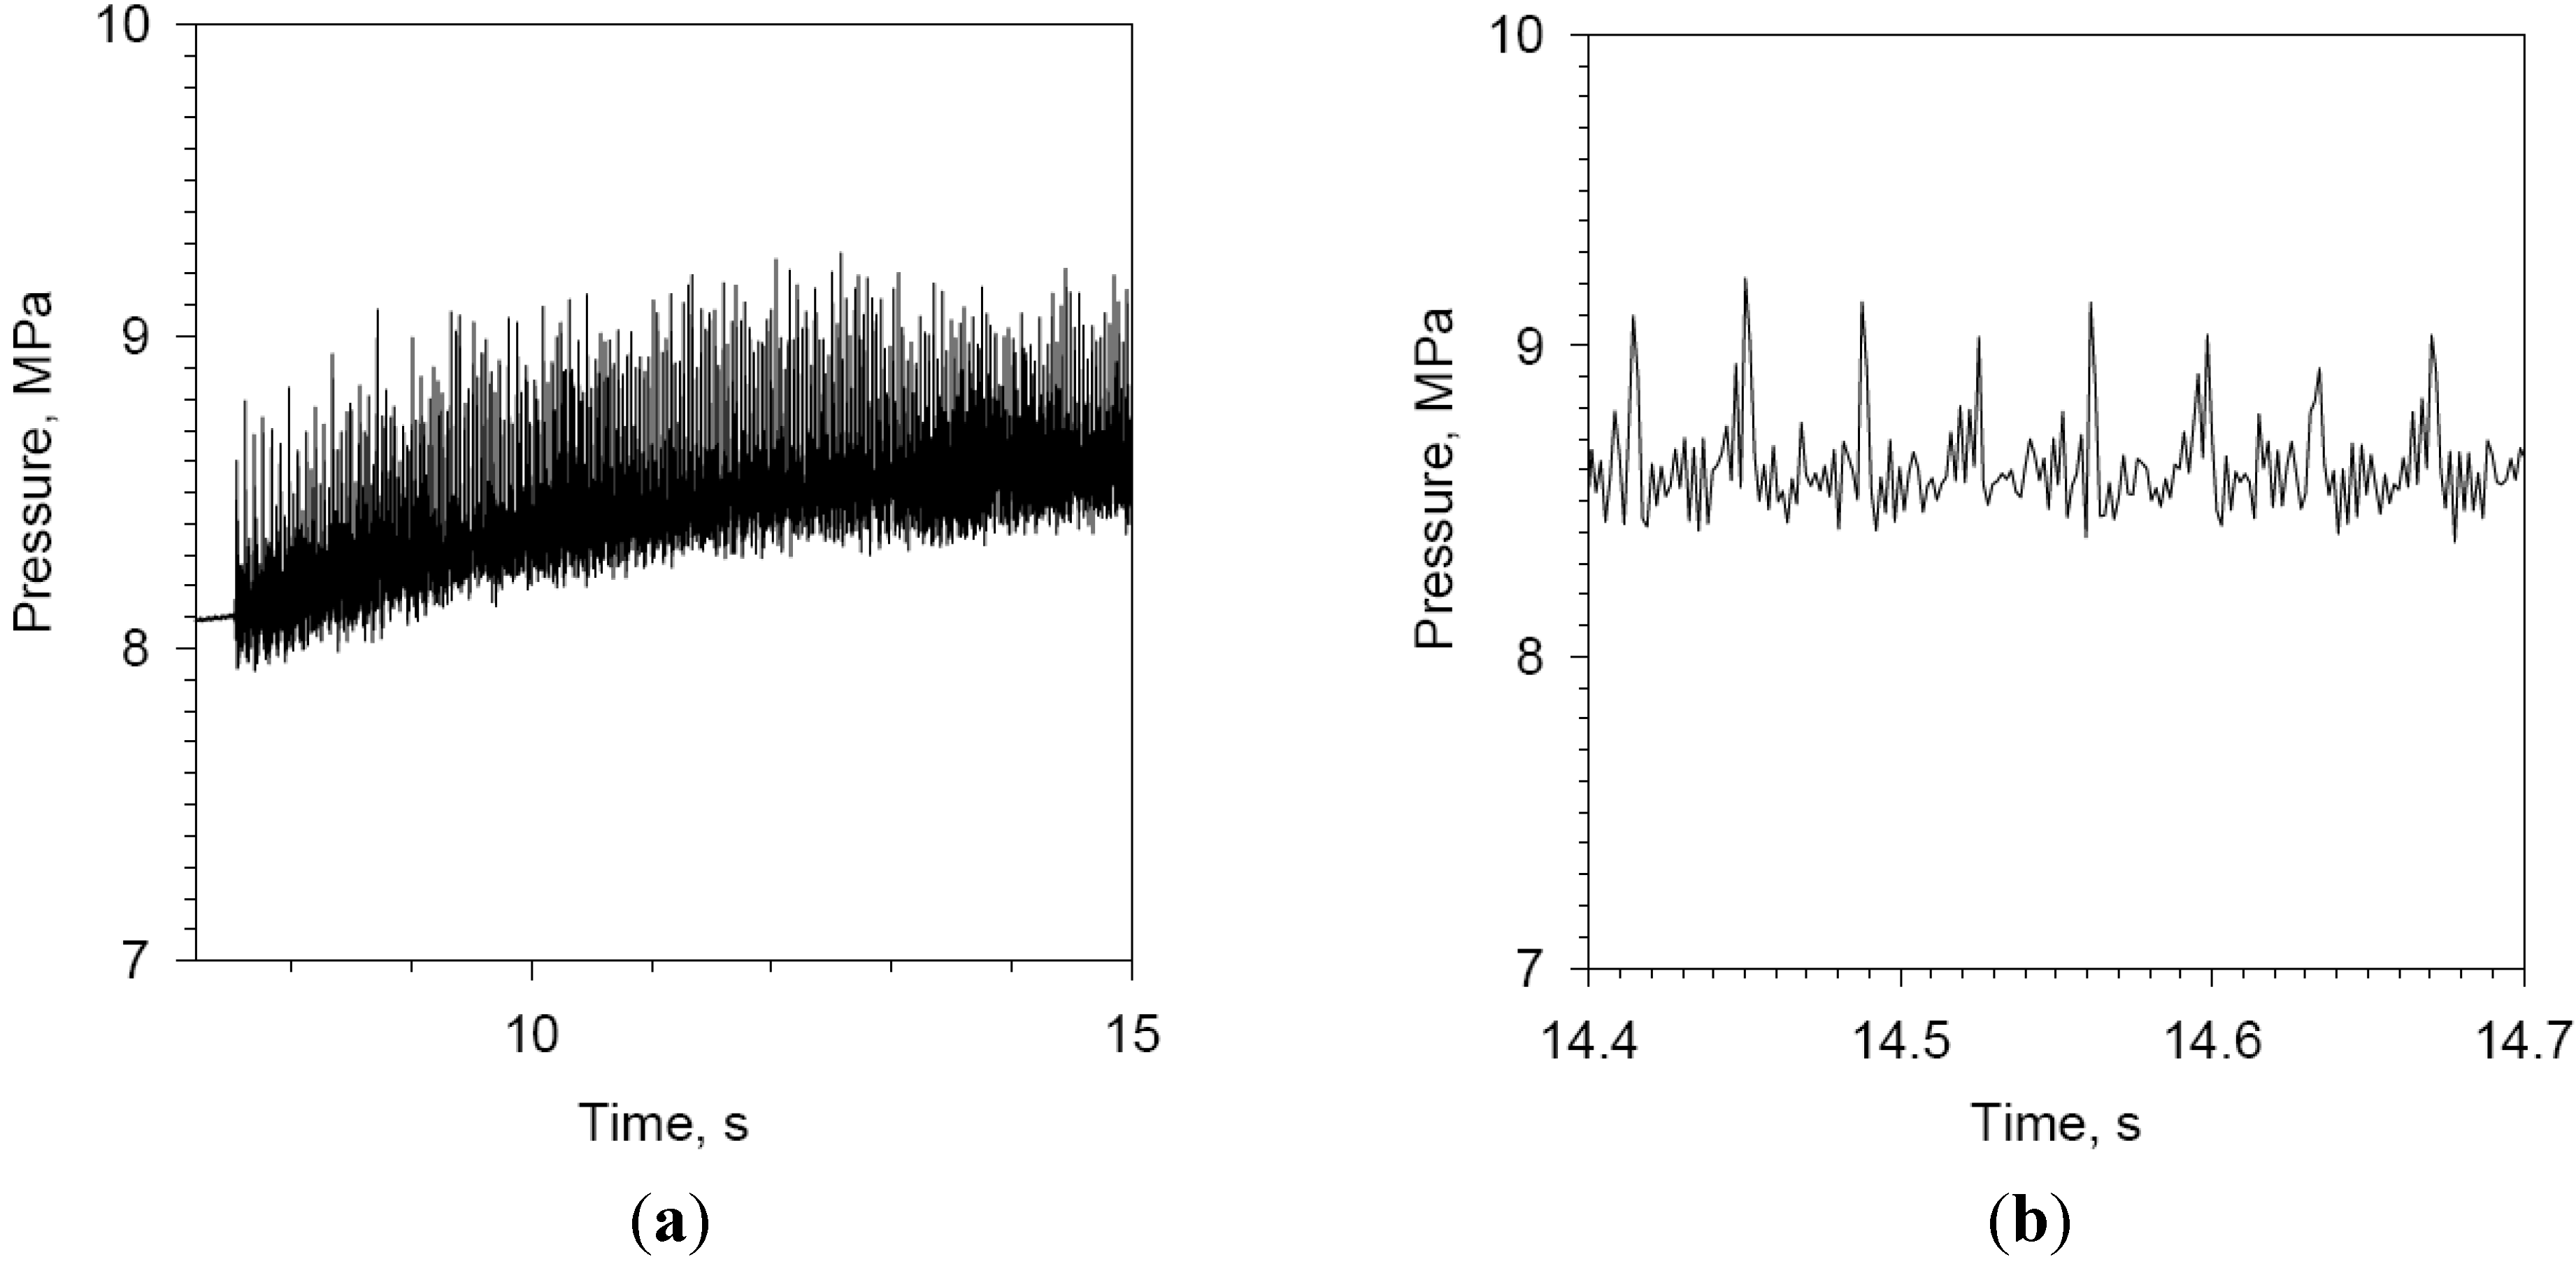
A further increase in motor size, to a propellant grain length of 10 m and a starting port diameter of 70 cm, produces the interesting pressure-time profile as presented in
Figure 12. The dc shift is substantially lower, about one-third that of the previous motor of
Figure 11. The limit 1L pressure wave magnitude is about one-half that of
Figure 11, but as revealed by
Figure 12(b), the dominant 1L wave front is accompanied by a transitioning set of one, and for periods of time, two accompanying superimposed secondary waves that appear to be moving through the system at a different speed than the 1L wave front. The appearance of a multiple wave system has been observed in the past in experimental test firings [
2]. While in some cases a 2L wave system can be attributed to the fact that resonant combustion
fr is close to
f2L [
5], in this case it is more likely that the wave system is trying to find more energy at the higher harmonic frequencies where
values are higher. The breadth of the dominant 1L pressure wave is quite thin, about one-fifth of the cycle period. The reduced combustion response, at the chamber fundamental axial acoustic frequency of 52 Hz, is 1.81. Moving to a larger motor having a propellant grain length of 20 m and a starting port diameter of 1.4 m, the dc shift appears to be almost absent in
Figure 13. At the fundamental axial frequency of 26 Hz for the chamber, the 1L pressure wave magnitude is also substantially smaller than the previous case, for a combustion response of 1.41 at that frequency. As revealed by
Figure 13(b), there is still some evidence of secondary waves transitioning through the system, although these waves are not nearly as significant relative to the 1L wave front, compared to the previous case of
Figure 12(b). The breadth of the dominant 1L wave is on the order of one-eighth of a cycle period.
Figure 12.
(a) Predicted head-end pressure-time profile, reference motor length and initial port diameter increased ( = 10 m, dp,i = 70 cm, dt = 17 cm, C = 2.0 × 10⁻⁴ m/s·kPan; ΔHs = 30,000 J/kg; Δpd = 2 atm; ε = 400 μm), acceleration nullified; (b) Predicted transitioning multiple pressure wave profile.
Figure 13.
(a) Predicted head-end pressure-time profile, reference motor length and initial port diameter increased ( = 20 m, dp,i = 1.4 m, dt = 35 cm, C = 2.0 × 10⁻⁴ m/s·kPan; ΔHs = 30,000 J/kg; Δpd = 2 atm; ε = 400 μm), acceleration nullified; (b) Predicted pressure wave profile.
Figure 13.
(a) Predicted head-end pressure-time profile, reference motor length and initial port diameter increased ( = 20 m, dp,i = 1.4 m, dt = 35 cm, C = 2.0 × 10⁻⁴ m/s·kPan; ΔHs = 30,000 J/kg; Δpd = 2 atm; ε = 400 μm), acceleration nullified; (b) Predicted pressure wave profile.
Finally, at a grain length of 40 m and a starting cylindrical port diameter of 2.8 m, the motor appears to be inherently stable with respect to nonlinear axial instability symptom development. The result for
Figure 14, with acceleration effects on combustion nullified, shows the case of a stronger initiating pressure disturbance of 24 atm (
vs. 2 atm), with the motor still demonstrating its resistance to c.i. symptom development. The combustion response at an axial 1L acoustic chamber frequency of 13 Hz is 1.17. With acceleration effects included, with a proportionally sized motor casing wall (without a static test steel sleeve) surrounding the propellant grain, the result is similar. This is not surprising, given radial acceleration levels are quite low with such a large motor structure. In order to demonstrate the appearance of some c.i. symptom behavior at the present motor size, the net surface heat of reaction of the propellant was increased to 100,000 J/kg (from 30,000), with the result presented in
Figure 15. One observes the presence of a dc shift that is a significant fraction of the limit pressure wave magnitude. As revealed by
Figure 15(b), a two-wave (2L) system (with secondary superimposed wave activity) is present (which would explain the relatively larger dc shift, with the enhanced induced gas velocities of two dominant waves, plus additional secondary waves, producing a higher erosive burning component,
vs. one dominant wave). The combustion response
is 1.43 for this propellant, at 26 Hz, which for a 2L wave system is sufficient for sustained existence, while at 13 Hz, there would have been insufficient energy (
< 1.2) for a 1L system. The breadth of each dominant 2L wave is on the order of less than one-tenth of a 1L cycle period.
Figure 14.
Predicted head-end pressure-time profile, reference motor length and initial port diameter increased ( = 40 m, dp,i = 2.8 m, dt = 70 cm, C = 2.0 × 10⁻⁴ m/s·kPan; ΔHs = 30,000 J/kg; Δpd = 24 atm; ε = 400 μm), acceleration nullified.
Figure 14.
Predicted head-end pressure-time profile, reference motor length and initial port diameter increased ( = 40 m, dp,i = 2.8 m, dt = 70 cm, C = 2.0 × 10⁻⁴ m/s·kPan; ΔHs = 30,000 J/kg; Δpd = 24 atm; ε = 400 μm), acceleration nullified.
Figure 15.
(
a) Predicted head-end pressure-time profile, motor of
Figure 14, Δ
Hs increased (
= 40 m,
dp,i = 2.8 m,
dt = 70 cm, C = 2.0 × 10
−4 m/s·kPa
n; Δ
Hs = 100,000 J/kg; Δ
pd = 2 atm;
ε = 400 μm), acceleration nullified; (
b) Predicted pressure wave profile.
Figure 15.
(
a) Predicted head-end pressure-time profile, motor of
Figure 14, Δ
Hs increased (
= 40 m,
dp,i = 2.8 m,
dt = 70 cm, C = 2.0 × 10
−4 m/s·kPa
n; Δ
Hs = 100,000 J/kg; Δ
pd = 2 atm;
ε = 400 μm), acceleration nullified; (
b) Predicted pressure wave profile.


