1. Introduction
The fuse has been around in one form or other since the earliest days of electric telegraphs and then later in different forms for the protection of power distribution and other circuits. Like many other devices the fuse has undergone considerable evolution since those early days [
1]. The modern High Breaking Capacity (h.b.c) fuse provides economical and reliable protection against over current faults in modern electrical systems. Short circuit are usually due to a catastrophic electrical failure, the resulting root mean square value (r.m.s) of the prospective short circuit current is high, typically more than 10 times the normal full load current of the system. In this case the protective device must limit the energy associated with the fault, which depends upon the value of
i2t, where
i is an instantaneous current.
Due to the economical cost and high speed of operation of the current-limiting fuse, special current-limiting fuses have been developed to protect semiconductor devices [
2]. For the protection of semiconductors with fuses a number of parameters of the devices and fuse need to be considered. Among the parameters there are a number of influencing factors associated with each one. However, current-limiting fuses are widely used to protect the thyristors in DC drive systems. In the event of a commutation failure when regenerating (inverting), the fuses need to interrupt in loop supplied by the AC and DC voltages acting in series, which is the most difficult case for protection by fuse [
3]. The commutation fault is shown in
Figure 1. This type of fault will occur if a thyristor that has been conducting fails to turn off. Alternatively, this fault might occur if any thyristor fails to turn on at a specified point which the thyristor assumed to conduct. Special attention must be paid to the current transfer between commutating phases because it may not be successfully completed if it is not started early enough.
Figure 1.
Internal commutation fault regenerative circuit.
Figure 1.
Internal commutation fault regenerative circuit.
In this paper, a detailed study of the complete interruption process has been investigated by modeling of arcing process of the fuse. The effect varying the motor time constant, supply impedance, number of fuses used to clear the fault and DC machine rating to the total response for fuses protecting against the regenerative circuit internal commutation fault has been studied. The results obtained were compared with results in references [
4,
5], which proved the accuracy of the obtained results. For the validation of the model the results evaluated with reference [
6].
2. The Main Model Used in the Study
The basic function of the phase-controlled converter is to convert an alternating input voltage to controllable direct output voltage. Considering the 2-qudrant converter shown in
Figure 1 consists basically of a conventional rectifier circuit arrangement in all positions of the circuit. Due to the unidirectional current carrying property of the thyristors, the current at DC terminal can flow only in one direction. However, it is possible by suitable control of the phase position of the firing pulses applied to the thyristors with respect to AC input voltage, for the mean voltage at DC terminals to be continuously controlled from maximum positive to maximum negative [
7,
8,
9,
10,
11]. Thus power can flow either from AC to DC side of the converter, and
vice versa, and the converter is capable of workng as an inverter or rectifier.
The average output voltage is given by
Vd = 1.35
ELLcos
α (where α is the firing angle in degree). When 0 < α < 90,
Vd positive (rectifier mode), while when 90 < α < 180,
Vd negative (inverter mode). If the 2-quadrant converter is connected to the armature of a DC machine, the polarity of the induced emf of the machine reverses whenever regenerative breaking is required. For example, when the load is being raised, the converter supplies power to machine and the induced emf is positive. On the other hand, when the load lowered, the direction of rotation and induced emf are reversed. Therefore, the polarity of the machine emf is now negative. Consequently, it is in the correct direction for the converter to operate in its inverter region, thus returning regenerative power from machine to AC system [
8]. Internal commutation faults will occur if a thyristor that has been conducting fails to turn off. Alternatively, this fault might occur if any thyristor fails to turn at specified point when the thyristor assumed to conduct.
Figure 2.
Simplified circuit of
Figure 1 if TH1 and TH2 are conducting assuming no overlapping.
Figure 2.
Simplified circuit of
Figure 1 if TH1 and TH2 are conducting assuming no overlapping.
If two thyristors conduct simultaneously, then the line voltage will be applied to the load. If TH1 and TH2 conduct simultaneously, the circuit at this condition will be as in
Figure 2. Then the line voltage e
ac of
Figure 1 is applied across the load, assuming there is no overlapping and also assuming that the thyristors are ideal in that they are dissipationless and have zero voltage drops. Also assuming in the first instance that the commutation fault is due to loss of trigger pulses to all thyristors:
The processes which govern the value of fuse voltage during the arcing period are many and complex, and several simplifying assumption are required in the development of a dynamic fuse model [
9]. The fuse is usually several parallel elements and several series notches per element and can be modeled as a cylindrical plasma. The fuse arc voltage during arcing in this study was represented by the following simplified 5
th order dynamic model, according to [
9]. When the fuse arc voltage is considered during the arcing period:
The arc voltage is given by:
Where:
αo = 0.0655, αm = 0.63, τ = 0.01 s
Np = Number of parallel elements = 2
ie = i / Np = Current per element
A = Effective cross-sectional area of lumen (arc channel cross section)
x = Total length of all arcs in series
Hf = Fusion enthalpy of sand ≈ 3.614
γ = Filler flow multiplying factor ≈ 0.7
Cb = Kramer constant
As initial values for solving the differential equations, assuming the notch zones will produce a jump in resistance from zero to
Ro. If the current at the start of arcing is
io, the voltage produced is:
If the initial arcs channel area
A is assumed same as the strip cross section S, then for each sub-element the arc gradient will be:
and the arc length that will satisfy this will be:
![Energies 02 00411 i010]()
The transition from pre-arcing to arcing state occurs when the
itt integral reaches the melting value. However in practice, the pre-arcing
itt increases according to:
![Energies 02 00411 i011]()
For the DC side of the converter, the volt-ampere is: Sdc = VdIdc
For the AC side, the volt-amperes and line current are:
When
Idc is calculated the minimum permissible fuse rating (MPFR) is evaluated. There are always two fuses in series, either in series with the semiconductor devices or in the AC line. The paper will investigate both locations. The fuse sizes should be at least 125% of the rms load current. Therefore, the minimum permissible fuse ratings (MPFR) for both locations are:
Then the fuse ampere rating (FAR) and the melting
itt suitable for the application are found. The model of a 200A fuse will be employed in this study.
ELL = 460 V, frequency = 60 Hz,
Rdc = 0.05 p.u,
Edc = 500 V. Fuses in series with the semiconductor devices (F1) and fuses in AC line (F2) will be considered. If fuse is used in location F1, that gives certain DC loading condition
![Energies 02 00411 i014]()
. If fuse is located at F2, this will give a different DC loading condition,
![Energies 02 00411 i015]()
. The loading conditions for both systems are summarized in
Table 1.
Table 1.
Summary of the loading conditions.
Table 1.
Summary of the loading conditions.
| Location | DC machine (HP) | DC full Load current (A) | Converter rating (kW) | Fuse ampere rating (A) |
|---|
| F1 | 170 | 127 | 270 | 200 |
| F2 | 120 | 90 | 190 | 200 |
4. The Effect of the Motor Time Constant
The total response to an internal commutation fault depends critically upon the DC load characteristics. The effect of varying the DC machine time constant has been investigated within the range of 1–100 ms.
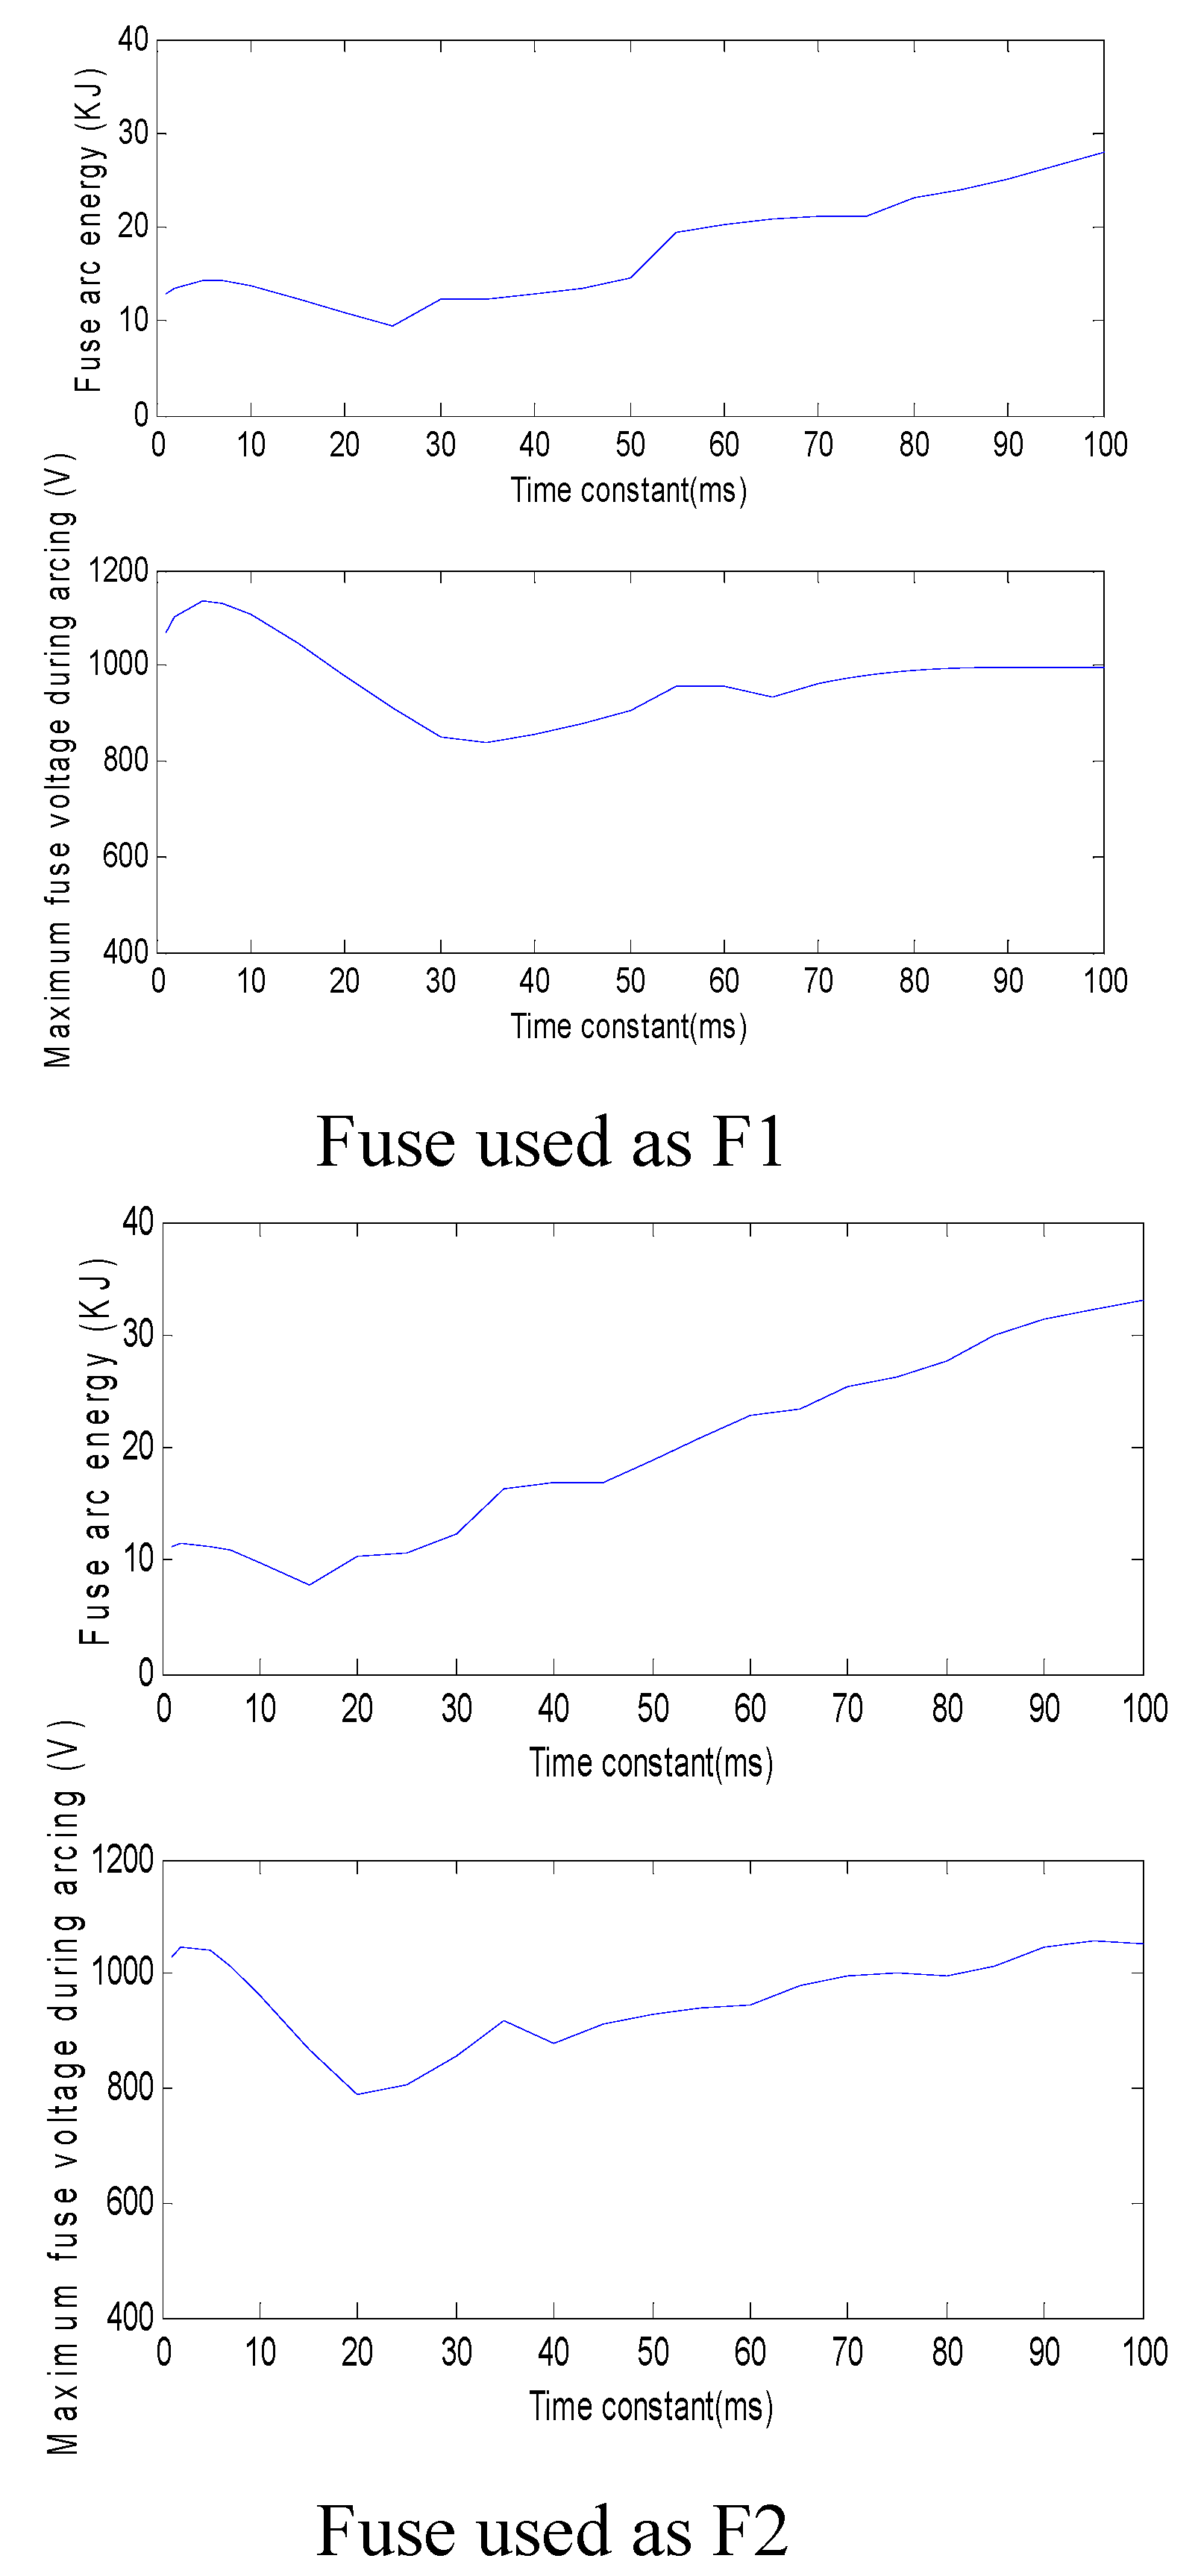
Figure 5 shows the variation of the arc energy (kJ) and fuse voltage versus the DC machine time constant when the 200 A fuse used as F1 and F2.
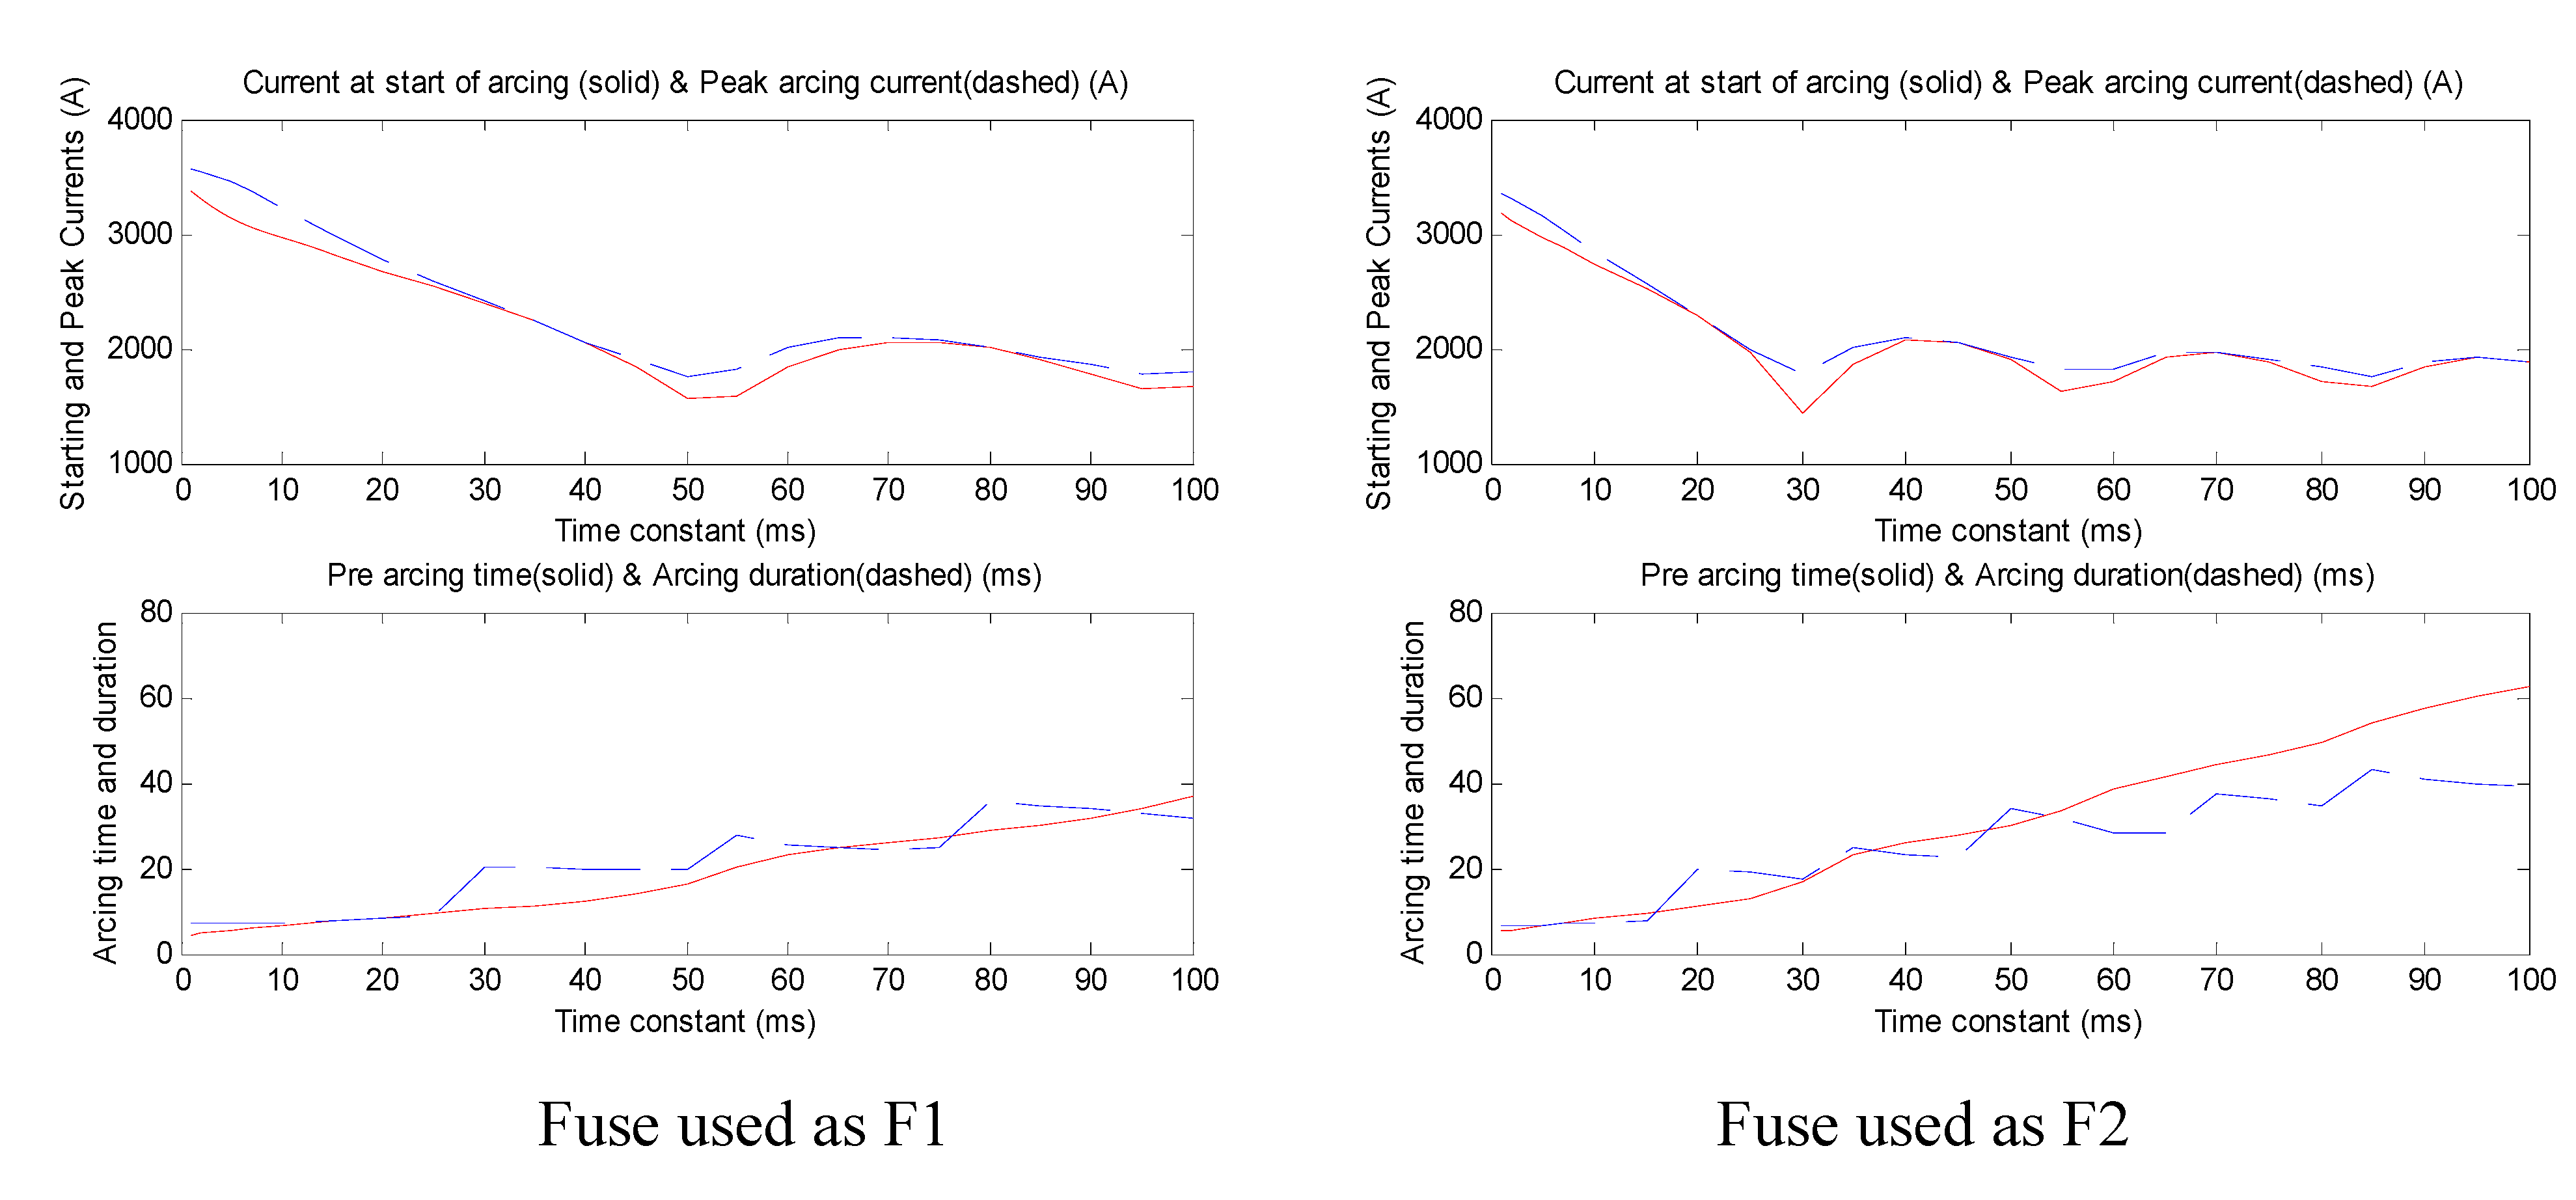
Figure 6 shows the variation of the current at start of arcing (A), peak arcing current (A), pre-arcing time (ms) and arcing duration (ms) versus the DC machine time constant used when the 200 A fuse was used in both locations.
Figure 7 shows the variation of the arc energy versus arc-angle and arc-angle versus the DC machine time constant when the 200 A fuse used as F1 and F2. It is clear that increasing the time constant will increase the arc-angle, pre-arcing time and arcing duration. The minimum range for peak fuse voltage, arc energy, starting and peak prospective currents will occur at the mid range of motor time constant starting from 20 ms to 50 ms.
Table 2 summarizing the minimum and maximum of the fuse simulation results.
Figure 5.
Variation of the arc energy (kJ) and peak fuse voltage (V) versus the DC machine time constant (ms) when the 200 A fuse used as F1 and F2.
Figure 5.
Variation of the arc energy (kJ) and peak fuse voltage (V) versus the DC machine time constant (ms) when the 200 A fuse used as F1 and F2.
Figure 6.
Variation of the current at start of arcing (A), peak arcing current (A), pre-arcing time (ms) and arcing duration (ms) versus the DC machine time constant (ms) when the 200 A fuse used as F1 and F2.
Figure 6.
Variation of the current at start of arcing (A), peak arcing current (A), pre-arcing time (ms) and arcing duration (ms) versus the DC machine time constant (ms) when the 200 A fuse used as F1 and F2.
Table 2.
Lists of the minimum and maximum values for arc energy, peak fuse voltage, the current at start of arcing, peak prospective current, pre-arcing time, arcing duration, arc-angle and the time constant at which the minimum and maximum occurred.
Table 2.
Lists of the minimum and maximum values for arc energy, peak fuse voltage, the current at start of arcing, peak prospective current, pre-arcing time, arcing duration, arc-angle and the time constant at which the minimum and maximum occurred.
| Minimum when fuse used as F1 | Minimum when fuse used as F2 | Maximum when fuse used as F1 | Maximum when fuse used as F2 |
|---|
| Arc energy (kJ) | 9.483
tc = 25
arc-angle = 143.7 | 7.8012
tc = 15
arc-angle = 146.0 | 27.857
tc = 100
arc-angle = 739.92 | 32.99
tc = 100
arc-angle = 1292.57 |
| Peak fuse voltage during arcing (V) | 839.066
tc = 35 | 786.11
tc = 20 | 1135.19
tc = 5 | 1058.67 tc = 95 |
| Current at start of arcing (A) | 1564.93
tc = 50 | 1431.82
tc = 30 | 3362.02
tc = 1 | 3188.17 tc = 1 |
| Peak current (A) | 1763.0584
tc = 50 | 1761.5082
tc = 85 | 3572.9581
tc = 1 | 3359.3621 tc = 1 |
| Pre-arcing time (ms) | 4.39
tc = 1 | 5.19
tc = 1 | 37.03
tc = 100 | 62.6193 tc = 100 |
| Duration of arcing (ms) | 7.0474
tc = 5 | 6.7122
tc = 2 | 35.5435
tc = 80 | 43.220 tc = 85 |
| Arcing angle | 35.0123
tc = 1 | 52.2041
tc = 1 | 739.9
tc = 100 | 1292.5779
tc = 100 |
When the fuse in AC line (F2) it will reach higher level of arc-angle compared when the fuse with semiconductor devices. Generally, the most desirable range of arcing angle for fuse to produce melting is between 90–270, or 450–630 (i.e. falling part of AC voltage). If the arc-angle ψ falls within the range 0 to 90 degrees, the fuse will melt on the rising part of voltage waveform. If fuse melts within 60 and 90, arcing will occur during a period of time when AC supply voltage near the peak value. This range of ψ will be called critical melting zone. There is another critical melting zone between 420 and 450. Melting mostly will occur in the first critical zone when motor time constant less than 10 ms, and to obtain melting in the second critical zone the time constant shall be increased beyond 50 ms, especially from 52–58 ms. This is found for both fuse location.
Figure 7.
Variation of the arc energy (kJ) versus arc-angle (degree) and arc-angle (degree) versus the DC machine time constant (ms) when the 200 (A) fuse used as F1 and F2.
Figure 7.
Variation of the arc energy (kJ) versus arc-angle (degree) and arc-angle (degree) versus the DC machine time constant (ms) when the 200 (A) fuse used as F1 and F2.
5. The Effect of Number of Fuses
It is recommended that two fuses in series clear the fault. Treatment of two fuses in series sharing the breaking duty in a ratio of f = (1-f), where f = 0.5 and f = 0.6 was carried out in this study, where f is the fraction of the total energy or voltage taken by one of the two fuses. The governing equation in this case:
Voltage across fuse 1 = Vf and across the fuse2 = [(1-f)/f] Vf
The share of total calculated energy equals f for fuse 1 and (1-f) for fuse 2. The comparison here was made for a motor with time constant 40 ms and supply impedance 0.05 p.u when having
One 200 A fuse located at F1 (f = 1)
One 200 A fuse located at F2 (f = 1)
Two 200 A fuses located at F1 and sharing the breaking duty equally (f = 0.5)
Two 200 A fuses located at F1 sharing the breaking duty in a ratio 0.6:0.4 (f = 0.6)
Table 3 lists the arc energy, peak fuse voltage, current at start of arcing , peak arcing current, pre-arcing time, arcing duration, arc-angle and total arc energy for each case when the motor with time constant = 40 ms and supply impedance = 0.05.
Table 3.
Lists the arc energy, peak fuse voltage, current at start of arcing , peak arcing current, pre-arcing time, arcing duration, arc-angle and total arc energy.
Table 3.
Lists the arc energy, peak fuse voltage, current at start of arcing , peak arcing current, pre-arcing time, arcing duration, arc-angle and total arc energy.
| One 200A fuse used as F1, f = 1 | One 200A fuse used as F2, f = 1 | Two 200A fuses used as F1, f = 0.5 | Two 200A fuses used as F1, f = 0.6 |
|---|
| Arc energy (kJ) | 12.8722 | 16.7950 | 2.0609 | 3.3757 |
| Peak fuse voltage during arcing (V) | 857.6595 | 876.6067 | 629.3049 | 654.6958 |
| Current at start of arcing (A) | 2060.5463 | 2065.6563 | 2060.5463 | 2060.5463 |
| Peak current (A) | 2062.2832 | 2100.6173 | 2062.2832 | 2062.2832 |
| Pre-arcing time (ms) | 12.5337 | 25.8190 | 12.5337 | 12.5337 |
| Duration of arcing (ms) | 19.7847 | 23.1904 | 15.9757 | 16.8648 |
| Arcing angle | 210.7284 | 497.6897 | 210.7284 | 210.7284 |
| Arc energy (kJ) | 12.8722 | 16.7950 | 4.1219 | 5.6262 |
It can be noted that when one fuse alone clears the circuit, the arc energy and peak fuse voltage during arcing produced for internal commutation fault is high. When there are two fuses either sharing the breaking duty equally (f = 0.5) or the voltage is split in the ratio f = 0.6, the arc energy and peak fuse voltage are reduced significantly. The pre-arcing time, current at start of arcing, peak prospective current and arc angle were not affected by the number of fuses.
6. The Effect of Supply Impedance
The percentage value of supply impedance plays an important role for total response of the commutation fault. Here, the supply impedance was varied from X = 0.01 p.u to X = 0.4 p.u.
Table 4 lists the maximum and minimum values for arc energy, fuse voltage, the current at start of arcing, peak prospective current, pre-arcing time, arcing duration, arc-angle and the system impedance at which the maximum and minimum occurred when 200 A fuse located at F1 and the motor time constant is 40 ms. Their values when the system impedance = 0.05 and 0.15 are listed also.
Figure 8 and
Figure 9 show the variations as the system impedance varied from Z = 0.01 p.u to Z = 0.4 p.u.
Table 4.
Lists the maximum and minimum values for arc energy, fuse voltage, the current at start of arcing, peak prospective current, pre-arcing time, arcing duration, arc-angle and the system impedance.
Table 4.
Lists the maximum and minimum values for arc energy, fuse voltage, the current at start of arcing, peak prospective current, pre-arcing time, arcing duration, arc-angle and the system impedance.
| Z = 0.05 p.u | X = 0.15 p.u | Minimum when fuse used as F1 | Maximum when fuse used as F1 |
|---|
| Arc energy (kJ) | 12.8722 | 12.5666 | 12.5666 Zpu = 0.15 arc-angle = 272 | 15.6684 Zpu = 0.25 arc-angle = 437.47 |
| Peak fuse voltage during arcing (V) | 857.6595 | 857.1913 | 831.6888 Zpu = 0.35 | 900.6567 Zpu = 0.25 |
| Current at start of arcing (A) | 2060.5463 | 1623.6856 | 1425.9338 Zpu = 0.2 | 2180.4415 Zpu = 0.01 |
| Peak current (A) | 2062.2832 | 1805.4284 | 1701.1453 Zpu = 0.2 | 2180.5270 Zpu = 0.01 |
| Pre-arcing time (ms) | 12.5337 | 15.3723 | 11.8 Zpu = 0.01 | 28.1323 Zpu = 0.4 |
| Duration of arcing (ms) | 19.7847 | 18.610 | 18.6103 Zpu = 0.15 | 28.0284 Zpu = 0.2 |
| Arcing angle | 210.7284 | 272.0421 | 195.2552 Zpu = 0.01 | 547.6584 Zpu = 0.4 |
It can be noted that increasing the system impedance will not affect the arc energy or peak fuse voltage during arcing. The arc angle and pre-arcing time increase with the supply impedance in very small range. The current at start of arcing and peak prospective current will be reduced as system impedance increased, but will increase again as Z > 0.2 p.u.
Figure 8.
Variation of the arc energy (kJ) and fuse voltage (V), current at start of arcing (A), peak arcing current (A), pre arcing time (ms) and arcing duration (ms) versus the supply impedance when the 200 A fuse used as F1.
Figure 8.
Variation of the arc energy (kJ) and fuse voltage (V), current at start of arcing (A), peak arcing current (A), pre arcing time (ms) and arcing duration (ms) versus the supply impedance when the 200 A fuse used as F1.
Figure 9.
Variation of the arc energy versus arc-angle and arc-angle versus the supply impedance when the 200 A fuse used as F1.
Figure 9.
Variation of the arc energy versus arc-angle and arc-angle versus the supply impedance when the 200 A fuse used as F1.
Table 5.
Summary of the simulation results.
Table 5.
Summary of the simulation results.
| Motor HP | Con. Rat (kW) | Idc | MPFR IF1 | FAR | Melting i2t | Arc-angle (degree) | Pre-arc time (ms) | Current at start of arcing (A) | Peak current (A) | Peak voltage during arcing (V) | Arc energy (kJ) |
|---|
| 25 | 18.6 | 39 | 28 | 35 | 120 | 342.0 | 18.6 | 249.9 | 402.27 | 633.22 | 6.663 |
| 50 | 37.3 | 79 | 57 | 60 | 360 | 219.2 | 12.92 | 600.1 | 604.394 | 594.54 | 8.157 |
| 100 | 74.6 | 157 | 113 | 125 | 1600 | 244.4 | 14.09 | 1154.2 | 1199.17 | 722.06 | 11.22 |
| 150 | 111. | 235 | 170 | 175 | 3100 | 214.5 | 12.70 | 1790.6 | 1794.95 | 826.52 | 11.81 |
| 170 | 127 | 270 | 194 | 200 | 4000 | 210.7 | 12.53 | 2060.5 | 2062.28 | 857.65 | 12.87 |
| 200 | 149 | 314 | 227 | 250 | 6200 | 236.6 | 13.73 | 2338.0 | 2398.35 | 922 | 14.94 |
| 250 | 186 | 393 | 283 | 300 | 9000 | 221.0709 | 13.01 | 2981.2 | 3001.76 | 944.98 | 16.37 |
| 325 | 242 | 510 | 368 | 400 | 16000 | 231.8 | 13.51 | 3823.6 | 3895.42 | 1041.39 | 19.23 |
| 425 | 317 | 667 | 481 | 500 | 25000 | 214.6 | 12.71 | 5082.0 | 5094.60 | 1261.1 | 21.82 |
| 525 | 391 | 825 | 595 | 600 | 36000 | 205.0 | 12.27 | 6301.4 | 6301.42 | 1453.64 | 22.63 |
| 625 | 466 | 982 | 708 | 800 | 64000 | 250.4 | 14.37 | 7139.1 | 7500.60 | 1503.64 | 28.68 |
| Minimum | | 39 at HP = 25 | 28 at HP = 25 | 35 at HP = 25 | 120 at HP = 25 | 205.0 HP = 525 | 12.27 HP = 525 | 249.9 HP = 25 | 402.27 HP = 25 | 594.5 HP = 50 | 6.66 HP = 25a |
| Maximum | | 982 at HP = 625 | 708 at HP = 625 | 800 HP = 625 | 64000 at HP = 625 | 342.08 HP = 25 | 18.61 HP = 25 | 7139.1 HP = 625 | 7500.60 HP = 625 | 1504 HP = 625 | 28.6 HP = 625b |


 . If fuse is located at F2, this will give a different DC loading condition,
  . The loading conditions for both systems are summarized in Table 1.
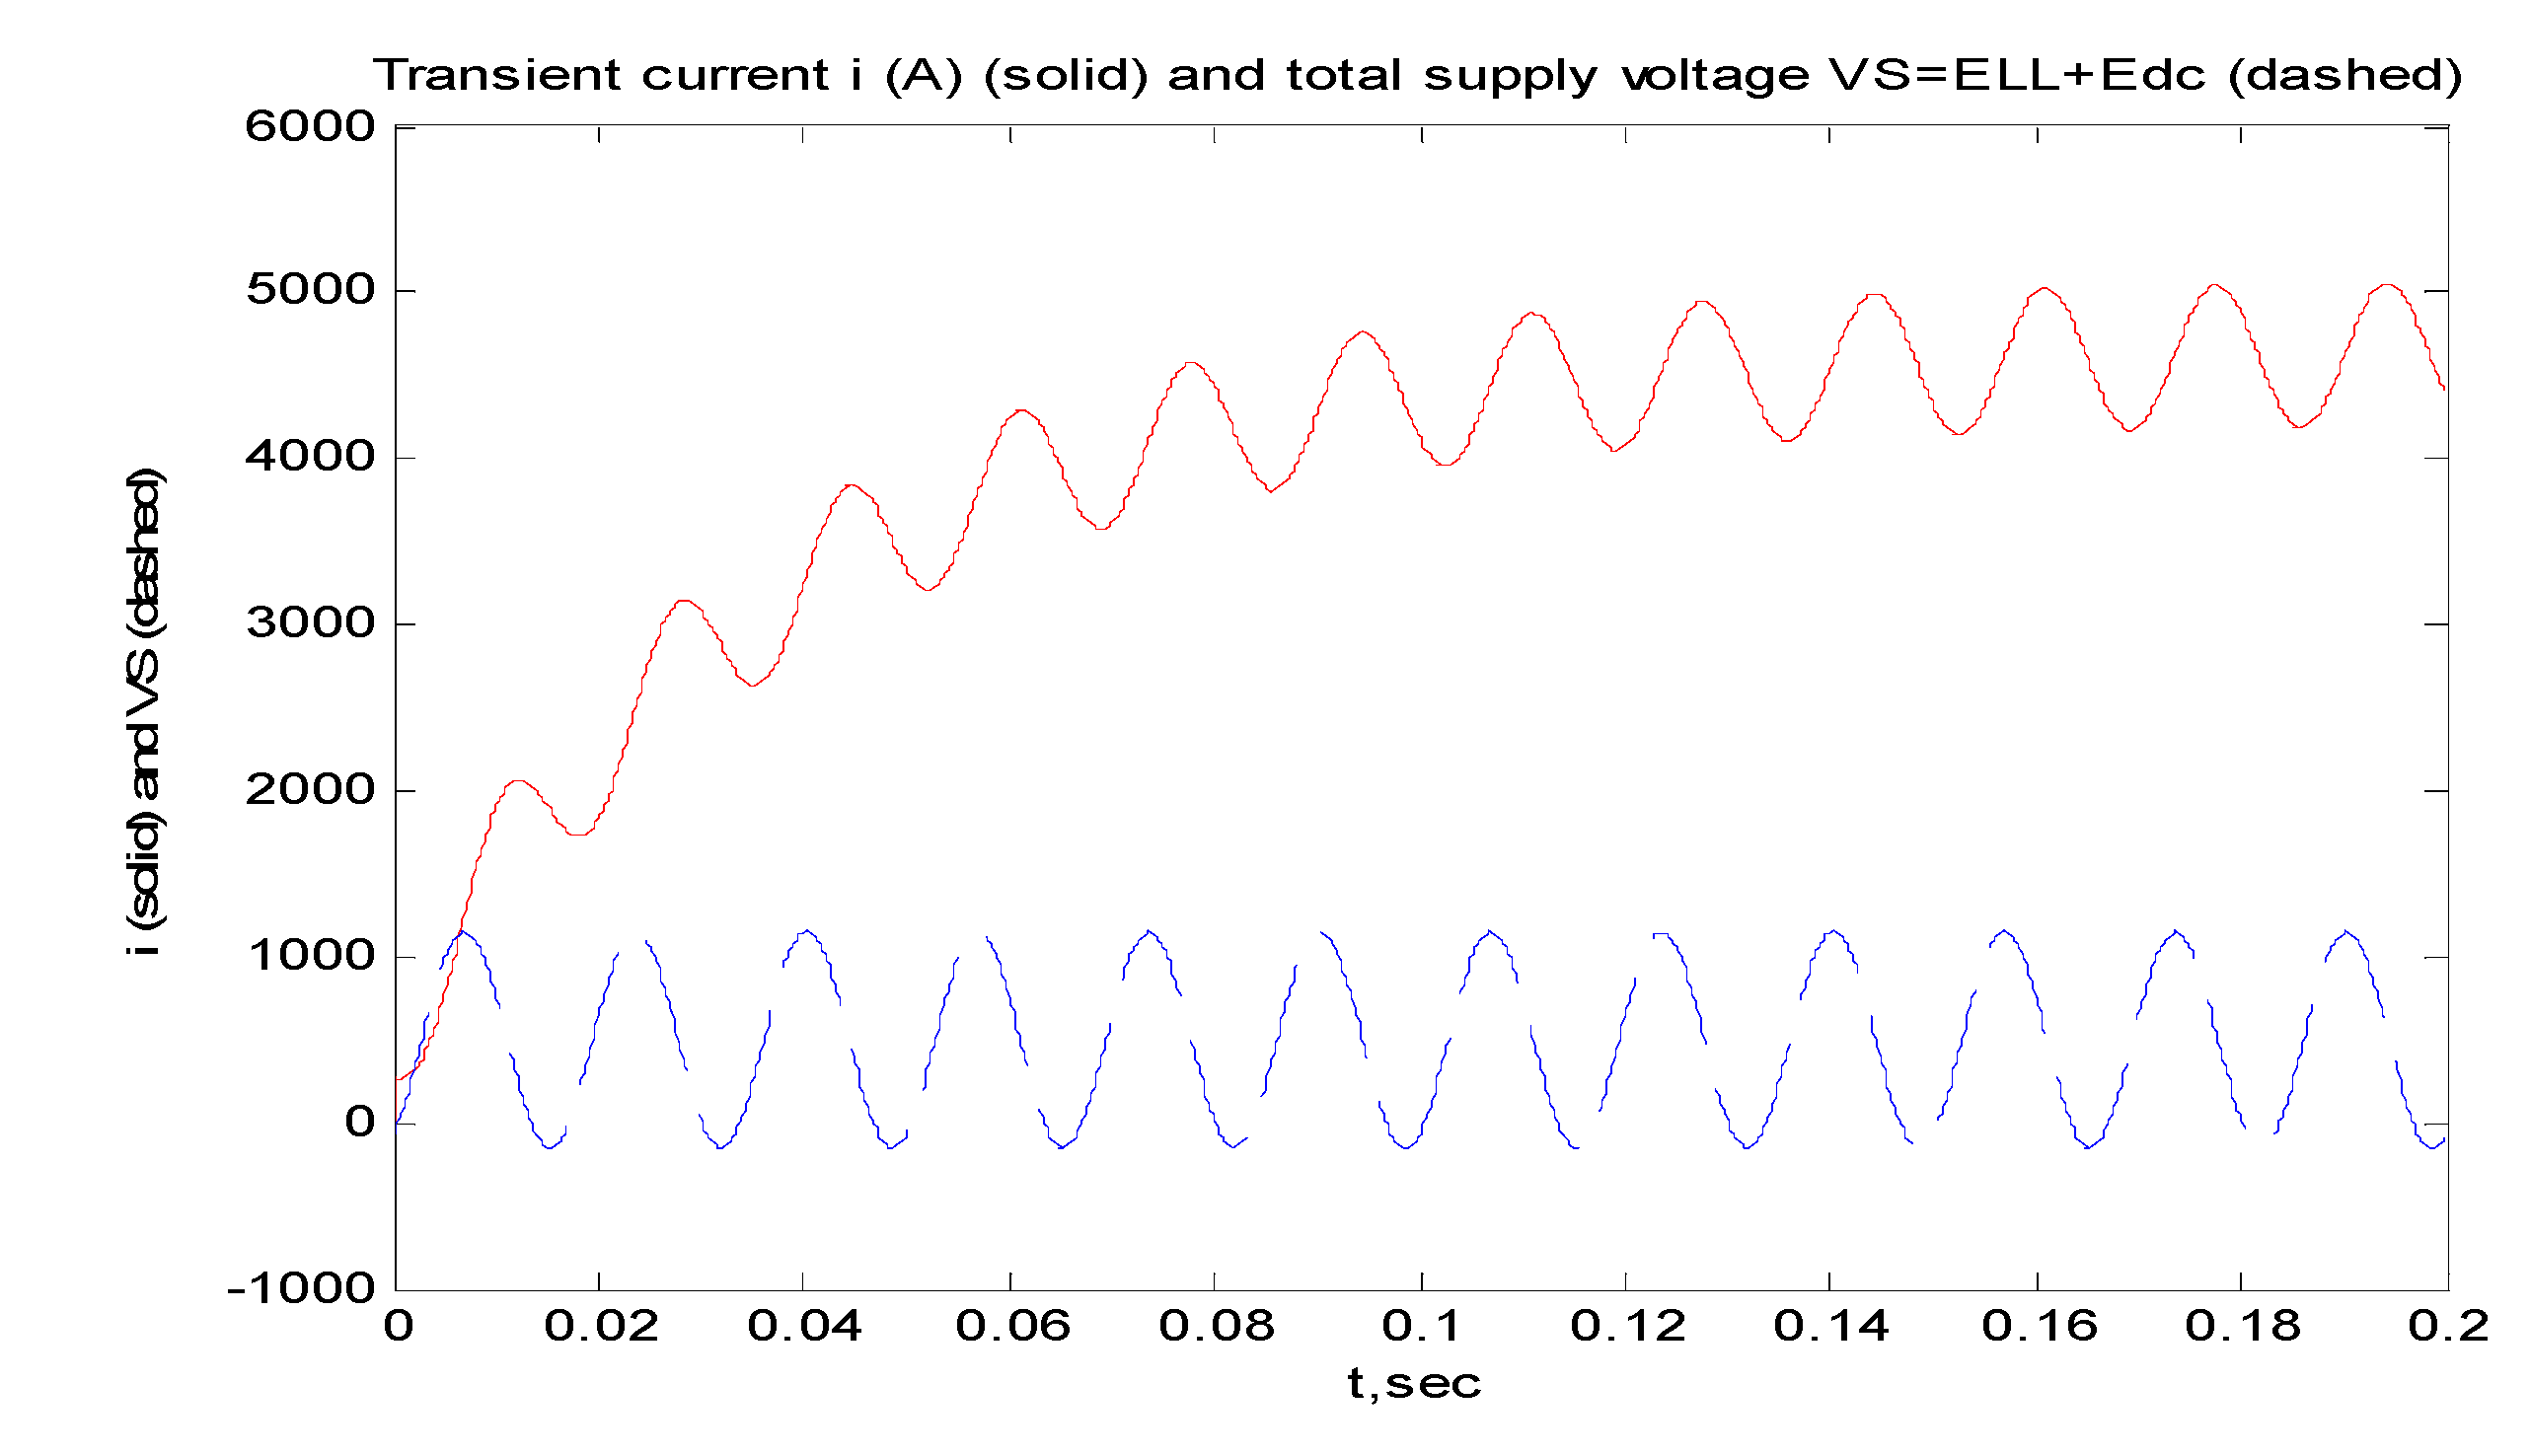
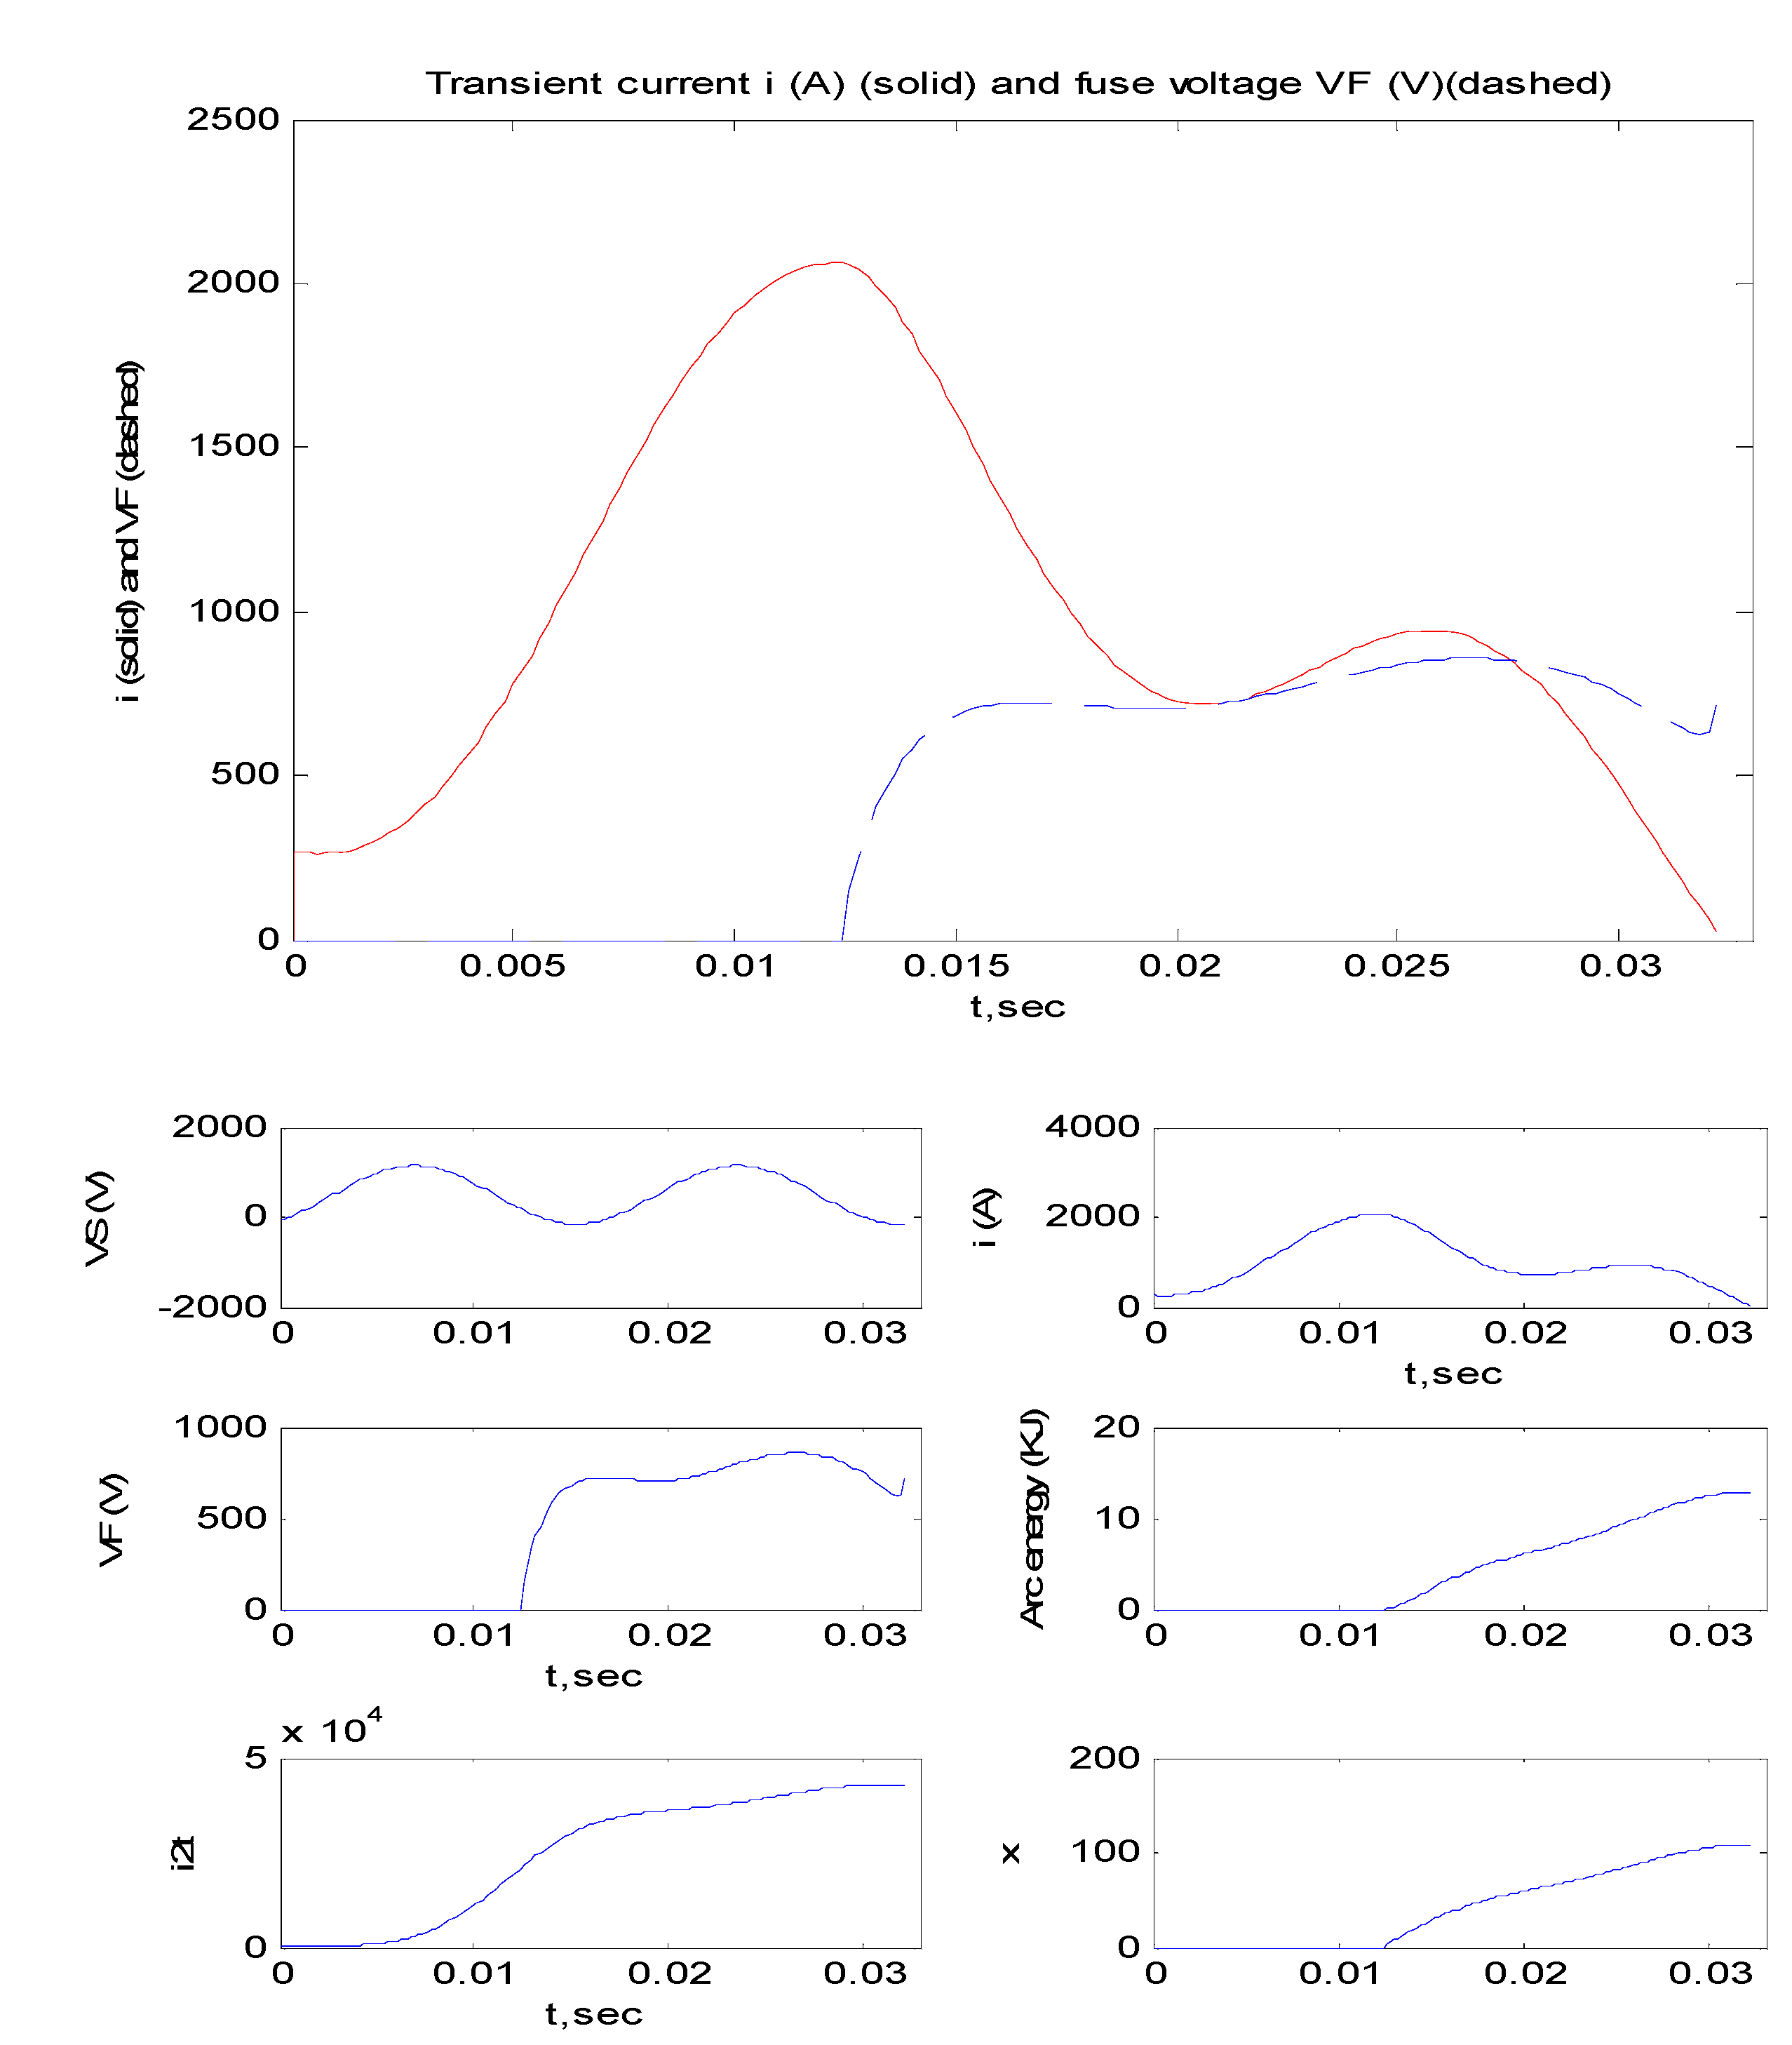
 when no fuse was used to clear the circuit. This is the prospective fault current that the fuses have to interrupt. Figure 4 shows the transient response for total supply voltage, prospective current, fuse voltage, arc energy, i2t and arc length x. The figures are obtained for 0.05 p.u supply impedance and 40 ms DC machine time constant.
 when no fuse was used to clear the circuit.