1. Introduction
Society usually makes its decisions, at least those not predicated by strictly political considerations, based on economic analyses and most explicitly via either economic “markets” or some kind of governmentally-administered cost-benefit analysis. Although such analyses, usually based on prices, price trends or expectations, make considerable sense to many people, or maybe we should say made considerable sense before the financial meltdown of the fall of 2008, in many cases it is not so clear that they are an effective guide for predicting future energy supplies. This is because today’s price signals are unlikely to be especially influenced by future conditions when today’s most abundant fuels are likely to be much less available for either geological (depletion) or political reasons. In addition, current prices of energy in the U.S. are greatly influenced by various subsidies.
There is considerable concern at this writing about whether the “end of cheap oil” might be, or might soon be, upon us. Meanwhile gasoline prices, although high in nominal terms (at least in the summer of 2008), were only at about their earlier peak in 1981 when corrected for inflation, and what we pay for gasoline in a year is a smaller proportion of our income. Given that our society is overwhelmingly dependant upon oil, which supplied about 40 percent of US energy use in 2007, and also natural gas, which supplied another 25 percent or so [
1], there is considerable concern by resource scientists, if not most economists, as to whether market signals or cost benefit analysis based on today’s prices are sufficient to guide our decisions about energy. In addition the extreme volatility of prices during 2008 has provided very poor guidance as to what, indeed, the market signals are, were we to believe in them. Finally there is the whole issue of externalities, which add another dimension of uncertainty to market (and other) analyses. Given that U.S. President-elect Obama has made renewable energy a cornerstone of his new administration it is important that we have good tools to choose from among the many alternatives. In our view market economics by itself is not enough.
What is EROI?
One potentially useful alternative to conventional economic analysis is net energy analysis, which is the examination of how much energy is left over after correcting for how much of that energy (or its equivalent from some other source) is required to generate (extract, grow or whatever) a unit of the energy in question. Net energy analysis is sometimes called the assessment of energy surplus, energy balance, or, as we prefer, energy return on investment (EROI or sometimes EROEI) [
2,
3,
4,
5,
6,
7]. EROI is calculated from the following simple equation, although the devil is in the details [
5,
6,
7]:
Since the numerator and denominator are usually assessed in the same units (an exception we treat later is when quality corrections are made) the ratio so derived is dimensionless, e.g. 30:1 which can be expressed as “30 to one”. This implies that a particular process yields 30 Joules on an investment of 1 Joule (or Kcal per Kcal or barrels per barrel). EROI is usually applied at the mine-mouth, wellhead, farmgate, etc. We call this more explicitly EROImm, and is not to be confused with conversion efficiency, i.e. going from one form of energy to another such as upgrading petroleum in a refinery or converting diesel to electricity. It is only loosely related, at least in the short term, to the concept of energy return on monetary investment.
We authors and advocates believe that net energy analysis offers the possibility of a very useful approach for looking at the advantages and disadvantages of a given fuel and offers the possibility of looking into the future in a way that markets seem unable to do. Its advocates also believe that in time market prices must approximately reflect comprehensive EROIs, at least if appropriate corrections for quality are made and subsidies removed. Nevertheless we hasten to add that we do not believe that EROI by itself is necessarily a sufficient criteria by which judgments may be made, although it is the one we favor the most, especially when it indicates that one fuel has a much higher or lower EROI than others. In addition it is important to consider the present and future potential magnitude of the fuel, and how EROI might change if a fuel is expanded [
6].
Much of the relatively sparse current literature on net energy analysis tends to be about whether a given project is or is not a net surplus, that is whether there is a gain or a loss in energy from e.g. making ethanol from corn (see Farrell
et al. 2006 as well as the many responses in the June 23, 2006 issue of Science Magazine for a fairly thorough discussion of this issue) [
8]. The general criteria used in much of the current debate is focused on the “energy break even” issue, that is whether the energy returned as fuel is greater than the energy invested in growing or otherwise obtaining it, i.e. if the EROI is greater than 1.0:1.0. If the energy returned is greater than the energy invested, then the general argument seems to be that the fuel or project “should be done”, and if not then it should not.
This general issue is clearest in many investigator’s minds when one might be discussing whether the potential fuel requires more energy for its production than is delivered in the product, a claim held by several of the participants (most notably [
9]) in the current debate about corn-derived ethanol. Others (summarized in [
8]) argue that ethanol from corn is a clear energy surplus, with from 1.2 to 1.6 units of energy delivered for each unit invested. Further aspects of this argument center around the boundaries of the numerator: i.e. whether one should include some energy credit for non-fuel co-products (such as residual animal feed—i.e. soybean husks or dry distiller’s grains), the quality of the fuels used and produced (liquid – presumably more valuable -- vs. solid and gaseous, for example) and the boundaries of the denominator (i.e. whether or not to include the energy required to compensate for environmental impacts in the future e.g. for the fertilizer needed to restore soil fertility for the significant soil erosion occasioned by corn production). Such arguments are likely to be much more important in the future as other relatively low quality fuels (e.g. oil sands or shale oil) are increasingly considered or developed to replace conventional oil and gas, both of which are likely to be more expensive and probably less available in the not so distant future. If, of course, the alternatives require much oil and or gas for their production, which is often the case, then an increase in the price of petroleum will not necessarily make the alternatives cheaper and more available as a fuel. We believe that for most fuels, especially alternative fuels, the energy gains are reasonably well understood but the boundaries of the denominator, especially with respect to environmental issues, are poorly understood and even more poorly quantified. Thus we think that most EROIs, including those we consider here, are higher (i.e. more favorable) than they would be if we had complete information.
In addition we need some good and consistent way of thinking about the meaning of the magnitude of the various EROIs of various fuels. It is our opinion that many of the EROI arguments so far are simplistic, or at least incomplete, because the “energy break even” point, while usually sufficient to discredit a candidate fuel, should not be the only criteria used. In addition it seems to us that many of the EROI analyses “out there” are generated from the perspective of defeating or defending a particular fuel rather than objectively assessing various potential alternatives. Perhaps we need some way to understand the magnitude, and the meaning, of the overall EROI we might eventually derive for all of a nation’s or society’s fuels collectively by summing all gains from fuels and all costs from obtaining them (i.e.
societal EROI).
We also introduce here new concepts that start with EROI
mm, the standard EROI at the mine mouth (or farmgate etc), and then take it further along the use “food chain”. We call the next step EROI at the “point of use”, or EROI
pou,
Then EROI
ext “extended EROI”, which modifies that equation to include the energy required not only to get but also to use the energy. We define it formally here as:
While we do not pretend to have here the definitive answers about exactly what should or should not be included in our analyses we believe that we can help form the arguments based on author Hall’s professional lifetime’s commitment to thinking about, and publishing on, the issue.
We start with historical, ecological and evolutionary considerations, both because they have helped us a great deal to clarify our own perspectives on these issues and because in the unsubsidized world where evolution operates there are no bailouts or explicit subsidies, a very different situation from the one in which we operate in human society today. We welcome criticisms, extensions or, best of all, empirical analyses related to the concepts discussed in this article and issue. (See also the extensive analyses presented on
www.theoildrum.com website that can be accessed by typing in “EROI” on their search engine, and the many PDFs on the first author’s web site:
http://www.esf.edu/EFB/hall/).
1.1. Background: The History of Formal Thought on Surplus Energy
Energy surplus is defined broadly as the amount of energy left over after the costs of obtaining the energy have been accounted for. The energy literature is quite rich with papers and books that emphasize the importance of energy surplus as a necessary criteria for allowing for the survival and growth of many species including humans, as well as human endeavors, including the development of science, art, culture and indeed civilization itself. Most of us who have thought about this issue deeply would even say that energy surplus is the best general way to think about how different societies evolved over time. To chemists Frederick Soddy and William Ostwald, anthropologist Leslie White, archeologist Joseph Tainter, historian John Perlin, systems ecologist Howard T. Odum, sociologist Frederick Cottrell, economist Nicolas Georgescu-Roegan, energy scientist Vaclav Smil and a number of others in these and other disciplines, human history, including contemporary events, is essentially about exploiting energy and the technologies to do so.
While each acknowledges that other issues such as human culture, nutrient cycling, and entropy (among many others) can be important, each is of the opinion that it is energy itself, and especially surplus energy, that is key. Survival, military efficacy, wealth, art and even civilization itself was believed by all of the above investigators to be a product of surplus energy. For these authors the issue is not simply whether there is surplus energy but how much, what kind (quality), and at what rate it is delivered. The interplay of those three factors determined net energy and hence the ability of a given society to divert attention from life-sustaining needs such as agriculture or the attainment of water towards luxuries such as art and scholarship. Indeed humans could not possibly have made it this far through evolutionary time, or even from one generation to the next, without there being some kind of net positive energy, and they could not have constructed such comprehensive cities, civilizations or wasted so much in war without there being substantial surplus energy in the past.
1.2. Surplus Energy and Biological Evolution
The interplay of biological evolution and surplus energy is far more general, as emphasized a half century ago by Kleiber, Morowitz, Odum and others. Plants and animals are subjected to fierce selective pressure to do the “right thing” energetically; that is to insure that whatever major activity that they undertake gains more energy than it costs, and beyond that gets a larger energy net return than either alternative activities or their competitors. It is obvious that a cheetah, for example, has to catch more energy in its prey than it takes to stalk it and run it down, and considerably more to make it through lean times and also to reproduce. Plants too must make an energy profit to supply net resources for growth and reproduction, as can be seen easily in most clearings in evergreen forests where living boughs on a tree that are in the clearing are usually lower down than they are in the more densely forested and hence shaded side of the tree. If the bough does not carry its weight energetically, that is if its photosynthesis is not greater than the respiratory maintenance metabolism of supporting that bough, the bough will die (or perhaps even be sloughed off by the rest of the tree).
Every plant and every animal must conform to this iron “law” of evolutionary energetics: if you are to survive you must produce or capture more energy than you use to obtain it, if you are to reproduce you must have a large surplus beyond metabolic needs, and if your species are to prosper over evolutionary time you must have a very large surplus for the average individual to compensate for the large losses that occur to the majority of the population. In other words every surviving individual and species needs to do things that gain more energy than they cost, and those species that are successful in an evolutionary sense are those that generate a great deal of surplus energy that allows them to become abundant and to spread. While we are unaware of any official pronouncement of this idea as a law, it seems to us to be so self-obvious that we might as well call it a law – the law of minimum EROI - unless anyone can think of any objections.
While probably most biologists tacitly accept this law (if they have thought about the issue) it is not particularly emphasized in biological teaching. Instead biology in the last century focused mostly on fitness; that is on the ability of organisms to propel their genes into the future through continuation and expansion of populations of species. But in fact energetics is an essential consideration as to what is and what is not fit, and many believe that the total energy balance of an organism is the key to understanding fitness. It took the development of double-labeled isotopes and the exquisite experimental procedures by the likes of Thomas
et al. [
10] to show how powerfully net energy controlled fitness.
Thomas et al. studied tits (chickadees) in France and Corsica and found that those birds that timed their migrations, nest building, and births of their young to coincide with the seasonal availability of large caterpillars, which in turn were dependant upon the timing of the vernalization of the oak leaves they fed upon, had a much greater surplus energy than their counterparties that missed the caterpillars. They fledged more, larger and hence more-likely-to-survive young while also greatly increasing their own probability to return the next year to breed again. Those of their offspring that inherited the proper “calendar” for migration and nesting were in turn far more likely to have successful mating and so on. Tomas et al. also showed how the natural evolutionary pattern was being disrupted by climate change, so that the tits tended to get to their nesting sites too late to capitalize upon the caterpillars, who were emerging earlier in response to earlier leaf out. Presumably if and as climate warming continues natural selection will favor those tits which happened to have genes that told them to move North a bit earlier.
Howard Odum has argued that it is not just the net energy obtained but the power, that is the useful energy per unit time, that is critical in an evolutionary context. From this perspective there is generally a tradeoff between the rate and the efficiency for any given process; that is, the more rapidly a process occurs the lower its efficiency, and vice versa. Under a given set of environmental conditions it is not advantageous to be extremely efficient at the expense of the rate of exploitation, nor to be extremely rapid at the expense of efficiency. For example, a trout that feeds on drifting food in a rapidly flowing stream will acquire large amounts of food drifting by but at a low efficiency; i.e. much of the energy surplus created by the consumption of a large amount of food is spent in muscle contraction for the trout so that it can fight the faster current. Likewise a trout in slow water can be very efficient because its swimming costs are lower, but the slower water brings with it less food, and thus the overall energy surplus will be limited by the lower rate at which food is provided. Dominant trout will pick an optimum intermediate current speed, which will result in faster growth and more offspring [
11]. Subdominant trout will be found in water moving a little faster or a little slower. In some experiments trout with no competitive power will be found drifting aimlessly in still water slowly starving to death.
This kind of tradeoff can be found throughout the plant and animal kingdoms and even rates of power plant operation in industrial society [
12]. It explains why we must shift gears to stay near the middle of each gear range in a stick shift car when we want to accelerate, and why most businessmen once chose to take jumbo jets to cross the Atlantic rather than the Concorde or ocean liners. In fact it can be used to explain why the Concorde went extinct, and perhaps why the second Queen Mary was much smaller than the first.
Of course life in all of its diversity also has a diversity of energy life styles that have been selected for - sloths are just as evolutionarily successful as cheetahs, while warm blooded animals pay for their superior ability to forage in cold weather with a higher energy cost to maintain an elevated body temperature – the list is endless. Yet there remains a rate-efficiency tradeoff within each lifestyle. While drift-feeding trout choose areas of intermediate current to maximize the energy surplus, suckers have “chosen” through natural selection (i.e. have been selected for) to maximize energy surplus by processing lower quality food on the bottom, and probably have an optimum power output for that set of environmental conditions.
Nevertheless each life style must be able to turn in an energy profit sufficient to survive, reproduce and make it through tough times. There are few, if any, examples of extant species that barely make an energy profit – for each has to pay for not only their maintenance metabolism but also their “depreciation” and “research and development” (i.e. evolution), just as a business must, out of current income. Thus their energy profit must be sufficient to mate, raise their young, “pay” the predators and the pathogens and adjust to environmental change through sufficient surplus reproduction to allow evolution. Only those organisms with a sufficient net output and sufficient power (i.e. useful energy gained per time) are able to undertake this through evolutionary time, and indeed some 99 plus percent of all species that have ever lived on the planet are no longer with us – their “technology” was not adequate, or adequately flexible, to supply sufficient net energy to balance gains against losses as their environment changed. Given losses to predation, nesting failures and the requirements of energy for many other things the energy surplus needs to be quite substantial for the species to survive in time.
2. Application to Human Populations
Likewise human populations must generate sufficient net energy to survive, reproduce and adapt to changing conditions. Humans must first feed themselves before attending to other issues. While people in most industrial societies today hardly worry about getting enough to eat, for much of the world and much of humanity’s history and prehistory getting enough food was the most important issue. For at least 98 percent of the 2 or so million years that we have been recognizably human the principal technology by which we as humans have fed ourselves, that is obtained the energy we need for life, has been that of hunting and gathering. Contemporary hunter gatherers -- such as the !Kung of the Kalahari desert in southern Africa -- are probably as close to our long term ancestors as we will be able to understand. Most hunter-gatherer humans were probably little different from cheetahs or trout in that their principal economic focus is on obtaining food and for getting their requirement for surplus energy directly from their environment. Studies by anthropologists such as Lee [
13] and Rapaport [
14] confirmed that indeed present-day (or at least recent) hunter-gatherers and shifting cultivators acted in ways that appeared to maximize their own energy return on investment.
According to such anthropological studies as we have, the !Kung life style, under normal circumstances, generates a quite positive energy return on investment (i.e. generates a large surplus) from their desert environment, perhaps an average of some 10 Kcal returned per their own Kcal invested in hunting and gathering. In normal times these cultures had plenty to eat, and the people tended to use their time made available from their relatively high EROI lifestyles in socializing, child-care and story telling. The downside was that there were periodic tough times, such as droughts, during which starvation was a possibility. It is probable that our ancestors had a fairly positive EROI for much of the time, although periodic droughts, diseases and wars must have occasionally, or perhaps routinely, taken a large toll. Thus even though they had a relatively high EROI, perhaps 10:1, their populations tended to be relatively stable over a very long time, for human populations barely grew from thousands of years before Christ until about 1900. Thus even the relatively high energy return was not enough to generate much in the way of net population growth over time.
The rate at which plants and animals can exploit their own resource base changes slowly through evolution. All must adapt to climate and other changes, and animals must also adapt to the fact that their food is also going through its own defensive evolutionary changes. Humans are different, for the human brain, language and the written word have allowed for much more rapid cultural evolution. The most important of these changes were energy-related: the development of energy-concentrating spear points and knife blades, agriculture as a means to concentrate solar energy for human use, and more recently the exploitation of wind and water power and, of particular interest to this paper, fossil fuels. What is important from our perspective is that each of these cultural adaptations is part of a continuum in which humans increase the rate at which they exploit additional resources from nature, including both energy and non-energy resources.
The development of agriculture allowed the redirection of the photosynthetic energy captured on the land from the many diverse species in a natural ecosystem to the few species of plants (called cultivars) that humans can and wish to eat, or to the grazing animals that humans controlled. Curiously the massive increase in food production per unit of land brought on by agriculture did not, over the long run, on average, increase human nutrition but mostly just increased the numbers of people [
15]. Of course it also allowed the development of cities, bureaucracies, hierarchies, the arts, more potent warfare and so on – that is, all that we call civilization, as nicely developed by Jared Diamond in Guns, Germs and Steel [
16]. Throughout most of human history, humans themselves did most of the work, often as slaves but more generally as physical laborers which, in one way or another, most humans were.
Over time humans increased their control of energy through technology, although for thousands of years most of the energy used was animate -- people or draft animals -- and derived from recent solar energy. A second very important source of energy was from wood, which has been recounted in fascinating detail in Perlin [
17], Pointing [
18] and Smil [
19]. Massive areas of the Earth’s surface – Peloponnesia, India, parts of England and many others have been deforested three or more times as civilizations have cut down the trees for fuel or materials, prospered from the newly cleared agricultural land and then collapsed as fuel and soil become depleted. Archeologist Joseph Tainter [
20] recounts the general tendency of humans to build up civilizations of increasing reach and infrastructure that eventually exceeded the energy available to that society.
In summary, it seems obvious that both natural biological systems subject to natural selection and the pre-industrial civilizations that preceded ourselves were highly dependant upon maintaining not just a bare energy surplus from organic sources but rather a substantial energy surplus that allowed for the support of the entire system in question – whether of an evolving natural population or a civilization. Most of the earlier civilizations that left artifacts that we now visit and marvel at – pyramids, ancient cities, monuments and so on – had to have had a huge energy surplus for this to happen, although we can hardly calculate what that was. An important question for today is to what degree does the past critical importance of surplus energy apply to contemporary civilization with its massive although possibly threatened energy surpluses.
2.1. Surplus Energy and Contemporary Industrial Society
All of life, including human life in all of its manifestations, runs principally on contemporary sunlight that enters the top of our atmosphere at approximately 1400 Watts per square meter. Roughly half that amount reaches the Earth’s surface. This sunlight does the enormous amount of work that is necessary for all life, including human life isolated from nature in cities and buildings. The principal work that this sunlight does on the Earth’s surface is to evaporate water from that surface (evaporation) or from plant tissues (transpiration) which in turn generates elevated water that falls eventually back on the Earth’s surface as rain, especially at higher elevations. The rain in turn generates rivers, lakes and estuaries and provides water that nurtures plants and animals. Differential heating of the Earth’s surface generates winds that cycle the evaporated water around the world, and sunlight of course maintains habitable temperatures and is the basis for photosynthesis in both natural and human-dominated ecosystems. These basic resources have barely changed since the evolution of humans (except for the impacts of the ice ages) so that preindustrial humans were essentially dependent upon a constant although limited resource base.
Contemporary industrial civilizations are dependent in addition on fossil fuels. Today fossil fuels are mined around the world, refined and sent to centers of consumption. For many industrial countries, the original sources of fossil fuels were from their own domestic resources. The United States, Mexico and Canada are good examples. However, since many of these industrial nations have been in the energy extraction business for a long time they tend to have both the most sophisticated technology and the most depleted fuel resources, at least relative to many countries with more recently developed fuel resources. For example, as of 2008 the United States, originally endowed with one of the world’s largest oil provinces, was producing only about 40 percent of the oil that it was in the peak year of 1970, Canada had begun a serious decline in the production of conventional oil, and Mexico recently was startled to find that its giant Cantarell field, once the world’s second largest, had begun a steep decline in production at least a decade ahead of schedule.
2.2. Economic Cost of Energy
In real economies, energy comes from many sources – from imported and domestic sources of oil, coal and natural gas, as well as hydropower and nuclear, and from a little renewable energy – most of that as firewood but increasingly from wind etc. Most of these are cheaper per unit energy delivered than oil. So let’s look at what this real ratio of the cost of energy (from all sources, weighed by their importance) is relative to its benefits.
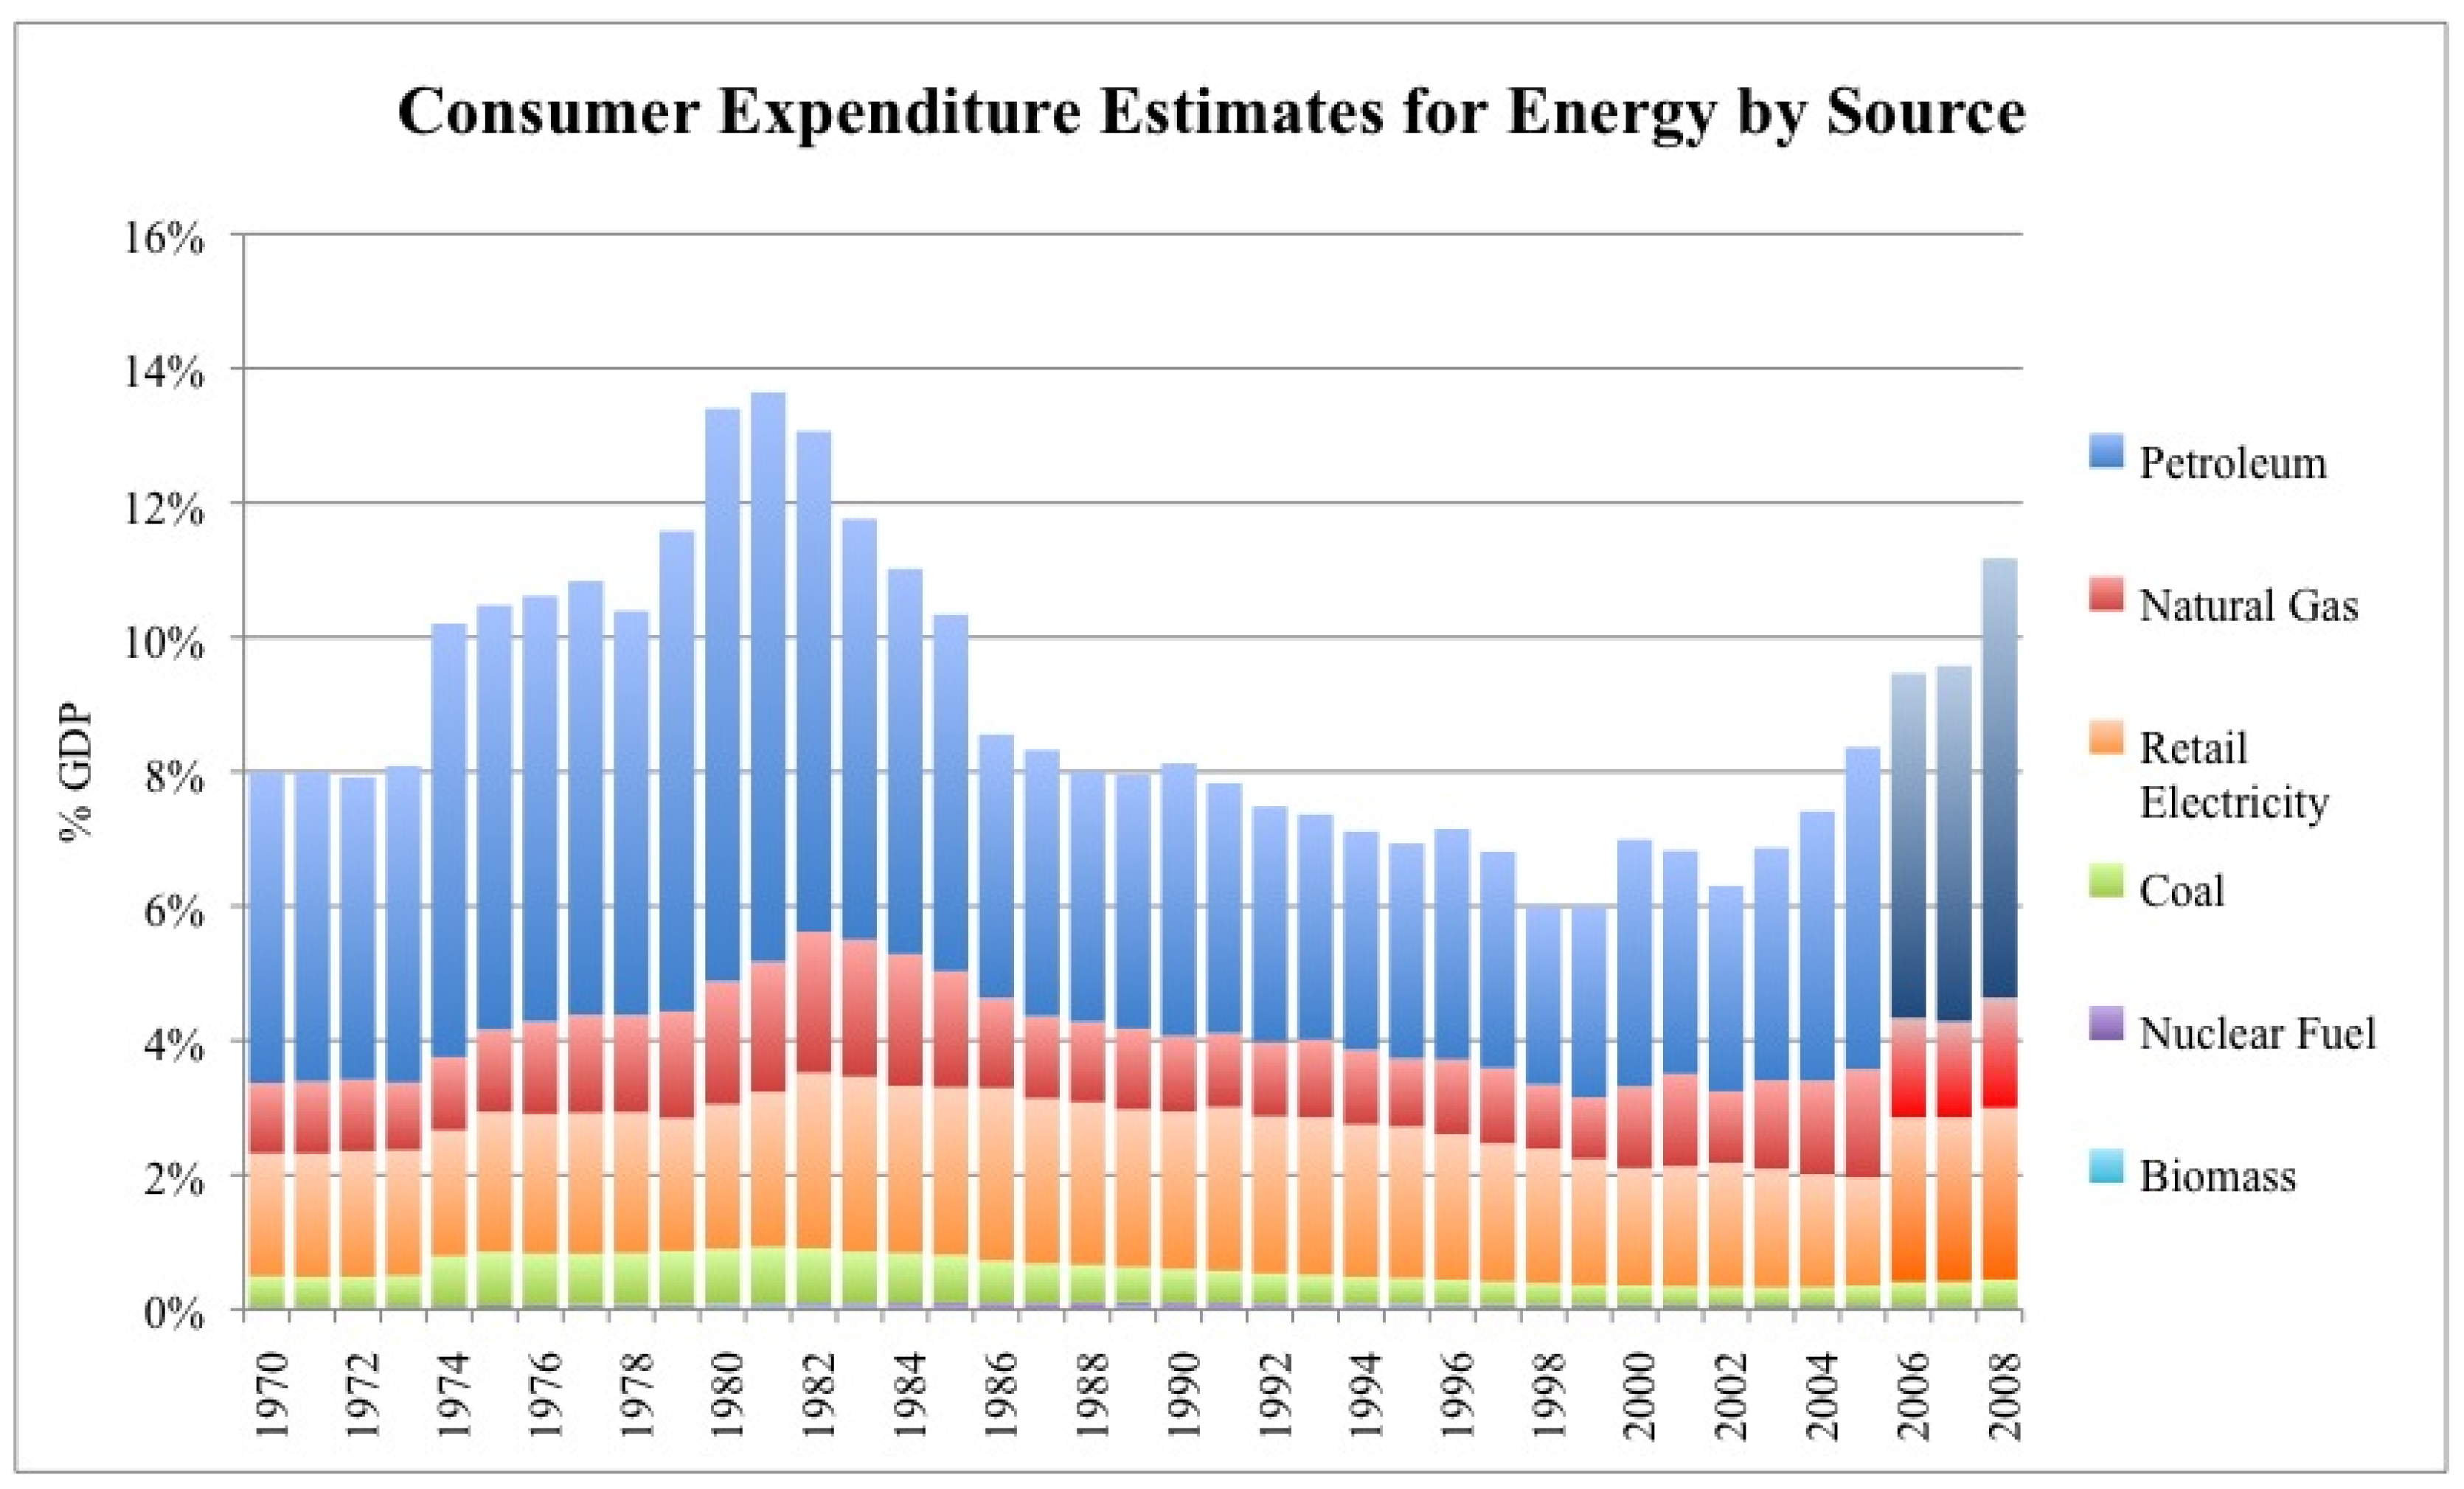
By this token the relation of the proportional energy cost in dollars is similar, as we shall see, to the proportional energy cost in joules; in 2007 roughly 9 percent (1 trillion dollars) of the U.S. GDP was spent by final demand for all kinds of energy in the US economy to produce the 12 trillion dollars worth of total GDP (
Figure 1). This ratio certainly increased in the first half of 2008 as the price of oil exceeded $140 a barrel and then fell again. The abrupt rise in the 1970s, subsequent decline through 2000, and increase again through mid 2008 of this value had large impacts on discretionary spending because the 5 to 10 percent change in total energy cost would come mainly out of the 25 or so percent of the economy that is discretionary spending. Thus we believe that changes in energy prices have very large economic impacts. At least thus far the changes in price seem to reflect the generally decreasing EROI only sporadically although that seemed to be changing recently until the economic crash of fall 2008, when collapsing demand took over. What future prices will be is anyone’s guess but even as economies crash there is a great deal of information implying that dollar, and hence presumably energy, costs of fuels are increasing substantially. Our guess is that declining EROI will take a huge economic toll in the future [
6].
2.3. EROI for U.S. and North American Domestic Resources and Its Implications for the “Minimum EROI”
In the past the first author worked with Cutler Cleveland and Robert Kaufmann to define and calculate the energy return on investment (EROI) of the most important fuels for the United States’ economy. Since that time Cleveland has undertaken additional and updated analyses for the US economy and Nate Gagnon and Hall have attempted to do that for the world average. Our results indicate that there is still a very large energy surplus from fossil fuels -- variously estimated as an EROI (i.e. EROImm) from perhaps 80 to one (domestic coal) to perhaps 11-18 to one (US) to 20 to one (World) for contemporary oil and gas. In other words, globally for every barrel of oil, or its equivalent, invested in seeking and producing more oil some 20 barrels are delivered to society. Thus fossil fuels still provide a very large energy surplus, obviously enough to run and expand the human population and the very large and complex industrial societies around the world. This surplus energy of roughly 20 or more units of energy returned per unit invested in getting it, plus the large agricultural yields generated by fossil-fueled agriculture, allows a huge surplus quantity of energy, including food energy, delivered to society. This in turn allows most people and capital to be employed somewhere else other than in the energy industry. In other words these huge energy surpluses have allowed the development of all aspects of our civilization -- both good and bad.
That’s the good news. The bad news is that the depletion of fossil fuels has been occurring since the first ton of coal or barrel of oil was mined, since these fuels need about 100 or so million years to regenerate. Many economists argue that technology, the market and economic incentives will continue to find oil to replace that which we have extracted, or that prices will increase as oil reserves deplete and society will substitute away from oil as technologies are developed that allow for such a substitution [
21]. Thus one can argue that depletion and technology are in a race over time. Which is winning?
We argue that one can determine this from the time trend of EROI. The EROI for oil in the US during the heydays of oil development in Texas, Oklahoma and Louisiana in the 1930s was about 100 returned for one invested [
22]. During the 1970s it was about 30:1, and for about 2000 it was from 11 to 18 returned per one invested [
3,
4,
22]. For the world the estimate was about 35:1 in the late 1990s declining to about 20:1 in the first half decade of the 2000s (Gagnon
et al. in preparation). In addition there is considerable evidence that, in the case of oil, we are mostly just pumping out old fields rather than replacing extracted oil with newly found oil. Globally we are using between 2 to 3 barrels for each new barrel found [
23]. The analysis of Gagnon
et al. suggests that if current trends continue linearly then in about two to three decades it will take one barrel of petroleum to find and produce one barrel of petroleum, and oil and eventually gas will cease to be a net source of energy. (A special case can be made for e.g. tar sands, where it may make sense to extract two barrels from the ground, use one for the process and then deliver the second barrel to society). This also means that the question is not necessarily what the size of global oil reserves is but rather what is the size of that portion that is extractable with a positive net energy value and at what rate the high EROI fuels can be produced. The implications of this are obvious and huge, and help make an argument for seeking possible substitutes earlier rather than later [
6].
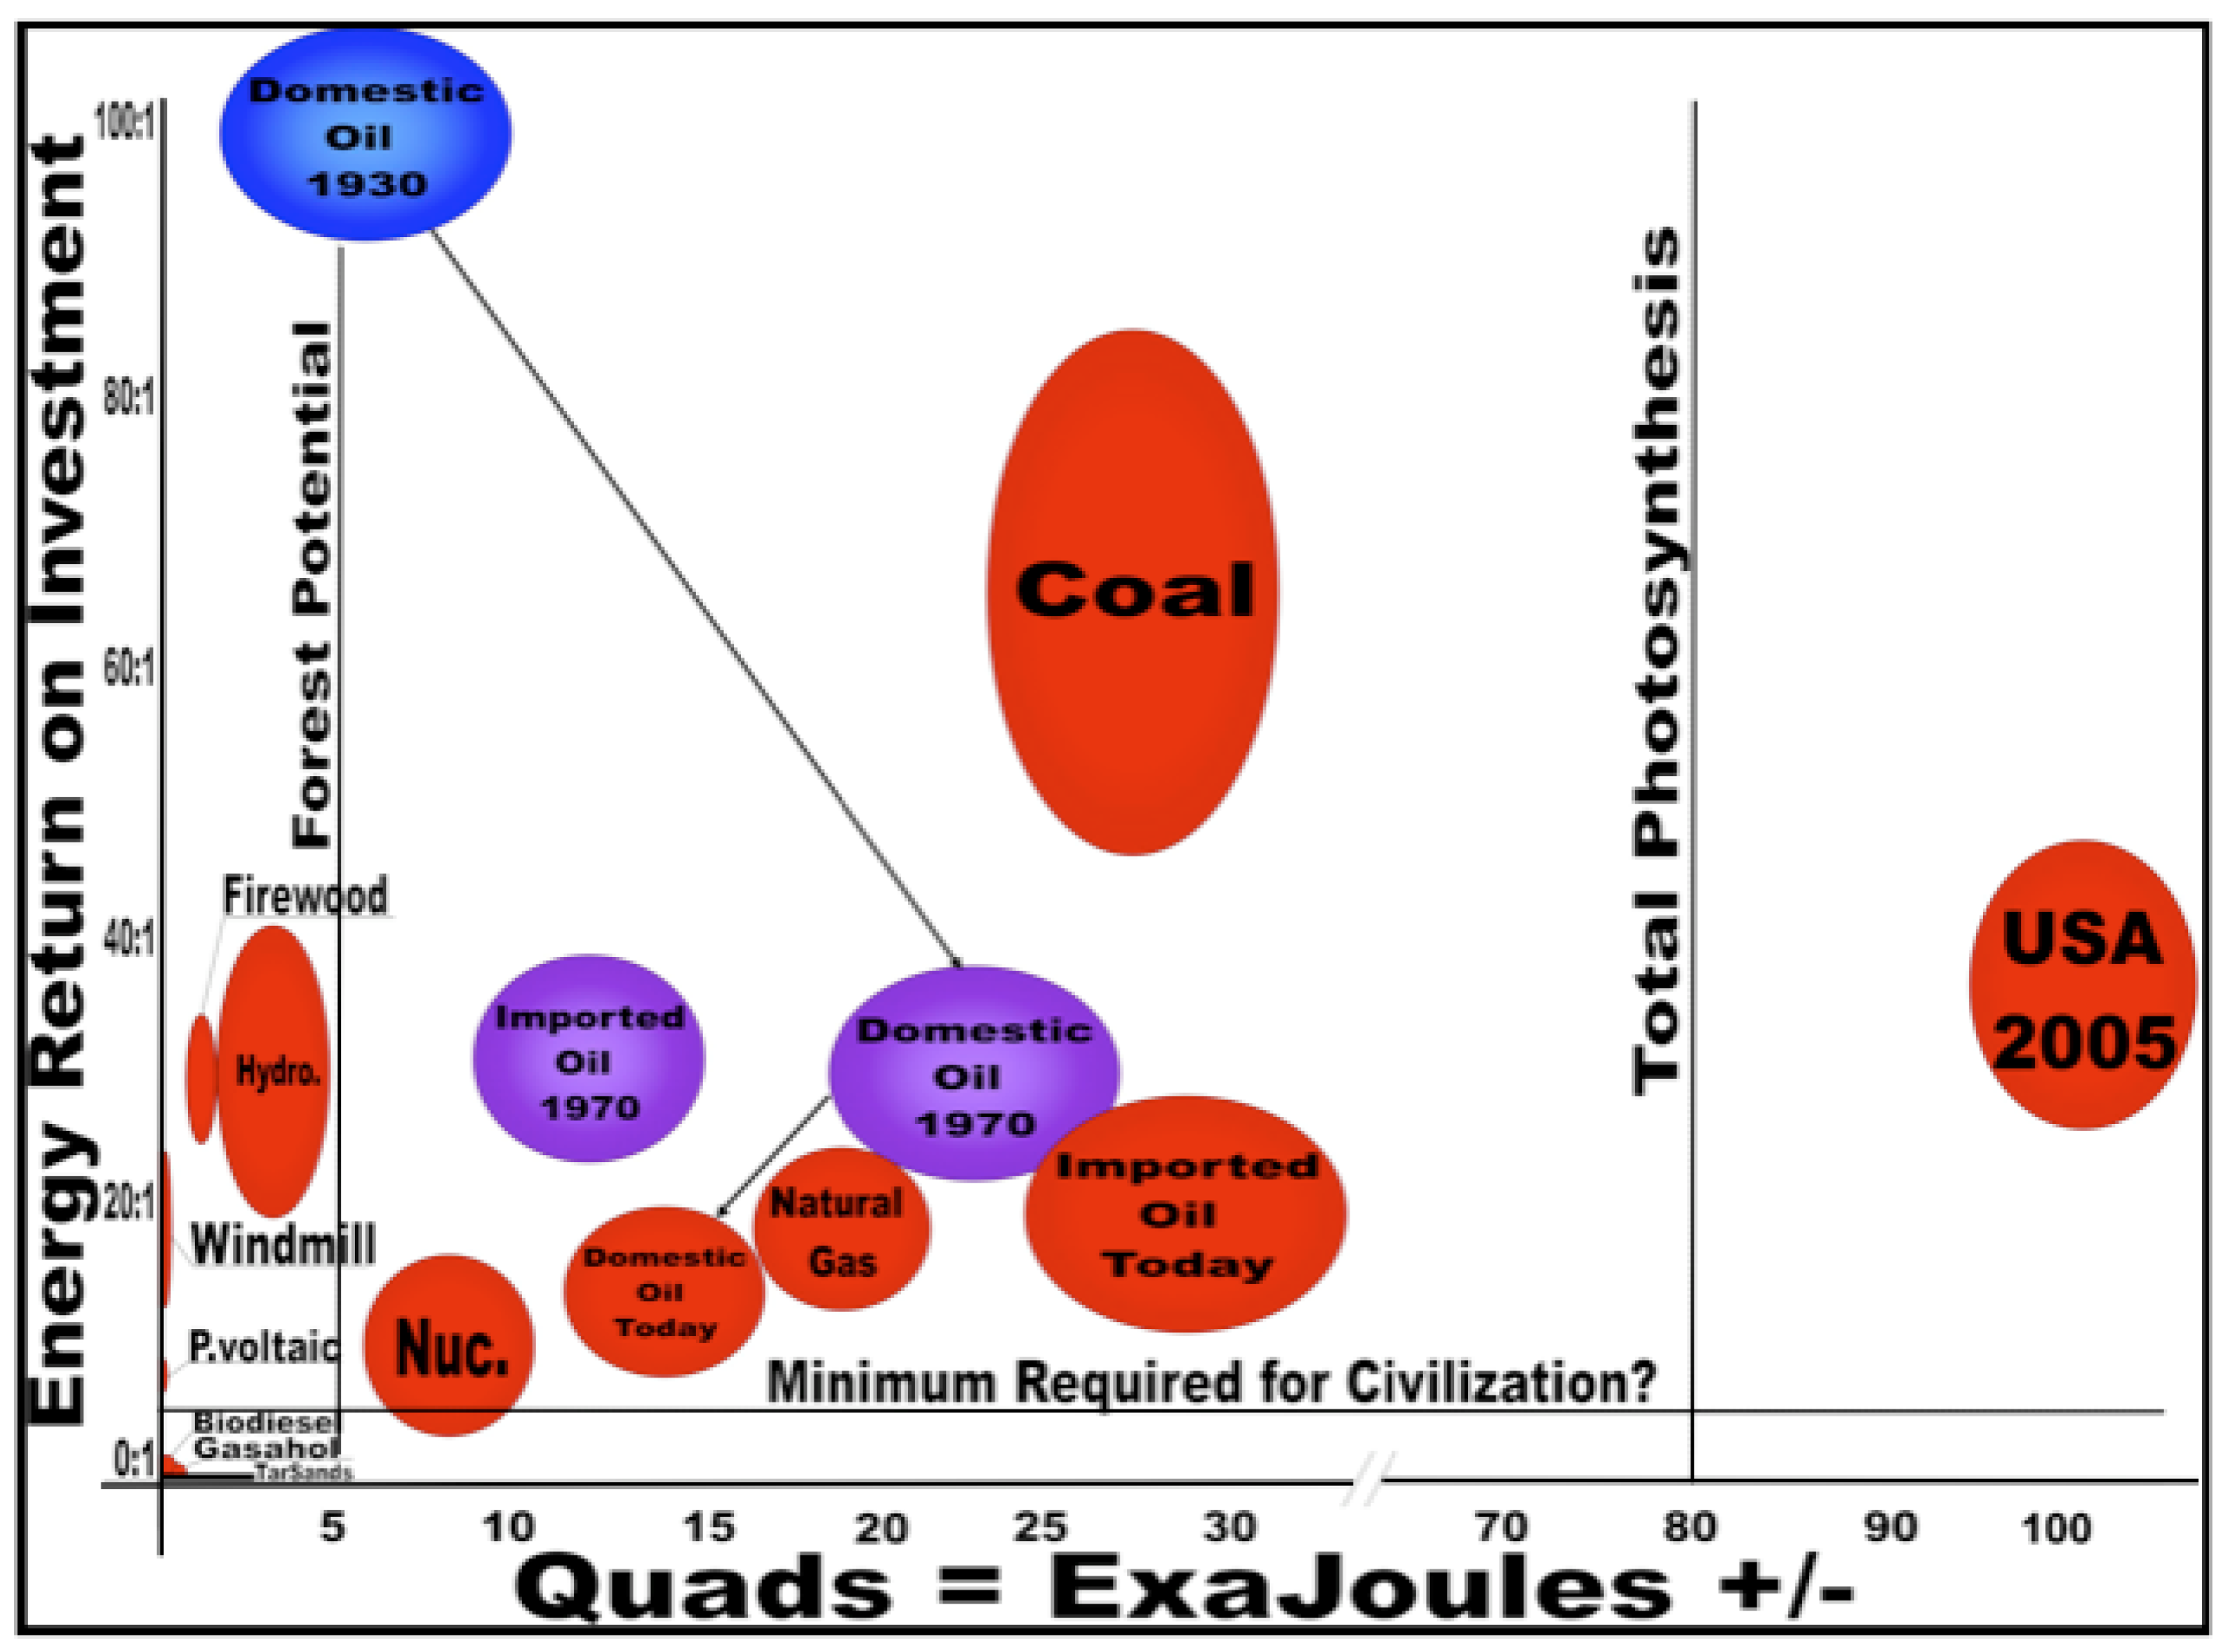
But the problem with substitutes to fossil fuels is that of the alternatives available none appear to have the desirable traits of fossil fuels. These include: 1) sufficient energy density 2) transportability 3) relatively low environmental impact per net unit delivered to society 4) relatively high EROI and 5) are obtainable on a scale that society presently demands (
Figure 2). Thus it would seem that society, both the US and the world, is likely to be facing a decline in both the quantity and EROI of its principal fuels. Our next question is “what are the implications of this?”
Figure 2.
“Balloon graph” representing quality (EROI – Y axis) and quantity (X axis) of the United States economy for various fuels at various times. Arrows connect fuels from various times (i.e. domestic oil in 1930, 1970, 2005 – “today”), and the size of the “balloon” represents part of the uncertainty associated with EROI estimates, i.e. larger “balloons” represent more uncertainty. The horizontal line indicates that there is some minimum EROI that is needed to make society work, and the vertical line to the left indicates one estimate of maximum forestry potential and the vertical line to the right is David Pimentel’s earlier estimate of total photosynthesis in the United States (Source: US EIA, Cutler Cleveland and C. Hall’s own EROI work in preparation). (Reprinted with minor changes from [
6]).
3. The surplus available to run the rest of the economy
We first generate a simplistic view of the economy in every day units to try to develop for the reader an explanation of how an economy obtains the energy needed for its own function and how differences in EROI might affect that. Assume for the moment that the United States’ economy runs 100 percent on domestic oil, and that energy itself is not what is desired by the final consumer but rather the goods and services derived from the general economy. In the early years of this new millennium the U.S. Gross Domestic Product (proxy variable for the size of the U.S. economy) was about 12 trillion dollars, and it used about 100 quadrillion BTUs (called Quads, equal to 1015 BTUs), which is equivalent to about 105 ExaJoules (1 EJ equals 1018 Joules). Dividing the two we find that we use an average of about 8.7 Mega Joules (1 MJ equals 106 joules) to generate one dollar’s worth of goods and services in 2005. By comparison, gasoline at $3 per gallon delivers about 44 MJ per dollar (at 130.8 MJ per gallon of gasoline), plus roughly another ten percent to get that gasoline (refinery cost ≈ 4 MJ), so if you spend one dollar on energy directly vs. one dollar on general economic activity you would consume about 48/8.3 or 5.8 times more energy.
In the 1970s analyses were undertaken by Bullard, Hannon, Herendeen [
24] and Costanza [
25] that showed that (except for energy itself) it does not matter enormously where money is spent within final demand due to the complex interdependency of our economy (that is, the final products that consumers buy are relatively unimportant to overall GDP/energy efficiency because there are so many interdependencies, i.e. each sector purchases from many others within our economy, although this does not apply to the intermediate products purchased by manufacturers). According to Costanza [
25], the market selects for generating a similar amount of wealth per unit of energy used within the whole economic “food chain” leading to final demand. While this is not exactly true it is close enough for our present purposes and it is certainly true for the average of all economic activity.
What is the energy “price” of the oil in this example to 1) the country (either domestic or if it is imported) and 2) to the consumer -- relative to the total economic activity of each entity? One can do some simple math. There are about 6.1 GJ in a standard 42 gallon barrel of oil, so the 105 EJ of industrial energy the U.S. uses to run its economy for a year is equivalent to roughly 17 billion barrels of oil. At $70 per barrel that amount of oil would take 1.2 trillion dollars to purchase (or at 3 dollars a gallon, 2.1 trillion to the consumer), which is either about one tenth of GDP, or one sixth if we consider it from the perspective of the consumer (the difference between the two estimates going to the oil companies after production or to refineries, gas station attendants etc. as inputs, profits, wages, delivery costs etc.). Thus the price of energy delivered to the consumer is roughly twice that of the wellhead price (or much more if converted to electricity).
Now assume that the real price of oil, that is the price of oil relative to other goods and services, increased by two, that is to $140 a barrel in today’s dollars (which it did briefly in 2008), and that the total size of the economy stayed the same – that is some other components of the economy were diverted to pay for that oil. If that happened, then one fifth (17 billion times 140 = $2.38 trillion/12 trillion) of the economy would be used to buy the oil to run the other four fifths (that is that part not including the energy extraction system itself). If the price of oil increased to $250 per barrel, about one third of all economic activity would be required to run the other two thirds, and at $750 a barrel then the output of the entire economy, that is 12 trillion dollars, would be required to generate the money to purchase the energy required to run the economy, i.e. there would be no net output. While in fact in a real economy there would be many adjustments, alternative fuels and nuances this analysis does at least give an overview of the relation of gross to net economic activity, and the importance of EROI in energy and economic terms to the rest of the economy. As the price of fuel increases (or as its EROI declines) there are large impacts on the rest of the economy. These impacts can be especially influential because changes in the price of energy tend to impact discretionary, not base, spending.
Of course most of our energy costs less than oil so that the 70 dollars a barrel we used in the example above translates to – in the real economy -- the equivalent of about $35 a barrel equivalent at the source or $70 a barrel by the time the consumer gets the energy, hence we can assume for this scenario that on average about 10 percent of the dollar economy (i.e. $70 times 17 billion barrels or 1.2 trillion out of 12 trillion dollars) is used just to purchase the energy that allows the rest of the economy to function, which produces the end products we want. This 10 percent of our economic activity means that roughly ten percent of all workers’ time, ten percent of the energy used in their jobs, and ten percent of the total materials consumed were used in some sense to simply get the energy to the final consumer to make the rest of the economy work. According to the official statistics of the U.S. Energy Information Agency in 2007 the cost of energy to the consumer was about 9 percent of the total U.S. economy
Figure 1), so our numbers seem about right on average.
4. EROI of obtaining energy through trade
Now let us assume that the economy runs 100 percent on imported oil. An economy without enough domestic fossil fuels of the type it needs must import the fuels and pay for them with some kind of surplus economic activity. The ability to purchase the critically required energy depends upon what else it can generate to sell to the world as well as the fuel required to grow or produce that material. For example Costa Rica to a large degree pays for its imported oil with exported bananas and coffee. These are commodities highly valued in the world and hence readily sold. However they are also quite energy-intensive to produce, especially when produced of the quality that sells in the rich countries. For example, bananas require an amount of money equivalent to about half of their purchase price to pay for the fuel and petrochemicals required for their production and cosmetic quality [
26]. So in this case, and in other such cases, the EROI for the imported fuel is the relation between the amount of fuel bought with a dollar or euro relative to the amount of dollar or euro profits gained by selling the goods and services for export. And the quantity of the goods or services exported to attain a barrel of oil depends upon the relative prices of the fuel vs the exported commodities.
Kaufmann (in [
5]) estimated that from roughly 1950 through the early 1980s the energy cost of generating a dollar’s worth of our major US exports, e.g. wheat and commercial jetliners, and also the chemical energy found in one dollar’s worth of imported oil. The concept was that the EROI for imported oil depended upon what proportion of an imported dollar’s worth of oil did you need to use to generate the money from oversees sales of U.S. -produced goods and services that you traded, in a net sense, for that oil. He concluded that before the oil price increases of the 1970s the EROI for imported oil was about 25:1, very favorable for the United States, but that dropped to about 9:1 after the first oil price hike in 1973 and then down to about 3:1 following the second oil price hike in 1979. The ratio has returned to a more favorable level (from the perspective of the US) since then because the price of exported goods has increased through inflation more rapidly than the price of oil. However, as oil prices increased again in this decade, as more of the remaining conventional oil is concentrated in fewer and fewer countries, and with the future supply of abundant conventional oil in question [
27], estimating the EROI of obtaining energy through trade may be very useful in predicting economic vulnerability in the near future (see [
6]).
Now let’s revisit our previous example and assume that the U.S. economy of 2007 runs entirely on imported oil rather than domestic oil. Neglecting for the moment debt and certain financial transactions such as cost of transport and foreigners investing in our banks, we, in a net sense, take oil, invest it in the economy, sell some of the products abroad to generate foreign exchange and then use that foreign exchange to purchase oil from someone else -- which we then use in the economy to generate more goods and services. To get the 1.2 trillion dollars worth of oil (17 billion barrels times $70 a barrel) that we would be importing under this scenario we would have to sell at least 1.2 trillion dollars worth of our production abroad, which would require $1.2 trillion times 8.7 MJ used per average dollar generated in the economy, or 10.4 EJ of our own energy. Thus about one tenth (10.4 EJ of 105 EJ) of our total energy used and a roughly similar amount of our total economic activity would be required just to get the energy required to run the rest of the economy which produces the goods and services we want. Thus an EROI of about 10: 1. This is still a pretty favorable return, but only about 40 percent as favorable as it was in 1970 when it was 25: 1 or even in 1998. To some degree we have managed to continue to do this through debt, which gives us a temporarily higher EROI. Were we to pay off this debt in the future, and those who got the dollars wished to turn them into real goods and services (which seems a reasonable assumption), then we will have to take some substantial part of our remaining energy reserves out of the ground and convert it into fish, rice, beef, Fords and so on that those people would be able to buy from us.
The dollar return on dollars invested is similar: 1.2 trillion of foreign exchange would be required to buy the oil (energy) that allows one to generate in the economy 12 trillion dollars, assuming that we ran only on imported oil. But if the price of oil inflates more rapidly than the prices of goods and services traded for the oil, then the portion of economic activity dedicated to raising foreign exchange to get that oil must increase unless the economy gets more efficient, a complex but probably oversold issue we will avoid here. Cleveland
et al. [
4] found a very high correlation between quality-corrected energy use and GDP from 1904 to 1984. Since then the economy has increased much faster than energy use – although if one uses inflation rates calculated using the pre-Clinton era equation for CPI –such as that provided by
www.shadowstatistics.com, the GDP declines and a tighter relation between GDP and energy use returns. Nonetheless, we believe that sharp increases (or decreases) in the price of imported oil will probably cause a series of structural changes to our economy that most people will not find particularly desirable. In fact, it is hard to ignore the coincident timing between the increases in the real price of oil culminating in the summer of 2008 and the subsequent financial collapse towards the end of the summer/fall 2008.
5. Toward a more Comprehensive EROI: A first Estimate of the Downstream Costs associated with Refining, Transporting and Using Oil in the U.S.
If we extend the energy cost of obtaining a fuel from the wellhead towards the final consumer the energy delivered goes down and the energy cost of getting it to that point goes up, both reducing the EROI. This begins the analysis of what might be the minimum EROI required in society. We do this by taking the standard EROI (i.e. EROImm; about 10:1) for oil and then include in the denominator the energy requirements to get fuel to the point of use (i.e. EROIpou) and the energy required to use it, generating an EROIext, i.e. extended EROI. In this analysis we assume the energy costs are paid for in oil.
5.1. Calculating EROI at the point of use
Refinery losses and costs: Oil refineries use roughly 10 percent of the energy in fuel to refine it to the form that we use [
28]. In addition about 17 percent of the material in a barrel of crude oil ends up as other petroleum products, not fuel [
1]. So for every 100 barrels coming into a refinery only about 73 barrels leaves as usable fuel. Natural gas does not need such extensive refining although an unknown amount needs to be used to separate the gas into its various components and a great deal, perhaps as much as 25 percent, is lost through pipeline leaks and to maintain pipeline pressure. Coal is usually burned to make electricity at an average efficiency of 35 - 40 percent. However the product, electricity, has at least a factor of three higher quality so that we do not count as costs the inefficiency of that process. What this means, however, is that oil resources that have an EROI of 1.1 MJ returned per MJ invested at the wellhead cannot provide energy profits for a society because at least 1.27 MJ of crude oil is required to deliver that one MJ to society as a fuel.
Transportation costs: Oil weighs roughly 0.136 tons per barrel. Transportation by truck uses about 3400 BTU/ton-mile or 3.58 MJ per ton-mile [
29]. Transportation by fuel pipeline requires 500 BTU/ton-mile or 0.52 MJ per ton-mile. We assume that the average distance that oil moves from port or oil field to market is about 600 miles. Thus a barrel of oil, with about 6.2 GJ of contained chemical energy, requires on average about 600 miles of travel x 0.136 tons per barrel x 3.58 MJ per ton-mile = 292 MJ per barrel spent on transport, or about 5% of the total energy content of a barrel of oil to move it to where it is used (
Table 1). If the oil is moved by pipeline (the more usual case), this percentage becomes about 1%. We assume that coal moves an average of 1500 miles, mostly by train at roughly 1720 BTU per ton mile or about 1.81 MJ per ton-mile [
29], so that the energy cost to move a ton of bituminous coal with about 32 GJ/Ton to its average destination is 1500 miles x 1.81 MJ per ton-mile = 2715 MJ per ton, or 2.715 GJ per ton of coal, which is about 8 percent of it’s energy content (
Table 1). Line losses, if shipped as electricity, are roughly similar. So adding between 1 and 8 percent of the energy value of fuels for delivery costs does not seem unreasonable. We assume that these costs would decrease all EROIs by a conservative 5 percent (or 3 percent of crude oil in the ground) to get it to the user, in other words the fuel must have an EROI of at least 1.05: 1 to account for delivery of that fuel.
Thus we find that our EROIpou is about 40 percent (17 percent non fuel loss, plus 10 percent to run the refinery, plus 10 percent extraction, plus about 3 percent transportation loss) less than the EROImm indicating that at least for oil one needs an EROI at the mine mouth of roughly 1.4 to get that energy to the point of final use.
Table 1.
The energy cost of transporting oil and coal.
Table 1.
The energy cost of transporting oil and coal.
| Energies Cost (MJ/ton-mile) | Miles Traveled | Energy Cost(MJ) | Energy Cost as % of energy unit delivered1 |
|---|
| Oil | | | | | |
| Truck2 | 3.58 | 600 | 292 | 5% |
| Pipeline2 | 0.52 | 600 | 42 | 1% |
| Coal | | | | | |
| Train2 | 1.81 | 1500 | 2715 | 8% |
5.2. Extended EROI: Calculating EROI at the point of use for oil correcting for the energy required for creating and maintaining infrastructure
We must remember that usually what we want is energy services, not energy itself, which usually has little intrinsic economic utility, e.g. for most oil we want kilometers driven, not just the fuel that does that. That means that we need to count in our equation not just the “upstream” energy cost of finding and producing the fuels themselves but all of the “downstream” energy required to deliver the service (in this case transportation), i.e. 1) building and maintaining vehicles, 2) making and maintaining the roads used, 3) incorporating the depreciation of vehicles, 4) incorporating the cost of insurance, 5) etc. All of these things are as necessary to drive that mile as the gasoline itself, at least in modern society. For the same reason businesses pay some 45 or 50 cents per mile when a personal car is used for business, not just the 10 cents or so per mile that the gasoline costs. So in some sense the dollar required for delivering the service (a mile driven) is some 4 to 5 times the direct fuel costs, and this does not include the taxes used to maintain most of the roads and bridges. Now many of these costs, especially insurance, use less energy per dollar spent than fuel itself and also less than that for constructing or repairing automobiles or roads, although this is certainly not the case with the money used to deliver the fuel itself used in these operations.
On the other hand the energy intensity of one dollar’s worth of fuel is some 8 times greater than that for one dollar’s worth of infrastructural costs.
Table 2 gives our estimates of the energy cost of creating and maintaining the entire infrastructure necessary to use all of the transportation fuel consumed in the US. The energy intensities are rough estimates of the energy used to undertake any economic activity derived from the national mean ratio of GDP to energy (about 8.7 MJ/dollar), the Carnegie-Mellon energy calculator web site and from Robert Herendeen (personal communication). Specifically Herendeen estimates for 2005 that heavy construction uses about 14 MJ per dollar. In the 1970s insurance and other financial services had about half (7) the energy intensities as heavy industry [
29].
Our calculation, then, of adding in the energy costs of getting the oil in the ground to the consumer in a usable from (40 percent) plus the pro-rated energy cost of the infrastructure necessary to use the fuel (24 percent) is 64 percent of the initial oil in the ground (
Table 3). Thus the energy necessary to provide the services of 1 unit of crude oil (i.e. at the gas station) is roughly 3 units of crude oil, and probably similar proportions for other types of fuels. This cuts our 10:1 EROI
mm to about 3:1 for a gallon at final use, since about two thirds of the energy extracted is necessary to do the other things required to get the service from burning that one gallon. It also means that we need a minimum EROI of 3:1 at the well head to deliver one unit from that oil to final demand.
Future research might further “extend” our “EROIext” by including the energy of all of the people and economic activity included directly and indirectly to deliver the energy. Since, as we have indicated, roughly 10 percent of the economy is associated with getting energy (this includes even those farmers who grow the grain or laborers who build the airplanes) that we as a nation might say that part of the denominator for the EROIext would be ten percent of all of the energy used in the country.
Table 2.
Estimates of energy and dollar expenditures within the total U.S. transportation sector.
Table 2.
Estimates of energy and dollar expenditures within the total U.S. transportation sector.
| Category | Dollars (109) | As percent of Total Dollar Expenditures | Conversion Factor (MJ/$) | Total (EJ) | As percent of Total Energy Expenditures |
|---|
| Federal Highway Administration Spending (2005)1 | 30 | 3.45% | 14 | 0.420 | 3.86% |
| State Highway Spending (2005)1 | 11 | 1.26% | 14 | 0.158 | 1.45% |
| Local Disbursements for Highway Spending (2005)1 | 57 | 6.55% | 14 | 0.804 | 7.38% |
| Motor Vehicles & Parts (2005)4 | 443 | 50.92% | 14 | 6.203 | 56.94% |
| Automobile maintenance (2005)4 | 143 | 16.44% | 14 | 2.008 | 18.43% |
| Automobile insurance spending (2007)5 | 162 | 18.62% | 7 | 1.134 | 10.41% |
| Automotive Service Technicians and Mechanics (2007)6 | 24 | 2.76% | 7 | 0.166 | 1.52% |
| Total Cost of Transportation Infrastructure | 870 | 100.00% | - | 10.893 | 100.00% |
An important issue here is EROI vs. conversion efficiency. The EROI technically measures just the energy used in getting the rest of the energy to some point in society, usually the well-head. But if we then say “to the consumer” we have to include the refinery losses and energy costs, and also the costs to deliver the fuel to the final consumer. It may also include the energy costs of maintaining the infrastructure to use that fuel. These are in reality a bleeding off of the energy delivered, or a conversion efficiency of moving one barrel of oil into transportation services. So whether we should say “The minimum EROI is 3:1” or, somewhat more accurately, that to deliver one barrel of fuel to the final consumer and to use it requires about three barrels to be extracted from the ground, with two being used indirectly, is somewhat arbitrary, although the second way is technically more correct.
5.3. Extended EROI for Corn-based Ethanol
Given that our national goal is to deliver 36 billion gallons (2.9 EJ) of ethanol, then we can work backwards to calculate that something like 111 billion gallons of ethanol (or its equivalent of fossil fuels) would be required at the farm gate to generate and deliver the original 36 billion gallons of energy service to the end user with its attendant production, transportation and infrastructure costs. That number is the original 2.9 EJ delivered as fuel, plus 1.9 EJ for the infrastructure requirement (24/36 from oil x 2.9 EJ delivered), plus 0.24 EJ for the energy used in transportation (0.05 x (2.9 + 1.9)), plus 3.9 EJ for the energy to produce the required ethanol (0.76 x 5.1). Thus an additional 75 billion gallons (or 6.1 EJ) are required to deliver 36 billion gallons at the pump, so that an EROI of at least 3:1 is required for the fuel to not be subsidized by fossil fuels. EROIs above 3:1 are rarely reported for any liquid biofuels.
Table 3.
Approximate values and percentages of costs (or losses) in delivering gasoline/diesel and corn-based ethanol to the end-user.
Table 3.
Approximate values and percentages of costs (or losses) in delivering gasoline/diesel and corn-based ethanol to the end-user.
| Gasoline/Diesel | Corn-based ethanol |
|---|
| Input Energy | Exajoules | Percent | Exajoules8 | Percent |
|---|
| Crude Oil in the Ground, Total Ethanol Required | 465 | 100 | 9.0 | 100 |
| EROImm | 10:1 | | 1.3:1 | |
| Losses | | | | |
| Non-Fuel Refinery Products1 | 7.8 | 17 | 0.0 | 0 |
| Energy used in Refining2 | 4.6 | 10 | 0.0 | 0 |
Cost of Extraction/Production
(i.e. initial energy invested) | 4.6 | 10 | 3.9 | 43 |
| Transport to Consumer3 | 1.56 | 3 | 0.24 | 2 |
| Energy Cost of Transportation Infrastructure4 | 10.9 | 24 | 1.9 | 22 |
| Total Costs | 29.4 | 64 | 6.1 | 67 |
| Final Energy Delivered to Consumer (billion gallons) | 16.5
(126) | 36 | 2.9
(36) | 32 |
| Total Costs / Total Delivered | 1.8 | | 2.1 | |
| Energy Delivered / Initial Energy Invested | 4.14 | | 0.5 | |
| Minimum EROI to Provide Transportation Service | ~3:17 | | ~3:17 | |
Thus by both economic (
Figure 1) and energetic (i.e. assuming an EROI
mm of 10:1) measures calculated here it appears that at present roughly 10 percent of our economy is required to get the energy to run the other 90 percent, or 20 percent used to get 80 percent to the point of delivery, and even a larger percentage if the use infrastructure is included. This seems to be true if numerator and denominator are in either dollars or in energy. (Note: Our use of relatively cheap coal and hydroelectricity, both with a relatively high EROI, lifts the actual ratio “at the well-head” so that the EROI
mm for
all energy delivered to society, but not the consumer, is roughly 20:1). By the time the oil energy is delivered to the consumer, 40 percent has been used and the EROI
pou has fallen to roughly 6:1 (including the entire refining, conversion and delivery chain). But it is energy services that are desired, not energy itself, and to create these energy services requires energy investments in infrastructure that carry, at a minimum, large entropic losses. If infrastructure costs are included, the EROI
ext falls to about 3:1 because two-thirds of the energy has been used; implying that more energy is being spent on extraction, refining, delivering, and maintaining the transportation infrastructure than is found in the end product. Thus by the time a fuel with an EROI
mm of 10:1 is delivered to the consumer – that is after the energy costs of refinement and blending, transport, and infrastructure are included, the EROI
ext is 3:1. This means that twice as much oil is used to deliver the service than is used in the final-demand machine, and since most of our oil is used in transportation, including trucks and tractors, it is probably at present a reasonable number for the entire oil chain in our society.
5.4. The tradeoff between EROI and total energy used in generating “civilization”
The basic goods and services that we desire and require to have what we call modern civilization is highly dependant upon the delivery of net energy to society. This is a point made again and again by the authors quoted in the introduction to this paper. But the total net energy that we have at our disposal, say roughly 90 percent of the 100 or so quads (or 105 EJ), would decrease to 80 if the cost of energy were to double (as happened in the first part of 2008), or down to 60 if it were to double again and so forth, all of which is very possible. From this perspective we think it very likely that EROI is likely to become an extremely important issue in defining our future economy and quality of life.
Finally, future analysis might even go so far as to include the money/energy to support and replace the oil worker. We believe this is important as there is little argument about the need to amortize the maintenance and depreciation of the oil derrick, so why not some pro-rated portion of medical care for the worker or education of his children for eventual replacement of the worn out worker? Economists have some serious problems with this line of reasoning because they say that e.g. medical care of workers or their children is consumption, not production. But, as with energy itself, a certain amount of consumption is essential for production and maybe we need to rethink when and how we draw the line between them. Perhaps it is best considered from the perspective of the two paragraphs above: as the EROI of fuels presumably decline into the future then the rest of us will be supporting more and more workers in the energy industry, and there will be less and less net dollars and energy delivered to the rest of society. And if we are to support all the infrastructure to train engineers, physicians and skilled laborers needed by society we would need a far higher EROI from our primary fuels. The calculation of this is beyond the scope of this paper but our guess is that we would need something like a 5:1 EROI from our main fuels to maintain anything like what we call civilization. Perhaps a future paper could undertake these difficult calculations.


