Introduction
More than 3.7 billion people are malnourished in the world today [
1]. This is the largest number and percentage of malnourished humans ever recorded. The world human population is currently at more than 6.7 billion and nearly a quarter million people are added to the population daily [
2]. Based on the current rate of increase, the world population is projected to double to approximately 13 billion in less than 60 years [
2]. By 2050, a population of 9.5 billion is projected [
2].
Reports from the Food and Agriculture Organization of the United Nations and the U.S. Department of Agriculture, as well as from numerous other international organizations, confirm the serious nature of the global food shortages [
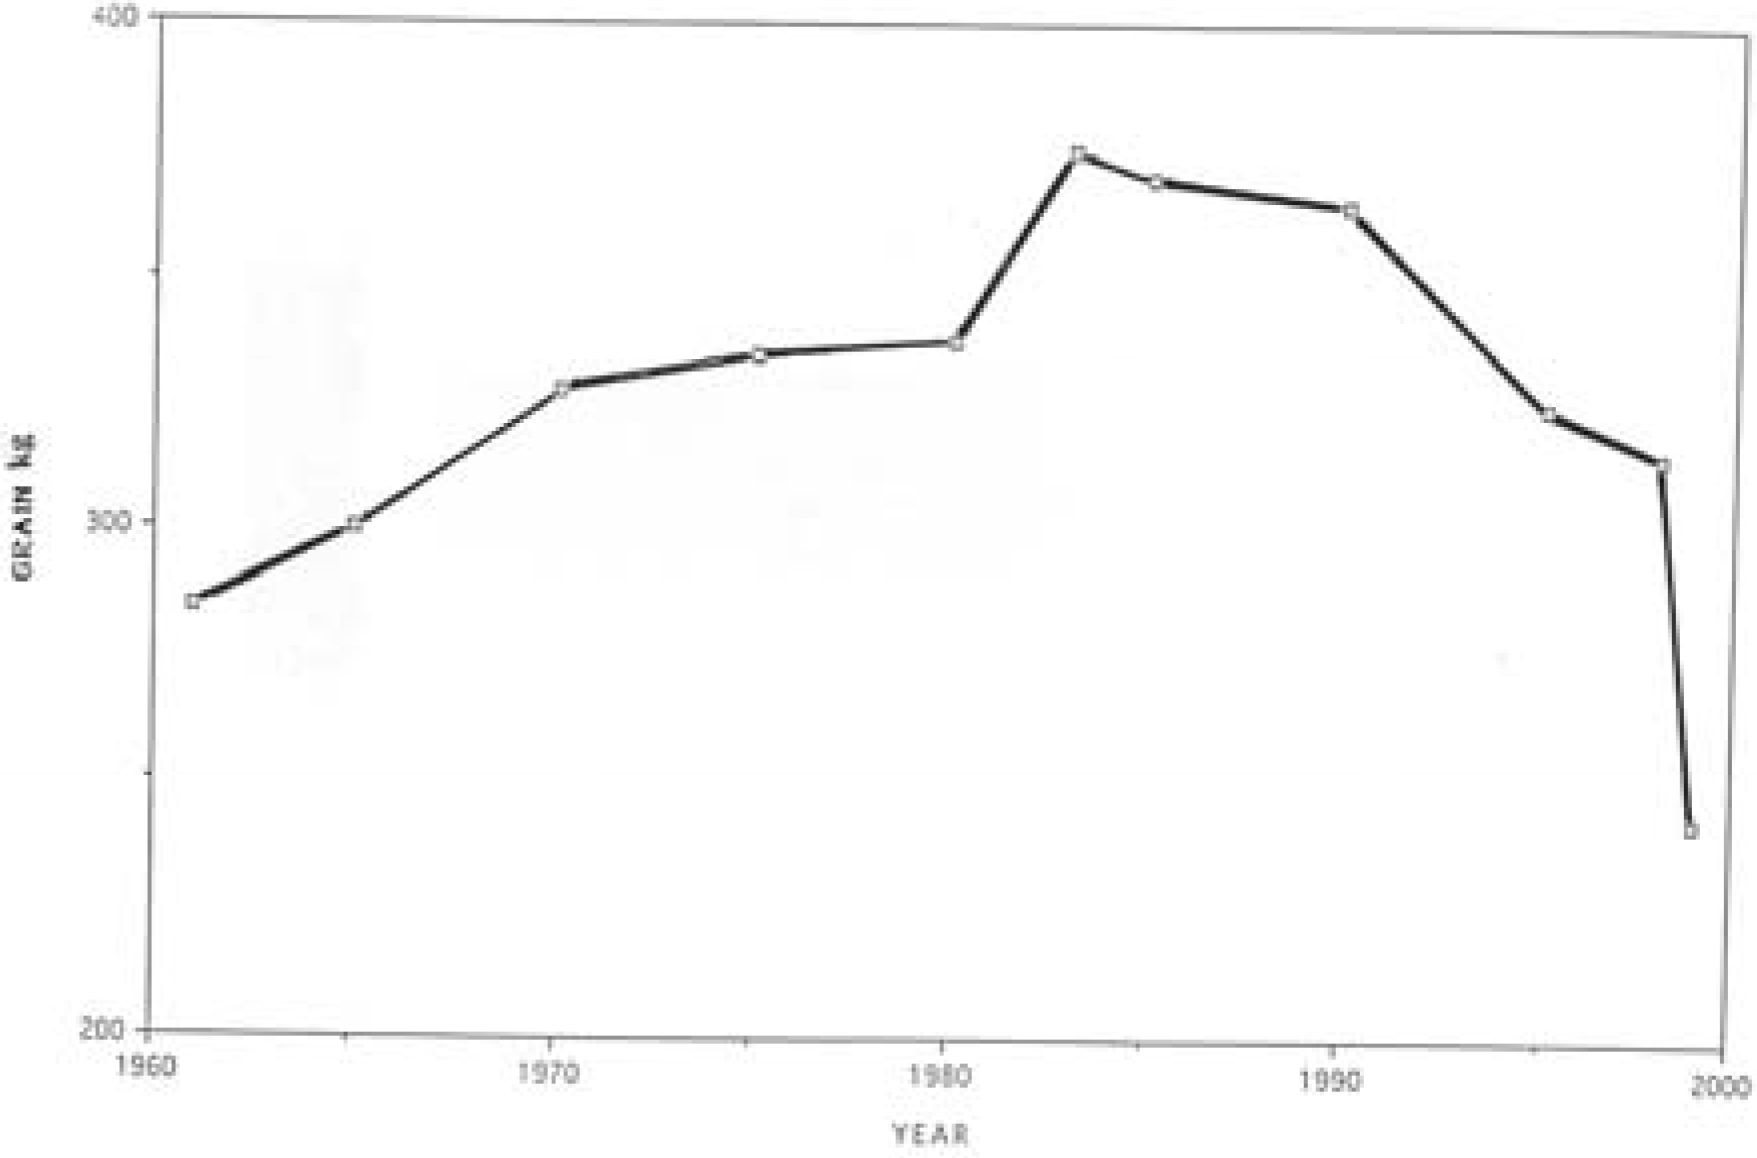
3]. For example, the
per capita availability of world cereal grains has been declining for the past 24 years (
Figure 1). Although grains make up about 80% of the world's food supply, approximately half of the world’s population cannot afford grains. For this reason, prices of grains have not increased greatly during the past decade. However, because of biofuel production, especially corn ethanol, food shortages and food prices have recently increased from 10% to 50% [
4].
Figure 1.
World per capita grain production from 1960 to 2000 [
88].
Figure 1.
World per capita grain production from 1960 to 2000 [
88].
As the world population continues to expand, greater pressure is being placed on resources essential for food production, including fossil energy. The human population grows exponentially, while food production increases arithmetically. The result is the current food deficit. The World Health Organization reports that nearly 60% of the world population is malnourished – the largest number in world history. Degradation and depletion of land, water, energy, and biological resources vital to agriculture, have continued unabated, further restricting agricultural production [
5]. Recent increases in crop yields have occurred in fossil-fuel dependent agriculture in developed countries, but intensive agricultural techniques contribute in some cases to environmental degradation, such as soil erosion [
5].
This article assesses the current use of energy in developed and developing countries in their food crop production systems, including some systems dependent on hand labor and draft animal power.
Energy Resources
People rely on various sources of energy and power. These sources range from human, animal, wind, tidal, and water energy to wood, coal, gas, oil, solar, and nuclear sources of fuel and power. Using fossil fuel resources enables a nation to feed an increasing number of humans, and improves the general quality of life in many ways, including protection from malnourishment and numerous other diseases [
6].
About 473 quads (1 quad = 10
15 BTU = 1.05 x 10
18 Joules) from fossil and renewable energy sources are used worldwide per year [
7]. The current high rate of energy expenditure is related directly to many factors, including rapid population growth, urbanization, and high resource-consumption rates. Increased energy use also contributes to environmental degradation [
5]. Energy use has been growing at a rate even faster than the rate of growth of the world population. From 1970 to 1995, energy use has been doubling every 30 years whereas the world population has been doubling every 40- 0 years [
2,
7]. In the near future, energy use is projected to double every 32 years while the population is projected to double in about 50 - 60 years [
2,
7].
About 60% of all the solar energy captured by photosynthesis and incorporated in biomass production worldwide is used by humans (Pimentel, unpublished data). This amount of energy, though very large (approximately 720 quads), is inadequate to meet human needs. To compensate for the high demand, about 413 quads of fossil energy (oil, gas, and coal) are utilized each year worldwide [
7]. Of this amount, 100.9 quads are utilized in the United States (about 19% in the food system) [
8]. The U.S. population consumes about 68% more fossil energy than all the solar energy captured by harvested U.S. crops, forest products, and all other vegetation each year (
Table 1).
Table 1.
Total amount of above ground biomass except for some crops that include underground biomass and solar energy captured each year in the United States. An estimated 32 x 10
15 BTU of sunlight reaching the U.S. per year suggests that the green plants in the U.S. are collecting 0.1% of the solar energy [
44,
45,
46,
47].
Table 1.
Total amount of above ground biomass except for some crops that include underground biomass and solar energy captured each year in the United States. An estimated 32 x 1015 BTU of sunlight reaching the U.S. per year suggests that the green plants in the U.S. are collecting 0.1% of the solar energy [44,45,46,47].
| Crops | 901 x 106 tons | 14.4 x 10¹⁵ BTU |
| Pasture | 600 x 106 tons | 9.6 x 10¹⁵ BTU |
| Forest | 527 x 106 tons | 8.4 x 10¹⁵ BTU |
| Total | 2,028 x 106 tons | 32.4 x 10¹⁵ BTU |
Industry, transportation, home heating, and food production account for most of the fossil energy consumed in the United States [
8].
Per capita use of fossil energy in the United States is 9,500 liters of oil equivalents per year, more than 12-times the
per capita use in China and some other developing countries (
Table 2) [
5]. In China, most fossil energy is used by industry, but a substantial amount, approximately 25%, is used for agricultural production, food distribution, and cooking [
9].
Table 2.
Resources used and/or available per capita per year in the U.S., China, and the world to supply basic human needs [
8].
Table 2.
Resources used and/or available per capita per year in the U.S., China, and the world to supply basic human needs [8].
| Resources | U.S. | China | World |
|---|
| Land (FAOSTAT, 2001) | | | |
| Cropland (ha) | 0.48 | 0.08 | 0.22 |
| Pasture (ha) | 0.79 | 0.33 | 0.52 |
| Forest (ha) | 0.79 | 0.11 | 0.59 |
| Total (ha) | 2.78 | 0.46 | 1.97 |
| Water (liters x 106) | 2.0 | 0.46 | 0.60 |
Fossil fuel (BP, 2005
Oil equivalents (liters) | 9,500 | 1,400 | 2,100 |
The less than two billion people who live in the world’s developed nations consume 70% of the world’s fossil energy annually, while the more than four billion people in developing nations use only 30% [
7]. The United States, with 4.5% of the world's population, consumes about 22% of the world's fossil energy output (
Table 3) [
5]. Fossil energy use in the many U.S. economic sectors has increased 10 to 20-fold in the past three to four decades, attesting to America's heavy reliance on this finite energy resource to support an affluent lifestyle [
5].
Developing nations that have high rates of population growth are increasingly using fossil fuel in agricultural production to meet increasing demand for food and fiber. In China between 1955 and 1992, there was a 100-fold increase in fossil energy use in agriculture for irrigation and for producing fertilizers and pesticides [
9].
Table 3.
Annual fossil and solar energy use in the U.S. and world (quads = 10
15 BTU) [
8].
Table 3.
Annual fossil and solar energy use in the U.S. and world (quads = 1015 BTU) [8].
| Fuel | U.S. | World |
|---|
| Petroleum | 40.1 | 168 |
| Natural gas | 23.0 | 103 |
| Coal | 22.3 | 115 |
| Nuclear | 8.2 | 28 |
| Biomass | 3.0 | 30 |
| Hydroelectric power | 3.4 | 27 |
| Geothermal and wind power | 0.4 | 0.8 |
| Biofuels | 0.5 | 0.9 |
| Total | 100.9 | 472.7 |
Yet, worldwide fertilizer production has declined more than 22% per capita during the last decade probably due to fossil fuel shortages, high prices, as well as economic transitions in Eastern Europe and developing countries [
10]. The long term projections of the availability of fossil energy resources for fertilizers and for all other purposes are discouraging because of the limited quantities of fossil fuels.
The world supply of oil and natural gas is projected to last about 40 - 60 years [
11,
12,
13,
14]. Coal is projected to last 50 to 100 years [
5,
11]. However, these estimates are based on current consumption rates and current population numbers. If all people in the world enjoyed a standard of living and consumed energy at a rate similar to that of the average American, and the world population continued to grow at a rate of 1.2%, the world's fossil fuel reserves would last only about 17 years.
If we continue to hope that new discoveries of oil will postpone when oil and natural gas disappear, this is wishful thinking. A recent report indicates that the world is consuming 27 billion barrels of oil annually. However, the rate of discovery has fallen to only seven billion barrels (W. Youngquist, Professional Geologist, Eugene, Oregon, personal communication 2000). Thus, humans are burning nearly four times as much oil as they find each year worldwide.
Youngquist [
11] reports that current oil and gas exploration drilling data have not borne out some of the earlier optimistic estimates of the amount of these resources yet to be found in the United States. Both the production rate and proven reserves continue to decline. Domestic oil and gas are imported in ever increasing amounts yearly [
8], indicating that neither is now sufficient for domestic needs and supplies. Domestic oil and natural gas production will be substantially less in 15 years than it is today. Analyses suggest that as of 2008 the United States has consumed about 90% of the recoverable oil that was ever in the ground and that we are currently consuming the last 10% of our oil [
8]. The United States is now importing more than 63% of its oil. This puts the U.S. economy at risk due to fluctuating oil prices, volatile political situations, such as the 1973 oil crisis and the current Iraq War.
By using available renewable energy technologies, such as biomass and wind power, an estimated 200 quads of renewable energy could be produced worldwide using 20% to 26% of the land area (Yao Xlang-Jun, personal communication, Cornell University, 1998) [
15]. It should be noted that 200 quads is less than half of the energy currently consumed. Producing the 200 quads of renewable energy may require transferring some important pasture and forest land to energy production. A self-sustaining renewable energy system producing 200 quads of energy per year would be insufficient for the current population of 6.7 billion people in the world at the current fossil energy consumption rate [
5]. A sustainable energy program might be possible for a sustainable population of only two billion people, but not the current 6.7 billion people in the world [
15].
Corn
The Food and Agriculture Organization [
17] and others [
18] report that corn is one of the world’s major cereal crops. Under favorable environmental conditions, corn is one of the most productive crops per unit area of land. An analysis of energy inputs and yields suggests that the high yields of intensive corn production are in part related to the large inputs of fertilizers, irrigation, and pesticides.
Investing many hours of labor, a person can produce corn using little fossil energy (
Table 4). Corn production by hand in Indonesia requires about 634 hours of labor and five hours of bullock power per hectare, an energy expenditure of 4.0 million kcal. With a corn yield of 1,200 kg/ha in Indonesia (6.9 million kcal), the energy input:output ratio is 1:1.08 (
Table 4). Note that the energy input is slightly higher than it might be if the energy for the bullock power were withdrawn. The bullocks mostly consume forage and little or no fossil energy is needed for the animals.
Table 4.
Energy inputs of corn production per hectare in India and Indonesia.
Table 4.
Energy inputs of corn production per hectare in India and Indonesia.
| Inputs | Quantity | kcal x 1000 |
|---|
| Labor | 634 hrsa | 1,170g |
| Bullock (pair) | 200 hrsh | 1,300b |
| Machinery | 10 kgc | 185d |
| Nitrogen | 71 kgf | 1,200e |
| Phosphorus | 36 kgf | 145e |
| Manure | 600 kga | 961b |
| Seeds | 33.6 kgf | 121d |
| TOTAL | | 5,082 |
| Corn yield = 1,721 kga | | 6,200d |
| | | Kcal input: output = 1:1.08 |
The energetics of mechanized corn production are distinctly different from those of labor-intensive food-crop production. Corn production in the United States today is typical of intensive crop production technology. The total input of human power is only 11.4 hrs per hectare compared with 634 hrs in the labor-intensive system in India and Indonesia discussed previously (
Table 4 and
Table 5). In the U.S. system, approximately 25% of the total energy is consumed in labor-reducing mechanization (
Table 5).
Table 5.
Energy inputs and costs of corn production per hectare in the United States.
Table 5.
Energy inputs and costs of corn production per hectare in the United States.
| Inputs | Quantity | kcal x 1000 | Costs $ |
|---|
| Labor | 11.4 hrsa | 462b | 148.20c |
| Machinery | 55 kgd | 1,018e | 103.21f |
| Diesel | 40 Li | 405j | 20.80g |
| Nitrogen | 155 kga | 2,480k | 85.25l |
| Phosphorus | 79 kga | 328m | 48.98n |
| Potassium | 84 kga | 274o | 26.04p |
| Lime | 1,120 kgq | 315r | 19.80 |
| Seeds | 21 kgd | 520d | 74.81s |
| Irrigation | 8.1 cmt | 320u | 123.00v |
| Herbicides | 6.2 kgw | 620z | 124.00 |
| Insecticides | 2.8 kgx | 280z | 56.00 |
| Electricity | 13.2 kWhy | 34aa | 0.92 |
| Transport | 204 kgbb | 169cc | 61.20 |
| TOTAL | | 8,228 | $926.97 |
| | | | |
| Corn yield 9,400 kg/hadd | | 33,840 | Kcal input: output 1:4.11 |
In the U.S. system, the total fossil fuel input is estimated to be 8.2 million kcal/ha (
Table 5). The corn yield is also high, about 9,400 kg/ha, or the equivalent of 34 million kcal/ha of food energy. This results in an input:output ratio of 1:4.11.
The fossil energy inputs into U.S. corn production are primarily from oil for machinery and natural gas for fertilizers. Nitrogen fertilizer, which requires natural gas for production, represents the largest single input, about 30% of the total fossil energy inputs (
Table 5).
While corn yields are higher in the intensive system than for hand-produced corn, the economic investment is $927/ha, compared with less than $100 per hectare in the hand-produced system (
Table 5).
Wheat
Wheat and rice are the two most important cereal crops grown in the world today, and more humans eat wheat than any other cereal grain. Wheat is produced employing diverse techniques with energy sources ranging from human labor, to animal power to mechanization. As with corn production, energy inputs and yields vary with each wheat production system.
For example, wheat farmers in Kenya use human power (
Table 6). Total energy input in this system is about 1.9 million kcal which provides a harvest of about 6.4 million kcal in wheat (
Table 6), for an energy input:output ratio of about 1:3.31.
Table 6.
Energy inputs of wheat production per hectare in Kenya.
Table 6.
Energy inputs of wheat production per hectare in Kenya.
| Inputs | Quantity | kcal x 1000 |
|---|
| Labor | 684 hrsb,e | 165d |
| Machinery | 10 kgg | 185c |
| Diesel | 35 Lg | 350c |
| Nitrogen | 22 kgb | 352a |
| Phosphorus | 58 kgb | 234a |
| Seeds | 202 kgb | 606c |
| Transportation | 200 kgb | 51c |
| TOTAL | | 1,943 |
| Wheat yield = 1,788 kge | | 6,437
kcal input: output = 1:3.31 |
Wheat production in the United States requires more than twice the fossil energy inputs as the low input Kenyan production system (4.2 million kcal) (
Table 6 and
Table 7). Large machinery powered by fossil fuels replaces the animal power and dramatically reduces the labor input from 684 hrs for Kenya to only 7.8 hrs for the U.S. system (
Table 6 and
Table 7). The heavy use of fertilizers and other inputs increased wheat yields to 2,990 kg/ha (
Table 7). The input: output ratio in the U.S. for wheat production, approximately 1: 2.57, is lower than that in Kenya.
Table 7.
Energy inputs of wheat production per hectare in the United States.
Table 7.
Energy inputs of wheat production per hectare in the United States.
| Inputs | Quantity | kcal x 1000 |
|---|
| Labor | 7.8 hrsa | 312d |
| Machinery | 50 kge | 925e |
| Diesel | 100 Lb | 1,000e |
| Nitrogen | 68.4 kgc | 1,094e |
| Phosphorus | 33.7 kgc | 143e |
| Potassium | 2.1 kgc | 6f |
| Seeds | 60 kga | 218f |
| Herbicides | 4 kga | 400g |
| Insecticides | 0.5 kga | 5g |
| Electricity | 14 kWha | 12e |
| Transport | 198 kga | 67e |
| TOTAL | | 4,182 |
| Wheat yield 2,900 kg/ha | | 10,765
kcal input: output 1:2.57 |
Rice
Rice is the staple food for an estimated 3 billion people, who live primarily in developing countries. This heavy consumption makes an analysis of various rice production technologies particularly relevant.
Table 8.
Energy inputs of draft animal-produced rice per hectare in the Valley of Garhwal Himalaya, India.
Table 8.
Energy inputs of draft animal-produced rice per hectare in the Valley of Garhwal Himalaya, India.
| Inputs | Quantity | kcal x 1000 |
|---|
| Labor | 1,703 hrsa | 2,380c |
| Bullocks | 328 hrsa | 357a |
| Machinery | 2.5 kgb | 5f |
| Nitrogen | 12.3 kga | 197d |
| Phosphorus | 2.5 kga | 113d |
| Manure | 3,056 kga | 5,071a |
| Seeds | 44 kga | 160a |
| Pesticides | 0.3 kga | 30d |
| TOTAL | | 8,313 |
| Rice yield = 1,831 kga | | 6,591b
kcal input: output = 1: 0.79 |
The rice production system practiced by Indian farmers using human labor and bullocks requiring 1,703 hrs of human labor and 328 hrs of bullock labor (
Table 8). Energy inputs in this rice system total about 6.6 million kcal. The total rice yield is 1,831 kg/ha (6.6 million kcal), resulting in an energy input:output ratio of about 1: 0.79 (
Table 8). This energy ratio could be much higher if the energy for the bullocks were removed from the assessment. This would be a reasonable adjustment, if the bullocks do not depend on fossil energy, but feed on forage and little or no grain.
As in the production of other grains, the United States uses large inputs of fossil energy to produce rice (
Table 9). The average yield is 7,616 kg/ha (27 million kcal of food energy). The fossil energy investment is about 19.3 million kcal, resulting in an energy input:output ratio of 1: 1.42 (
Table 9). Most of the energy is used for machinery and fuel to replace labor, however, fertilizers account for about 13% of the total fossil energy input. The human labor input of only 11 hrs/ha is much lower than in India, but still is relatively high compared with U.S. wheat production.
Table 9.
Energy inputs of rice production per hectare in the United States.
Table 9.
Energy inputs of rice production per hectare in the United States.
| Inputs | Quantity | kcal x 1000 |
|---|
| Labor | 11 hrsa | 462 |
| Machinery | 38 kgb | 703 |
| Diesel | 373 La | 3,730 |
| Nitrogen | 161 kga | 2,576 |
| Phosphorus | 35 kga | 156 |
| Potassium | 26 kga | 94 |
| Seeds | 141 kga | 560 |
| Irrigation | 250 cmb | 9,877 |
| Herbicides | 2.8 kga | 280 |
| Insecticides | 0.1 kga | 10 |
| Electricity | 282 kWha | 728 |
| Transport | 450 kga | 150 |
| TOTAL | | 19,346 |
| Rice yield 7,616 kg/hac | | 27,418
kcal input: output 1:1.42 |
Potato
The white potato is one of the 15 most heavily consumed plant foods in the world today. Even in the United States, where a wide variety of vegetables is available, more potatoes are eaten than any other vegetable – about 22 kg of potato per person per year [
19]. Potatoes contain protein (1.5 to 2.5%), are high in vitamin C and potassium, and offer a good source of carbohydrates.
In a high intensity potato production system, production per hectare is several times greater than that of other carbohydrate producing crops. More importantly, protein production per hectare is 2 to 3 times greater than for other crops.
Based on data from the United States, the largest inputs are for machinery and fuel (
Table 11). The third largest input is for fertilizers. The total energy inputs are about 15.0 million kcal/ha and the potato yield is nearly 44,000 kg/ha (25.2 million kcal of food energy) (
Table 11). The resulting input: output ratio is 1: 2.76. The high water content of potatoes (80%) makes transport relatively energy costly.
Table 11.
Energy inputs in potato production per hectare in the U.S.
Table 11.
Energy inputs in potato production per hectare in the U.S.
| Inputs | Quantity | kcal x 1000 |
|---|
| Labor | 35 hrsa | 1,600c |
| Machinery | 50 kgb | 925e |
| Diesel | 350 Lb | 3,990f |
| Nitrogen | 319 kgb | 5,104g |
| Phosphorus | 241 kgb | 1,085h |
| Potassium | 196 kgb | 627i |
| Sulfur | 95 kgb | 572e |
| Seeds | 24 kgb | 30e |
| Herbicides | 6.7 kgb | 670e |
| Insecticides | 9.0 kgb | 900e |
| Fungicides | 10 kgb | 10,000e |
| Electricity | 47 kWhd | 40j |
| Transport | 2,000 kgk | 94l |
| TOTAL | | 14,817 |
| Potato yield 44,000 kg/ham | | 25,168
kcal input: output 1: 2.76 |
Apples
Apples are an economically valuable crop in the United States costing about $7,700 per hectare to produce [
19]. In the United States, petroleum products are used to operate machinery in apple orchards. The inputs for this machinery account for a large percentage of the total energy input (
Table 15). Pesticides contribute nearly 60% of the total energy input in apple production.
The labor input of 400 hrs/ha expended in apple production is high compared with that of most other food crops grown in the United States. Most of the labor input occurs during harvesting. The total labor input is about 20.0 million kcal/ha. The total apple yield is 54,000 kg/ha, providing 30.3 million kcal of food energy. The input:output ratio is 1: 0.18.
Table 15.
Energy inputs of apple production per hectare in the United States.
Table 15.
Energy inputs of apple production per hectare in the United States.
| Inputs | Quantity | kcal x 1000 |
|---|
| Labor | 400 hrsa | 20,000b |
| Machinery | 88 kga | 1,029c |
| Diesel | 2,000 Ld | 40,000c |
| Nitrogen | 50 kge | 800d |
| Phosphorus | 114 kga | 627f |
| Potassium | 114 kga | 231g |
| Lime | 682 kga | 1,438h |
| Herbicides | 6 kgi | 6c |
| Insecticides | 47 kgi | 47,000c |
| Fungicides | 49 kga | 49,000c |
| Electricity | 40 kWhi | 129j |
| Transport | 3,000 kgk | 102l |
| TOTAL | | 166,356 |
| Apple yield 54,000 kg/hae | | 30,294
kcal input: output 1:0.18 |
Apple production in the United States is more energy intensive than orange production (
Table 14 and
Table 15). From the standpoint of vitamin C content, oranges have about 50 milligrams (mg) per 100 g. However, apples contain only 3 mg per 100 g of vitamin C. Thus, vitamin C is produced more efficiently with oranges compared with apples.
Changes in Crop Yields
The 20 to 50-fold increase in fertilizers, pesticides, and irrigation (all fossil energy dependent) increased U.S. cereal crop yields per hectare between 3 and 4 times between 1950 and 1980 [
23,
24]. For example, fertilizer use on corn increased from about 5 kg/ha in 1945 to about 150 kg/ha (30 times), while corn yields increased by about 4 times [
5]. The increase in yields during the 30-year period from 1950 to 1980 was about 3% per year. Since 1980, however, cereal crop yield increases have declined to only about 1% per year [
19,
25]. Crops have limits to the amounts of fertilizers and pesticides that they can use and tolerate. In fact, nitrogen fertilizer application rates of approximately 500 kg/ha or more are toxic to the crop and cause yields to decline [
26].
Measured in terms of cereals produced per capita worldwide, food crop production has declined since 1984 (
Figure 1). Shortages of resources, such as cropland, freshwater, and fertilizers, have contributed to slowing food production, including cereal grain production, and consequently the availability of food per capita [
5]. Cereals are an extremely important food source because they provide 80% of the world’s food. There are several factors that account for the reported decline in food available per capita. As the world population increases at an exponential rate of 1.2% [
27], the non-exponential rate of food production increase is only about 1% [
28]. In 75 countries, less grain was produced at the end of the 1980’s than at the beginning [
29]. It is apparent that the food supply cannot keep up with the increase in the world population (currently at 6.7 billion).
If the world population increases to 7.8 billion in about 10 years, yields will have to be increased by 33% just to maintain the current inadequate food supply levels [
30]. For the entire world to enjoy a European level of food consumption, yields would have to increase by an additional 70%. These calculations are based on no increase in cropland area for cereal crops. If the increased yields were equally a result of both increased cropland and yield, average yields would have to increase from 2.5 t/ha and reach a level of 4.3 t/ha. This kind of increase almost certainly requires an intensification of farming practices and heavy reliance on fossil energy [
30]. Improved distribution of food in the world would help the poor.
Per capita use of fertilizers worldwide during the past decade declined 22% [
31,
32], while available cropland resources per capita decreased more than 20% [
5]. A total of 560 million ha of the 1,500 million ha of cropland worldwide are seriously degraded [
30]. Irrigated land area in developing countries declined about 10% over the past decade [
21]. A total of 20% of the irrigated croplands worldwide suffer from salinization – a result of poor irrigation and drainage practices [
30]. Although cereal yields per hectare are slowly increasing, by about 1% per year, human numbers and demand are increasing at a greater rate than food production [
5].
As mentioned, the major factor reducing per capita cereal production is the rapid rate of increase in the world population [
27]. The end result of the reduced rate of increase in crop yields and increasing human numbers is malnutrition. Earlier we indicated that the World Health Organization reports that more than 3.7 billion people are malnourished and the numbers continue to increase [
1]. Regions of the world where population growth is highest are also regions where per capita food production is lowest.
Role of Fossil Energy in Crop Production
The total amount of fossil energy consumed in the world is about 473 quads (
Table 3) [
7]. Approximately 70% are used in developed countries and 30% are used in developing countries [
33]. The population in developed countries is less than 2 billion while more than 4 billion live in developing countries [
27].
Approximately 40 quads of fossil energy are consumed to supply food for people in developed countries, however, only about 16 quads of this are used for agricultural production. The 16 quads represent both crop and livestock production [
5]. The remaining 24 quads in developed countries are used for food processing, packaging, distribution, and preparation. In developing countries, approximately 16 quads are consumed in agricultural production. Most of the cooking in developing countries is carried out using biomass energy (fuelwood, crop residues, and dung) [
5]. From 2 to 3 kcal of biomass energy are used to prepare 1 kcal of food in developing countries [
5,
34]. Therefore, total energy in the food system in developing countries is between 48 and 75 quads per year.
Crop production in both developed and developing countries requires from 2 to 166 million kcal/ha (See tables). In developed countries, the fossil energy inputs for machinery to reduce the labor input are high, whereas in the developing countries the fossil energy inputs for labor are high (See tables). Note that fossil energy inputs for labor are listed in terms of an average per capita fossil fuel consumption. Most of the fossil energy used in food crop production in both developed and developing countries is in the form of oil and natural gas. Oil is essential for farm machinery and natural gas is vital for the production of nitrogen fertilizers.
The total energy in the food system in developed countries is approximately 4 kcal invested to supply 1 kcal of food, while in developing countries the ratio is approximately 1 kcal invested to supply 1 kcal of food [
5]. In developed countries people utilize an average of 3,500 kcal of food per person per day, whereas people in developing countries use 2,400 kcal of food per day per person [
35]. This 1,100 fewer kcal utilized per person per day in developing countries reflects many young people in developing countries receiving fewer calories per day.
Renewable Energy and Future Agricultural Production
The United States is currently consuming more than 100 quads (22%) of world’s 473 quads of fossil energy (
Table 3) [
8]. Using a mix of renewable energy technologies, the land required to locate these technologies is estimated to be more than 0.5 ha per capita to match half of the current fossil energy consumption in the United States [
36]. With a current U.S. population of 330 million, this would mean that about the same amount of land area would have to be devoted to energy production as is currently devoted to crop production.
The land area required for the production of renewable energy varies considerably. For example, to produce 10,000 kWh of electricity per capita in the United States using biomass from a sustainable forest would require 2.2 ha per person per year of forest per year [
36]. However, the same amount of electricity can be produced employing photovoltaic technologies using 0.3 ha per person per year. Producing a kWh of electricity using current photovoltaic technology is about 4 times more expensive (25¢/kWh) than producing a kWh from a sustainable forest [
36].
Liquid fuel needs for tractors and other farm machinery land types might be met using hydrogen or pyrolytic oil produced from wood [
37]. Nitrogen can be produced using electrical discharge to convert atmospheric nitrogen to nitrate. However, about 47,840 kcal of energy are required to produce a kilogram of nitrogen by this method, compared to only 16,000 kcal required using fossil energy dependent technologies. Using current renewable energy technologies, a quantity of energy produced using renewable technologies costs from 5 to 10 times more than an equivalent quantity from fossil energy sources.
Science and Technology
Over time science and technology have been instrumental in increasing industrial and agricultural production, improving transportation and communications, advancing human health care and in general improving many aspects of human life. However, much of this success is based on the availability of natural resources of the earth and in particular, cheap energy.
In no area is this more evident than in agricultural production. No known or future technology could, for example, double the quantity of world's cropland available nor increase the amount of fresh water for production. Granted, synthetically produced fertilizers are effective in enhancing the fertility of eroded croplands, but their production relies on the diminishing supply of fossil fuels. And in countries like the United States and China, there will be rapidly diminishing returns with the further application of fertilizers.
The increase in the size and speed of fishing vessels has not resulted in increases in fish catch [
5]. For example, in eastern Canada, over fishing became so severe that about 80,000 fisherman have no fish to catch, and the entire industry has collapsed [
5].
Consider also that as the population increases, fresh water must be shared by more individuals as well as with the growing agriculture industry [
21]. No available technology can double the flow of the Colorado River. Shrinking ground water resources in vast aquifers cannot be refilled by human technology. Only rainfall can replenish fresh water supplies.
Improved technologies, including the more effective management and use of resources, will increase food production. If technology alone were the answer, where is this technology and why has it not been employed, now that cereal grain production per capita continues to decline, as it has for the past 24 years, and as cropland continues to be lost to soil erosion [
5]? Technology cannot produce an unlimited flow of the vital natural resources that are the raw material for sustained food production.
Biotechnology can potentially result in agricultural advances, provided that its genetic transfer ability is wisely used. For example, the genetic modification of some crops, such as rice, to have high levels of iron and beta carotene would improve the nutrition of millions of people in the future, particularly in developing countries [
38]. In addition, the possibility exists in the future for biological nitrogen fixation to be incorporated in crops, such as corn and wheat. However, biotechnology that started more than 25 years ago has not stemmed the decline in per capita food production, including grain production, during the past 24 years. Currently, more than 40% of the research effort in biotechnology is devoted to the development of herbicide resistance in crops [
39]. This herbicide-tolerance technology does not increase crop yields, but rather generally increases the use of chemical herbicides and the pollution of the environment. Indeed, this “labor saving technology” could result in increasing labor and decreasing crop yields in the future as weed species acquire additional herbicide resistance [
40]. A potential threat to the world food supply and to cereal grains in particular, is that more people in the world are consuming more meat, milk, and eggs than previously. Moderate amounts of meat, milk, and eggs in the diet of the world’s poor would help curb malnutrition. Balance must be achieved and livestock numbers must grow at a rate that does not threaten the human grain supply. The objective should be to maintain the benefits of livestock to small farmers in developing countries because of their value in providing milk, meat, and draft animal power [
41]. However, if the demand for meat, milk, and eggs is met through an increase in grain-fed livestock, then the effective demand per capita for grain will increase even faster because livestock production is less efficient than crop production. For instance, to produce 1 kg of beef requires on average 13 kg of grain and 30 kg of forage. The fossil energy input per 1 kcal of beef protein is 40 kcal, however, the fossil energy input per 1 kcal of plant protein is only 8 kcal [
42].
Conclusions
As detailed by the Population Reference Bureau [
2], maintenance of the present rate of population growth will produce a doubling of global population from more than 6.7 billion today to 13 billion in approximately 60 years. Increasing population pressure on natural resources continues to amplify cropland, water, energy, and biological resource degradation. Currently, even with a seemingly adequate supply of fossil fuels, nearly 4 billion people are malnourished. If the population continues to increase as projected and the supply of fossil fuels decline, and distribution problems continue, the prospect for increasing agricultural production to supply sufficient food to the growing population is not encouraging. Improvement in food distribution would help, but more food is desperately needed.
Population growth met crop yield growth in the mid-1980’s, but cereal-grain food produced per capita worldwide is now declining worldwide. The developed world, including the United States, witnessed remarkable crop productivity increases from 1950’s through the 1980’s. These increases were the result of the adoption of intensive agricultural practices that rely primarily on fossil fuel dependent inputs such as fertilizers, pesticides, and irrigation. In some countries, the use of fossil energy has increased more than 100-fold as compared to use in the early 1950’s. Many developing countries are utilizing some fertilizers, pesticides, and irrigation, but in most of these countries the use of large machinery is limited and the labor displacing effects are socially intolerable.
The availability of fossil fuel, productive cropland, fresh water, and fertilizer resources is also critical to food production. At a time when food production and distribution need to increase dramatically to meet the needs of a rapidly expanding population, resources essential to agricultural production are being depleted and degraded. Currently, the developed world, with less than 2 billion people, utilizes 70% of the world’s fossil energy, while the developing world, with more than 4 billion people, uses only 30%. Worldwide, cropland per capita declined 20% during the past decade. During this same period, more than 100 million hectares of cropland were degraded and lost to wind and water erosion. Land degradation, especially erosion, is intensifying worldwide, especially in developing countries where the rural poor remove crop residues for cooking fuel and expand agricultural production onto marginal lands not suited for cultivation. In arid regions, farmers must use irrigation water. However, available irrigated cropland per capita has declined about 10% during the past decade due to the effects of population growth, salinization, waterlogging, and depletion of ground water resources [
43]. In addition, on the 1.5 billion hectares of cropland worldwide [
30], fertilizer use per capita has declined 22% during the past decade [
32].
Scientists suggest that as fossil energy availability per capita declines during the next 50 years, renewable energy sources will increasingly become an available option to replace the gradually declining fossil fuels (Personal communication with Andrew Ferguson, Optimum Population Trust, UK, 2008). Although significant technological advances will be made, the economic costs of renewable energy technologies will be significantly higher than fossil fuel technologies and will require land and water resources for energy production.
Science and technology have been instrumental in increasing agricultural production in the past decades and we expect that science will help improve crop and livestock production in the future. However, much of this success in productivity is based on the availability of natural resources of the earth.
If current trends in human population growth and fossil fuel consumption continue into the future, projections for tomorrow’s nutritional needs are not encouraging. Yet, if humans heed warning signs of the present and take steps to address these issues, then the future holds promise of adequate food for all [
15]. Achieving such an adequate food supply requires worldwide cooperation and dedication. Only with a worldwide commitment to improve economic and environmental policies, increase political stability, and stabilize the world population will we achieve an agricultural system that will both sustain a healthy human population and maintain the vital ecological integrity of the earth.

