
Improved Error-Based Ensemble Learning Model for Compressor Performance Parameter Prediction


1
School of Optoelectronic Engineering and Instrumentation Science, Dalian University of Technology, Dalian116024, China
2
Design Institute, Shengu Group, Shenyang 110023, China
3
Beijing Pipe Co., Ltd., PipeChina Group, Beijing 100020, China
*
Author to whom correspondence should be addressed.
Energies 2024, 17(9), 2113; https://doi.org/10.3390/en17092113
Submission received: 28 March 2024
/
Revised: 22 April 2024
/
Accepted: 25 April 2024
/
Published: 28 April 2024
(This article belongs to the Section F5: Artificial Intelligence and Smart Energy)
Abstract
:Large compressors have complex structures and constantly changing operating conditions. It is challenging to build physical models of compressors to analyse their performance parameters. An improved error-based stacked ensemble learning prediction model is proposed in this work. This model simplifies the modelling steps in a data-driven manner and obtains accurate prediction results. An enhanced integrated model employs K-fold cross-validation to assign dataset weights based on validation set errors, achieving a 12.4% reduction in average output error. Additionally, the output error of the meta-model undergoes a Box–Cox transformation for error compensation, decreasing the average output error by 14.0%. The Stacking model, combining the above improvements, notably reduces the root-mean-square errors for power, surge, and blocking boundaries by 24.2%, 20.6%, and 23.3%, respectively. This integration significantly boosts prediction accuracy.
1. Introduction
Natural gas is widely used by countries worldwide because of its large storage capacity, high utilisation rate, high economic efficiency, and clean and non-polluting characteristics [1]. In the natural gas industry, the choice of transport method plays a crucial role in ensuring energy security. Pipeline transmission is the best choice among natural gas transport methods [2]. It has significant advantages in technology, economy, and safety. It can also meet the needs of large-scale and long-distance natural gas transport. The centrifugal compressor used in long-distance gas pipelines provides pressurisation, which plays a pivotal role throughout the gas transmission system. Its performance is not only directly related to the safety of the gas transmission system, but also has a far-reaching impact on the economic benefits.
However, mainline natural gas pipeline compressor unit utilisation efficiency is low. When it is difficult to analyse the safety boundaries and operating points of the compressor, the number of units that can be operated relies on manual experience. They are usually configured according to maximum transmission conditions. The unit needs to be constantly commissioned if it is not possible to quickly determine the number of units switched on, and the extra electricity used to operate a large number of compressors will be wasted. To achieve the reasonable configuration of the compressor unit, it is necessary to accurately predict the performance parameters of the compressor [3].
The methods used for predicting compressor performance parameters are mainly mechanism modelling and data-driven approaches. Early compressor performance analysis is mainly based on mechanistic modelling. The flow loss model is established using manual calculations to determine the performance of the compressors [4]. However, the accuracy of this model is low and it requires a large number of manual calculations.
With advances in computer technology, Computational Fluid Dynamics (CFD) has opened up new possibilities for analysing compressor performance parameters. The technique is capable of modelling the complex flow field inside a centrifugal compressor. Three-dimensional CFD analysis was applied by Wang with the aim of investigating the flow inside a centrifugal compressor [5], and the effect of different gas models on the predicted results of the CFD was verified.
It is difficult for CFD techniques to accurately model unsteady and turbulent flow mechanisms, although they can analyse compressor performance to some extent. However, the accuracy of the simulation is insufficient and the convergence effect is poor. The machine learning modelling technique adopts a data-driven approach, which removes the complex physical model and improves the efficiency and accuracy of prediction. An increasing number of scholars have analysed the performance of compressors by means of machine learning modelling. Various regression models and artificial neural networks (ANNs) were used by Pau to predict the performance of centrifugal compressors. In particular, the accuracy and efficiency of Gaussian Process Regression (GPR) and artificial neural networks to model pressure ratios for a given mass flow rate and the speed of a centrifugal compressor were investigated. The results show that both GPR and ANN can predict compressor performance well [6]. A hybrid modelling approach combining loss models with radial basis function neural networks was proposed by Chu. Compared with the traditional mechanism model, the prediction accuracy of the hybrid model is improved [7].
The above methods use a single model, which does not take advantage of the strengths of different models and makes it difficult to improve accuracy. A Stacking integrated learning approach is used to solve these problems. Multiple models are integrated to better utilise the advantages of different algorithms and compensate for the deficiencies of a single model. Shi combined strong learning algorithms such as support vector machines and long- and short-term memory networks, which complement each other’s differences and diversities to improve prediction accuracy [8]. However, the researchers only focused on improving the accuracy of predictive models to enhance predictive performance, and ignored useful information in the prediction error of the model, which makes it difficult for existing research to further improve the accuracy of predictions. In addition, the first layer of the traditional Stacking model processes the predictions of the test set by direct averaging [9]. This results in some of the superiority of the base model being masked and the shortcomings being magnified.
To solve the above problems, this work proposes an improved error-based ensemble learning model for compressor performance parameter prediction. The weights are calculated based on the error between the predicted and actual values of the validation set on each fold. The different predictions of the base model on the test set are then weighted.
2. Methods
2.1. Stacking Integration Algorithm
Integration learning can be classified into heterogeneous integration and homogeneous integration based on the type of learner. Homogeneous integration has a single type of learner, i.e., a combination of homogeneous learners, which can improve the accuracy of prediction to some extent, but the robustness is relatively poor. The base learner model for heterogeneous integration can be of different types. It can improve the prediction accuracy and robustness at the same time, such as the Stacking model. The error-based improvement method proposed in this work is based on the Stacking Integration Algorithm. Stacking an integrated learning method, also known as Stacked Generalization, is another major integrated algorithm besides Bagging and Boosting [10]. Unlike the other two methods, Stacking is a typical representative of heterogeneous integration [11]. The general Stacking algorithm consists of two layers. The first layer is composed of several different algorithms, which are also called base learners, and the second layer usually contains only one algorithm, which is also called a meta-learner [12].
After the base model is determined, the construction of the integrated model begins. Due to the need to establish multiple models during training, creating models based on the original training set can easily lead to overfitting [13]. Therefore, the Stacking method usually adopts the K-fold cross-validation method when training data. The model training follows the following process [14], as shown in Figure 1:
- (1)
- Divide the original dataset into training and testing sets. Then, divide the training set equally into k subsets, select the union of k-1 subsets as the training set, and select the remaining 1 subset as the validation set.
- (2)
- Train and validate the learner using this k set of training and validation sets for each base model. Combine the predicted results with the true labels to form a new training set, which is then used to train the second-layer meta-learner.
2.2. Improved Stacking Model
2.2.1. Error-Based Weight Allocation Method
The traditional Stacking algorithm aggregates the outputs of multiple base models in an average manner as the training set for the meta-learner. This traditional method ignores the differences in the base model [15]. The performance of each base learner varies, and the output results of the base learners with smaller errors provide positive help for the training of the meta-learners. Therefore, it is necessary to assign weights to the outputs of the base learners according to their errors to fully utilise the performance of different learners. During the training process of the base model, the outputs of each fold of the validation set of the K-fold cross-validation are transferred to the meta-model as training data. Therefore, the error between the validation set and the actual value needs to be considered. This work proposes a weight allocation method based on test set error.
Each test set for training a basic model using the k-fold cross-validation method has a prediction percentage error . The prediction percentage error for each basic model is computed from Equation (1):
The first step in the process of solving for is to determine the multiples of the error of all base models and the error with each base model. Then, the ratio of each multiplier to the total multiplier is calculated. The calculation follows Equation (2), where is the number of base models. Error-based weight assignment methods can take advantage of the performance of different models to pass smaller error information into the meta-model.
2.2.2. Error Correction Method Based on Box–Cox Transformation
Box–Cox transform processing improves the normality and predictability of the training set [16] and can effectively improve the homoscedasticity, normality, and additivity of observations [17]. The error between the predicted value and the actual value is calculated for the improved stacked model of compressor performance parameters. The error is processed using Box–Cox transformation as the output data of the training set of the error compensation model. The input value is the data corresponding to the predicted compressor performance parameters. The RBF model is used to determine the changing rules of the compressor performance parameter prediction errors, which helps to identify beneficial regulations to improve the model effect and prediction accuracy. The prediction error of the compressor performance parameters is shown in Equation (3):
In the equation, represents the compressor performance parameter prediction error, and represents the compressor performance parameter prediction value. Parameter represents the actual value of the compressor performance parameter.
The output value of the improved Stacking prediction model is shown in Equation (4):
In the equation, represents the output value of the compressor performance parameters and represents the predicted value of the compressor performance parameters. Parameter represents the error compensation value.
The general form of the Box–Cox transformation [18] is shown in Equation (5):
In the equation, is the transformation parameter, and is the original dependent variable. The value is the new variable. The parameters are calculated using maximum likelihood estimation to construct the likelihood function , as shown in Equation (6) below:
Here, n is the number of samples, and is the great likelihood estimate of the variance.
2.3. Base Model of the Stacking Model
2.3.1. Encoder–Decoder Model for Hierarchical Input
To achieve the prediction of compressor performance parameters, this work designed a compressor performance parameter model with hierarchical input, as shown in Figure 2. The model consists of two main modules: an encoder and a decoder. The encoder divides the input into two parts. One part represents the dependent variable strongly correlated with the output, while the other part represents the dependent variable weakly correlated with the output. Different encoder models are used for features with different characteristics. This achieves a hierarchical feature extraction of variables. As can be seen in Figure 2, the improved encoder model has a large reduction in connection weights, simplifying the network structure. The computational complexity of model training is reduced due to the reduction in the number of training parameters. The outputs of the two parts of the encoder are then merged into the decoder to obtain accurate prediction results.
2.3.2. RBF Neural Network Model
The RBF neural network is a three-layer neural network, including the input, hidden, and output layers [19]. The transformation from the input space to the hidden layer space is non-linear, and the transformation from the hidden layer space to the output layer space is linear. The RBF method is used to select k-basis functions. Each basis function corresponds to training data; the form of each basis function is . Since the distance is radially homogeneous, it is called a radial basis function. represents the module of the difference vector or the two norms [20]. The interpolation function based on the radial basis function is outlined in Equation (7):
2.4. Establishment of Compressor Performance Parameter Prediction Model
The establishment process of the integrated prediction model of compressor performance parameters based on error improvement is as follows (a flowchart is shown in Figure 3):
- (1)
- The raw compressor data obtained are processed to eliminate outliers, and the cleaned data are used for feature correlation analysis. The input and output parameters of the predictive model are determined based on the results of the analyses. The cleaned data are divided into training and testing sets according to a specific ratio.
- (2)
- Based on the selected feature parameters, a base model for compressor performance parameter prediction is established in the first layer. Parameter optimisation is performed for each model to ensure prediction accuracy.
- (3)
- The selected base learners are trained via cross-validation. The training error of each base learner is calculated and the weight of the base learner is determined.
- (4)
- The second-layer meta-learner is trained using the prediction dataset as input features. Error compensation based on Box–Cox transformation is performed on the output results of the meta-learner to obtain the final prediction results.
3. Results and Discussion
3.1. Experimental Data
The compressor data used in the experiment were obtained from the Shengu Group. The effect of scale differences on the data needs to be eliminated; thus, the data were processed using normalisation [21].
Predictive models with different parameters have different input variables. This input variable has an important effect on the output variable. For example, the temperature, pressure, and speed of the compressor can be used as input variables. To ensure the prediction’s accuracy, it is necessary to construct the three models mentioned above to predict the compressor’s power, surge, and blockage parameters.
The Random Forest algorithm was used to evaluate the importance of variables and screen the model’s input variables [22]. The importance of the variables corresponding to power, compressor blockage, and surge boundaries is shown in Figure 4. According to the importance results, some of the data with low importance were excluded to reduce the training time and complexity of the model. Finally, the input and output variables corresponding to the different prediction objectives were determined, as shown in Table 1.
Based on the data presented in Table 1 below, speed was selected as the input data for the strong correlation coefficient input layer of the codec model. The other data were used as input data for the weak correlation coefficient input layer. The material flowing through the compressor is only natural gas, so the molecular weight is of low importance and the molecular weight data are discarded here. If the substance passing through the compressor is not homogeneous, it cannot be discarded. All of the input variables in the above table were used for the RBF base model; 90% of the dataset was taken as training data and 10% as test data [23].
3.2. Base Learner Experimental Results
The indicators of coefficient of determination (R2) and root-mean-square error (RMSE) were used as evaluation indicators for the results of the experiment [24]. The closer the value of a is to 1, the better the model predicts. The smaller the value of RMSE, the better the effect. The mathematical expression of the above rating criteria is shown in Equations (8) and (9):
In the equation, is the actual value of the output variable, is the predicted value of the output variable, and is the average value of the output variable.
The base model needs to have some predictive accuracy. It cannot produce a large error, or else the meta-model will be difficult to correct. From the above results, it can be seen that the base model predicts the compressor performance parameters better. The selection criteria for the base model are satisfied.
The processed dataset is used to conduct experiments, and different data are inputted to different encoders according to their importance. The experimental results obtained are shown in Table 2. The prediction outcomes obtained using the radial basis function neural network model are displayed in Table 3.
The above results show that each base learner has more accurate prediction results. It should also be ensured that there are differences between these learners so that the model is able to learn information about the data from multiple sources. The Pearson correlation coefficient was selected as the evaluation index for the difference analysis of the base learners [25]. The larger the Pearson coefficient, the greater the correlation and the smaller the difference between algorithms [26]. The calculation of the Pearson correlation coefficient of the two-dimensional vector is as follows (10):
Here, and are the average values of vectors x and y, respectively.
The diversity of the base learner also has a crucial impact on the prediction performance of the subsequent fusion model. Choosing a multivariate learner can reduce the prediction error of the output layer to a certain extent. The correlation results for different performance parameters of the compressor are shown in Table 4. The results show that the correlation between the base models is low. The lower correlation differentiates the base models and facilitates the integrated learning algorithm to take advantage of different algorithms.
3.3. Stacking Model Analysis
3.3.1. Analysis of Traditional Stacking Ensemble Learning Model
This work uses the model described above as the first-layer model that constitutes the Stacking model. To prevent the model from overfitting, the linear regression model is used as the second-layer model. The calculation results are shown in Figure 5, where model A is the encoder–decoder model and model B is the radial basis function neural network model. The model’s R2 and RMSE are evaluated for the model’s prediction capabilities. A comparison between the integrated and standalone models is presented in Table 5.
Figure 5 below shows the predicted results for some of the power parameters. The condition data in the horizontal axis coordinates represent the sample points of the test set. From the table and graphical results, it can be seen that the evaluation metrics of the base Stacking integrated learning model are all better than the single model. The root-mean-square error decreased by 24.8% and 46.5% compared to the integrated model in terms of power prediction. The superiority of the integrated learning algorithm is verified. In the graphical prediction results, the predicted values of the Stacking model are always close to the true values. Although the prediction value of the single model for a certain sample has a larger error, this error is finally corrected by the Stacking model. The robustness of the model is improved to some extent.
The prediction results for blocking boundaries are shown below in Figure 6. The prediction accuracy of the Stacking model is also higher than that of the single model. The root-mean-square error of the stacked model is reduced by 30.9% and 7% compared to the single model.
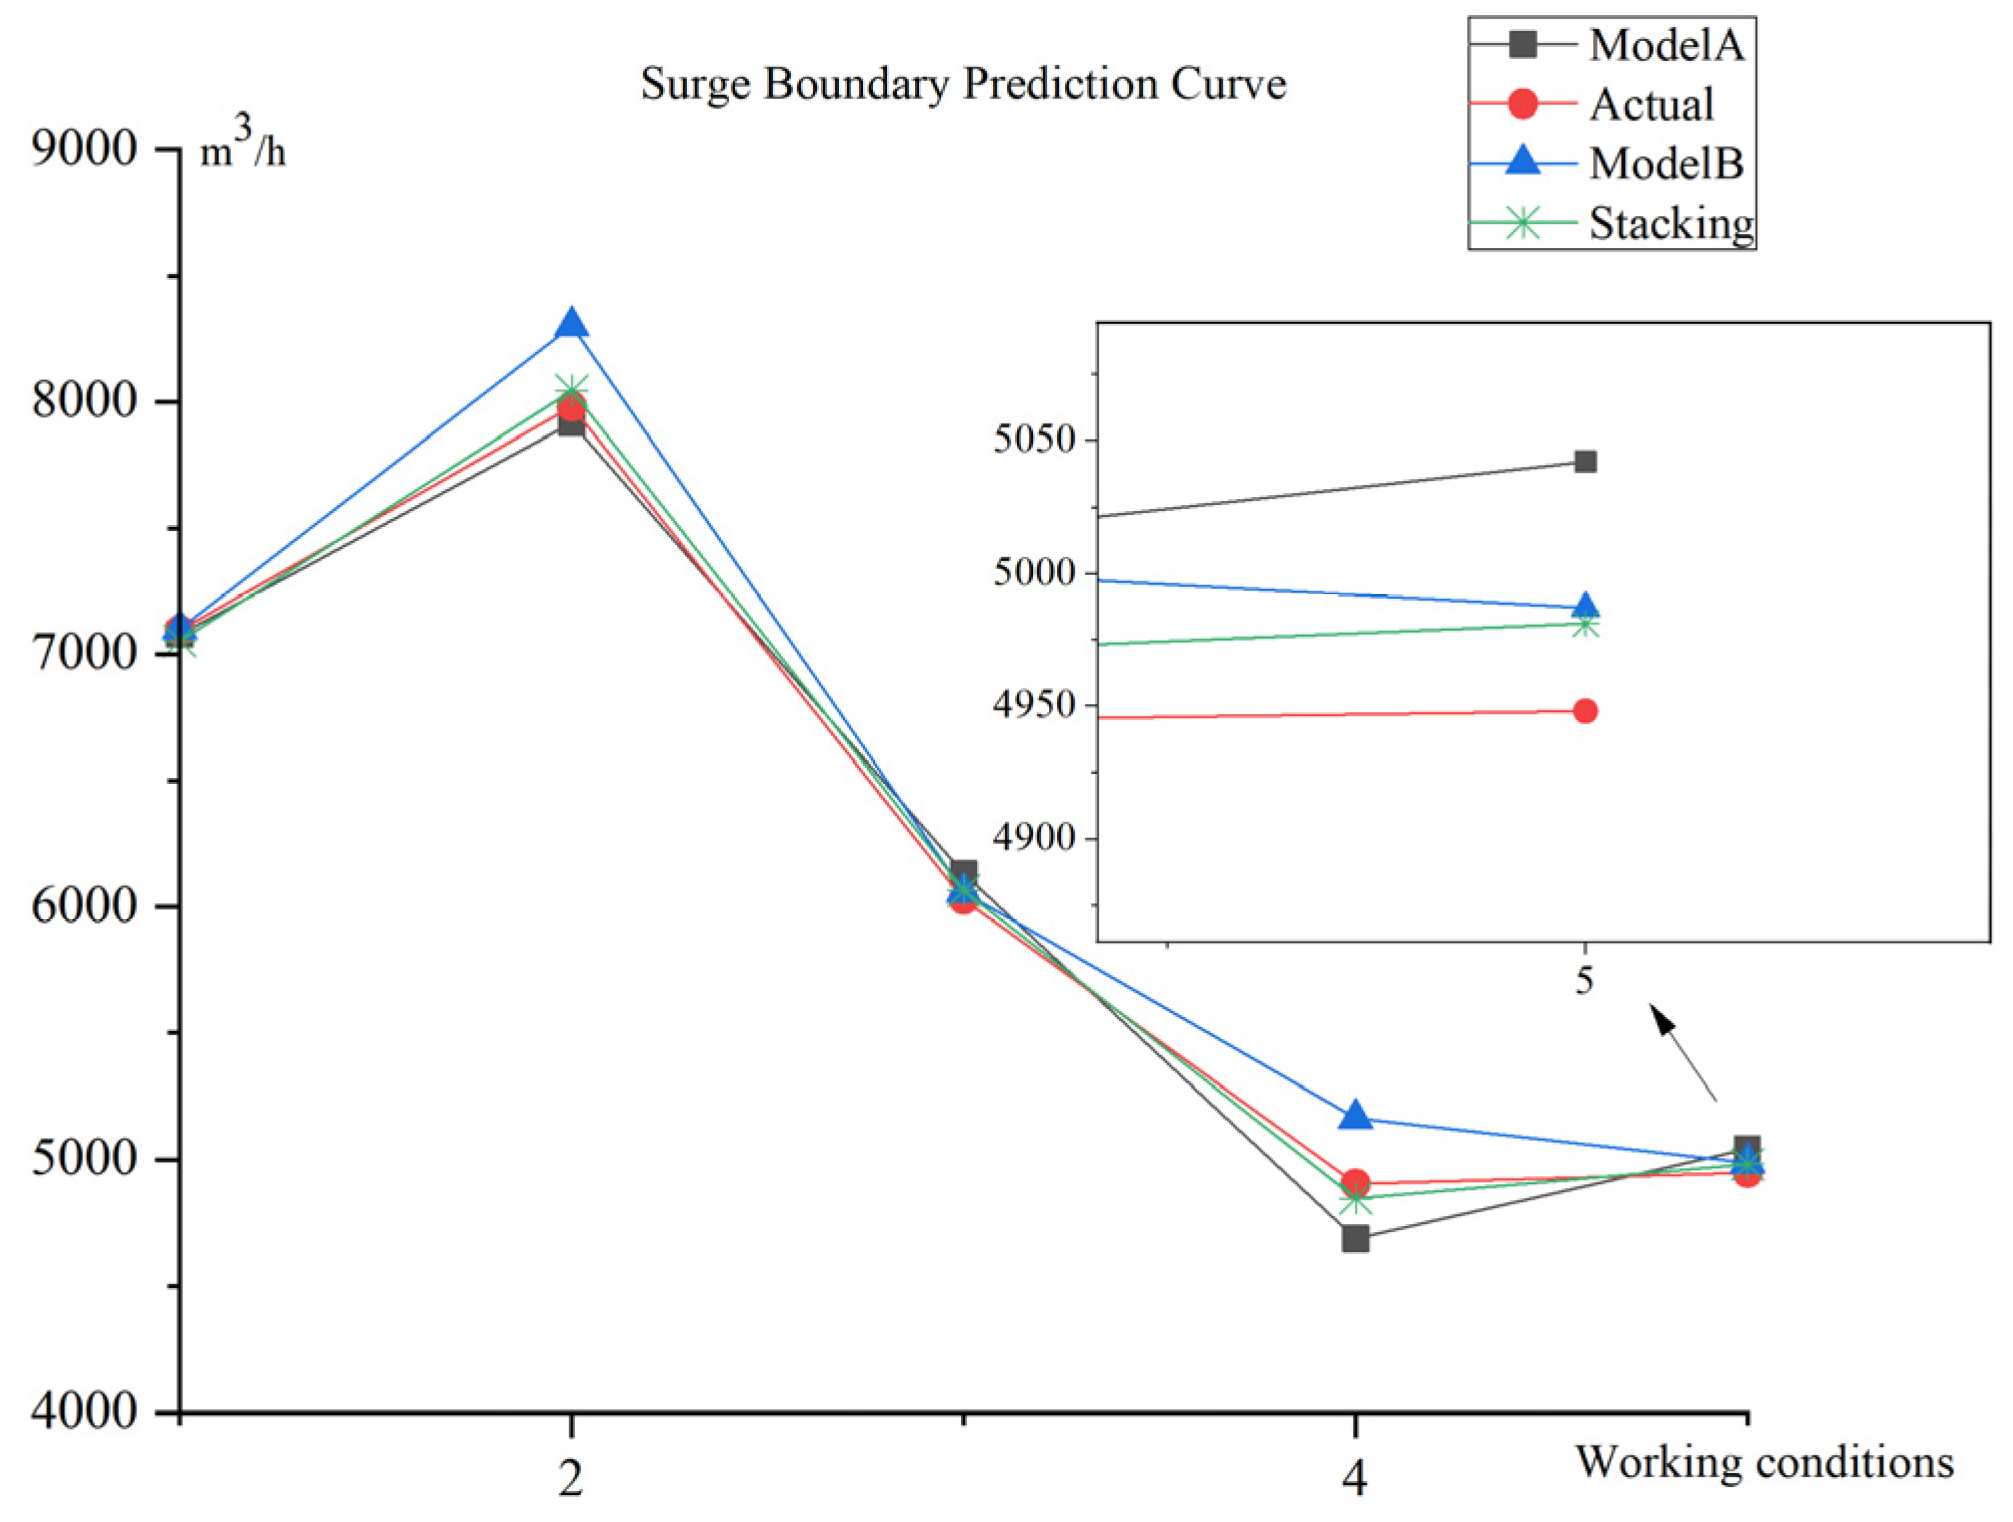
The prediction results for the surge boundary are shown in Figure 7. The prediction results also show the superiority of the Stacking model. Its root-mean-square error is reduced by 13.4% and 12.5% compared to the single model.
3.3.2. Analysis of Improved Stacking Integrated Learning Model
The same training set was used based on the improved Stacking integrated learning algorithm proposed in the article. The base learner uses fivefold cross-validation. In order to demonstrate the superiority of the improved model and the effectiveness of each improvement point, this study used separate prediction models for each of the different improvement points. The models corresponding to each improvement point and the final model in this study are as follows:
- Model 1: Classic Stacking model;
- Model 2: Weight allocation for the traditional Stacking model;
- Model 3: Error correction is performed on the prediction results of the traditional Stacking model;
- Model 4: The model described in this article.
Therefore, this work designed an ablation experiment to analyse each improvement point’s impact on the Stacking model’s prediction performance and compared the prediction results of each model with the actual values of the compressor performance parameters. The ablation experiment model’s evaluation index values are shown in Table 6. As shown in the table, the error at each improvement point is reduced relative to the base model, improving the accuracy of the prediction. In addition, for the power parameters of the compressor, the prediction effect of the traditional Stacking model is better. However, the improved ensemble model can still improve the prediction accuracy to a certain extent. The dataset size is relatively small for the boundary parameters of the compressor. The predictions are slightly less effective than for the power parameters of the compressor, but the prediction accuracies of the boundary parameters are all further improved by error-based weight assignment and compensation. The root-mean-square error in the prediction of power for model 4 is reduced by 32.0%, 11.9%, and 19.6% compared to the other models. The errors are reduced by 25.9%, 13.1%, and 9.9% in terms of the surge boundary prediction. In the blocking boundary prediction, the reductions are 30.5%, 15.2%, and 4.3%, respectively. In summary, the effectiveness of the enhanced Stacking model described in this article has been verified through experiments.
4. Conclusions
In this work, the power parameters of a large centrifugal compressor and the safe operating boundaries of the compressor were analysed and predicted by means of an error-based improved Stacking model. The RBF neural network model and encoder–decoder model with hierarchical inputs were integrated through the meta-model, and weights were assigned to the dataset based on the validation set error of the K-fold cross-validation. Finally, the output error of the meta-model was Box–Cox transformed for error compensation. A comparative study of the new model’s performance was also conducted through experiments. The results prove that, compared with a single model and the traditional Stacking model, the prediction accuracy of the integrated model is improved to varying degrees, and it has a better anti-interference ability. The integrated model can better predict the compressor’s power and safety boundary parameters.
Author Contributions
Conceptualization, X.M. and L.L.; methodology, X.M. and L.L.; formal analysis, X.M. and X.C.; investigation, L.L.; resources, Z.W.; data curation, Z.W.; writing—original draft preparation, X.M.; writing—review and editing, X.C.; supervision, X.C.; project administration, Z.W.; funding acquisition, Z.W. All authors have read and agreed to the published version of the manuscript.
Funding
This work was funded by the R&D Fund of Beijing Pipe Co., Ltd. (2022RD01).
Data Availability Statement
Data are contained within the article.
Acknowledgments
The authors thank Dalian University of Technology, Shengu Group, and PipeChina Group for their great guidance and help.
Conflicts of Interest
Author Zhiyong Wang was employed by the company Beijing Pipe Co., Ltd. The remaining authors declare that the research was conducted in the absence of any commercial or financial relationships that could be construed as a potential conflict of interest. The funding sponsors had no role in the design of the study; in the collection, analyses, or interpretation of data; in the writing of the manuscript; or in the decision to publish the results.
References
- Ye, Z. Study on the natural gas consumption and its change prediction. J. Phys. Conf. Ser. 2020, 1549, 042103. [Google Scholar] [CrossRef]
- Zhou, D.; Huang, D.; Jia, X.; Li, T.; Wang, C.; Wang, D.; Ren, Y. Study on the maintenance scheduling model for compressor units of long-distance natural gas networks considering actual maintenance demands. J. Nat. Gas Sci. Eng. 2021, 94, 104065. [Google Scholar] [CrossRef]
- Arya, A.K. A critical review on optimization parameters and techniques for gas pipeline operation profitability. J. Pet. Explor. Prod. Technol. 2022, 12, 3033–3057. [Google Scholar] [CrossRef]
- Galvas, M.R. Computer Program for Predicting Off-Design Performance of Centrifugal Compressors. 1974, No. LEW-12186. Available online: https://api.semanticscholar.org/CorpusID:60741619 (accessed on 24 April 2024).
- Wang, Z.H.; Xi, G. The effects of gas models on the predicted performance and flow of a centrifugal refrigeration compressor stage. Technol. Sci. 2008, 51, 1160–1168. [Google Scholar] [CrossRef]
- Cutrina Vilalta, P.; Wan, H.; Patnaik, S.S. Centrifugal compressor performance prediction using gaussian process regression and artificial neural networks. Am. Soc. Mech. Eng. 2019, 59452, V008T09A045. [Google Scholar]
- Chu, F.; Wang, F.L.; Wang, X.G.; Zhang, S. A model for parameter estimation of multistage centrifugal compressor and compressor performance analysis using genetic algorithm. Sci. China (Technol. Sci.) 2012, 55, 3163–3175. [Google Scholar] [CrossRef]
- Shi, J.Q.; Zhang, J.H. Load forecasting based on multi-model by Stacking ensemble learning. Proc. CSEE 2019, 39, 4032–4042. [Google Scholar]
- Ribeiro, M.H.D.M.; dos Santos Coelho, L. Ensemble approach based on bagging, boosting and stacking for short-term prediction in agribusiness time series. Appl. Soft Comput. 2020, 86, 105837. [Google Scholar] [CrossRef]
- Ganaie, M.A.; Hu, M.; Malik, A.K.; Tanveer, M.; Suganthan, P.N. Ensemble deep learning: A review. Eng. Appl. Artif. Intell. 2022, 115, 105151. [Google Scholar] [CrossRef]
- Cui, S.; Yin, Y.; Wang, D.; Li, Z.; Wang, Y. A stacking-based ensemble learning method for earthquake casualty prediction. Appl. Soft Comput. 2021, 101, 107038. [Google Scholar] [CrossRef]
- Khan, I.; Zhang, X.; Rehman, M.; Ali, R. A literature survey and empirical study of meta-learning for classifier selection. IEEE Access 2020, 8, 10262–10281. [Google Scholar] [CrossRef]
- Wang, R.; Lu, S.; Feng, W. A novel improved model for building energy consumption prediction based on model integration. Appl. Energy 2020, 262, 114561. [Google Scholar] [CrossRef]
- Li, M.; Yan, C.; Liu, W. The network loan risk prediction model based on Convolutional neural network and Stacking fusion model. Appl. Soft Comput. 2021, 113, 107961. [Google Scholar] [CrossRef]
- Baradaran, R.; Amirkhani, H. Ensemble learning-based approach for improving generalization capability of machine reading comprehension systems. Neurocomputing 2021, 466, 229–242. [Google Scholar] [CrossRef]
- Peng, J.; Zheng, Z.; Zhang, X.; Deng, K.; Gao, K.; Li, H.; Chen, B.; Yang, Y.; Huang, Z. A data-driven method with feature enhancement and adaptive optimization for lithium-ion battery remaining useful life prediction. Energies 2020, 13, 752. [Google Scholar] [CrossRef]
- Pek, J.; Wong, O.; Wong, A.C. How to address non-normality: A taxonomy of approaches, reviewed, and illustrated. Front. Psychol. 2018, 9, 2104. [Google Scholar] [CrossRef]
- Ali, A.A.; Ali, H.T.M. Box-Cox Transformation for Exponential Smoothing with Application. Acad. J. Nawroz Univ. 2023, 12, 311–316. [Google Scholar]
- Chang, Z.; Hao, L.; Yan, Q.; Ye, T. Research on manipulator tracking control algorithm based on RBF neural network. J. Phys. Conf. Ser. 2021, 1802, 032072. [Google Scholar] [CrossRef]
- Zhang, L.; Chen, C.; Xia, Y.; Song, Q.; Cao, J. Prediction of Blade Tip Timing Sensor Waveforms Based on Radial Basis Function Neural Network. Appl. Sci. 2023, 13, 9838. [Google Scholar] [CrossRef]
- Singh, D.; Singh, B. Investigating the impact of data normalization on classification performance. Appl. Soft Comput. 2020, 97, 105524. [Google Scholar] [CrossRef]
- Zhang, W.; Wu, C.; Li, Y.; Wang, L.; Samui, P. Assessment of pile drivability using random forest regression and multivariate adaptive regression splines. Georisk Assess. Manag. Risk Eng. Syst. Geohazards 2021, 15, 27–40. [Google Scholar] [CrossRef]
- Nguyen, Q.H.; Ly, H.B.; Ho, L.S.; Al-Ansari, N.; Van Le, H.; Tran, V.Q.; Prakash, I.; Pham, B.T. Influence of data splitting on performance of machine learning models in prediction of shear strength of soil. Math. Probl. Eng. 2021, 2021, 4832864. [Google Scholar] [CrossRef]
- Borhani, T.N.; García-Muñoz, S.; Luciani, C.V.; Galindo, A.; Adjiman, C.S. Hybrid QSPR models for the prediction of the free energy of solvation of organic solute/solvent pairs. Phys. Chem. Chem. Phys. 2019, 21, 13706–13720. [Google Scholar] [CrossRef]
- Chen, C.; Liu, H. Medium-term wind power forecasting based on multi-resolution multi-learner ensemble and adaptive model selection. Energy Convers. Manag. 2020, 206, 112492. [Google Scholar] [CrossRef]
- Kong, L.; Nian, H. Fault detection and location method for mesh-type DC microgrid using Pearson correlation coefficient. IEEE Trans. Power Deliv. 2020, 36, 1428–1439. [Google Scholar] [CrossRef]
Figure 1.
Stacking model training process.
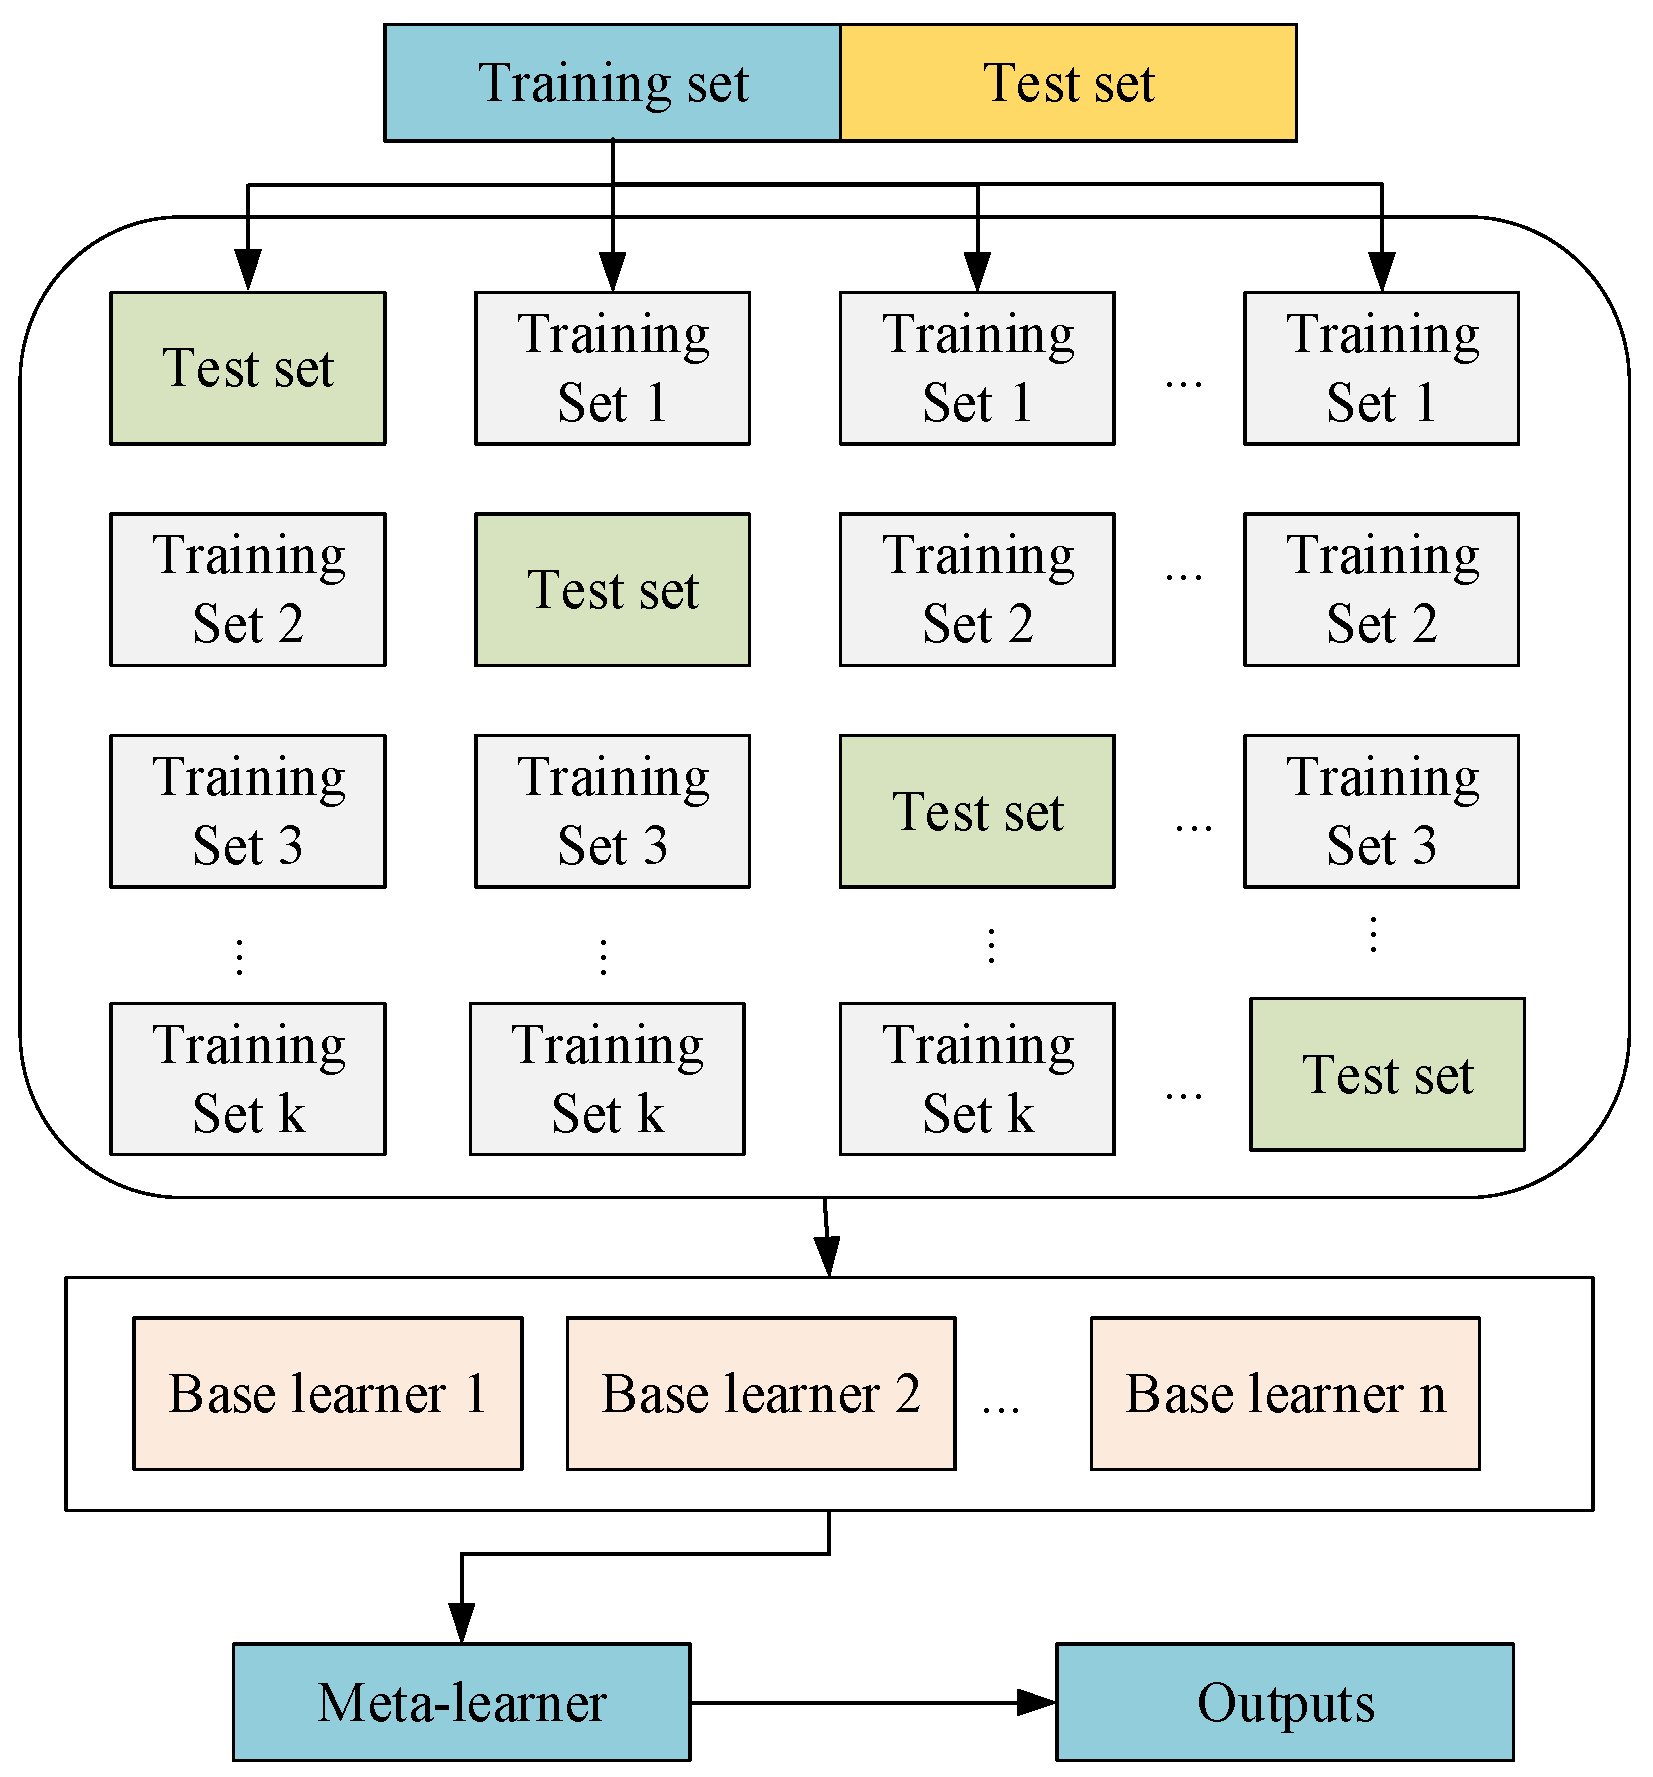
Figure 2.
Encoder–decoder model for hierarchical input.

Figure 3.
Improved Stacking process.
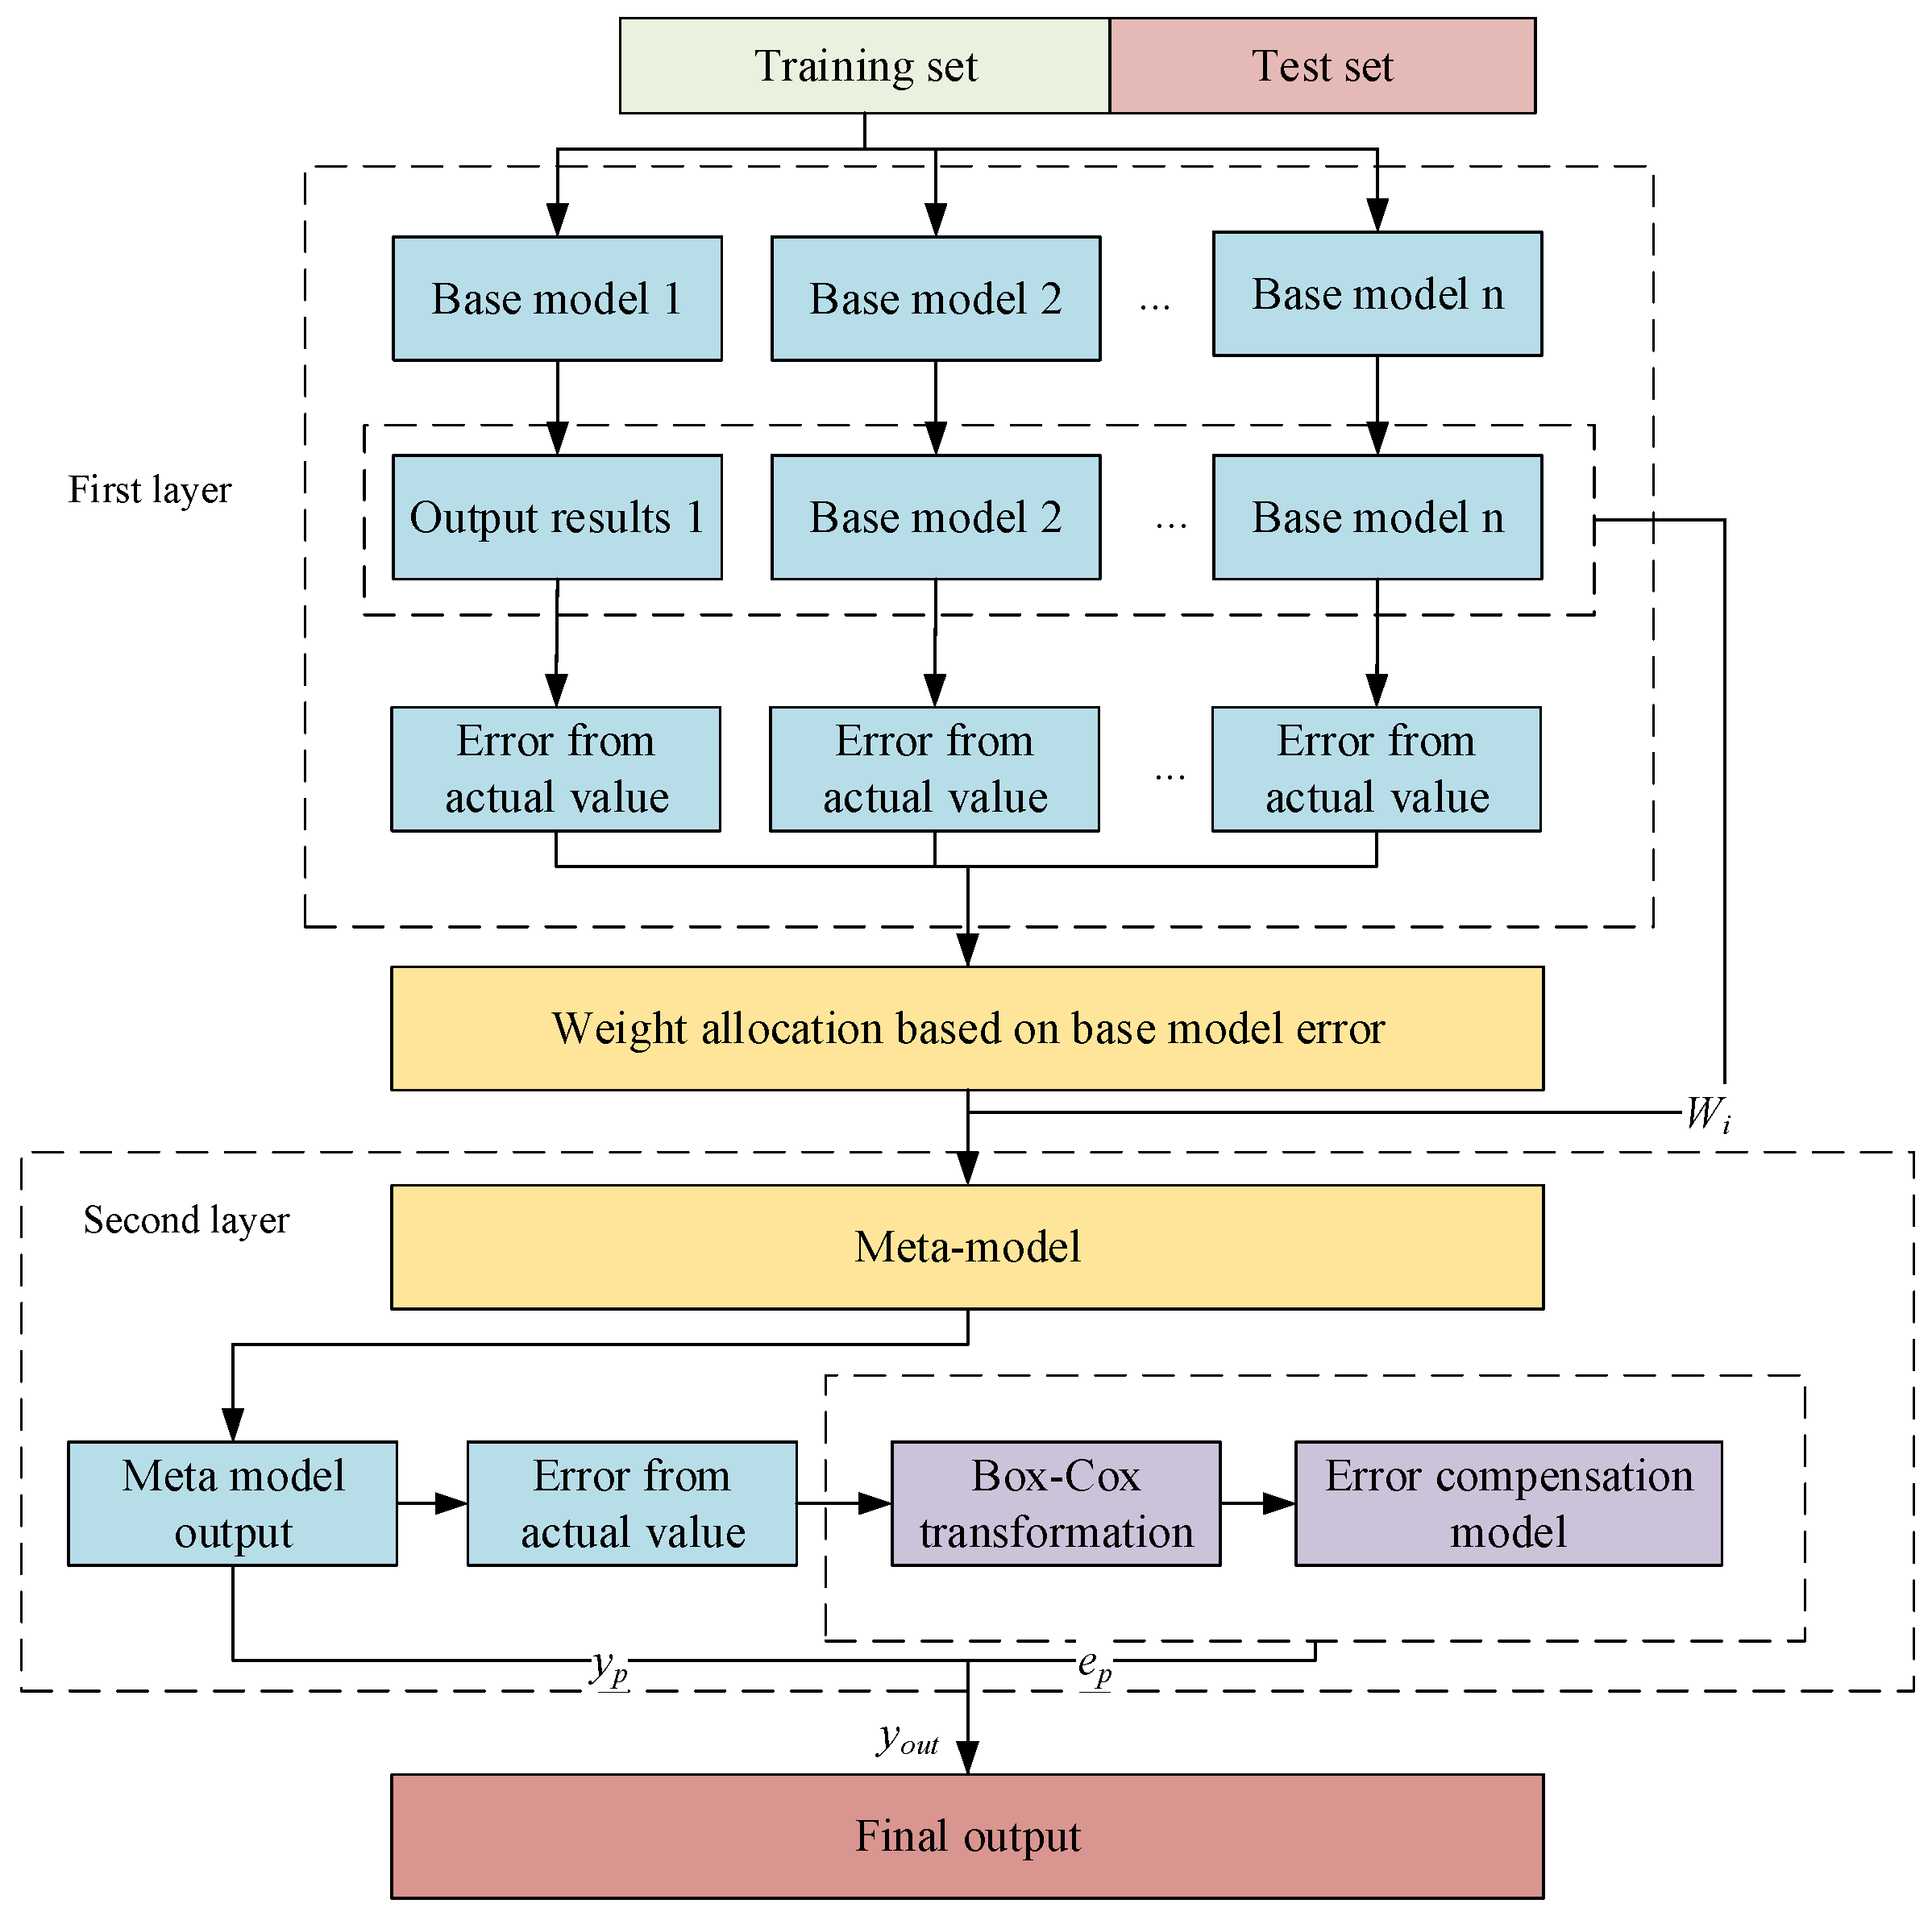
Figure 4.
Variable importance scores.
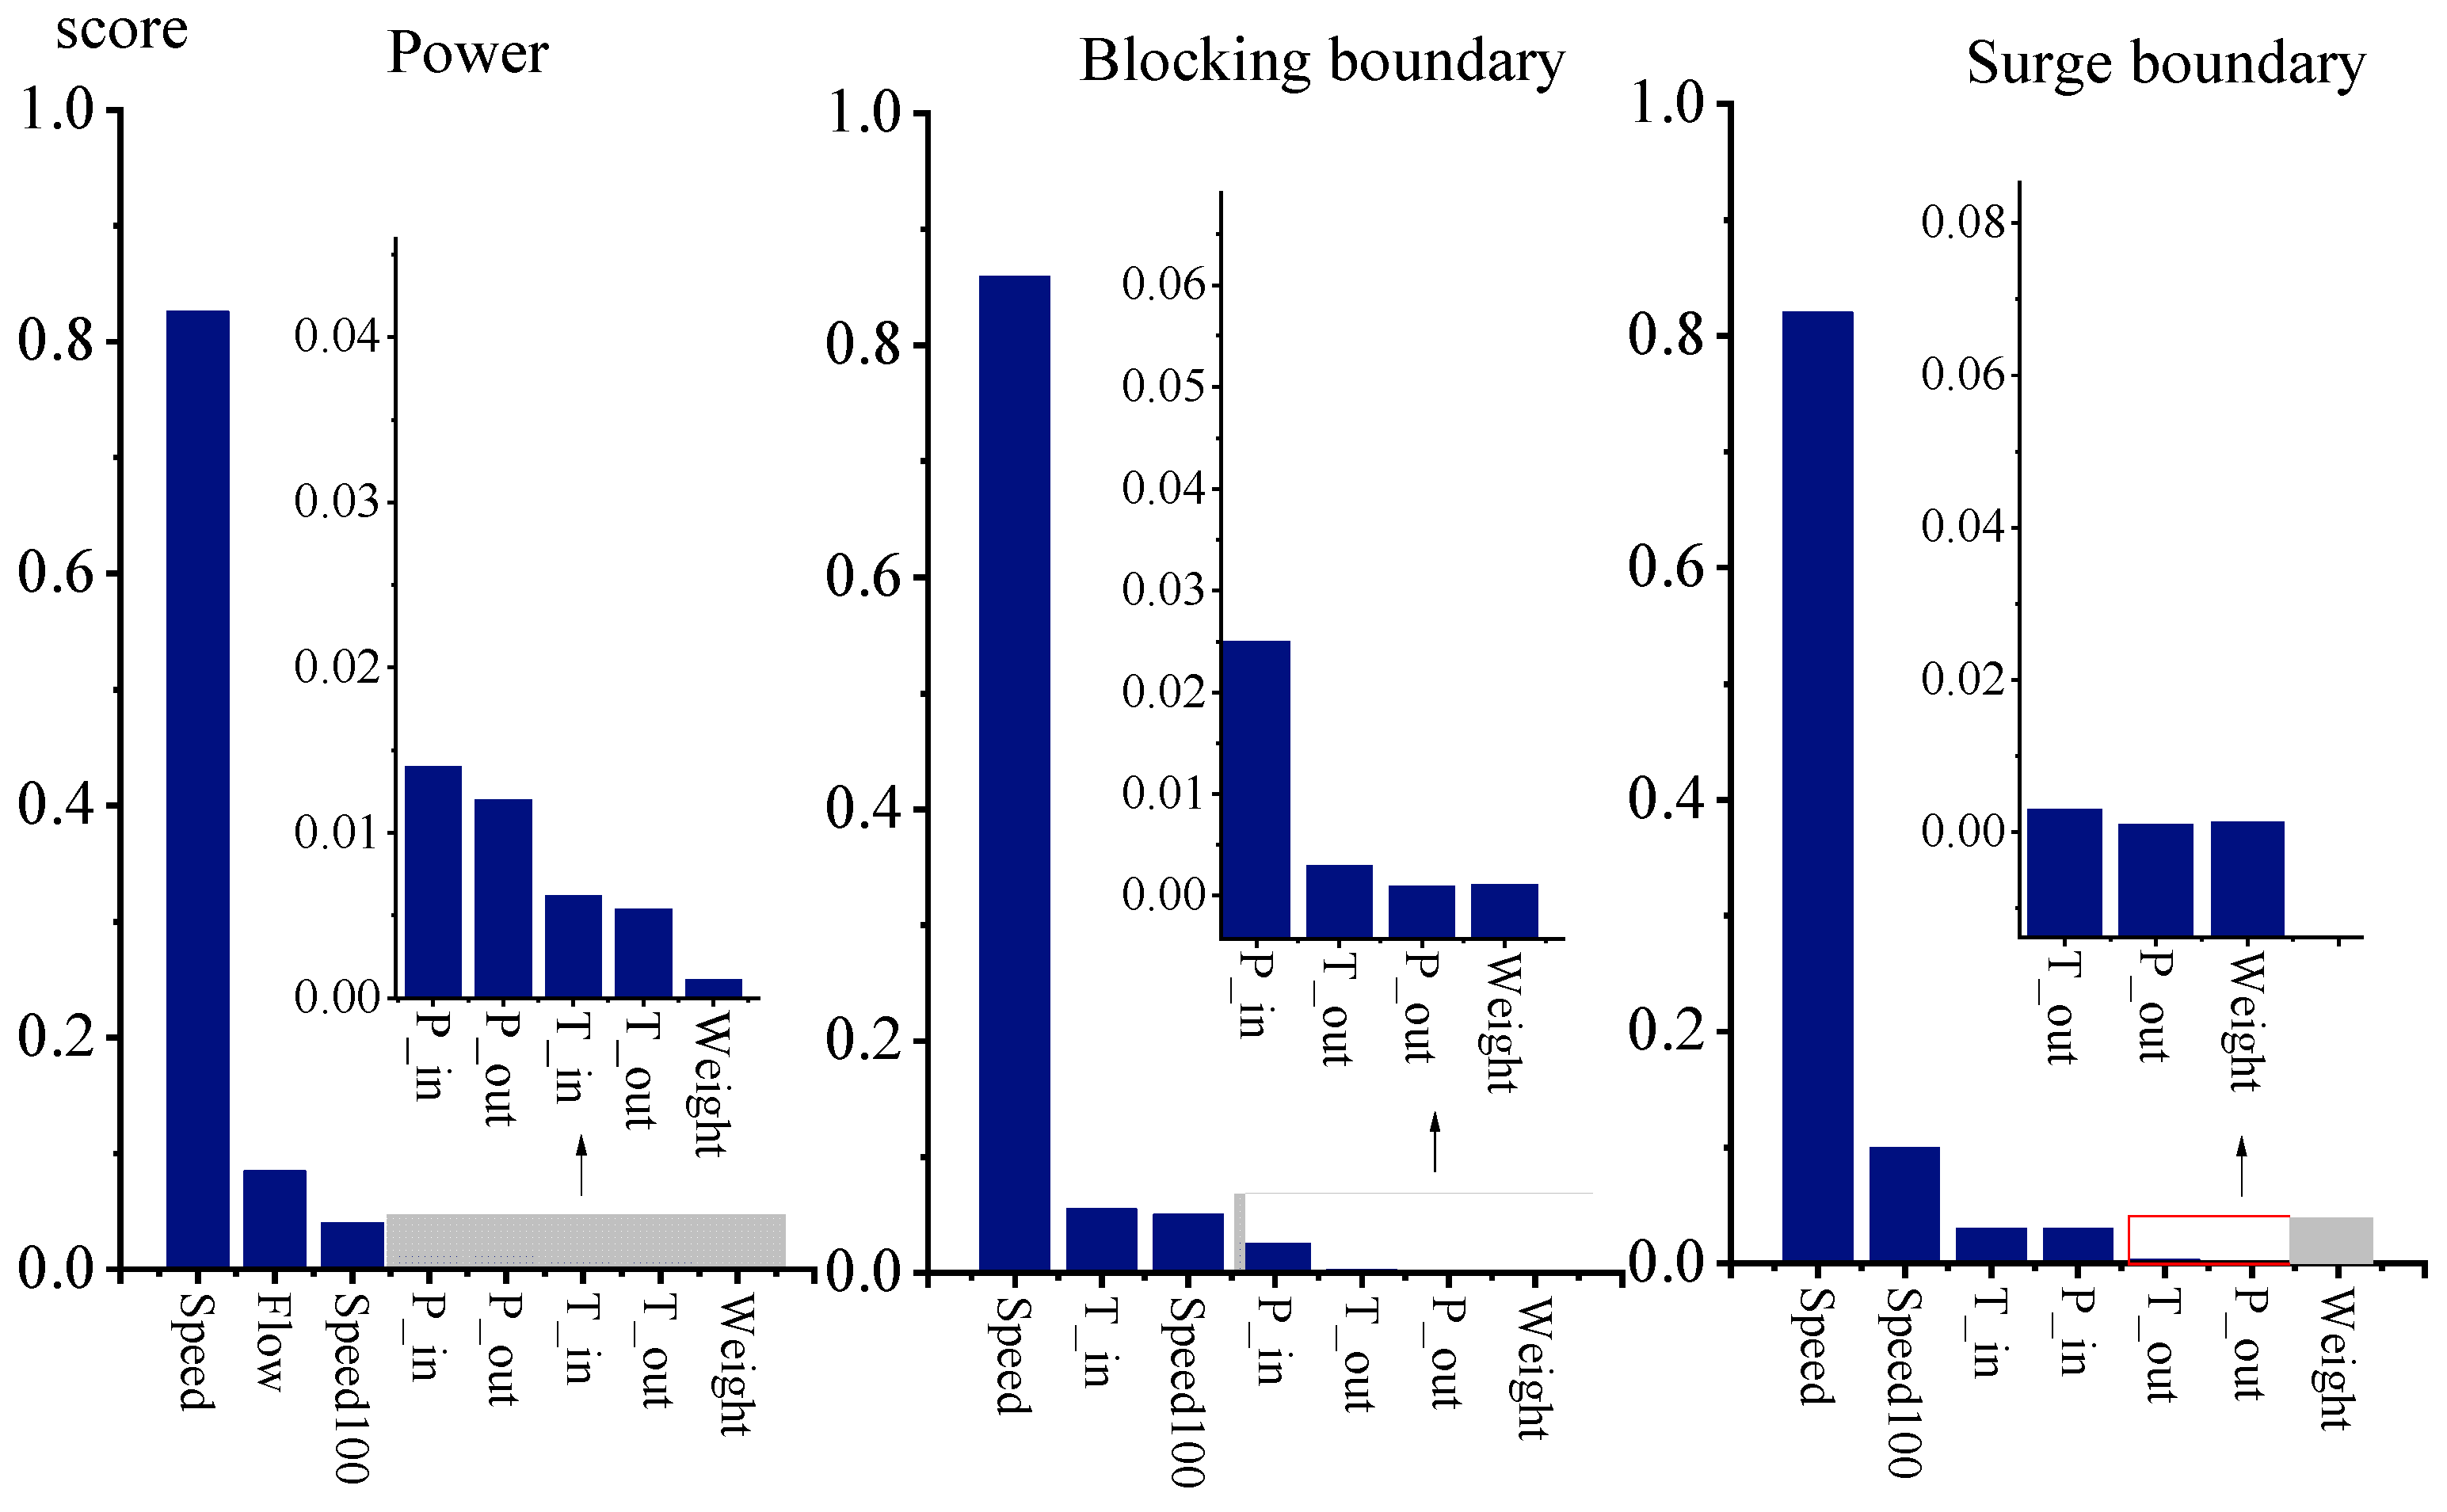
Figure 5.
Power prediction effect of single model and Stacking model.

Figure 6.
Boundary prediction effect of single model and Stacking model.

Figure 7.
Surge prediction effect of single model and Stacking model.

Table 1.
Input and output variables.
| Output Variables | Input Variables |
|---|---|
| Power | Speed, inlet flow, 100% speed, inlet pressure, outlet pressure, inlet temperature, outlet pressure |
| Blocking Boundary | Speed, inlet temperature, 100% speed, inlet pressure, outlet temperature, outlet pressure |
| Surge Boundary | Speed, 100% speed, inlet temperature, inlet pressure, outlet temperature, outlet pressure |
Table 2.
Evaluation table of the prediction results of the encoder–decoder model.
| Parameters | R2 | RMSE |
|---|---|---|
| Power | 0.97519 | 638 |
| Surge Boundary | 0.92213 | 896 |
| Blocking Boundary | 0.93762 | 884 |
Table 3.
Evaluation table of prediction results of RBF model.
| Parameters | R2 | RMSE |
|---|---|---|
| Power | 0.96372 | 749 |
| Surge Boundary | 0.93213 | 732 |
| Blocking Boundary | 0.93762 | 877 |
Table 4.
Correlation coefficient.
| Prediction Parameters | Correlation |
|---|---|
| Power | 0.31 |
| Surge boundary | 0.35 |
| Blocking boundary | 0.29 |
Table 5.
Evaluation index of traditional Stacking and single model prediction parameters.
| Parameters | Model | R2 | RMSE |
|---|---|---|---|
| Power | Model A | 0.97519 | 638 |
| Model B | 0.96372 | 749 | |
| Stacking model | 0.98076 | 511 | |
| Surge Boundary | Model A | 0.92213 | 896 |
| Model B | 0.93213 | 732 | |
| Stacking model | 0.95145 | 684 | |
| Blocking Boundary | Model A | 0.93762 | 884 |
| Model B | 0.93762 | 877 | |
| Stacking model | 0.94974 | 779 |
Table 6.
Evaluation index of improved Stacking model predicting parameters.
| Parameters | Model | R2 | RMSE |
|---|---|---|---|
| Power | Model 1 | 0.98076 | 511 |
| Model 2 | 0.98546 | 433 | |
| Model 3 | 0.98655 | 463 | |
| Model 4 | 0.99265 | 387 | |
| Surge Boundary | Model 1 | 0.95145 | 684 |
| Model 2 | 0.96451 | 614 | |
| Model 3 | 0.96486 | 597 | |
| Model 4 | 0.97465 | 543 | |
| Blocking Boundary | Model 1 | 0.94974 | 779 |
| Model 2 | 0.95781 | 688 | |
| Model 3 | 0.96895 | 623 | |
| Model 4 | 0.97894 | 597 |
Disclaimer/Publisher’s Note: The statements, opinions and data contained in all publications are solely those of the individual author(s) and contributor(s) and not of MDPI and/or the editor(s). MDPI and/or the editor(s) disclaim responsibility for any injury to people or property resulting from any ideas, methods, instructions or products referred to in the content. |
© 2024 by the authors. Licensee MDPI, Basel, Switzerland. This article is an open access article distributed under the terms and conditions of the Creative Commons Attribution (CC BY) license (https://creativecommons.org/licenses/by/4.0/).
Share and Cite
MDPI and ACS Style
Miao, X.; Liu, L.; Wang, Z.; Chen, X. Improved Error-Based Ensemble Learning Model for Compressor Performance Parameter Prediction. Energies 2024, 17, 2113. https://doi.org/10.3390/en17092113
AMA Style
Miao X, Liu L, Wang Z, Chen X. Improved Error-Based Ensemble Learning Model for Compressor Performance Parameter Prediction. Energies. 2024; 17(9):2113. https://doi.org/10.3390/en17092113
Chicago/Turabian StyleMiao, Xinguo, Lei Liu, Zhiyong Wang, and Xiaoming Chen. 2024. "Improved Error-Based Ensemble Learning Model for Compressor Performance Parameter Prediction" Energies 17, no. 9: 2113. https://doi.org/10.3390/en17092113
Note that from the first issue of 2016, this journal uses article numbers instead of page numbers. See further details here.