

Enhancing the Efficiency of Rotary Thermal Propulsion Systems

1
Department of Mechanical Engineering, University of Bath, Claverton Down, Bath BA2 7AY, UK
2
Advanced Vehicle Engineering Centre, Cranfield University, Cranfield, Bedford MK43 0AL, UK
*
Author to whom correspondence should be addressed.
Energies 2024, 17(9), 2112; https://doi.org/10.3390/en17092112
Submission received: 11 February 2024
/
Revised: 17 April 2024
/
Accepted: 22 April 2024
/
Published: 28 April 2024
(This article belongs to the Special Issue Disruptive Solutions for Innovative Internal Combustion Engines and Advanced Combustion)
Abstract
:Transport electrification is essential for reducing CO2 emissions, and technologies such as hybrid and range-extended electric vehicles will play a crucial transitional role. Such vehicles employ an internal combustion engine for on-board chemical energy conversion. The Wankel rotary engine should be an excellent candidate for this purpose, offering a high power-to-weight ratio, simplicity, compactness, perfect balance, and low cost. Until recently, however, it has not been in production in the automotive market, due, in part, to relatively low combustion efficiency and high fuel consumption and unburnt hydrocarbon emissions, which can be traced to constraints on flame speed, an elongated combustion chamber, and relatively low compression ratios. This work used large eddy simulations to study the in-chamber flow in a peripherally ported 225cc Wankel rotary engine, providing insight into these limitations. Flow structures created during the intake phase play a key role in turbulence production but the presence of the pinch point inherent to Wankel engine combustion chambers inhibits flame propagation. Two efficiency-enhancement technologies are introduced as disruptive solutions: (i) pre-chamber jet ignition and (ii) a two-stage rotary engine. These concepts overcome the traditional efficiency limitations and show that the Wankel rotary engine design can be further enhanced for its role as a range extender in electrified vehicles.
1. Introduction
The automotive industry is experiencing an electrified transport revolution. According to recent ACEA data [1], sales of new battery electric vehicles (BEVs) are rapidly increasing, attaining a market share across the EU, EFTA (European Free Trade Association), and UK of 15.7% in 2023 (rising from 13.9% in 2022). Meanwhile, the market share for hybrid electric vehicles (including plug-ins) stands at 34.1% for 2023 (up from 32.4% in 2022). Taken together with conventional gasoline and diesel vehicles, this means that approx. 84% of new cars sold in 2023 still used an internal combustion (IC) engine. With the average passenger car lifespan standing at around 18 years [2], it is essential that the thermal efficiency of IC engines continues to be optimised. Over the long lifetime of millions of vehicles (there were ∼10.5 million new passenger car registrations in the EU in 2023 [1]), every fraction of a percent of efficiency improvement translates into hundreds of thousands of tonnes of reductions in total CO2 emissions [3].
1.1. The Wankel Rotary Engine as a Range Extender for Electric Vehicles
A range-extended electric vehicle (REEV) is a hybrid electric vehicle equipped with a downsized IC engine connected to an electric powertrain with electrical energy storage. The sole purpose of the engine is to maintain a sufficient battery state of charge, which means that REEVs can have much smaller batteries. Even with the added cost and weight associated with the IC engine and fuel tank, this architecture is more affordable and lighter than most pure BEVs. And in terms of overall CO2 savings, it may well be the case that the best use of a limited supply of battery material is to deploy it across a greater number of hybrid vehicles than a much smaller fleet of BEVs. For example, research by Emissions Analytics [4] calculated that the battery material required for 92,420 BEVs could be redistributed to an additional 2.1 million hybrid vehicles. Though hybrids do not have zero tailpipe emissions, they are 4.6 times more impactful in terms of reducing CO2 emissions than pure BEVs, due to the more widespread deployment of batteries [4].
In most hybrid vehicles, the range extender is typically a reciprocating piston engine [5]. An alternative is the Wankel rotary engine. The concept of a rotary expander was present before the emergence of internal combustion engines. As early as 1799, during the steam age, experiments were carried out on an early form of a rotary machine [6]. Its advantages of a high power-to-weight ratio and smooth operation were already observed at that time, as well as the difficulty of adequate sealing. The Wankel-type rotary internal combustion engine was invented in 1954, which Yamamoto considered the best rotary engine design [6]. Wankel engines are currently in series production as the prime mover for unmanned aerial vehicles (UAVs), which value their lightness and compactness, and have previously appeared in the automotive sector as the powerplant in conventional powertrain architectures but fell from favour due to efficiency, emission, and durability concerns. However, Mazda has recently launched a Wankel engine-based REEV in the form of the MX-30 R-EV [7], which uses a 17.8 kWh battery and a 50 L fuel tank and can achieve a range of 640 km. The new powerplant is the Mazda 8C Wankel rotary engine outputting 55 kW at 4500 rpm [8]. Its brake specific fuel consumption (BSFC) is not published, but it is claimed to improve upon that of its predecessor, the Mazda 13B, by about 20% at 3500 rpm and high loads [8]. In independent testing, the Mazda 13B was reported [9] to have a best BSFC of 257.4 g/kWh, which is equivalent to a 33.9% brake thermal efficiency. This would suggest that the new engine has, at best, a BSFC of around 206 g/kWh or a 40.7% brake thermal efficiency. This is a substantial improvement for Wankel engines but remains a long way short of the best vehicle diesel engine brake thermal efficiency, which is starting to surpass 50% [10].
Compared to conventional four-stroke reciprocating engines, the Wankel rotary engine offers lower mass (and thus a higher power-to-weight ratio), has no need for a complicated valvetrain, and can be perfectly balanced, enabling much improved NVH (noise, vibration, harshness) characteristics. These reasons make it potentially a better candidate for the powerplant in a REEV, especially if thermal efficiency can be improved [11]. Thermal efficiency is also extremely sought after in the UAV market because it translates directly into a greater range and/or payload. To address this, this paper reports simulation techniques to develop a much improved understanding of the combustion process taking place in Wankel engines and demonstrates the potential of novel design concepts that show exciting potential for improving Wankel engine thermal efficiency and reducing emissions.
1.2. CFD of Wankel Rotary Engines
Papers that describe the CFD modelling of Wankel engines, which also include the prediction of combustion, are relatively few and far between. This section classifies the literature depending on whether the study applied Reynolds-averaged Navier–Stokes (RANS) or large eddy simulation (LES) techniques.
1.2.1. RANS Simulation Examples
Shi et al. [12] performed a successful simulation of a Wankel engine with side inlet ports and twin spark plugs, using the commercial software CONVERGE CFD and the SAGE detailed chemistry solver. The combustion approach involved higher ignition energy and hydrogen-enriched lean combustion. This helped with the burn rate and efficiency, but at the cost of a slightly higher NOx formation due to higher local temperatures. More generally, the work provides a useful explanation of flame propagation using a recent chemistry solver, with an excellent ignition model (making good use of local mesh refinement).
Spreitzer et al. [13] analysed combustion and flow in a peripherally ported, twin-spark Wankel engine, also using CONVERGE CFD. Their work emphasised the inefficiencies caused by higher wall heat flux and leakage paths such as those created by spark plug recesses. However, the most significant efficiency loss comes from incomplete combustion. Due to the elongated combustion chamber shape and the consequent “squish” effect, the flame has difficulty in reaching the far ends of the chamber. This results in unburnt pockets of air and fuel mixture, as identified in [13] using CO2 mass fraction as a marker to track flame propagation (this method was also used in the current work). But suggestions to mitigate these important drawbacks have not been put forward.
Boretti et al. [14] performed RANS simulations of a novel hydrogen Wankel engine design with jet ignition. Briefly, this technology ignites the charge in a small pre-chamber separated from the main chamber by a nozzle. This generates high-velocity, high-temperature jets that shoot into the main chamber, igniting the main charge, and resulting in much faster and more complete combustion leading to higher thermal and combustion efficiency, as well as improved tolerance for lean combustion. The CFD simulations showed both torque and fuel efficiency benefits when using jet ignition, and it was suggested that hydrogen is a good choice for Wankel engines, compared to liquid fuels, due to its ignition characteristics and high flame speed. Despite these promising results, there are some weaknesses in the simulated concept, which applies a jet ignition system designed for reciprocating engines. The differences between reciprocating and Wankel rotary engines are such that a pre-chamber jet ignition system intended for the former may not work in the latter. For instance, the pre-chamber will not experience an exhaust stroke as it would do in a reciprocating engine. As a result, its opportunity to fully expel the combustion products before the next combustion event, and to cool down, will be severely restricted. In addition, the apex seal will pass over the nozzle, bringing with it lubricating oil that can more easily enter the pre-chamber than in reciprocating engines, potentially forming carbon deposits. But the simulations only cover one engine cycle and are not intended to explore any problems arising during continuous operation. Another criticism concerns the meshing approach. This uses an elastic dynamic mesh that can stretch and compress, but re-meshing is not carried out following chamber deformation. While this undoubtedly saves computational time, re-meshing is recommended, considering the high level of geometry deformation and the consequent high aspect ratio of the cells. Nonetheless, this paper acts as important inspiration, especially regarding the jet ignition concept and the use of dynamic meshing, and the identified problems will be addressed later in this paper.
Sadiq et al. [15] created a 3D CFD model for a two-stage Wankel-based expander, intended for small-scale power generation using compressed air, or as part of an Organic Rankine Cycle (ORC) system. Simulations were performed in Ansys Fluent, and the results showed that the Wankel expander outperformed most other expander designs at low-pressure and low-temperature conditions. Helpfully, the geometry and motion of this expander, and how to replicate them in simulation through user-defined functions (UDFs), were also discussed. In employing a tetrahedral mesh, the CFD model includes all three chambers in a single fluid domain. Some weaknesses are apparent here; cell size remains the same regardless of boundaries and the volume change in the chamber. For example, when the chamber is at its smallest volume, there appears to be only one mesh layer. A further disadvantage is that, as a single fluid domain, full sealing between the chambers cannot be achieved. The dynamic mesh system in Ansys Fluent supports deforming fluid domains but only as long as their topology remains unchanged, which means it cannot simulate a sliding seal like the apex seal of a Wankel-type device. If a complete seal was attempted, it will be treated as a “negative volume cell”, causing the simulation to crash. A finite gap must therefore be present at the apex seals, which implies that there will be leakage between chambers in the simulation. This might be an acceptable compromise in an expander model but is not appropriate for a combustion engine model, which experiences greater pressure differences between chambers, and the unrealistic leakage of high pressure and temperature gas from one chamber could ignite the charge in the following chamber. This is a reason why the current work modelled the chamber as a separate fluid domain.
1.2.2. Large Eddy Simulation Examples
Although LES has been used to model reciprocating piston engines for decades [16], few papers have covered LES applied to Wankel engines. The work by Zhang et al. [17] employed delayed detached eddy simulation (DES) to analyze the three-dimensional turbulence characteristics of small Wankel engines during the intake stroke (the combustion event was not studied). DES was introduced by Spalart et al. [18] and can be viewed as a transitional approach lying between RANS and LES; it uses RANS in the near-wall region and LES away from the wall. This places lower demands on mesh resolution while still providing highly detailed predictions of turbulent flow structures. In order to visualise vortex structures in a 3D space, Q-criterion iso-surfaces were used to good effect in [17]. Indeed, the Q-criterion was used in the current work for the identification of turbulent flow structures.
Poojitganont et al. [19] compared RANS and LES simulations of a Wankel engine with comparison to experimental test data. Optical experiments were performed to observe the internal flow structure inside the chamber. Two main takeaways were that the LES predictions of the transient turbulent flow patterns were much closer to experimental results than the RANS results, but also that LES is more sensitive to mesh resolution, i.e., a sufficiently high resolution mesh is required to fully exploit LES. Although the work was limited to half an engine cycle (intake and compression phases), so again there was no coverage of the combustion and exhaust processes, this supports the selection of an LES-based approach, as used in the current work.
1.3. Summary of the Literature and Distillation of Research Aims
The review of the literature showed that there has been limited research into the CFD modelling of Wankel engines. Most of the literature is fairly recent, likely because Wankel engine CFD involves complicated dynamic meshing and advanced chemical reaction models, which are computationally demanding. Due to the extreme level of deformation and the need for dynamic meshing, in many works, mesh quality appears to be a weakness, with very high cell aspect ratios observed as the chamber volume compresses and expands. The literature also suggests that LES provides better fidelity for the simulation of in-chamber flows compared to RANS. And while LES has been applied to Wankel engines, it has been restricted to the intake and compression phases of the working cycle. Examples of LES modelling of the combustion phase of a Wankel engine and the corresponding flow field analysis are not apparent in the literature. In addressing the drawbacks of Wankel engines, jet ignition has been attempted in simulation. However, it will be challenging to implement a pre-chamber jet ignition system designed for reciprocating engines on a Wankel engine. Meanwhile the literature on two-stage Wankel-based devices highlights the possibility to raise the overall compression ratio and thereby improve the thermal efficiency.
In response to these gaps in the literature, the aims of the current research were as follows:
- Use LES to simulate a complete cycle of a Wankel engine, including combustion, with an approach that ensures a high-quality mesh throughout the cycle.
- Design and simulate a novel jet ignition system specifically tailored to Wankel engines.
- Explore the thermal efficiency benefits of a two-stage Wankel-based rotary engine.
2. Experimental and Computational Methods
2.1. Engine Testing
The subject engine under investigation here was the AIE 225CS engine [20], a production Wankel rotary engine manufactured by Advanced Innovative Engineering (AIE) in Lichfield, UK, and with the design specifications given in Table 1. Engine testing was performed using the small engine dynamometer at the University of Bath (Figure 1) as part of a collaborative UK Research and Innovation project [21].
Unlike a reciprocating piston engine, the combustion chambers in a Wankel rotary engine are not at fixed positions but instead rotate inside the housing. In order to record the instantaneous pressure corresponding to a combustion chamber across a cycle, four pressure sensors are required. During a cycle, each sensor is exposed to a particular chamber for a limited range of shaft angle, with some overlap between sensors. Measurements from the four sensors were concatenated to obtain a single pressure profile for a complete cycle of a particular combustion chamber. This process is described in [22].
2.2. Computational Model
2.2.1. CFD Domain and Mesh
The rotor in a Wankel engine takes the form of a Reuleaux triangle [23] and rotates around an eccentric output shaft inside a trochoidal housing, in what is known as a 2:3 arrangement (two housing lobes and three rotor flanks). This results in three rotating chambers separated by the rotor apices, with internal gearing that arranges for the output shaft to rotate three times per rotor rotation. Each of the three chambers experiences its own four-stroke cycle per rotor rotation so that there is one combustion event per output shaft rotation.
Meshing was achieved using the “dynamic mesh” capability in Ansys R19.2, in which the moving boundaries are described through user-defined functions (UDF). Wankel rotary engines employ apex and side seals to seal each chamber, but to avoid the need to simulate moving seals, only a single combustion chamber was modelled here. Not modelling the leakage loss across the seals represents an efficiency difference of ∼1–2 percentage points [13]. The fluid domain is shown in Figure 2a and comprises four surfaces: rotor (red), two flat side walls (only one is visible in the figure), and the curved internal surface of the housing (dark blue).
Figure 2b shows an example of the resulting chamber dynamic mesh during the intake phase, indicating how mesh resolution is adapted to be greater closer to the housing and rotor walls, as well as around any interfaces between rotating and stationary domains (such as between the chamber and the intake and exhaust ports). As the domain deforms so must the mesh, but the UDF only defines the motion of the boundary surfaces and not the mesh inside. For this reason, the mesh must be periodically reformed by “smoothing” and “remeshing” to ensure high-quality cells. “Smoothing” allows the mesh to be stretched or compressed without reconstruction while the mesh boundary is moving. However, this will eventually lead to unacceptable cell aspect ratios. To avoid this, a “remeshing” operation is performed every of a rotor rotation (i.e., every 90° of output shaft angle). The combination of “smoothing” and “remeshing” ensures that the fluid domain remains meshed with high-quality cells, but without the need to reconstruct the mesh at every time step, saving a significant amount of computational expense [24].
2.2.2. Mesh Dependency Study
In engine testing, calculation of the knock index (KI) is a means of quantifying the intensity of knock present in the combustion chamber pressure signal. As there was no evidence of knocking in the engine testing performed for this project, the knock index can instead be applied to the simulated chamber pressure as a metric to determine the required level of mesh refinement. The particular knock index calculated here was based on the “mean absolute value of pressure oscillations” (MAVPO) parameter [25] given in Equation (1):
where N is the number of sample points in the pressure history, and is the absolute value of the difference between the volume-averaged chamber pressure and the pressure at a selected monitoring point in the chamber (the location of which corresponds to that of the pressure sensor used in engine testing) at sample time j. Thus, KI represents the mean oscillation in the volume-averaged pressure at the nominated point in the domain.
Mesh dependency simulations were performed for seven different cell sizes between 0.1 and 1 mm. Figure 3 shows that the KI starts to converge once the cell size is finer than ∼0.5 mm, and so this value was taken forward as the target cell size. This value is in line with the 0.55 mm cells used for chamber mesh refinement during combustion in the LES simulations reported in [26].
2.2.3. Turbulence Modelling
Prior comparisons of RANS and LES modelling approaches identified the advantages of LES for capturing the flow structures entering the combustion chamber and their breakdown into turbulence, as suggested in other studies [19]. While RANS purposely averages out turbulent structures and is not able to resolve at the eddy scale, LES can resolve eddies larger than eight cells. For turbulent structures smaller than this, the simulation switches to a sub-grid viscosity model; here, the wall-adapting local eddy-viscosity model (WALE) [27] is applied. Full details of the turbulence modelling approach are provided in [28].
2.2.4. Simplified Combustion Model
The Spark Model in Ansys Fluent R19.2 was employed here to simulate spark ignition. This creates a local reaction hotspot at the selected location and point in time (ignition timing is given in Table 1), for an initial hotspot radius of 2 mm and an energy release of 0.05 J. The combustion model was heavily simplified and uses a finite-rate reaction model and a single reaction for the iso-octane fuel (Equation (2)):
Further details can again be found in [28].
2.2.5. Wall Heat Transfer
The heat flux at the wall, , is calculated using Equation (3):
where is the fluid-side heat transfer coefficient; for turbulent flows, this is calculated using the default temperature wall functions implemented in Ansys Fluent (which are based on [29]). is the user-specified fixed wall temperature, and is the temperature of the fluid cell adjacent to the wall. The housing of the AIE 225CS was liquid cooled while the rotor was air cooled, and so different fixed wall temperatures were specified for the housing and rotor surfaces: 59 °C and 100 °C, respectively. These values correspond to the maintained liquid coolant temperature and the air cooling circuit temperature at the rotor inlet, which were recorded during engine testing at this operating point. More details on the cooling system can be found in [30].
3. Results
This section first validates the CFD model against experimental test data and then proceeds to describe the detailed simulation results.
3.1. Experimental Validation
The engine test data used here were collected at the University of Bath and were previously published [22,31,32]. The following subsections discuss the test data used to validate the CFD model for both motored and fired operation.
3.1.1. Motored Operation
In the motoring analysis reported in [32], a dynamometer was used to motor the AIE 225CS rotary engine in order to evaluate frictional losses. The resulting test data were useful here as a means to validate the compression and expansion phases predicted by the CFD model before introducing the complexities of combustion. Figure 4a compares the instantaneous chamber pressure predicted by the LES model against test data for one cycle at 4000 rpm (output shaft speed), at 93% open throttle. Looking more closely, Figure 4b shows that very good correlation was achieved, with peak pressure predicted to within 17 kPa (∼0.9%) and its timing to within ∼2.5° of the output shaft angle (which corresponds to less than 1° of the rotor angle). This gives good confidence that the processes of gas exchange, compression, and expansion were correctly modelled.
3.1.2. Fired Operation
Figure 5a compares the measured and simulated chamber pressures over a cycle, for the same operating point (4000 rpm, 93% throttle), but now for fired operation.
Now, some clearer differences appear between the measured and simulated pressures as a result of combustion. To support the analysis, Figure 6 additionally reports the rate of heat release and cumulative heat release 120° before and after the top dead centre (firing).
Looking closely at the end of the compression phase in Figure 5b and Figure 6, the measured pressure rise clearly slows down from about a −20° output shaft angle, whereas there is no such pause in the simulated pressure rise. This point in the cycle aligns with the ignition timing at −18°. The rate of heat release (ROHR) trace shows that experimental heat release is initially slower than in the simulation, which accounts for the growing discrepancy in chamber pressure. The experimental ROHR then accelerates faster than in simulation, which results in the steeper engine test pressure trace immediately before TDCf. The discrepancy between the simulation and test is likely due to differences in ignition delay, i.e., the simulated pressure rise implies a shorter ignition delay than in reality. Obtaining a closer match would require revisiting the modelling of the ignition process and the combustion model.
The simulation also over-predicts the peak combustion pressure by ∼120 kPa (∼4%) at ∼28°ATDC; this is ∼5° output shaft angle (less than 2° rotor angle) later than that observed in the test data. The test data also show a faster decline in pressure, starting at ∼65° in Figure 5b and Figure 6. This eventually grows to a difference in pressure of ∼36% by the time of exhaust port opening, near an output shaft angle of 210° in Figure 5a. Some of the over-prediction of pressure during expansion can be attributed to the simplified modelling of wall heat transfer. As mentioned in Section 2.2.5, the model applies fixed wall temperatures to the housing and rotor surfaces, based on measured temperatures in the respective cooling circuits. It is thus suggested that these temperature settings do not fully account for the higher level of heat transfer observed during experimental testing. Another factor concerns the resolution of the near-wall mesh, which is not especially fine (due to the computational cost of the moving mesh) and therefore struggles to properly capture the correct heat transfer rate. Nevertheless, the authors propose that these comparisons demonstrate that the CFD model is quite well validated at a performance level and that this offers sufficient confidence to proceed with an analysis of the flow structures and flame propagation in the combustion chamber; we turn to these next.
3.2. Turbulence Generation during the Intake Phase
Figure 7a provides a snapshot of the velocity vectors during the intake process, at 360° output shaft angle BTDCf. As the gas enters through the intake port, it experiences a sudden expansion (Figure 7b) before impacting the rotor surface, generating vortices in both the leading and trailing edge regions of the chamber. The turbulent flow structures generated during the intake phase play an important role in combustion later in the cycle; the next subsection describes the method used to track such features.
3.3. Tracking Turbulent Flow Structures Using the Q-Criterion
As shown in Equation (4), the Q-criterion (originally proposed by Hunt et al. [33]) subtracts the symmetric (rate of strain, S) from the anti-symmetric (vorticity, ) components of the velocity gradient:
Thus, a region of the flow field with a relatively high Q-criterion indicates greater vorticity than strain, i.e., Q-criterion hotspots can be used to identify vortices. Indeed, the Q-criterion has previously been combined with detached eddy simulations to study turbulent characteristics [17] and has been evaluated for its vortex detection ability [34].
Here, Figure 8a shows how the Q-criterion increases toward the centre of the major vortices formed in the chamber velocity field (Figure 8b) during the intake phase.
Meanwhile, Figure 9 shows that regions with a high Q-criterion and sub-grid turbulent viscosity compare quite well. Crucially, though, sub-grid turbulent viscosity is dependent on the local mesh resolution (and is only truly comparable where resolution is uniform). Where the mesh becomes finer, such as along the rotor surface, Figure 9a indicates some small Q-criterion hotspots. These do not show up as patches of higher sub-grid turbulent viscosity in Figure 9b, underscoring the Q-criterion as the superior metric for vortex identification.
The Q-criterion also permits the three-dimensional shape of vortices to be visualised by calculating iso-surfaces. The tighter an iso-surface encapsulates a vortex core, the stronger it is and the longer it will take for it to dissipate. So, in Figure 10, as iso-surfaces are drawn for higher Q-criterion values, the less intense vortices disappear. As a compromise between isolating a reasonable number of structures while allowing the identification of individual vortices, going forward, Q-criterion iso-surfaces will be drawn for (Figure 10b).
In making use of Q-criterion iso-surfaces and now coloured based on the velocity magnitude, one can clearly see in Figure 11a the existence of powerful twin vortices initiated by the upstream throttle plate. These propagate through the intake port before starting to dissipate inside the chamber (in Figure 11b). Vortices with the longest length scales are observed during the intake phase of the cycle, at an output shaft angle of approximately 160°. These break up into numerous smaller structures as the intake flow slows down (Figure 11c).
Once the intake port shuts and compression begins (left side of Figure 12), the vortices dissipate further, becoming shorter in length. Yet, there remain numerous vortical strands, right up until the point of ignition (right side of Figure 12). These should promote flame development once the charge ignites.
After ignition and during the expansion phase, Figure 13 shows that the previous vortical strands have now dissipated and only a few, very small vortex pockets remain at the same level of Q-criterion, near the rotor surface.
3.4. Flame Propagation
Flame propagation was visualised here by tracking the mass fraction of CO2 as combustion proceeded. The twin spark plugs fire at 18° BTDC (equivalent to 522° output shaft angle) and initially separate flame fronts emanate from each spark plug shortly thereafter (see Figure 14a at 530° output shaft angle). These travel in the direction of rotation and merge close to the TDC (540°, Figure 14b). At 576°, or equivalently 36° ATDC (Figure 14c), the flame front has almost reached the rotor leading edge. In contrast, flame propagation rearward, i.e., toward the trailing edge, is inhibited by the “pinch point” between the rotor and housing, leaving an unburnt pocket at the trailing edge (Figure 14d). This remains unburnt throughout the expansion phase (Figure 14e) since the chamber is expanding faster than the rearward flame travel and is still being consumed at the start of the exhaust phase (Figure 14f). This mechanism explains why Wankel rotary engines can suffer from relatively high HC emissions and combustion inefficiency.
3.5. Assessing the Likelihood of Knock
The elongated shape of the combustion chamber in a Wankel rotary engine means that the flame has further to travel for a given chamber volume compared to reciprocating piston engines. This raises the concern for the autoignition of the end gas, i.e., knock, particularly in the region near the rotor trailing edge where, as has just been shown, the flame struggles to reach. However, the simplified combustion modelling approach described in Section 2.2.4 employs a single-step global reaction, i.e., it does not simulate the multitude of intermediate reaction mechanisms and the potential formation of knock pre-cursors.
Instead, a closed homogeneous reactor model in Ansys Chemkin-Pro was used to examine the likelihood of knock at the simulated conditions by imposing the end-gas temperature and pressure observed in the combustion chamber near the rotor trailing edge (the approximate location relative to the rotor is identified in Figure 15a). The state of the end gas was sampled at ∼0.3 ms intervals between the start of compression at intake port closing (Figure 15a) and exhaust port opening (Figure 15d). Additionally, Figure 15b,c show the temperature contours at TDCf and partway through the expansion, respectively.
The gasoline PRF (primary reference fuel) model for the spark ignition simulations of knocking and emissions available in Ansys Chemkin-Pro [35] was employed as the chemistry set. This represents gasoline as a two-component PRF, allowing for 178 species suitable for both high- and low-temperature reactions. This mechanism is a reduced version of a much larger kinetic mechanism with ∼4000 species that was validated against experimental data coming out of the Model Fuels Consortium [36]. The fuel mixture in the reactor model was defined as a PRF of 100% iso-octane (0% n-heptane) at a unity equivalence ratio.
Figure 16 shows the mole fractions of fuel, oxygen, the OH radical (a key knock pre-cursor), and water, corresponding to the sampled end-gas temperature history (blue broken line), as well as, for comparison, a case where the end-gas temperature was doubled (red broken line). The peak temperature attained in the end gas was 659 K (1000/T = 1.52 K−1), where ignition delay times for the stoichiometric iso-octane–air mixture were relatively long, in the order of 10 ms (equivalent to a 240° output shaft angle at 4000 rpm) or more [37]. Indeed, this temperature is not high enough for any OH production or fuel conversion, so knock should not be expected at the simulated conditions. In stark contrast, if the temperature of the end gas were to double, it would experience a spike in OH production close to TDCf, at which time Figure 15b shows that the flame would be contained in the leading end of the combustion chamber, i.e., knock would most likely occur.
4. Discussion of Efficiency Enhancement Technologies
To address the relatively poor fuel efficiency of Wankel rotary engines, this section discusses the initial simulation of two efficiency enhancement technologies: (i) pre-chamber jet ignition and (ii) the two-stage rotary engine.
4.1. Pre-Chamber Turbulent Jet Ignition
As noted in the previous section, flame propagation in Wankel engines is hampered by the presence of the “pinch point” and the elongated shape of the combustion chamber, demonstrating a propensity to leave unburnt pockets in its corners. A pre-chamber turbulent jet ignition (TJI) system arranges a highly ignitable mixture in a small chamber separated from the main combustion chamber by a port or throat. Once ignited, the pre-chamber generates high-velocity and high-temperature jets, which pass into the main chamber and ensure the ignition of the (overall lean) charge. In this way, TJI is an enabler for lean burn and the thermal efficiency benefits it brings. Using qualitative simulations, the following subsections explore the viability of both passive and active pre-chamber ignition to promote and accelerate flame spreading in Wankel engines.
4.1.1. Challenges for Pre-Chamber Turbulent Jet Ignition in Wankel Rotary Engines
While turbulent jet ignition has been successfully designed for and evaluated in reciprocating engines [38,39], its translation into Wankel rotary engines imposes a number of challenges. These were addressed here by introducing some innovative design modifications. As a starting point, Figure 17a shows an initial geometry configuration for implementing TJI in the Wankel engine model (Figure 17b). The pre-chamber design is similar to that used in reciprocating engines and was inspired by the configuration used by Boretti et al. [14].
One challenge concerns the introduction of the turbulent jets into the prevailing flow structure inside the main combustion chamber. In order to compare Wankel and reciprocating piston engines in this regard, a simplified model of jet ignition in the latter was also simulated (Figure 18), in addition to the Wankel engine geometry in Figure 17.
In the case of the reciprocating engine, at the time of fuel injection, the piston is moving increasingly slow as it decelerates toward TDC at the end of the compression stroke. The fluid velocities around the pre-chamber nozzles are correspondingly low but are oriented toward the entrance to the pre-chamber, i.e., reasonably well aligned with the nozzles, through which the flow accelerates, as shown by the LES results in Figure 19a. In contrast, the general flow direction in the combustion chamber of the Wankel engine is across the entrance to the pre-chamber, and with a higher velocity. In the current configuration, the charge strikes the nozzle entry at a steep angle (Figure 19b). This will reduce the effective flow area and generate a significant pressure drop across the nozzle.
A further challenge concerns the ability to effectively scavenge the pre-chamber volume. In a conventional four-stroke reciprocating engine, the pre-chamber will experience the same cycle as the main combustion chamber (intake, compression, combustion/expansion, exhaust) and can be scavenged at the same time. In a Wankel rotary engine, however, the same part of the housing serves all three rotating chambers, so the pre-chamber shown in Figure 17 will continually experience compression–combustion, compression–combustion, and so on. It is likely that combustion products will remain in the pre-chamber with no real opportunity for them to be scavenged, at least in this configuration. On top of the lack of scavenging, a related issue is the build-up of heat in the pre-chamber, which could ultimately lead to overheating or the pre-chamber acting as a pre-ignition hotspot.
4.1.2. Pressure-Connected Pre-Chambers for Active Scavenging and Cooling
To address the scavenging problem experienced by a pre-chamber located in the housing just upstream of the TDC (Figure 17), a pair of connected pre-chambers can instead be placed in the housing on either side of TDC, as shown in Figure 20a. Each pre-chamber will fire its own turbulent jets into the main chamber at the optimal time. This combination should achieve increased flame spread and thus better combustion efficiency than a single pre-chamber. In this novel design, the presence of a connecting passage between pre-chambers means that there will be a point in the cycle when neighbouring main chambers will be in communication through the passage, since their shared apex will lie between the two pre-chamber nozzles (Figure 20b). The purpose of this is to take advantage of the pressure difference between neighbouring chambers to actively scavenge the leading chamber of combustion products using the compressed (and cooler) air from the following chamber.
The simulation result shown in Figure 20b shows the mass fraction of CO2 in both the chamber and connected passage before scavenging takes place, i.e., with the passage control valve closed. At this point in time, it will be noticed that the majority of the pre-chamber passage is filled with combustion products (high CO2 mass fraction), but these correspond to the previous combustion event. As we move forward in time, the exhaust port (not shown) will be revealed to the left chamber, and so the pressure in that chamber will begin to fall. Meanwhile the pressure in the right chamber is increasing due to compression. As soon as the pressure in the right chamber exceeds that in the left, the passage control valve is opened, allowing fresh charge into the pre-chamber and forcing out the burnt gases. The simulation results of this process are shown in three successive steps in Figure 21a. The passage then remains open during the combustion event to allow the pressure in the two pre-chamber nozzles to be balanced so that both chambers generate turbulent jets of similar attributes. The control valve closes before the next rotor apex passes the right pre-chamber nozzle in order to prohibit hot combustion products from entering the next chamber and igniting the fresh charge. So, in this method of operation, the gas in the connecting passage should always flow in the same direction (i.e., from right to left in Figure 21b). This should additionally enable some degree of cooling of both pre-chambers. Active scavenging also supports the flushing out of lubricating oil and carbon build-up.
Figure 21b shows, qualitatively, how the twin pre-chamber concept also provides good combustion performance. Ignition takes place in both pre-chambers with two jets generated simultaneously and directed toward both the leading and trailing ends of the combustion chamber. This creates two flame fronts that quickly coalesce and, crucially, reach both apexes, thereby avoiding unburnt pockets.
In this way, applying turbulent jet ignition to Wankel rotary engines would mitigate the combustion issues stemming from the elongated shape of the combustion chamber and a relatively low flame speed. But jet ignition does not address the relatively low compression ratios typical of Wankel engines; this is explored in the next section.
4.1.3. The Two-Stage Rotary Engine
The compression and expansion ratios in a Wankel rotary engine are constrained by its physical shape, which is described using the eccentricity-to-generating radius ratio, , as shown in Figure 22a. A relatively high ratio of (Figure 22b) results in a very pinched waist, preventing a very small minimum volume. Conversely, for a much lower ratio of (Figure 22c), the chamber volume remains relatively small even when fully expanded. Finally, Figure 22d shows the optimal choice of ratio, but this is still limited to a compression ratio of about 9, ultimately constraining the achievable thermal efficiency.
So, taking inspiration from the Rolls-Royce “Cottage Loaf” concept [41], this section assesses the potential of a two-stage rotary engine to raise the overall compression ratio and thus the thermal efficiency. The CFD model outline is shown in Figure 23. Again, LES was used, but it should be noted that due to the authors’ constrained computational resources and the requirement to simulate six chambers at once (instead of just one), the mesh resolution employed here was not sufficiently refined to provide reliable quantitative predictions. The aim of this qualitative study was to highlight the potential of the concept as an enabler for efficiency improvement.
The two-stage concept also addresses another limitation of the peripherally ported Wankel engine: the potential for fuel blow-through during port overlap. When the rotor is at or near the bottom dead centre, the intake and exhaust ports are physically connected, as shown in Figure 24. As such, the fresh charge can pass directly into the exhaust without being combusted, with consequent increases in fuel consumption and unburnt hydrocarbon emissions. Although separating the ports can reduce or entirely remove the period of overlap [9,42], the ports should not be moved too far apart since this will reduce the effective compression and expansion ratios and thus the thermal efficiency. The two-stage concept does not necessarily eliminate overlap, but the use of direct fuel injection in the intake transfer port (see Figure 23) prevents the fuel blow-through problem from arising. In the model used here, since the compression ratio was no longer limited to that attainable with a single stage, the ports were positioned far enough apart so as to avoid overlap altogether.
In the two-stage rotary concept in Figure 23, combustion only takes place in the high-pressure stage, the geometry of which is based on the AIE 225CS Wankel engine used earlier in this article. The low-pressure stage is a scaled-up version of the high-pressure stage geometry; this acts as a compressor and expander. Air enters through the intake port into the low-pressure chamber and is compressed by the low-pressure rotor. It then passes through the intake transfer port, where fuel is injected (gasoline in this simulation study), and enters the high-pressure chamber. The air–fuel mixture is further compressed by the high-pressure rotor and ignited. The resulting combustion gases are expanded first in the high-pressure stage, before passing through the exhaust transfer port into the low-pressure stage where they are expanded again, before leaving through the exhaust port.
The low-pressure and high-pressure rotors both generate power and rotate at the same speed and in the same direction (and would be synchronised using a belt or chain in practice). It is difficult to calculate the overall compression ratio based on geometry alone due to complex interactions between the rotors and chambers, but the simulation affords a comparison of the density of the gas in the chamber at the point of the intake point closing and that at the point of maximum compression; this suggests an overall compression ratio of about 10. While this might appear quite conservative, this safely exceeds the compression ratio of the single-stage Wankel engine on which it is based. To achieve higher compression ratios in the two-stage arrangement, the geometrical scale factor between the low- and high-pressure stages can be increased.
Referring again to Figure 23, fuel injection takes place in the intake transfer port, in which air is flowing at high velocity as it leaves the low-pressure stage. Figure 25a shows that the injected fuel does not initially mix completely with the transfer port air and remains concentrated in a jet. Once this enters the high-pressure chamber, more mixing occurs (Figure 25b–d). As the chamber of interest approaches TDC, but well in advance of ignition, a homogeneous mixture appears to have been achieved (Figure 25e).
Note that the modelling of fuel injection assumes the fuel to be in a gas phase; this is to avoid computationally demanding multi-phase simulations. In reality, the injection of a liquid fuel would generate a discrete spray, and the subsequent mixing will be somewhat different, while fuel evaporation would cool the incoming charge to improve the volumetric efficiency of the high-pressure stage.
In this two-stage concept, the rotor surface does not need to be extremely close to the housing while still achieving a high compression ratio. This alleviates the inhibiting effect on flame propagation of the pinch point, which may be observed in Figure 26.
The two-stage concept is not without drawbacks, however. Two stages will be twice as large (or more) than a single stage, with a corresponding increase in weight. Using two stages implies a transfer process between them, and this imposes additional pumping losses. In other words, the combined isentropic efficiency of the compression processes will be lower than in a single-stage rotary engine at an equivalent compression ratio. In addition, the compression inefficiency due to the transfer port manifests as a rise in temperature of the charge in the high-pressure chamber. In the current concept, that charge will contain fuel, and an increase in its temperature raises its propensity to knock. This ultimately limits the maximum compression ratio (and thus efficiency) achievable. Mitigating steps might include charge cooling being applied to the transfer port or applying water injection into the high-pressure stage, both at the cost of additional components. So, overall, while there should be useful efficiency gains from the two-stage system, there are clear penalties in terms of size, weight, and complexity, which may preclude its use as a range extender powerplant, though it may still be suitable as a primary power source in vehicles.
5. Conclusions
Wankel rotary engines are known for their high power density, low weight, simplicity, and excellent NVH characteristics, but have traditionally struggled with high fuel consumption and thus CO2 emissions. This is due, in large part, to the lack of understanding of the complex in-chamber fluid flow structures and combustion process, especially when compared to those of conventional four-stroke reciprocating engines, suggesting that there may be significant opportunities for thermal efficiency improvement. This study improves our understanding of the in-chamber flow phenomena and flame propagation in a production Wankel rotary engine and puts forward two efficiency enhancement concepts.
5.1. 3D CFD Modelling of Wankel Rotary Engines
3D CFD modelling of the AIE 225CS Wankel rotary engine revealed the following:
- Modelling the combustion chamber of a Wankel rotary engine using 3D CFD is not straightforward because it undergoes large changes in shape across an engine cycle, compared to a reciprocating piston engine. This research employed a bespoke dynamic meshing method to recreate the time-varying chamber volume and continuously changing shape, with the simulation results of the chamber pressure achieving very good validation against experimental test data. Although challenging, we may thus conclude that commercial 3D CFD software (in this case Ansys Fluent R19.2) can faithfully simulate the compression, expansion, and gas exchange processes in a Wankel engine.
- In comparison to RANS CFD, LES offers more realistic modelling of turbulence production and dissipation and thus better predictions of the time-varying flow structures in a Wankel rotary engine. Resolving the complexity of these flow structures is essential for revealing the process of air–fuel mixture formation in the compression phase of the cycle; hence, we conclude that LES simulations are required for sufficiently accurate performance and emission predictions.
- Overall, Wankel engine performance and emissions are limited by some key design considerations. Combustion efficiency is primarily constrained by the “pinch point” and the elongated combustion chamber shape near TDC, as well as the flame speed, which is low relative to the combustion chamber length; these factors can give rise to regions of unburnt air–fuel mixture. While promotion of fuel blow-through due to port overlap is also detrimental for hydrocarbon emissions, it is of secondary importance here since it is not inherent in rotary engines and may be mitigated or avoided through design changes. Meanwhile, thermal efficiency is constrained by relatively low compression ratios, which are an unavoidable consequence of rotary engine geometry.
5.2. Addressing the Limiting Factors of Wankel Rotary Engines
To address the limiting factors of Wankel rotary engines, we considered the following:
- Turbulent jet ignition applied to Wankel rotary engines has the potential to mitigate the combustion issues stemming from the elongated shape of the combustion chamber and a relatively low flame speed. However, it is not sensible to apply jet ignition without considering the fundamental differences between reciprocating and rotary engines. While the novel twin pre-chamber concept introduced and simulated here adds some complexity in the form of a connecting passage and its valve control, as well as a second nozzle, this configuration offers an implementation of pre-chamber turbulent jet ignition in Wankel rotary engines that improves combustion efficiency while avoiding the pitfall of poor pre-chamber scavenging.
- A two-stage rotary engine, modelled on the Rolls-Royce “Cottage Loaf” prototype, affords the following advantages over a single-stage Wankel engine: (i) higher compression ratio and thus higher thermal efficiency; (ii) design freedom to avoid overlap between intake and exhaust ports, eliminating charge blow-through into the exhaust; and (iii) a larger gap between the rotor and housing (because the system can afford to have a decreased compression ratio), which has been shown to help flame propagation across the pinch point. However, the increase in charge temperature due to two stages of compression and the losses imposed by the transfer port constrain the maximum realisable compression ratio due to raised knock propensity (when operating on gasoline); charge cooling would be beneficial for this reason. The two-stage design would also impose additional weight and packaging requirements. Such attributes would not seem to align with the goal for a small and lightweight range extender, but could be acceptable if used as the primary source of power.
5.3. Recommendations for Future Work
This paper reported a simulation study of the internal fluid flow and flame propagation in a Wankel rotary engine and considered novel design concepts to address the identified limitations. These concepts were also simulated, but in a basic form due to computational resource constraints. Future work suggestions are in large part aimed at improving the simulation fidelity, and they are as follows:
- The simulated ignition event is highly sensitive to local mesh refinement. But it would not be very computationally efficient to specify the level of mesh refinement required to faithfully capture ignition across the entire domain. This suggests a good use case for adaptive mesh refinement (AMR), which will locally refine (or coarsen) the mesh according to user-defined criteria, e.g., vorticity, reaction rate, or other parameters pertinent to the problem under investigation. AMR should of course be implemented in future model improvements; it was not included in the currently reported work since, in the authors’ experience, combining dynamic meshing (for chamber motion) and adaptive mesh refinement proved problematic during simulation execution.
- Due to aforementioned computational power constraints, the combustion simulations used a highly simplified approach. These could be repeated, specifying a set of reactions and species that would enable the prediction of exhaust emissions to an accuracy in line with engine dynamometer testing (which would provide validation data).
- Wankel rotary engines are known for their high power density, but it would be useful to explore the potential of turbocharging to raise the power density even further. Turbocharging can be easily simulated at a basic level through appropriate modifications of the intake and exhaust boundary conditions.
- The pre-chamber jet ignition concept simulations should be repeated with a finer mesh resolution to enable a quantitative assessment of the technology, with a focus on specifying an experimental investigation.
Author Contributions
Conceptualisation, X.S. and A.W.C.; methodology, X.S.; software, X.S.; validation, X.S. and A.W.C.; formal analysis, X.S.; investigation, X.S.; resources, A.W.C.; data curation, X.S.; writing—original draft preparation, A.W.C.; writing—review and editing, A.W.C.; visualisation, X.S.; supervision, A.W.C.; project administration, A.W.C. All authors have read and agreed to the published version of the manuscript.
Funding
This research received no external funding. The APC was waived.
Data Availability Statement
The data presented in this study are available on request from the corresponding author due to reasons of commercial sensitivity.
Acknowledgments
The authors gratefully acknowledge the support of Advanced Innovative Engineering (UK) Limited, Lichfield, UK, for the supply of engine geometry used in the CFD analysis and test data used for model validation.
Conflicts of Interest
The authors declare that the research was conducted in the absence of any commercial or financial relationships that could be construed as a potential conflict of interest.
Nomenclature
| Roman symbols | |
| e | Eccentricity |
| h | Heat transfer coefficient |
| j | Temporal index |
| N | Number of sample points |
| Q | Q-criterion |
| p | Pressure |
| q | Heat flux |
| R | Generating radius |
| S | Rate of strain |
| T | Temperature |
| Greek symbols | |
| Output shaft angle | |
| Vorticity | |
| Subscripts | |
| f | Fluid |
| VA | Volume average |
| w | Wall |
| Abbreviations | |
| ABDC | After bottom dead centre |
| ACEA | European Automobile Manufacturers’ Association |
| AIE | Advanced Innovative Engineering |
| ATDC(f) | After top dead centre (firing) |
| BBDC | Before bottom dead centre |
| BEV | Battery electric vehicle |
| BSFC | Brake specific fuel consumption |
| BTDC(f) | Before top dead centre (firing) |
| CFD | Computational fluid dynamics |
| DES | Detached eddy simulation |
| EFTA | European Free Trade Association |
| FCEV | Fuel cell electric vehicle |
| HC | Hydrocarbon |
| HEV | Hybrid electric vehicle |
| HPC | High-performance computing |
| IC | Internal combustion |
| KI | Knock index |
| LES | Large eddy simulation |
| MAVPO | Mean absolute value of pressure oscillations |
| NVH | Noise, vibration, harshness |
| ORC | Organic Rankine cycle |
| OSA | Output shaft angle |
| PRF | Primary reference fuel |
| RANS | Reynolds-averaged Navier–Stokes |
| REEV | Range-extended electric vehicle |
| ROHR | Rate of heat release |
| SPARCS | Self-pressurizing air rotor cooling system |
| TDC(f) | Top dead centre (firing) |
| TJI | Turbulent jet ignition |
| UAV | Unmanned aerial vehicle |
References
- ACEA. New Car Registrations: +13.9% in 2023; Battery Electric 14.6% Market Share. Available online: https://www.acea.auto/pc-registrations/new-car-registrations-13-9-in-2023-battery-electric-14-6-market-share/ (accessed on 9 February 2024).
- Weymar, E.; Finkbeiner, M. Statistical Analysis of Empirical Lifetime Mileage Data for Automotive LCA. Int. J. Life Cycle Assess. 2016, 21, 215–223. [Google Scholar] [CrossRef]
- Kapoor, P.; Costall, A.W.; Sakellaridis, N.; Lammers, R.; Buonpane, A.; Guilain, S. Multi-Objective Optimization of Turbocharger Turbines for Low Carbon Vehicles using Meanline and Neural Network Models. Energy Convers. Manag. X 2022, 15, 100261. [Google Scholar] [CrossRef]
- Emissions Analytics. The Inevitability of Hybridisation? Available online: https://www.emissionsanalytics.com/news/the-inevitability-of-hybridisation (accessed on 9 February 2024).
- Ziółkowski, A.; Fuć, P.; Jagielski, A.; Bednarek, M.; Konieczka, S. Comparison of the Energy Consumption and Exhaust Emissions between Hybrid and Conventional Vehicles, as well as Electric Vehicles Fitted with a Range Extender. Energies 2023, 16, 4669. [Google Scholar] [CrossRef]
- Yamamoto, K. Rotary Engine; Sankaido Co., Ltd.: Tokyo, Japan, 1981. [Google Scholar]
- Uefuji, W.; Nishigouchi, K.; Okada, J.; Matsuda, Y.; Nobumoto, S.; Sato, M. Introduction of MX-30 Rotary-EV. Maz. Tech. Rev. 2023, 40, 47–51. [Google Scholar]
- Morimoto, H.; Miyamoto, T.; Nakajima, K.; Kikuchi, T.; Tanaka, K.; Sunagare, Y.; Nomoto, T.; Wakabayashi, Y. Combustion Technology for 8C New Rotary Engine. Maz. Tech. Rev. 2023, 40, 52–58. [Google Scholar]
- Turner, J.W.G.; Turner, M.; Islam, R.; Shen, X.; Costall, A.W. Further Investigations into the Benefits and Challenges of Eliminating Port Overlap in Wankel Rotary Engines. SAE Int. J. Adv. Curr. Pract. Mobil. 2021, 4, 32–51. [Google Scholar] [CrossRef]
- Garrett Motion Inc. World’s First Commercial Diesel Engine with Brake Thermal Efficiency above 50% Launched by Weichai, Boosted by Garrett. Available online: https://www.garrettmotion.com/news/newsroom/article/worlds-first-commercial-diesel-engine-with-brake-thermal-efficiency-above-50-launched-by-weichai-boosted-by-garrett/ (accessed on 9 February 2024).
- Turner, M.; Turner, J.W.G.; Vorraro, G. Mass Benefit Analysis of 4-Stroke and Wankel Range Extenders in an Electric Vehicle over a Defined Drive Cycle with Respect to Vehicle Range and Fuel Consumption; SAE Technical Paper 2019-01-1282; SAE International: Warrendale, PA, USA, 2019. [Google Scholar] [CrossRef]
- Shi, C.; Ji, C.; Wang, S.; Yang, J.; Ma, Z.; Xu, P. Assessment of Spark-Energy Allocation and Ignition Environment on Lean Combustion in a Twin-Plug Wankel Engine. Energy Convers. Manag. 2020, 209, 112597. [Google Scholar] [CrossRef]
- Spreitzer, J.; Zahradnik, F.; Geringer, B. Implementation of a Rotary Engine (Wankel Engine) in a CFD Simulation Tool with Special Emphasis on Combustion and Flow Phenomena; SAE Technical Paper 2015-01-0382; SAE International: Warrendale, PA, USA, 2015. [Google Scholar] [CrossRef]
- Boretti, A.; Jiang, S.; Scalzo, J. A Novel Wankel Engine Featuring Jet Ignition and Port or Direct Injection for Faster and More Complete Combustion Especially Designed for Gaseous Fuels; SAE Technical Paper 2015-01-0007; SAE International: Warrendale, PA, USA, 2015. [Google Scholar] [CrossRef]
- Sadiq, G.; Tozer, G.; Al-Dadah, R.; Mahmoud, S. CFD Simulations of Compressed Air Two Stage Rotary Wankel Expander—Parametric Analysis. Energy Convers. Manag. 2017, 142, 42–52. [Google Scholar] [CrossRef]
- Celik, I.; Yavuz, I.; Smirnov, A. Large Eddy Simulations of In-Cylinder Turbulence for Internal Combustion Engines: A Review. Int. J. Engine Res. 2001, 2, 119–148. [Google Scholar] [CrossRef]
- Zhang, Y.; Liu, J.; Zuo, Z. The Study of Turbulent Fluctuation Characteristics in a Small Rotary Engine with a Peripheral Port based on the Improved Delayed Detached Eddy Simulation Shear-Stress Transport (IDDES-SST) Method. Energies 2018, 11, 642. [Google Scholar] [CrossRef]
- Spalart, P.R.; Jou, W.H.; Strelets, M.; Allmaras, S.R. Comments on the Feasibility of LES for Wings, and on a Hybrid LES/RANS Approach. In Proceedings of the First AFOSR International Conference on DNS/LES, Ruston, LA, USA, 4–8 August 1997; pp. 137–147. [Google Scholar]
- Poojitganont, T.; Sinchai, J.; Watjatrakul, B.; Berg, H.P. Numerical Investigation of In-Chamber Flow inside a Wankel Rotary Engine. Iop Conf. Ser. Mater. Sci. Eng. 2019, 501, 012043. [Google Scholar] [CrossRef]
- Advanced Innovative Engineering. 225CS—40BHP—Wankel Rotary Engine. Available online: https://www.aieuk.com/225cs-40bhp-wankel-rotary-engine (accessed on 8 February 2024).
- UK Research and Innovation. Reducing Vehicle Carbon Emissions through Development of a Compact, Efficient, and Intelligent Powertrain. Available online: https://gtr.ukri.org/projects?ref=113127 (accessed on 27 April 2024).
- Vorraro, G.; Turner, M.; Turner, J.G. Testing of a Modern Wankel Rotary Engine—Part I: Experimental Plan, Development of the Software Tools and Measurement Systems; SAE Technical Paper 2019-01-0075; SAE International: Warrendale, PA, USA, 2019. [Google Scholar] [CrossRef]
- Martini, H.; Montejano, L.; Oliveros, D. Bodies of Constant Width: An Introduction to Convex Geometry with Applications; Birkhäuser: Cham, Switzerland, 2019. [Google Scholar] [CrossRef]
- Shen, X.; Costall, A.; Turner, M.; Islam, R.; Ribnishki, A.; Turner, J.; Vorraro, G.; Bailey, N.; Addy, S. Large-Eddy Simulation of a Wankel Rotary Engine for Range Extender Applications. In Proceedings of the International Conference on Powertrain Systems for Net-Zero Transport, Institution of Mechanical Engineers, London, UK, 7–8 December 2021. [Google Scholar]
- Corti, E.; Forte, C.; Cazzoli, G.; Moro, D.; Falfari, S.; Ravaglioli, V. Comparison of Knock Indexes Based on CFD Analysis. Energy Procedia 2016, 101, 917–924. [Google Scholar] [CrossRef]
- Broatch, A.; Novella, R.; García-Tíscar, J.; Gomez-Soriano, J.; Pal, P. Investigation of the Effects of Turbulence Modeling on the Prediction of Compression-Ignition Combustion Unsteadiness. Int. J. Engine Res. 2022, 23, 541–559. [Google Scholar] [CrossRef]
- Nicoud, F.; Ducros, F. Subgrid-Scale Stress Modelling Based on the Square of the Velocity Gradient Tensor. Flow, Turbul. Combust. 1999, 62, 183–200. [Google Scholar] [CrossRef]
- Shen, X. Enhancing the Efficiency of a Rotary Thermal Propulsion System through Advanced Simulation Techniques. Ph.D. Thesis, University of Bath, Bath, UK, 2023. [Google Scholar]
- Launder, B.E.; Spalding, D.B. The Numerical Computation of Turbulent Flows. Comput. Methods Appl. Mech. Eng. 1974, 3, 269–289. [Google Scholar] [CrossRef]
- Bailey, N.; Louthan, L. The Compact SPARCS Wankel Rotary Engine. In Proceedings of the JSAE 2015 Congress, Yokohama, Japan, 20–22 May 2015; JSAE Technical Paper 20154346. Society of Automotive Engineers of Japan, Inc.: Tokyo, Japan, 2015. [Google Scholar]
- Vorraro, G.; Turner, J.W.G.; Brace, C.J. Testing of a Modern Wankel Rotary Engine—Part II: Firing Condition Analysis; SAE Technical Paper 2022-01-0592; SAE International: Warrendale, PA, USA, 2022. [Google Scholar] [CrossRef]
- Vorraro, G.; Turner, J.W.G.; Akehurst, S. Testing of a Modern Wankel Rotary Engine—Part III: Motoring Analysis; SAE Technical Paper 2022-01-0591; SAE International: Warrendale, PA, USA, 2022. [Google Scholar] [CrossRef]
- Hunt, J.C.R.; Wray, A.A.; Moin, P. Eddies, Streams, and Convergence Zones in Turbulent Flows. In Proceedings of the Summer Program; Center for Turbulence Research: Stanford, CA, USA, 1988; pp. 193–208. [Google Scholar]
- Zhan, J.M.; Li, Y.T.; Onyx Wai, W.H.; Hu, W.Q. Comparison Between the Q Criterion and Rortex in the Application of an In-Stream Structure. Phys. Fluids 2019, 31, 121701. [Google Scholar] [CrossRef]
- ANSYS, Inc. Ansys Chemkin-Pro Chemistry Simulation Software. Available online: https://www.ansys.com/en-gb/products/fluids/ansys-chemkin-pro (accessed on 27 April 2024).
- ANSYS, Inc. Ansys Model Fuel Library. Available online: https://www.ansys.com/en-gb/products/fluids/ansys-model-fuel-library (accessed on 17 April 2024).
- Fieweger, K.; Blumenthal, R.; Adomeit, G. Self-ignition of S.I. Engine Model Fuels: A Shock Tube Investigation at High Pressure. Combust. Flame 1997, 109, 599–619. [Google Scholar] [CrossRef]
- Cooper, A.; Harrington, A.; Bassett, M.; Reader, S.; Bunce, M. Application of the Passive MAHLE Jet Ignition System and Synergies with Miller Cycle and Exhaust Gas Recirculation; SAE Technical Paper 2020-01-0283; SAE International: Warrendale, PA, USA, 2020. [Google Scholar] [CrossRef]
- Bigalli, S.; Catalani, I.; Balduzzi, F.; Matteazzi, N.; Agostinelli, L.; Luca, M.D.; Ferrara, G. Numerical Investigation on the Performance of a 4-Stroke Engine with Different Passive Pre-Chamber Geometries using a Detailed Chemistry Solver. Energies 2022, 15, 4968. [Google Scholar] [CrossRef]
- Kelman, T. Wankel Rotary Engine: Epitrochoidal Envelopes. Available online: https://demonstrations.wolfram.com/WankelRotaryEngineEpitrochoidalEnvelopes/ (accessed on 7 February 2024).
- Feller, F. The 2-Stage Rotary Engine—A New Concept in Diesel Power. Proc. Inst. Mech. Eng. 1970, 185, 139–158. [Google Scholar] [CrossRef]
- Turner, J.W.G.; Turner, M.; Vorraro, G.; Thomas, T. Initial Investigations into the Benefits and Challenges of Eliminating Port Overlap in Wankel Rotary Engines; SAE Technical Paper 2020-01-0280; SAE International: Warrendale, PA, USA, 2020. [Google Scholar] [CrossRef]
Figure 1.
AIE 225CS Wankel engine on the small engine dynamometer at the University of Bath.
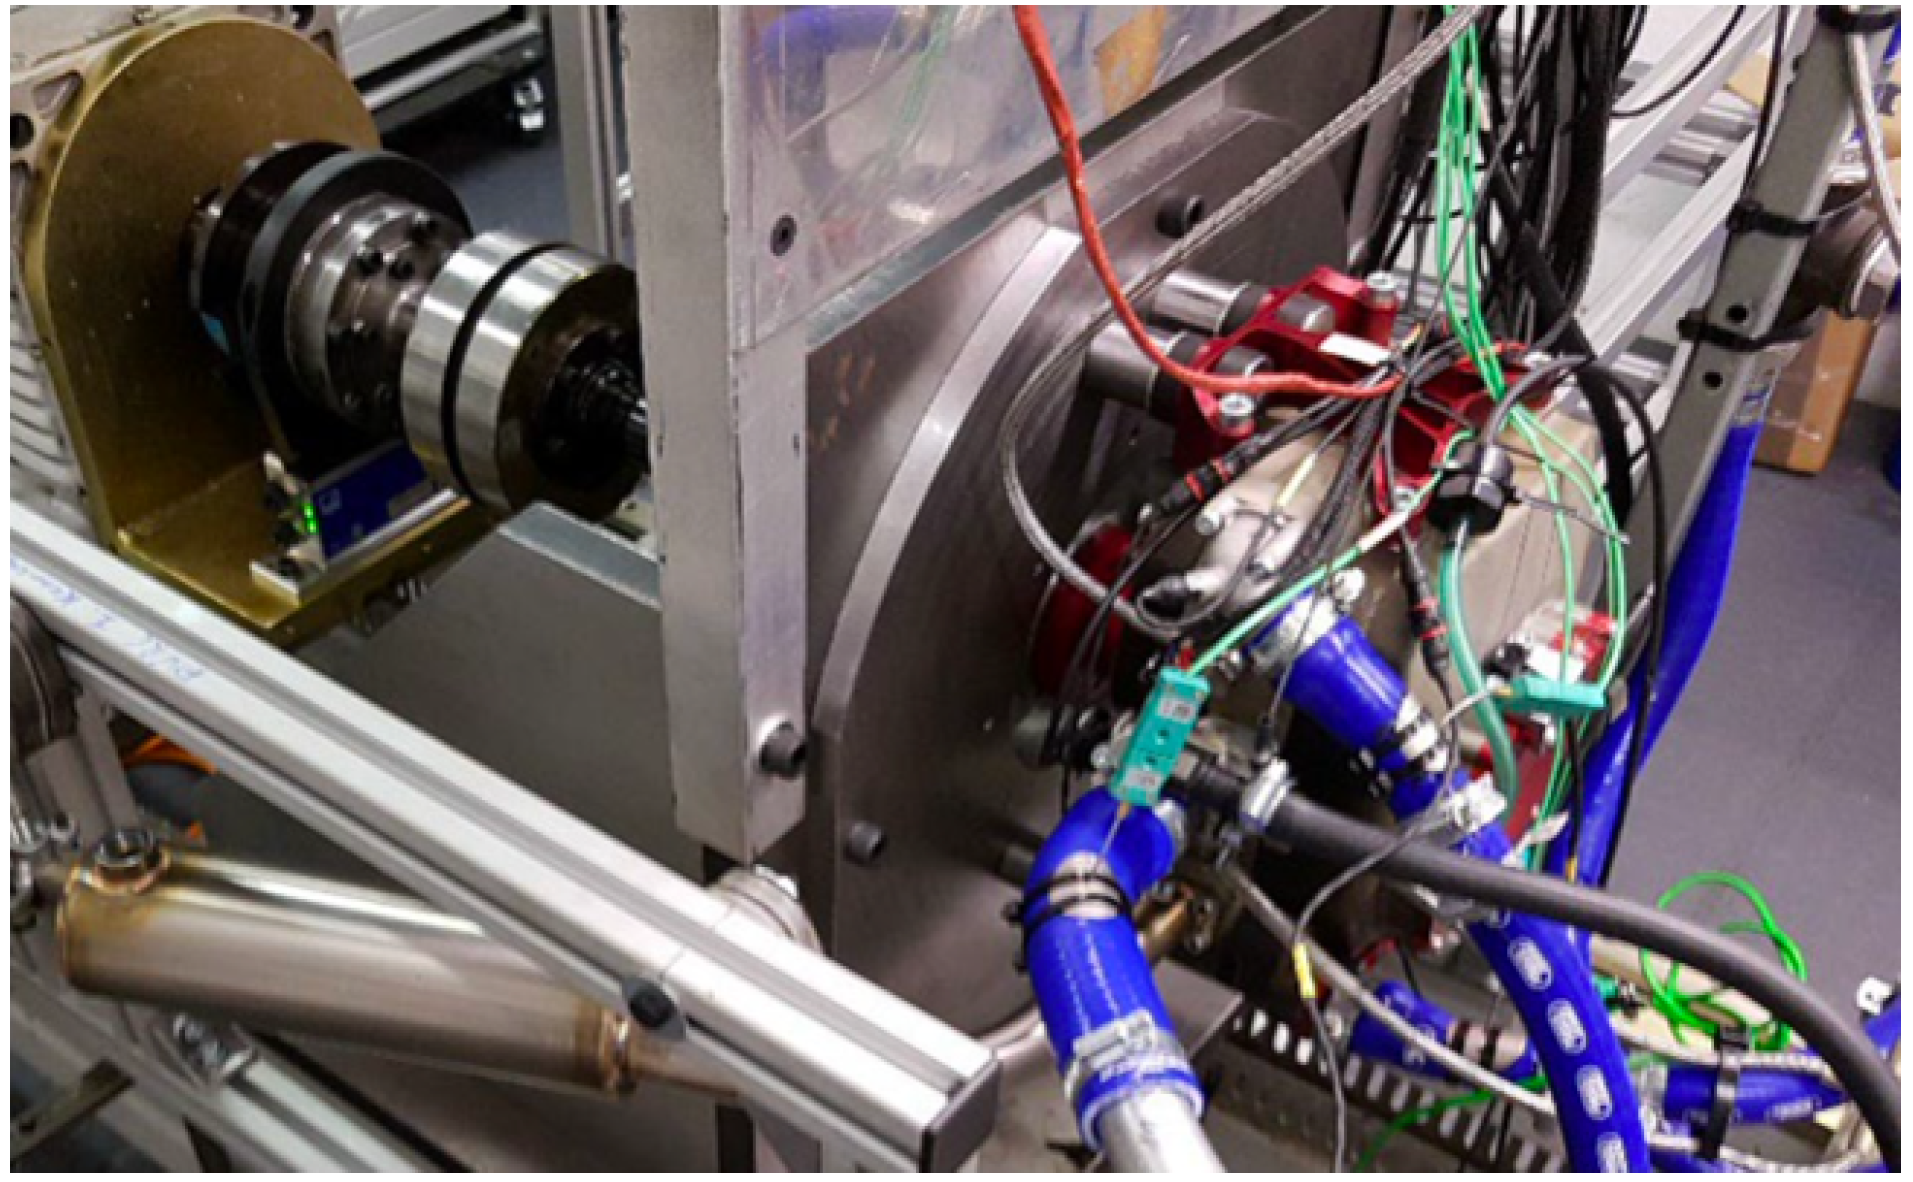
Figure 2.
Computational model: (a) 3D CFD chamber domain with surface definitions; (b) mesh becomes less refined away from the walls as the chamber expands during the intake phase.
Figure 2.
Computational model: (a) 3D CFD chamber domain with surface definitions; (b) mesh becomes less refined away from the walls as the chamber expands during the intake phase.

Figure 3.
Knock index as a function of cell size, used here to quantify mesh dependency.
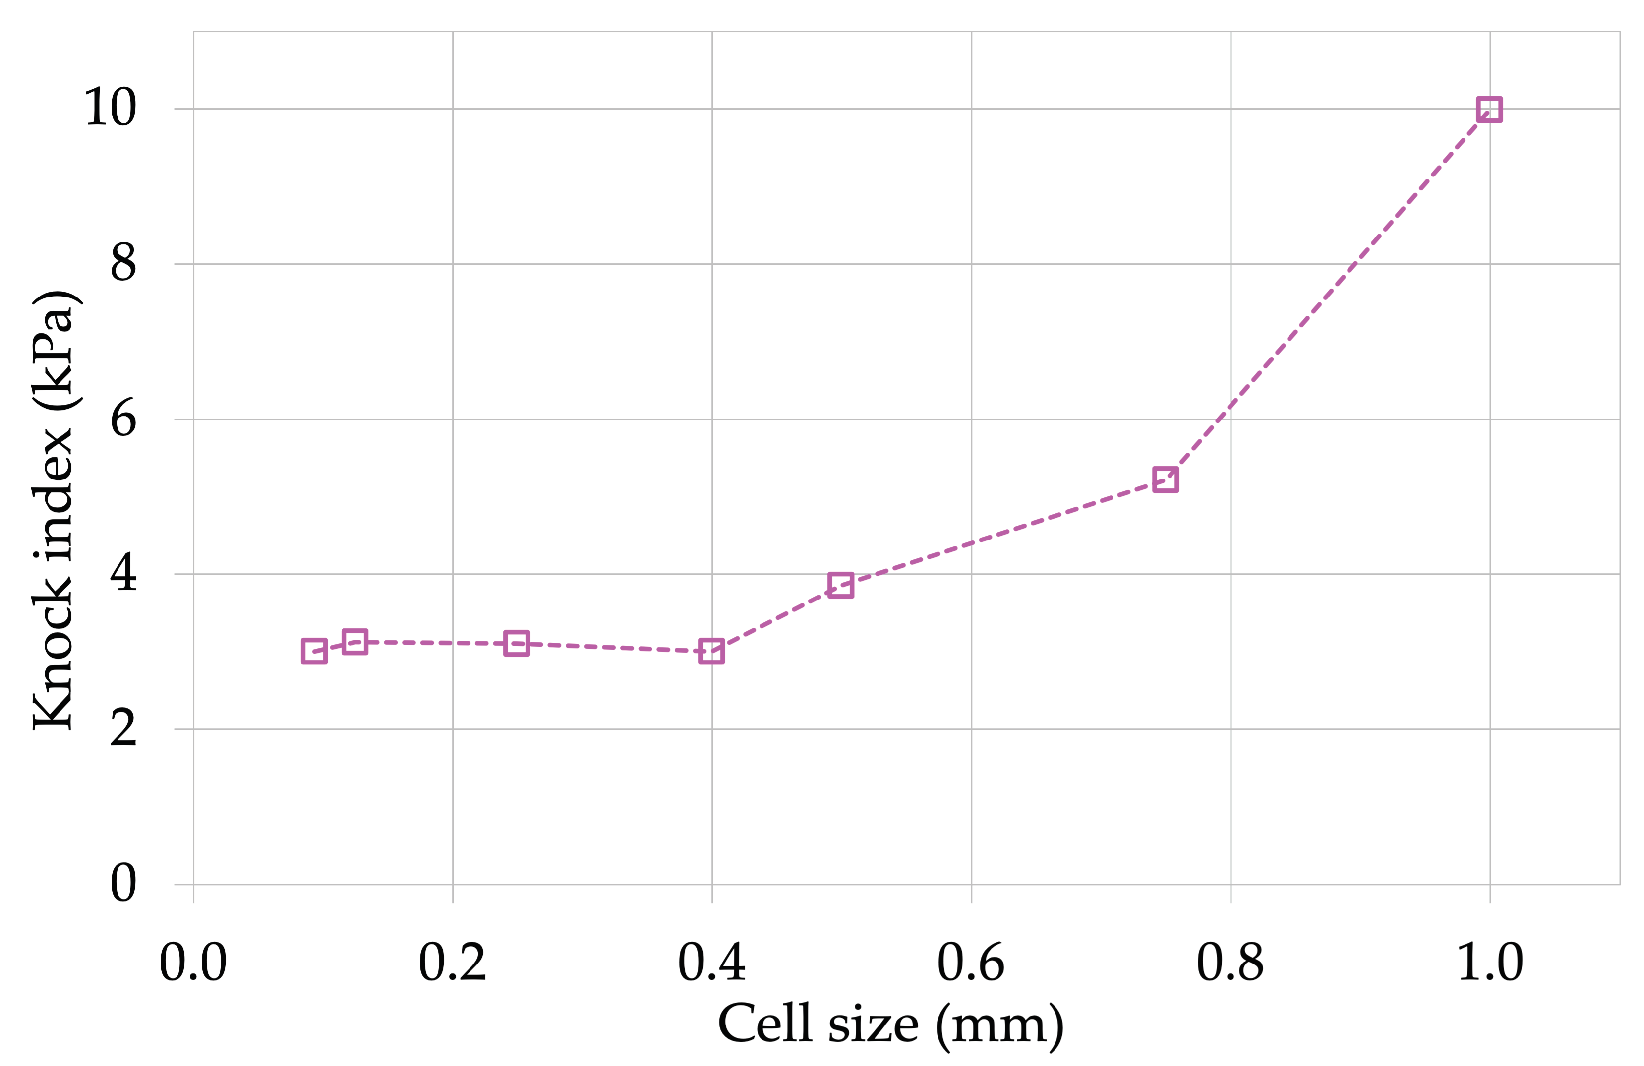
Figure 4.
Comparison of experimental and simulated chamber pressures during motored operation (4000 rpm, 93% throttle): (a) full cycle of one chamber; (b) close-up of peak pressure.
Figure 4.
Comparison of experimental and simulated chamber pressures during motored operation (4000 rpm, 93% throttle): (a) full cycle of one chamber; (b) close-up of peak pressure.
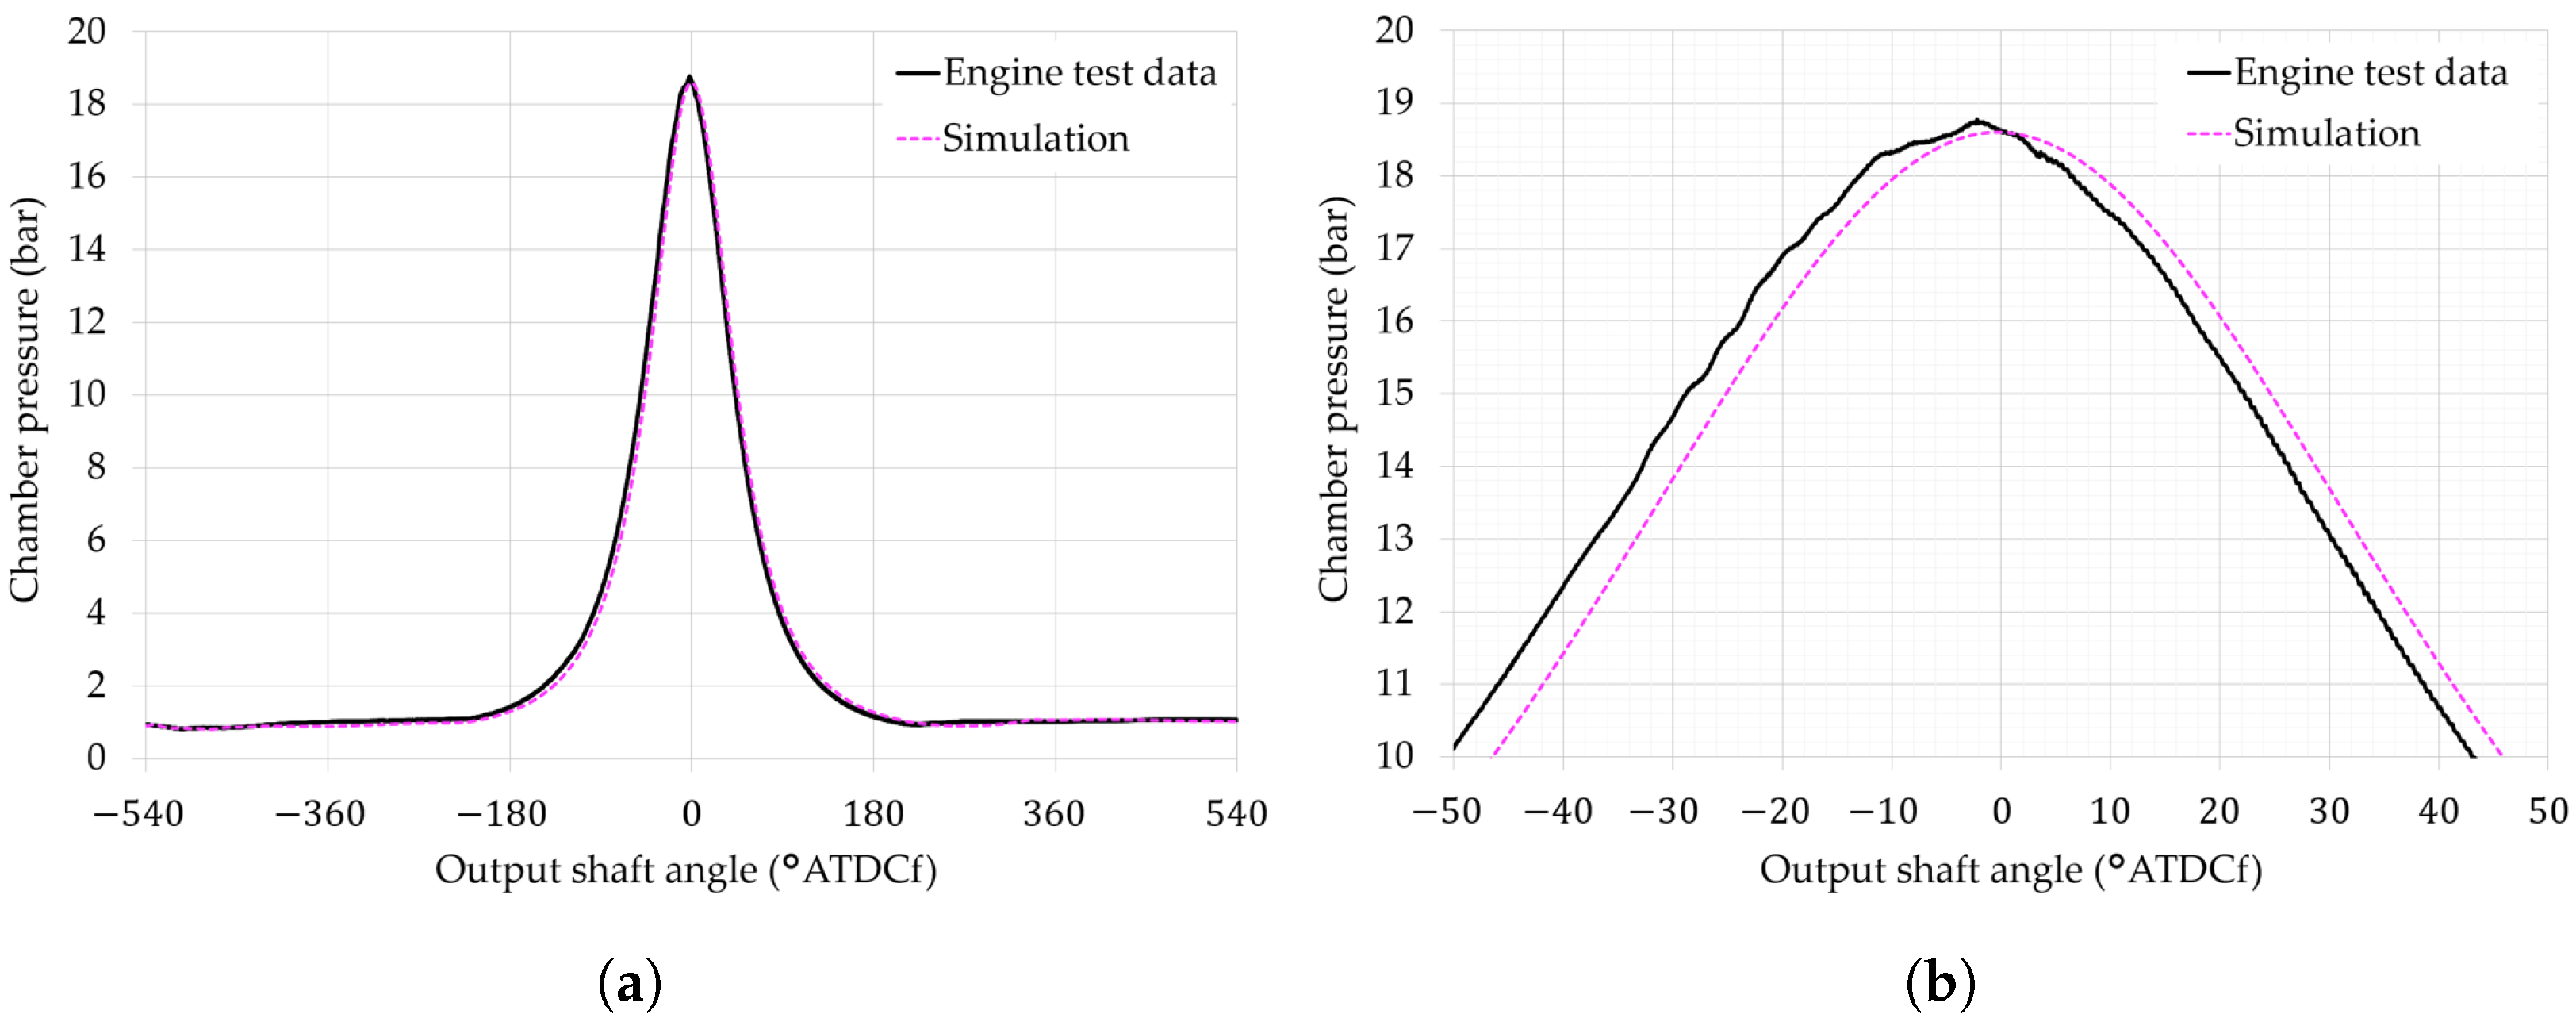
Figure 5.
Comparison of experimental and simulated chamber pressures during fired operation (4000 rpm, 93% throttle): (a) full cycle of one chamber; (b) close-up of peak pressure.
Figure 5.
Comparison of experimental and simulated chamber pressures during fired operation (4000 rpm, 93% throttle): (a) full cycle of one chamber; (b) close-up of peak pressure.

Figure 6.
Comparison of experimental and simulated chamber pressure, rate of heat release (ROHR), and cumulative heat release during fired operation (4000 rpm, 93% throttle).
Figure 6.
Comparison of experimental and simulated chamber pressure, rate of heat release (ROHR), and cumulative heat release during fired operation (4000 rpm, 93% throttle).
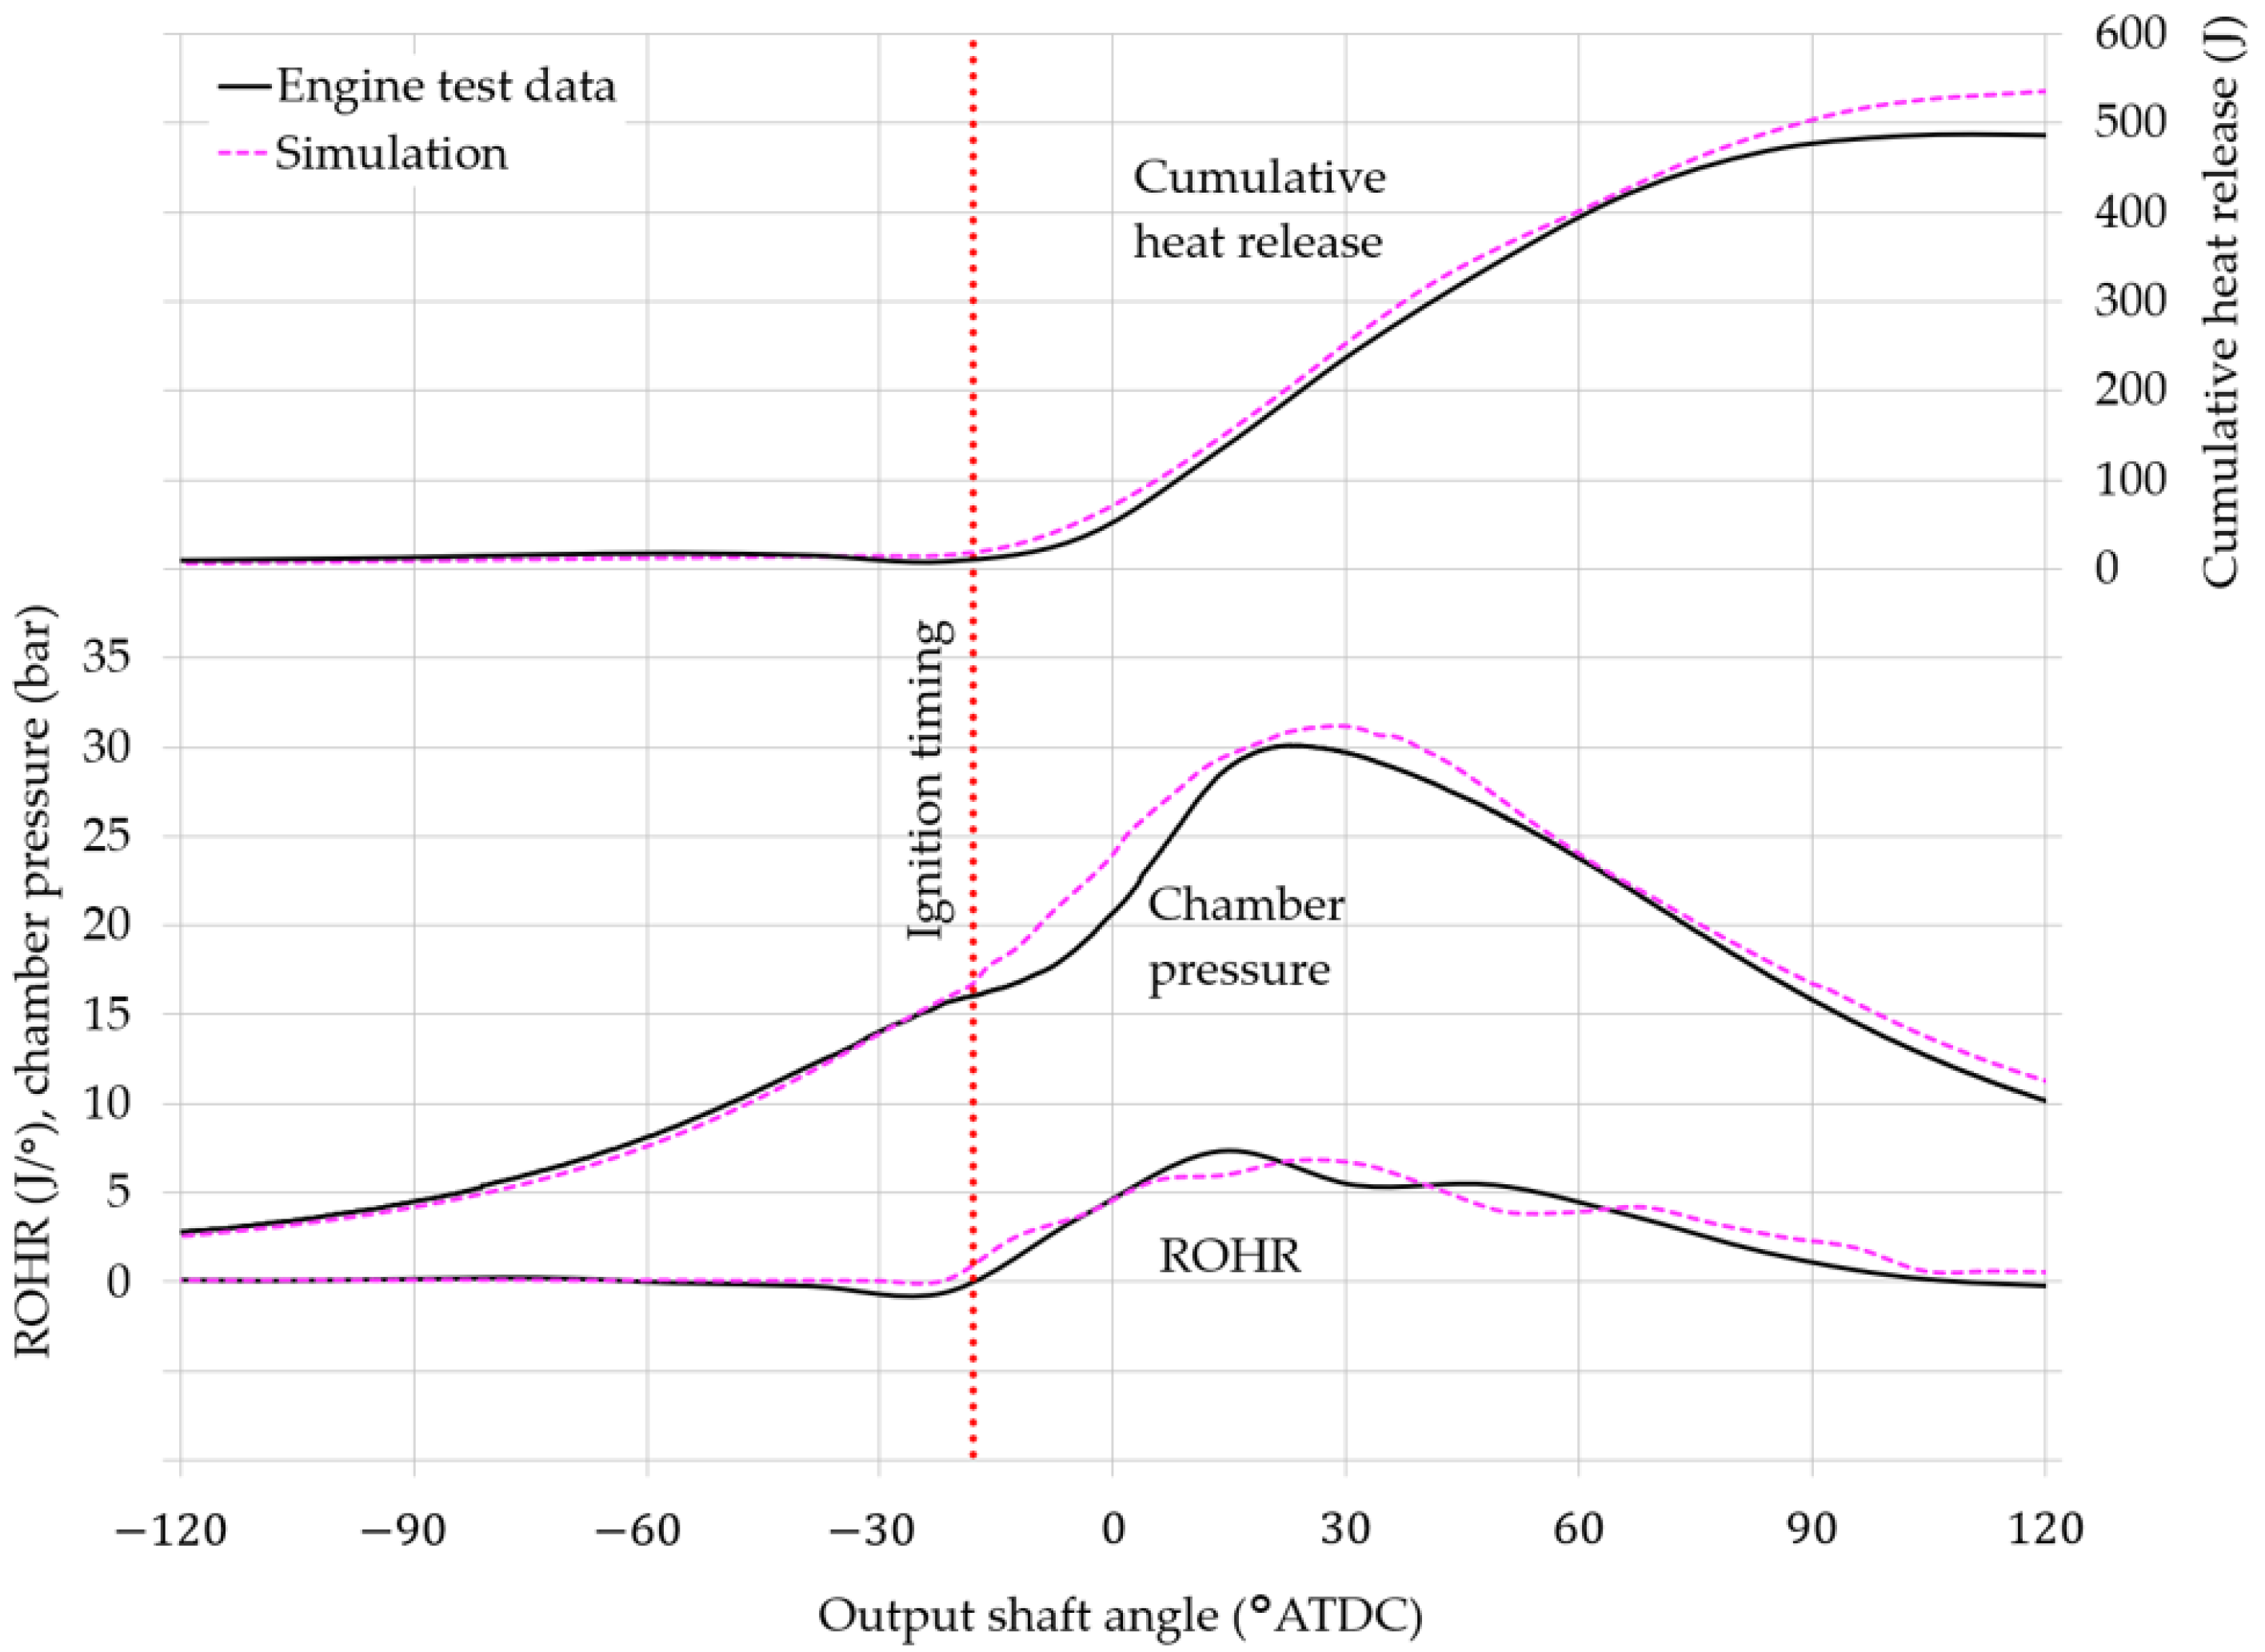
Figure 7.
Intake phase velocity vectors in (a) the chamber and (b) the intake port, at an output shaft angle of 360° BTDCf. Arrows indicate rotational direction of vortical features.
Figure 7.
Intake phase velocity vectors in (a) the chamber and (b) the intake port, at an output shaft angle of 360° BTDCf. Arrows indicate rotational direction of vortical features.

Figure 8.
Vortical structures are more clearly identified by the Q-criterion hotspots (locations indicated by straight white arrows) in (a) than the velocity vectors in (b).
Figure 8.
Vortical structures are more clearly identified by the Q-criterion hotspots (locations indicated by straight white arrows) in (a) than the velocity vectors in (b).
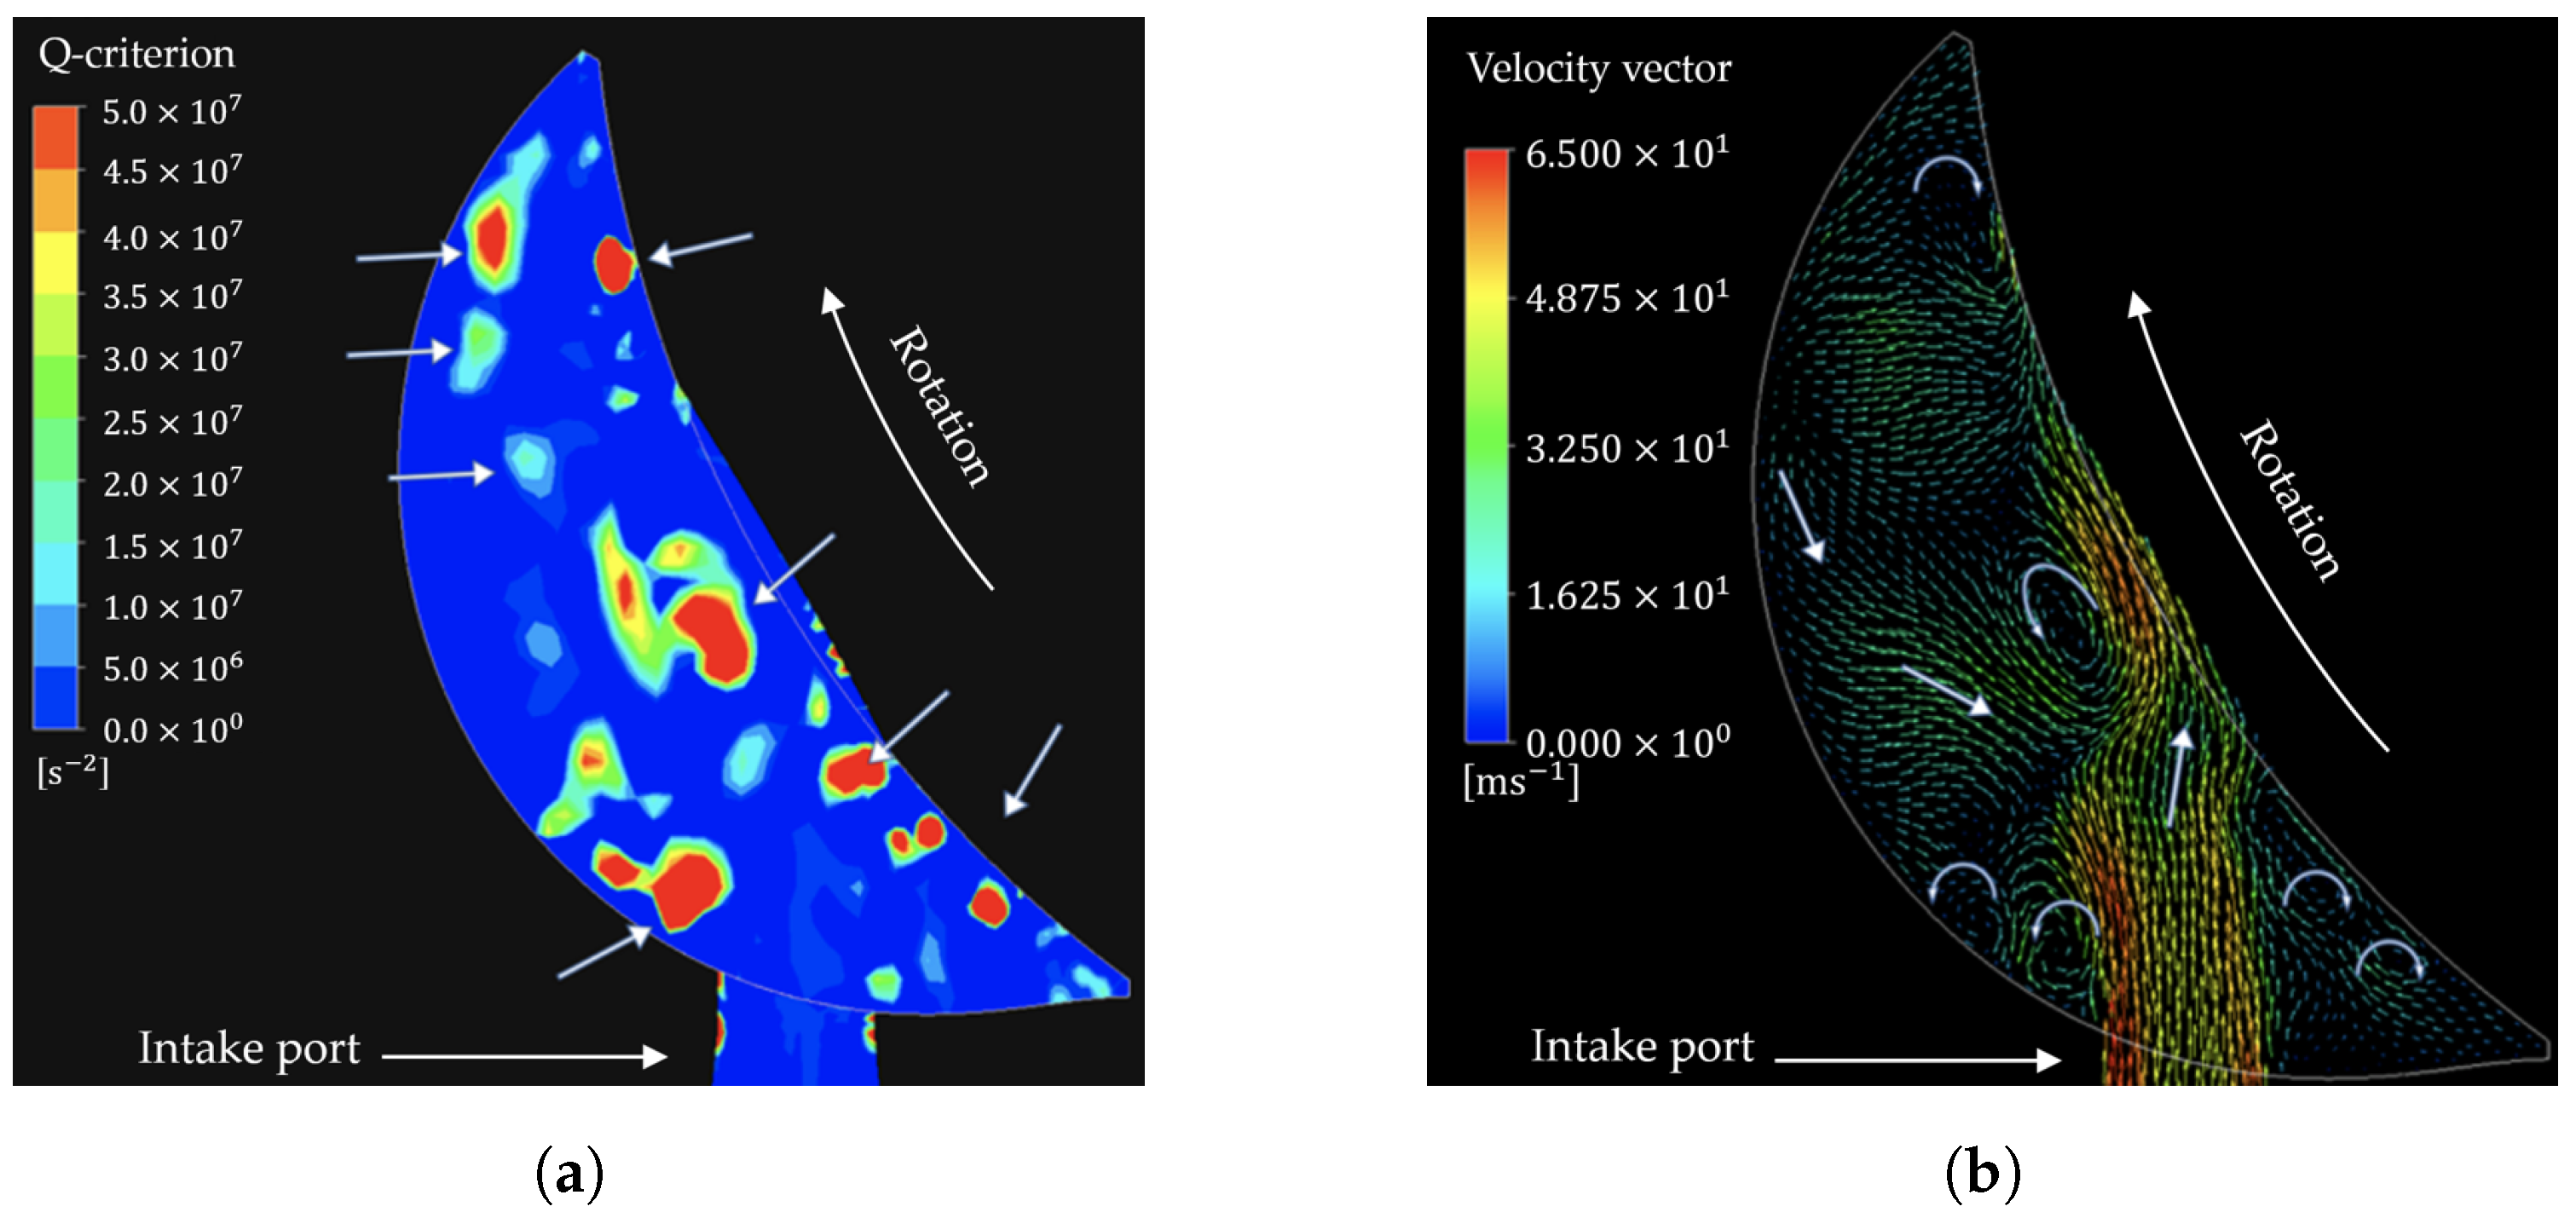
Figure 9.
Comparing (a) Q-criterion and (b) sub-grid viscosity contours: Q-criterion hotspots along the rotor surface (circled) do not show up as areas with higher sub-grid viscosity.
Figure 9.
Comparing (a) Q-criterion and (b) sub-grid viscosity contours: Q-criterion hotspots along the rotor surface (circled) do not show up as areas with higher sub-grid viscosity.
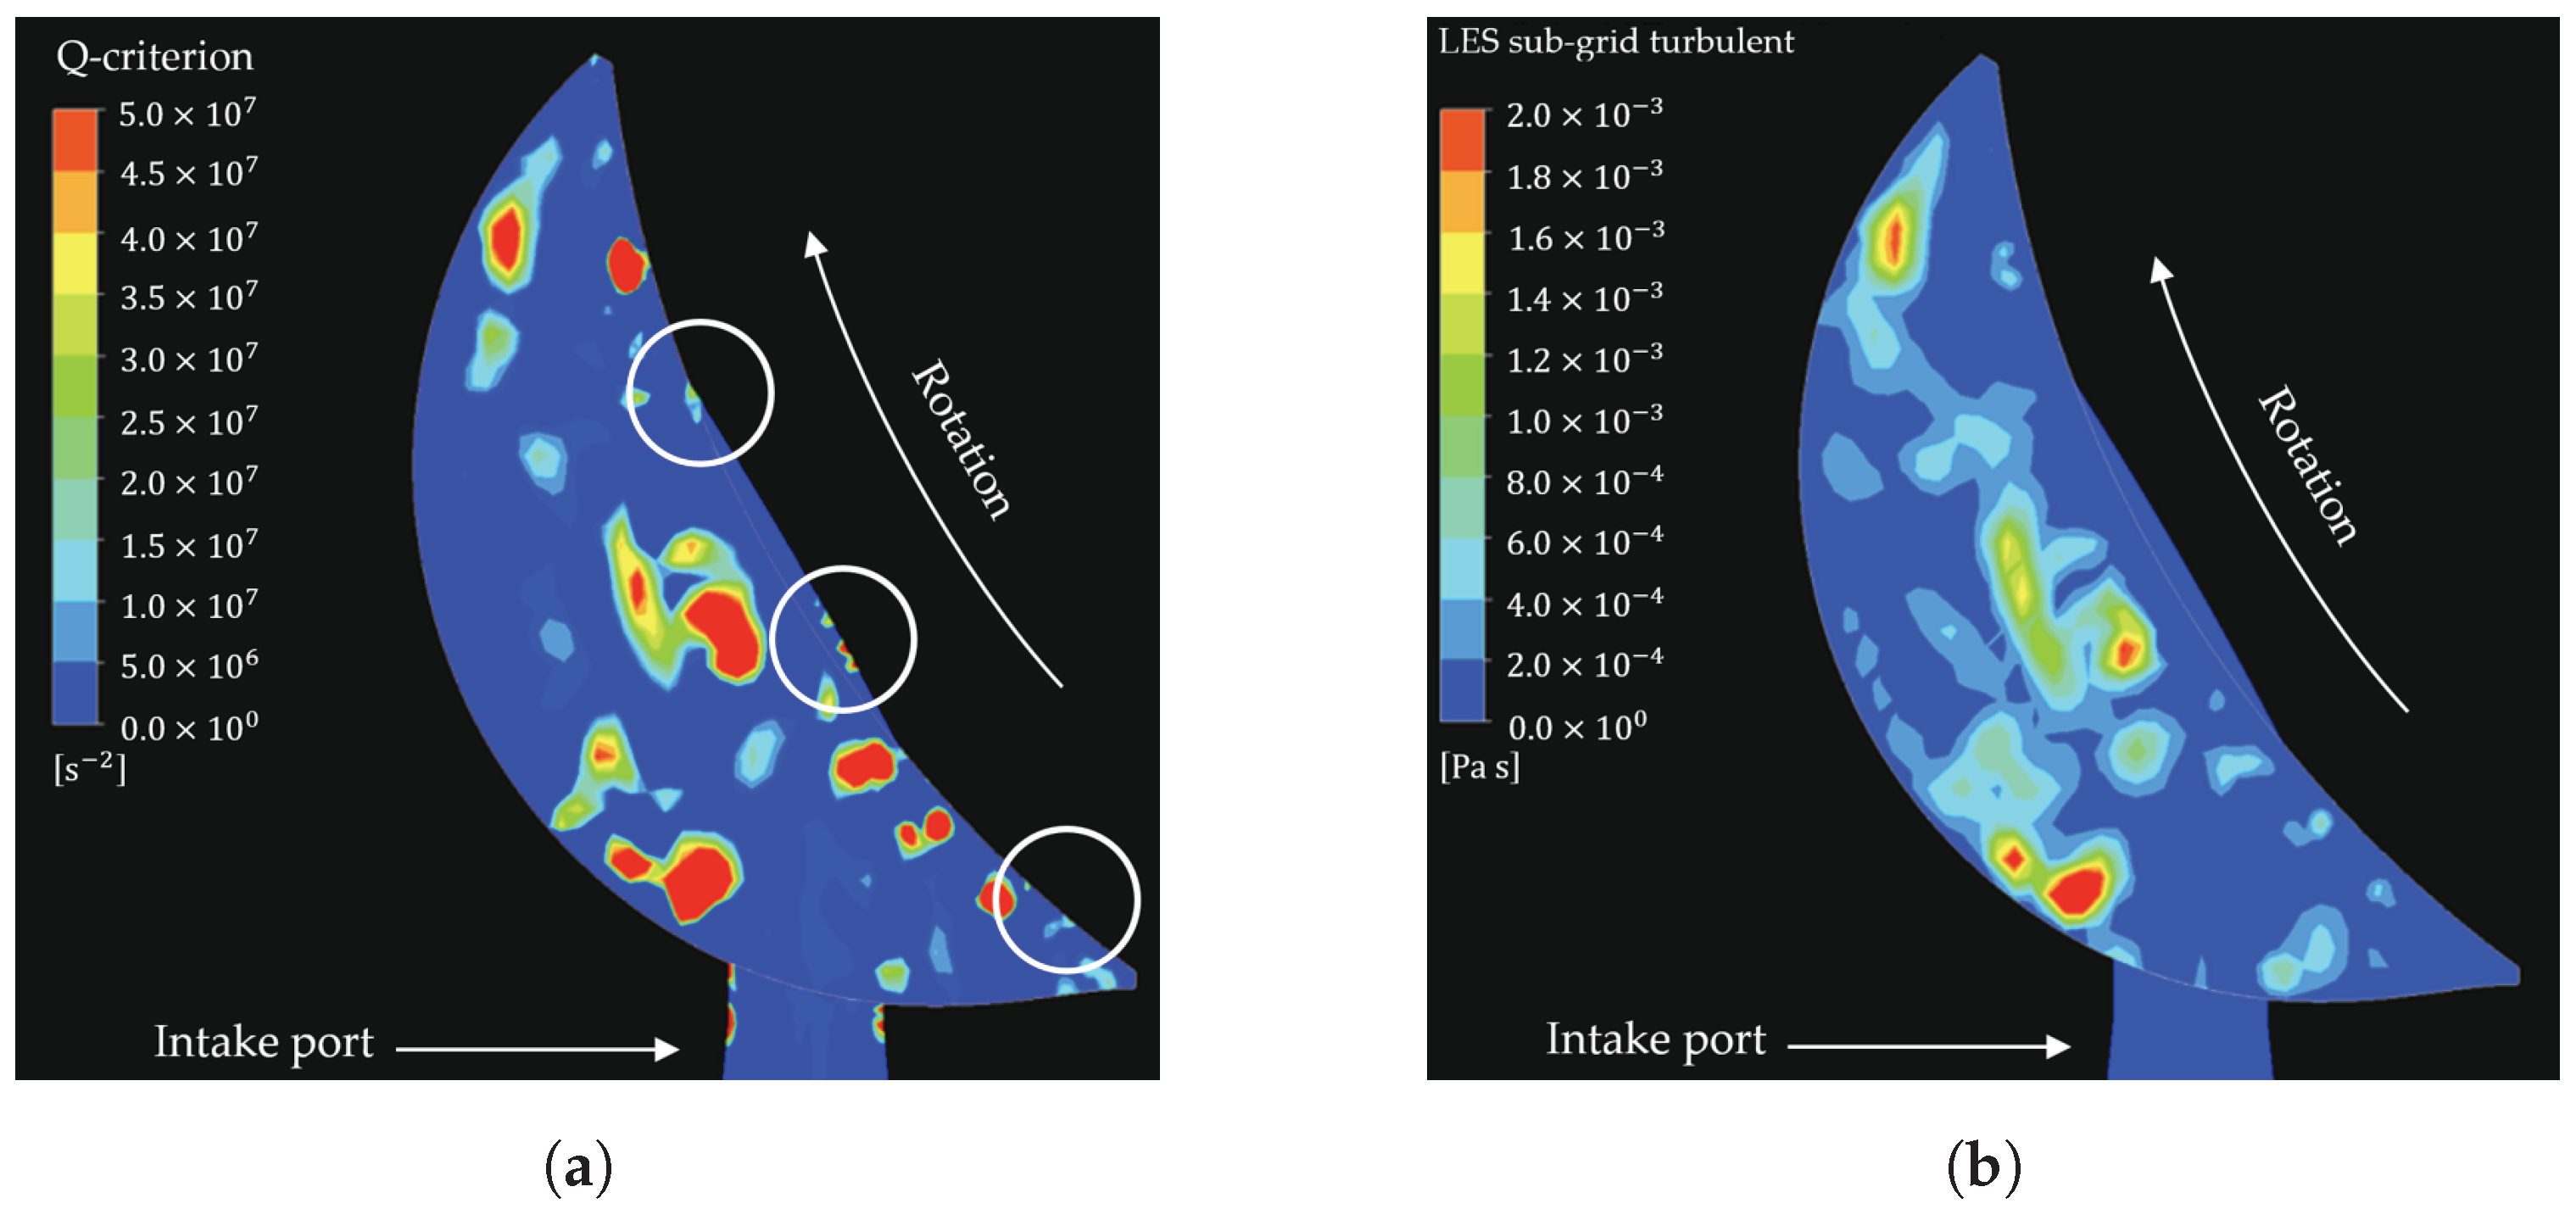
Figure 10.
Q-criterion iso-surfaces for (a) , (b) , and (c) . Q-criterion iso-surfaces for are used later as a suitable compromise.
Figure 10.
Q-criterion iso-surfaces for (a) , (b) , and (c) . Q-criterion iso-surfaces for are used later as a suitable compromise.
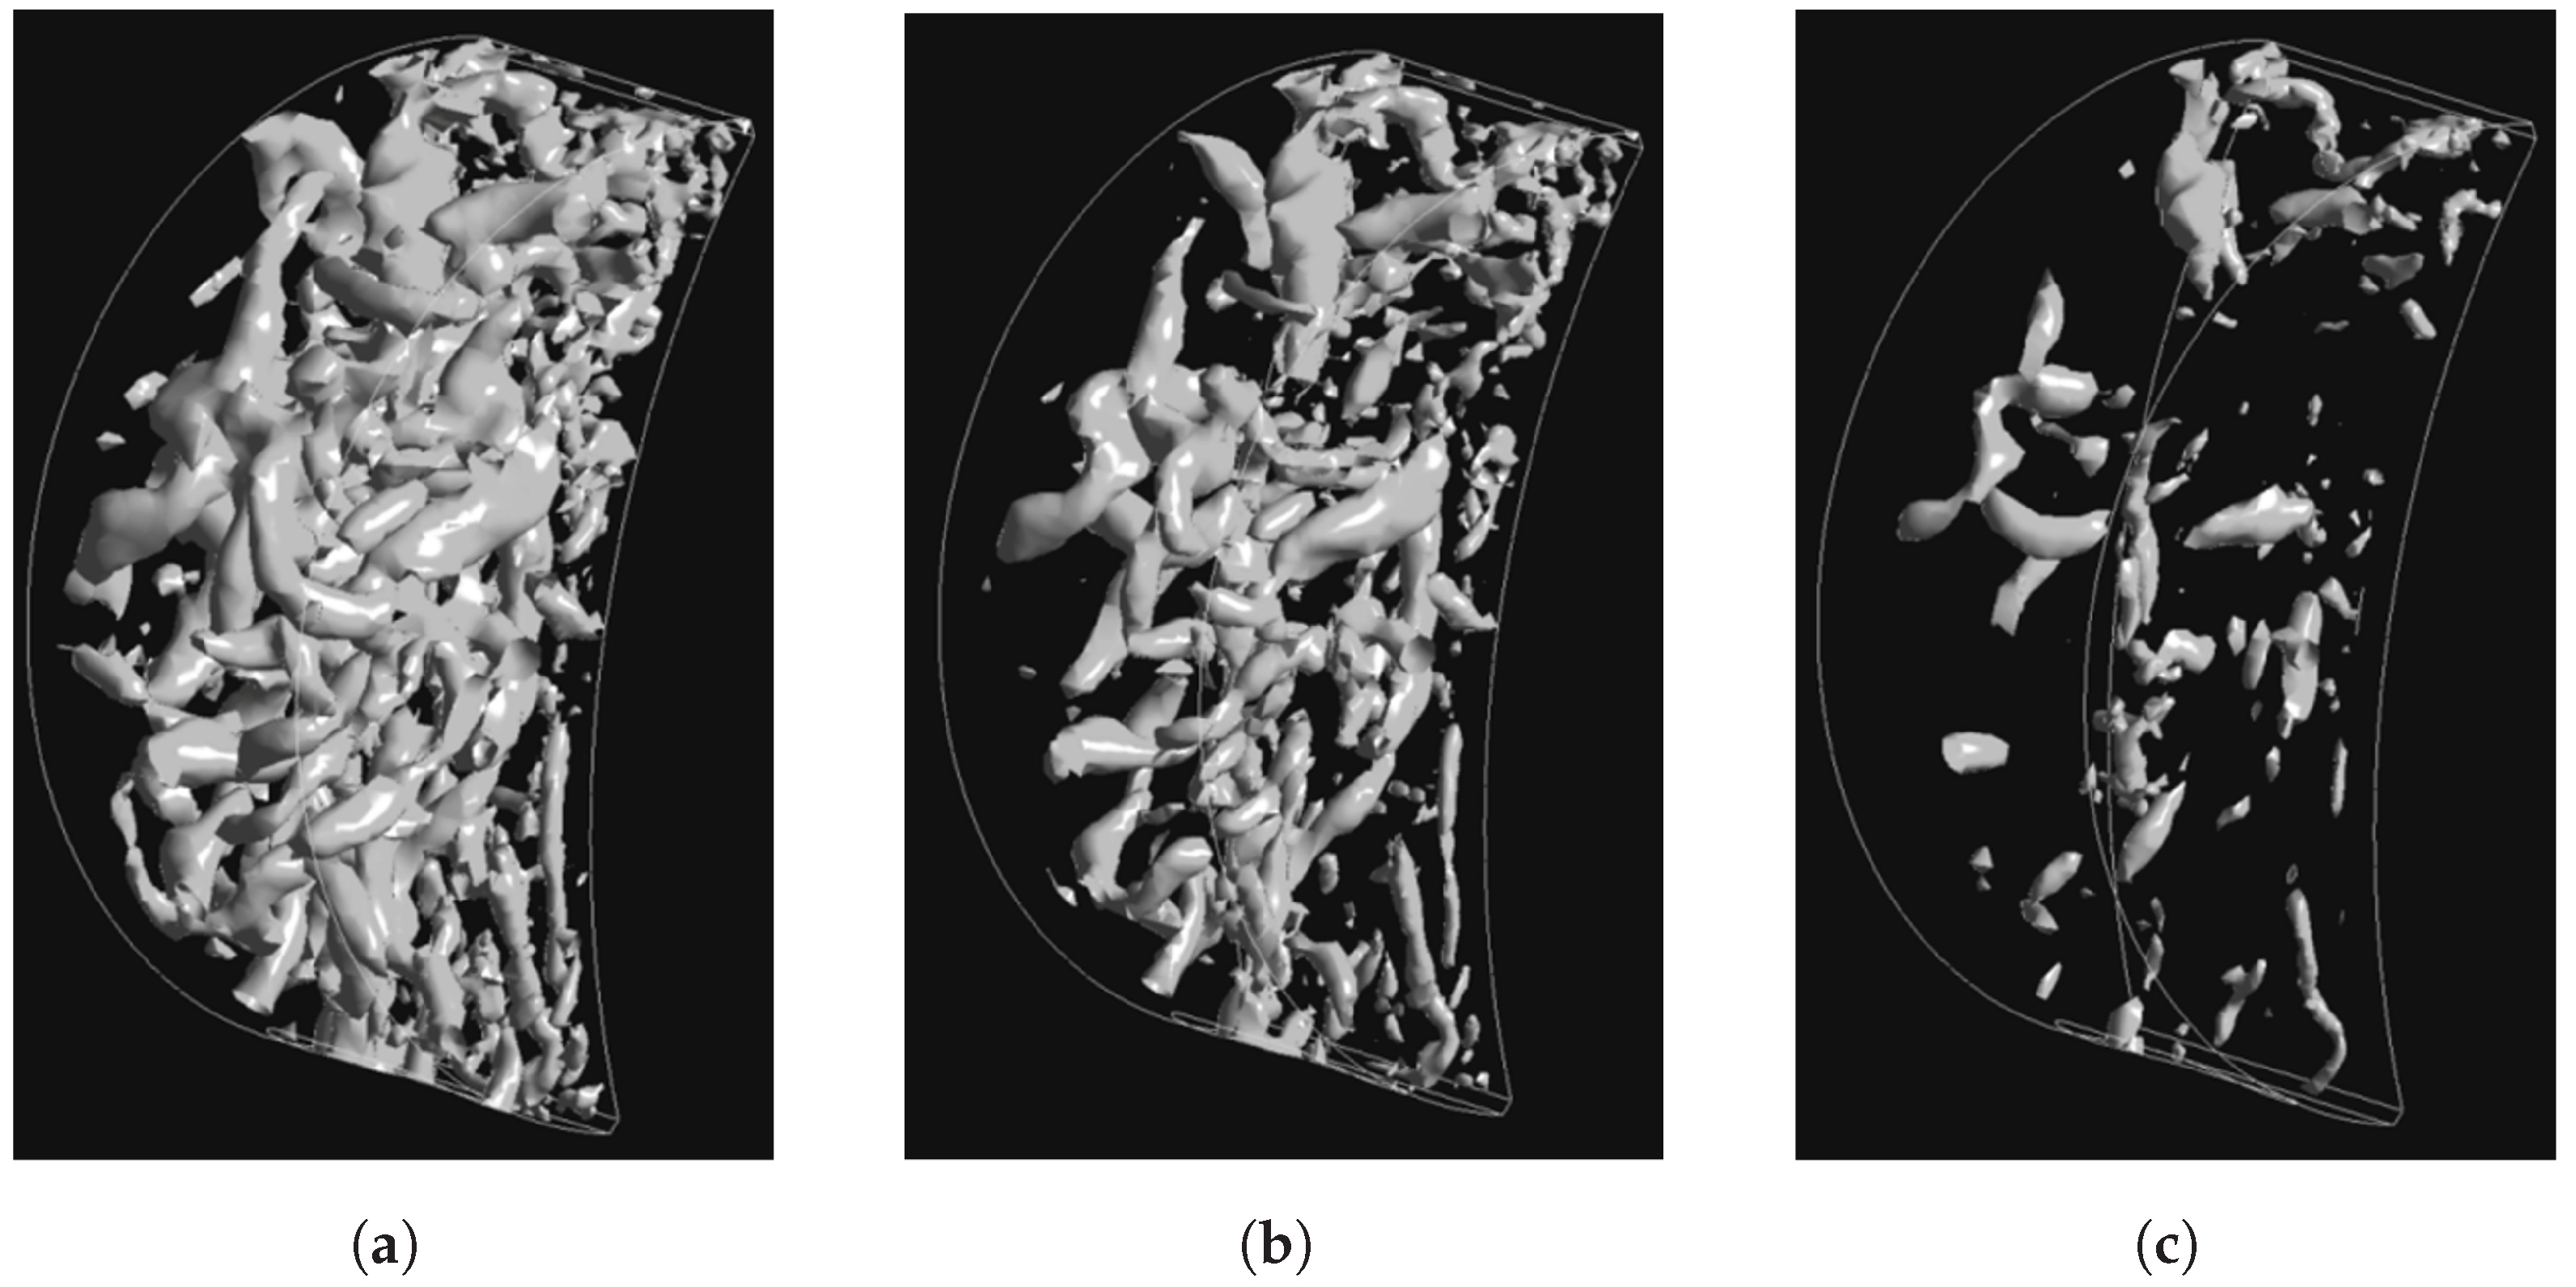
Figure 11.
Q-criterion iso-surfaces at (coloured based on velocity) at three points during the intake phase. Strong vortices emanating from the throttle can be observed in (a), which proceed into the chamber in (b), before breaking down into smaller-scale vortices in (c).
Figure 11.
Q-criterion iso-surfaces at (coloured based on velocity) at three points during the intake phase. Strong vortices emanating from the throttle can be observed in (a), which proceed into the chamber in (b), before breaking down into smaller-scale vortices in (c).
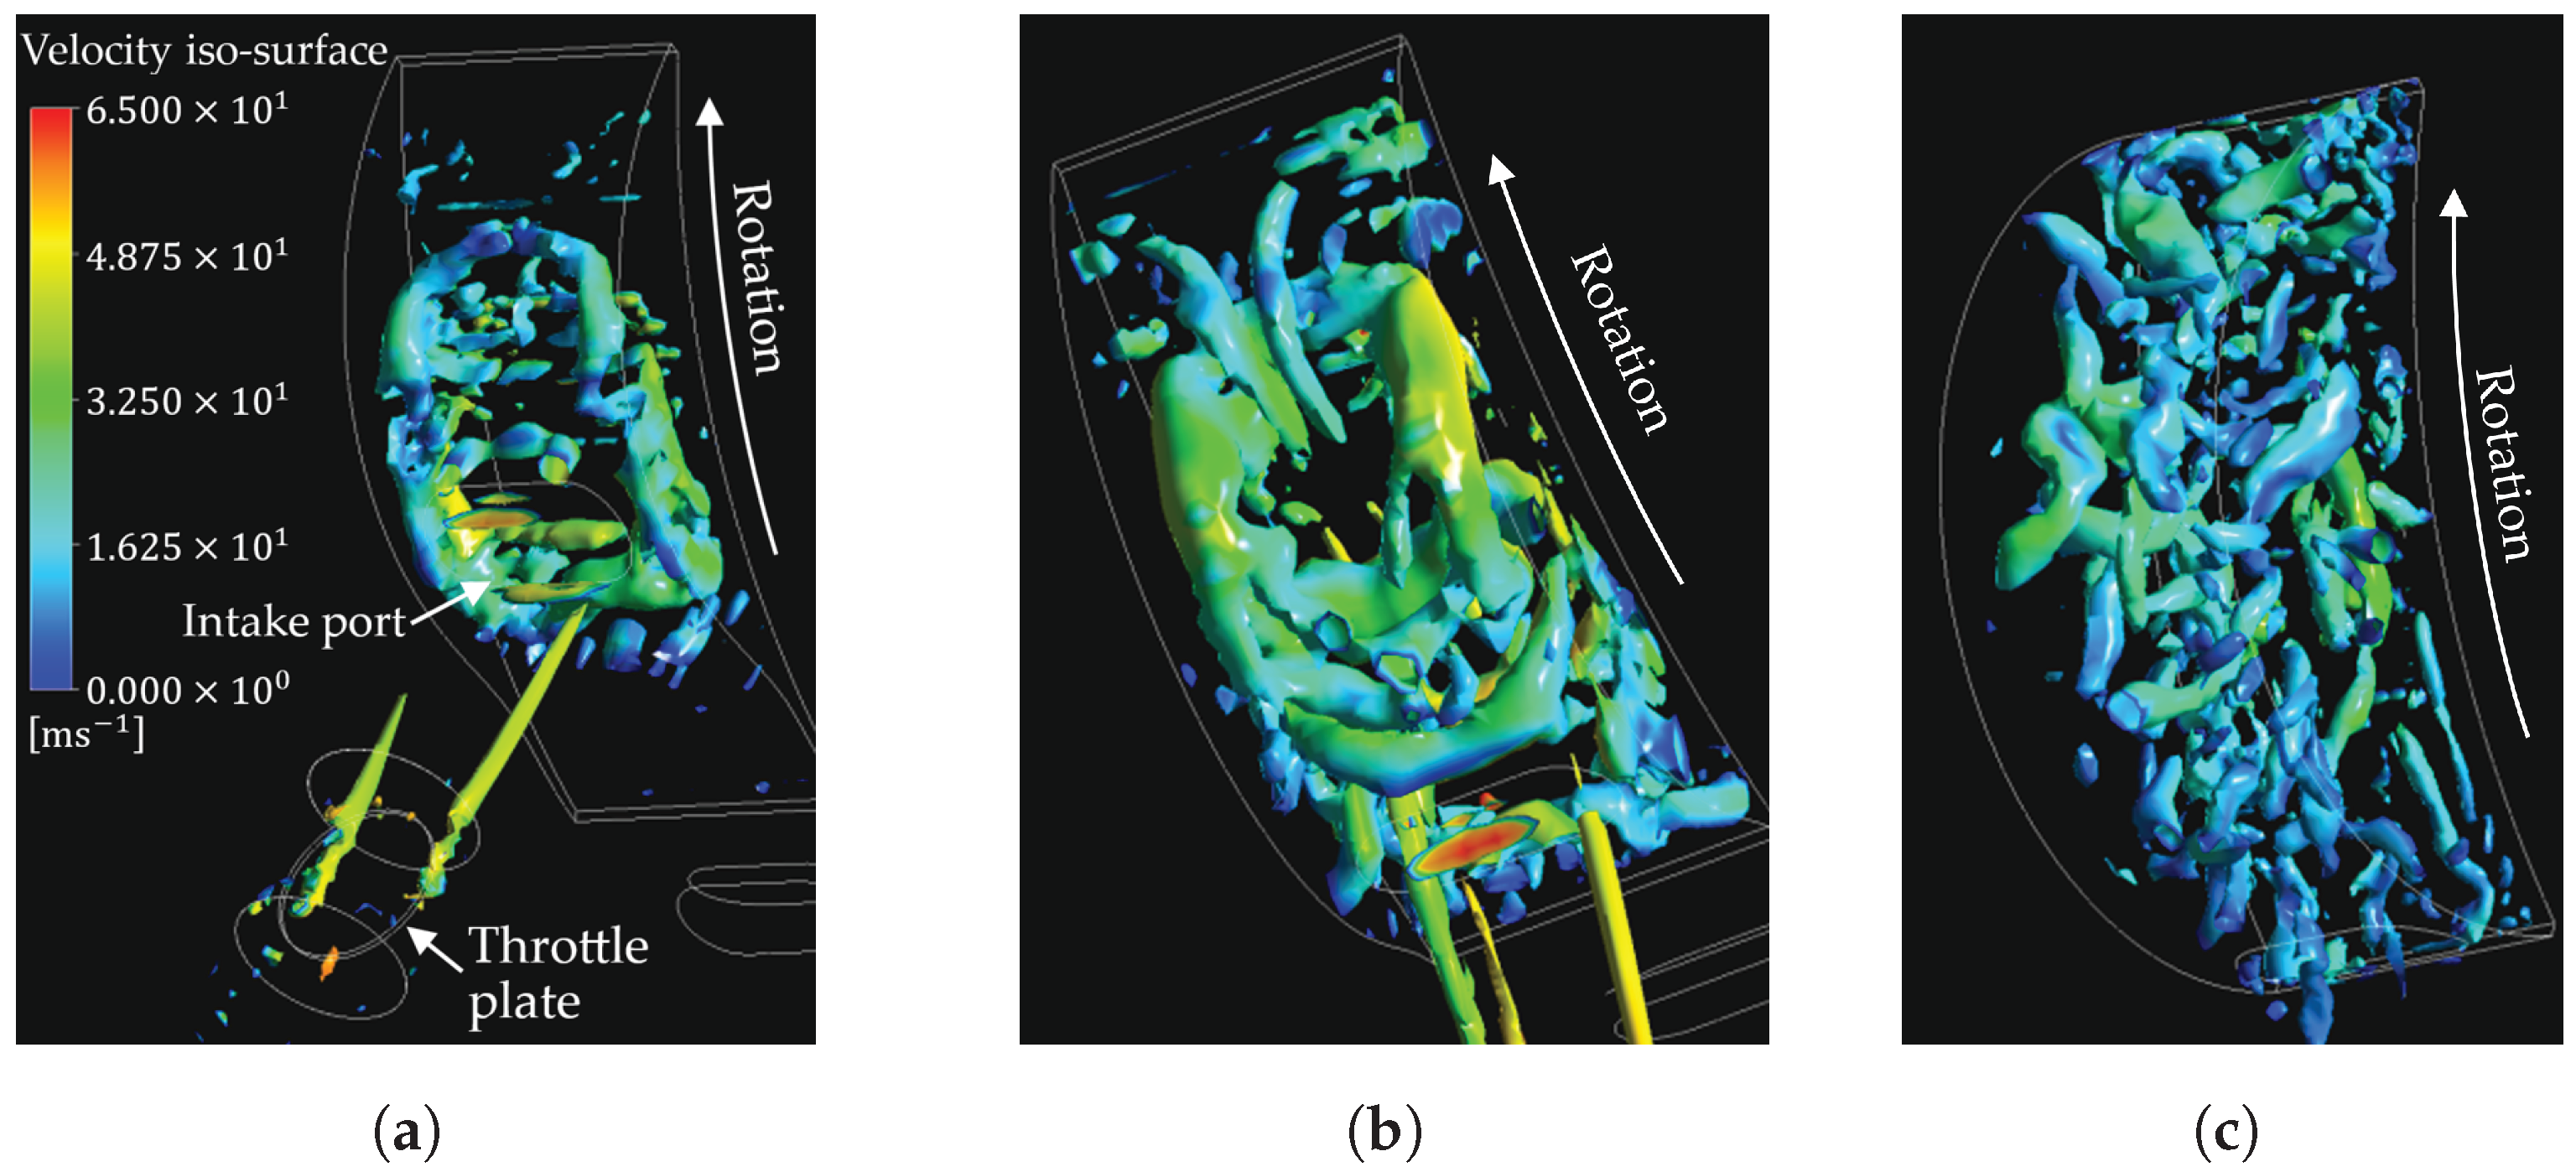
Figure 12.
Q-criterion iso-surfaces at (coloured based on velocity) between the start of compression (left side) and start of ignition (right side), at which point there remain numerous vortical strands.
Figure 12.
Q-criterion iso-surfaces at (coloured based on velocity) between the start of compression (left side) and start of ignition (right side), at which point there remain numerous vortical strands.
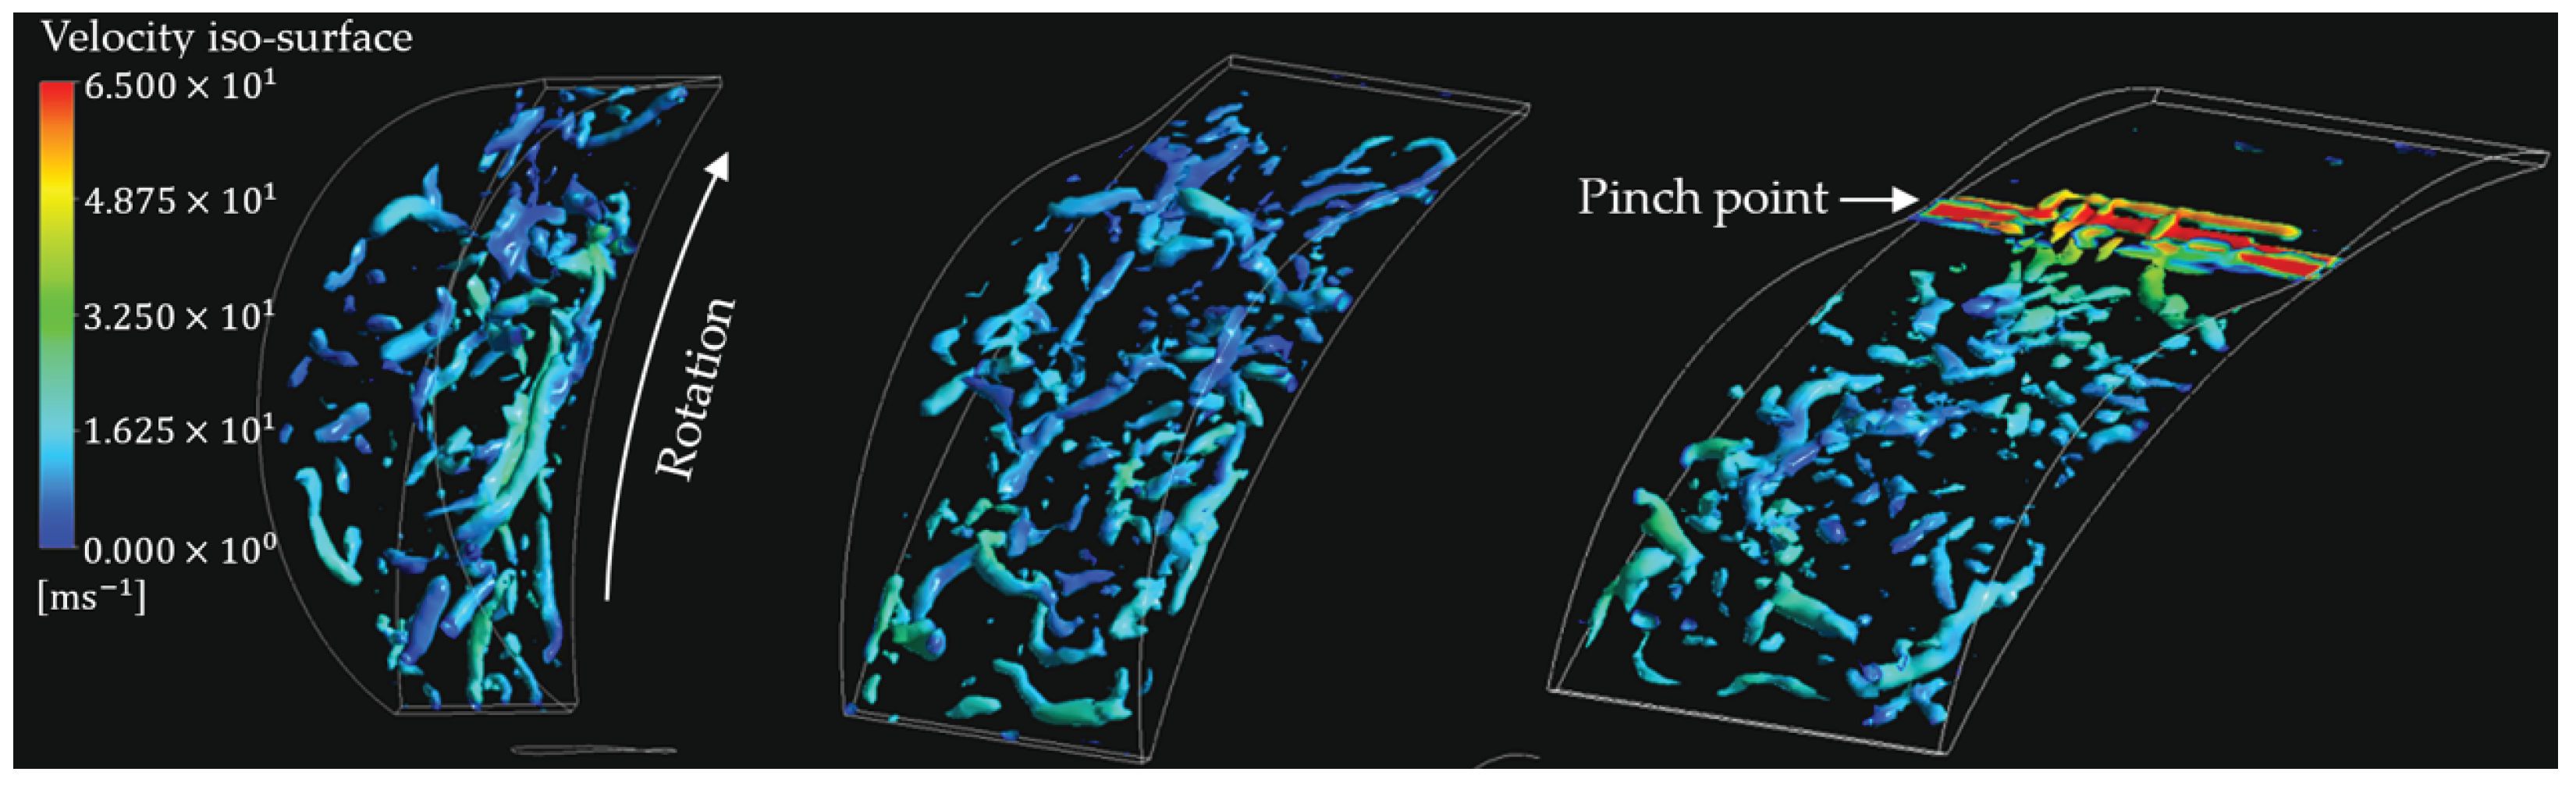
Figure 13.
Q-criterion iso-surfaces at (coloured based on velocity) post ignition and during chamber expansion, when only very small pockets of vortical structures remain.
Figure 13.
Q-criterion iso-surfaces at (coloured based on velocity) post ignition and during chamber expansion, when only very small pockets of vortical structures remain.
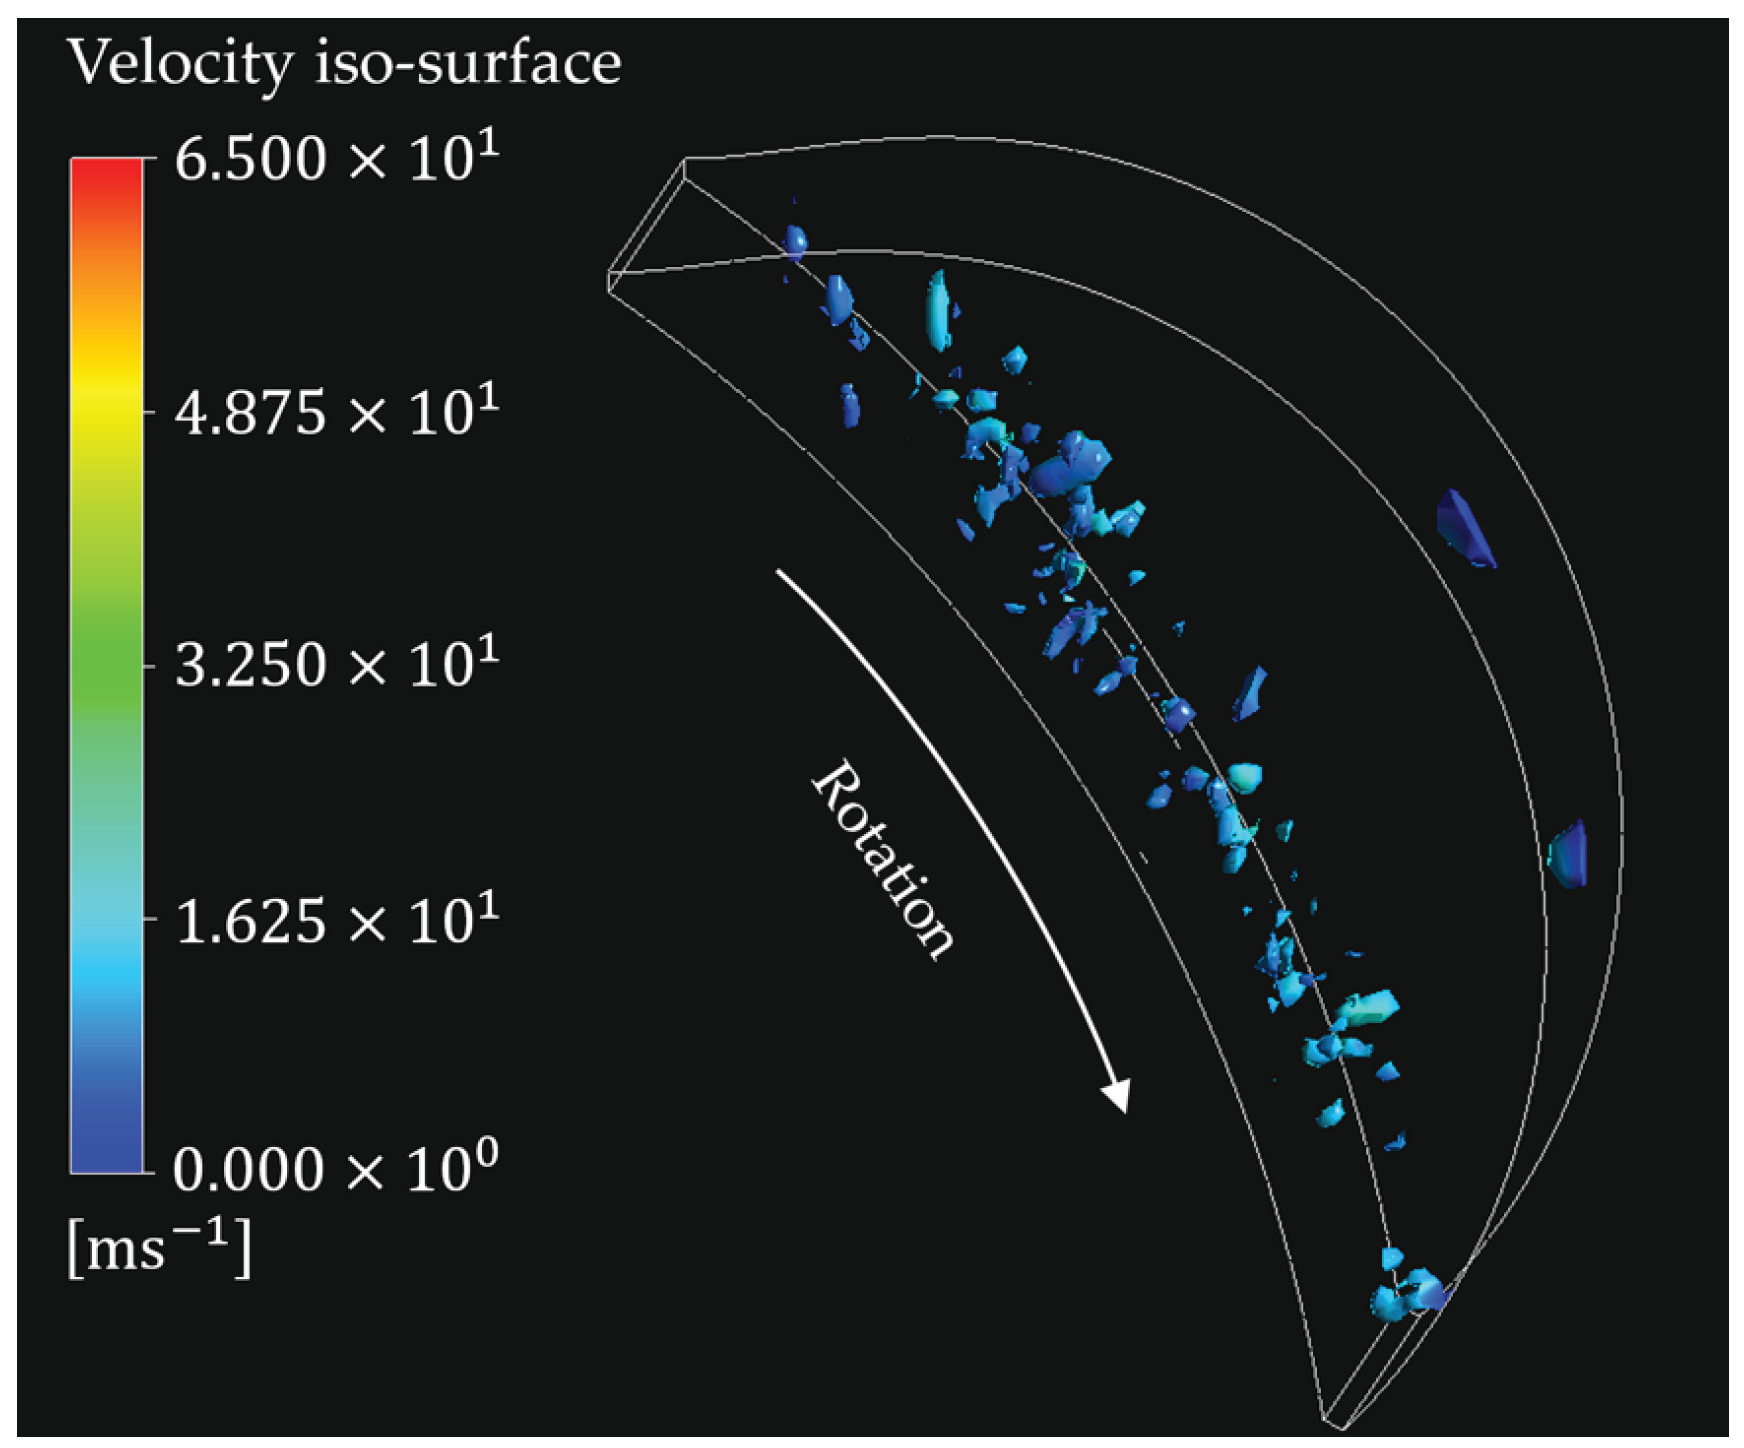
Figure 14.
Contours of CO2 mass fraction at (a) 530°, (b) 540°, (c) 576°, (d) 612°, (e) 648°, and (f) 900° output shaft angles (OSAs).
Figure 14.
Contours of CO2 mass fraction at (a) 530°, (b) 540°, (c) 576°, (d) 612°, (e) 648°, and (f) 900° output shaft angles (OSAs).
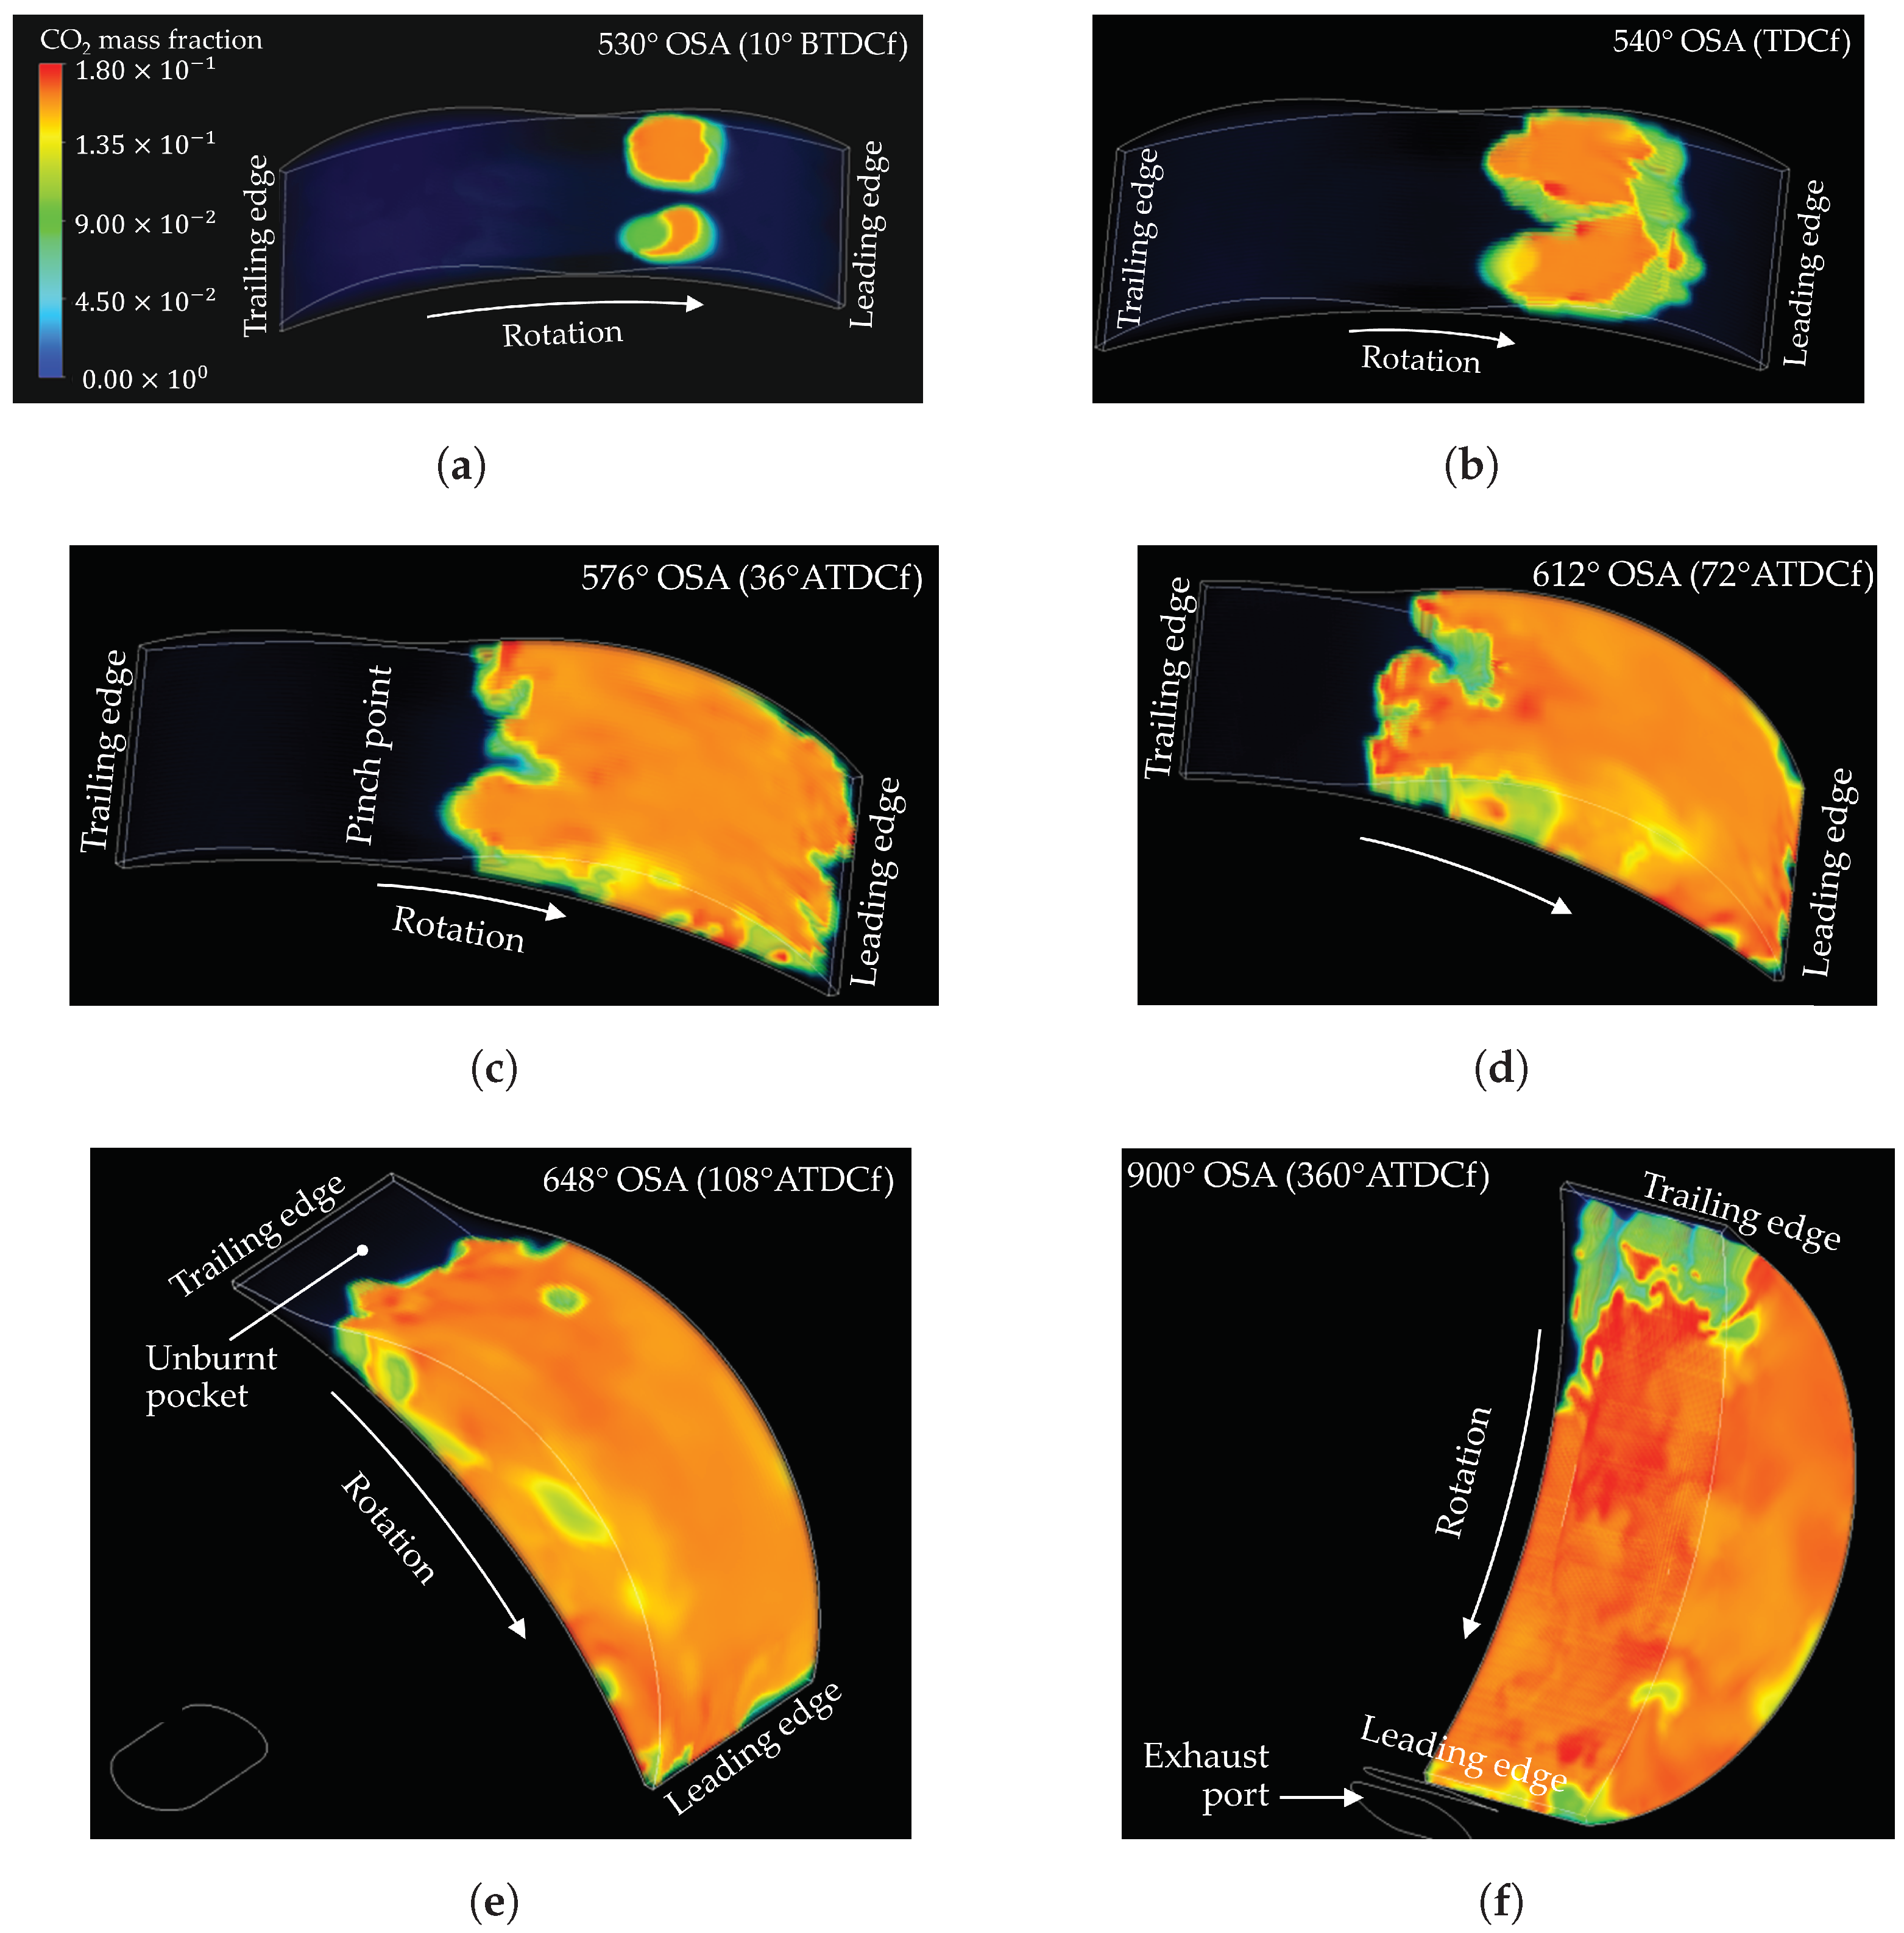
Figure 15.
Simulated temperature contours through the central plane of the combustion chamber: (a) at intake port closing, (b) at TDCf, (c) during expansion, and (d) at exhaust port opening. One can observe a pocket of cooler gas persisting at the rotor trailing edge.
Figure 15.
Simulated temperature contours through the central plane of the combustion chamber: (a) at intake port closing, (b) at TDCf, (c) during expansion, and (d) at exhaust port opening. One can observe a pocket of cooler gas persisting at the rotor trailing edge.
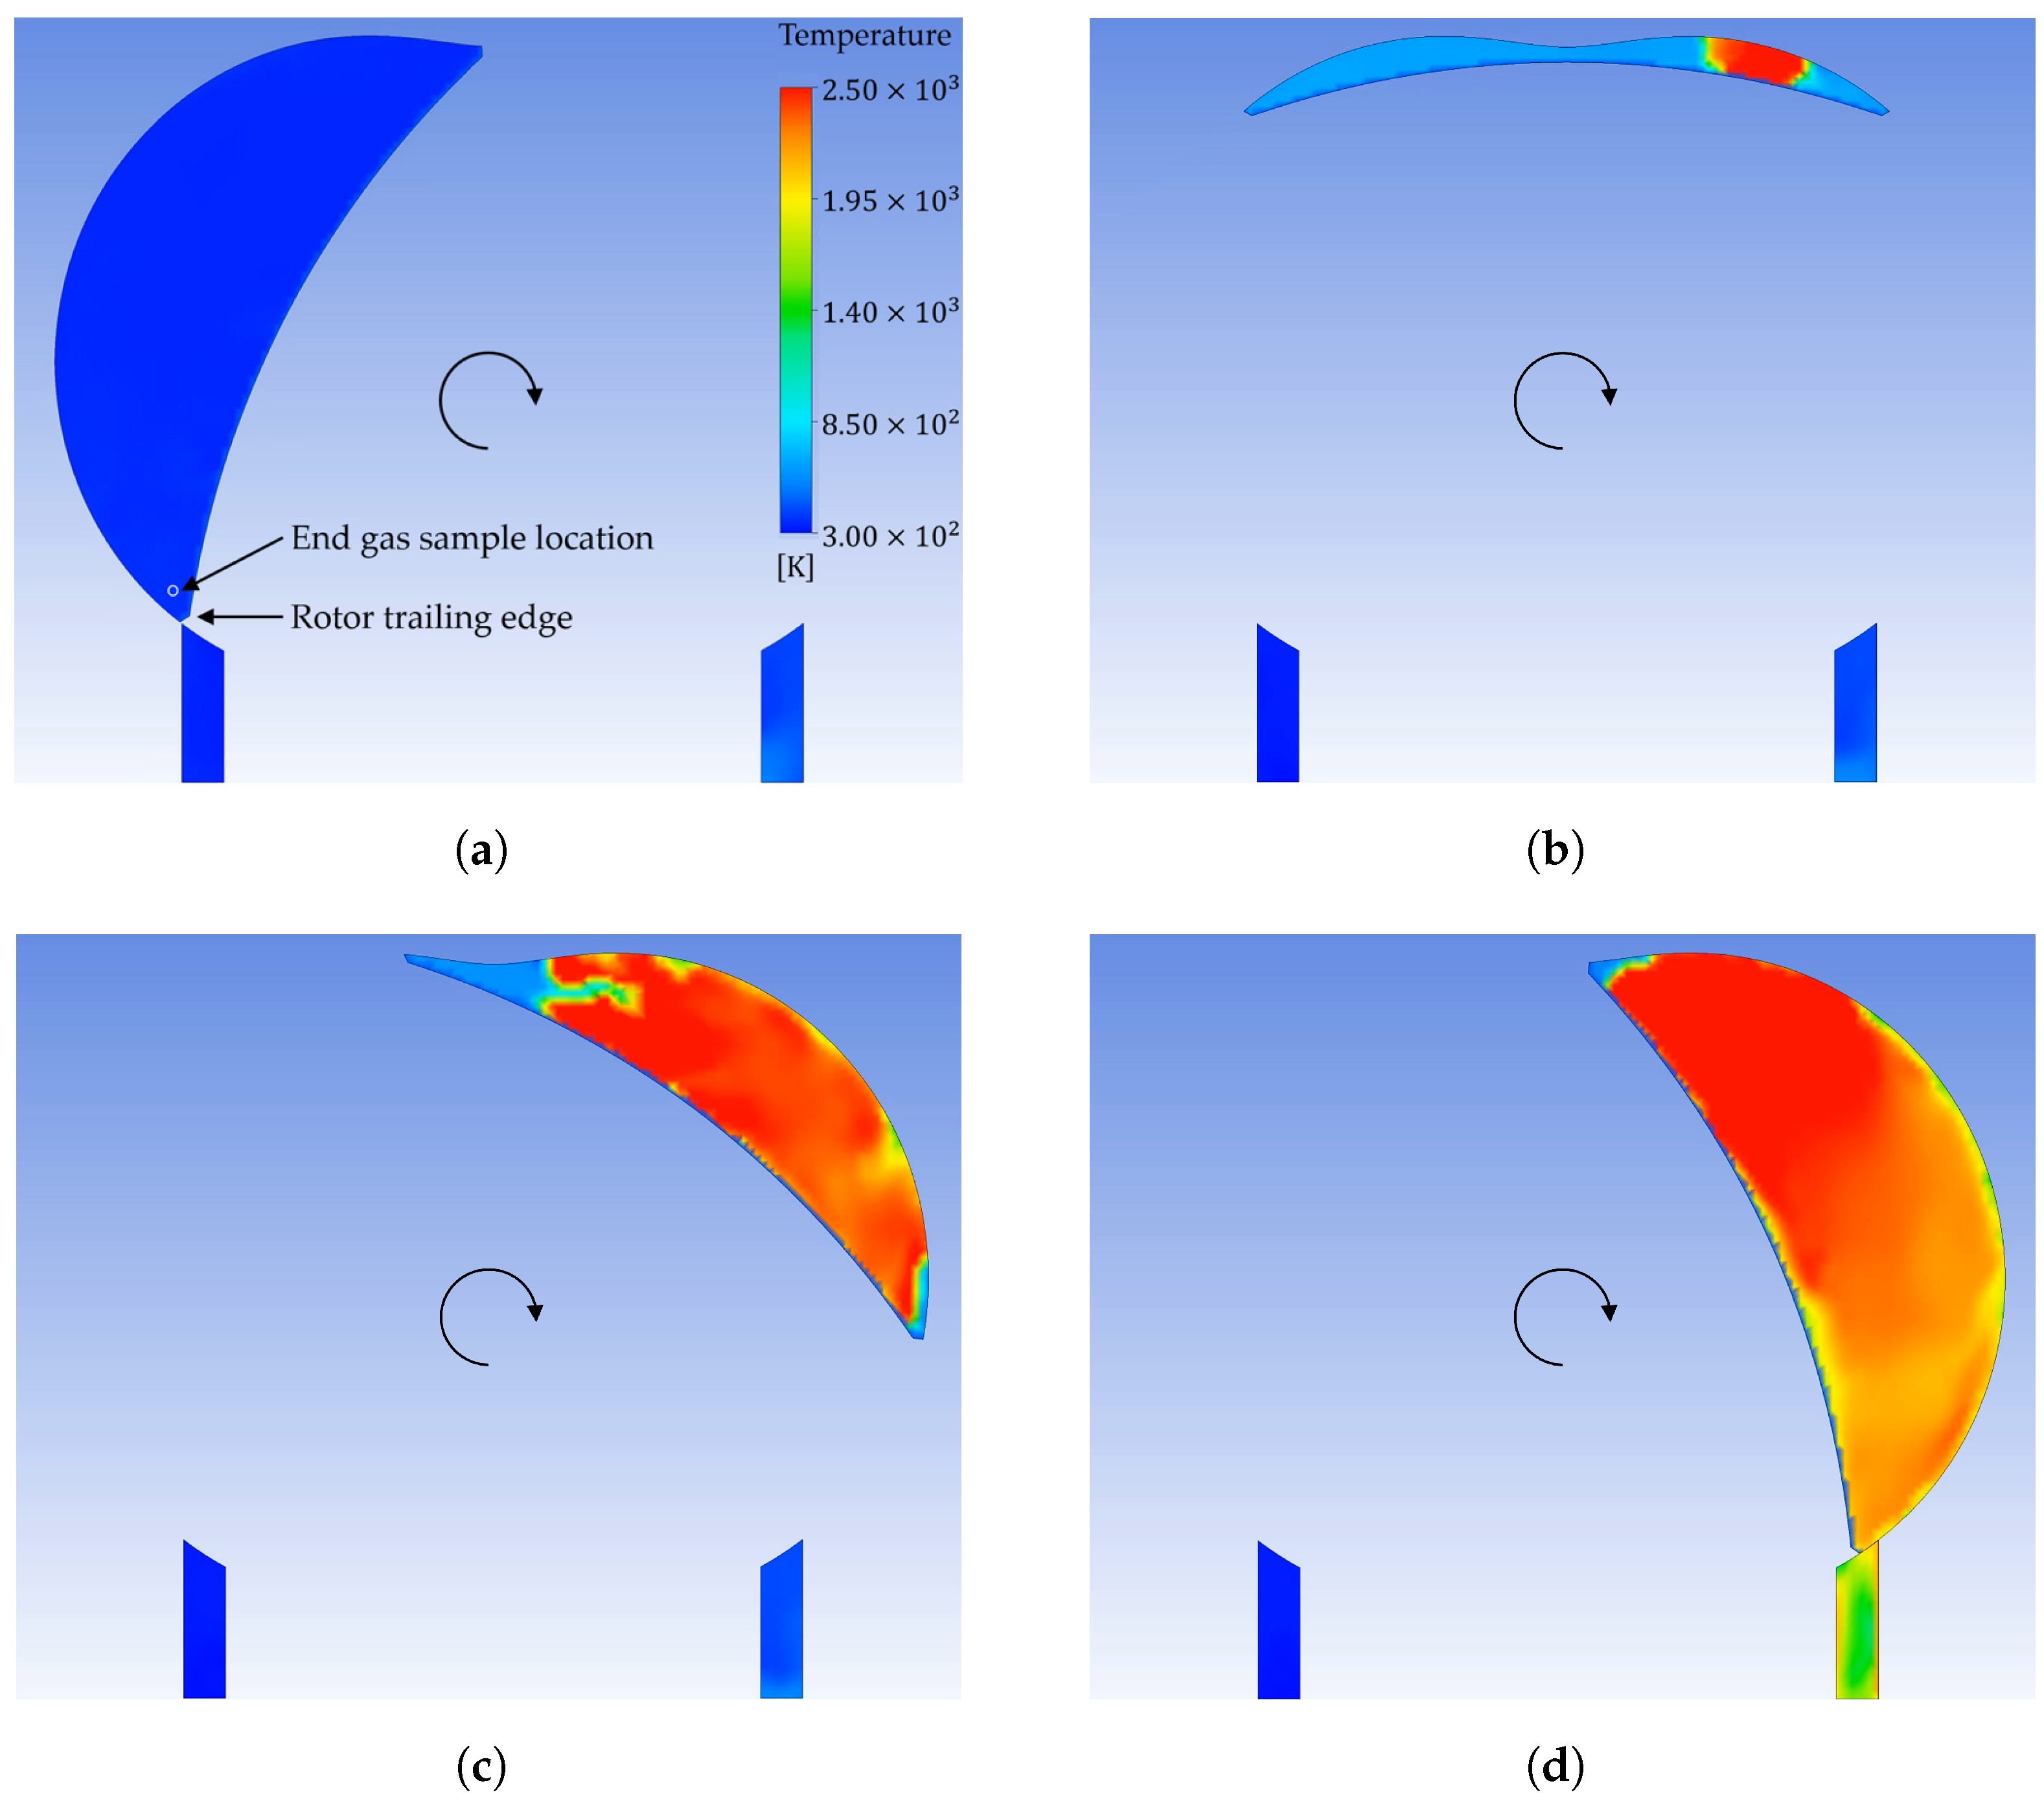
Figure 16.
Predicted mole fractions of iso-octane, oxygen, OH, and water for the sampled end-gas temperature history (blue) and double this temperature (red) for the period between −45° and 15° ATDCf. At the conditions simulated, the temperature of the end gas is low enough to avoid knock; much higher temperatures would be required for significant pre-cursor formation leading to knock.
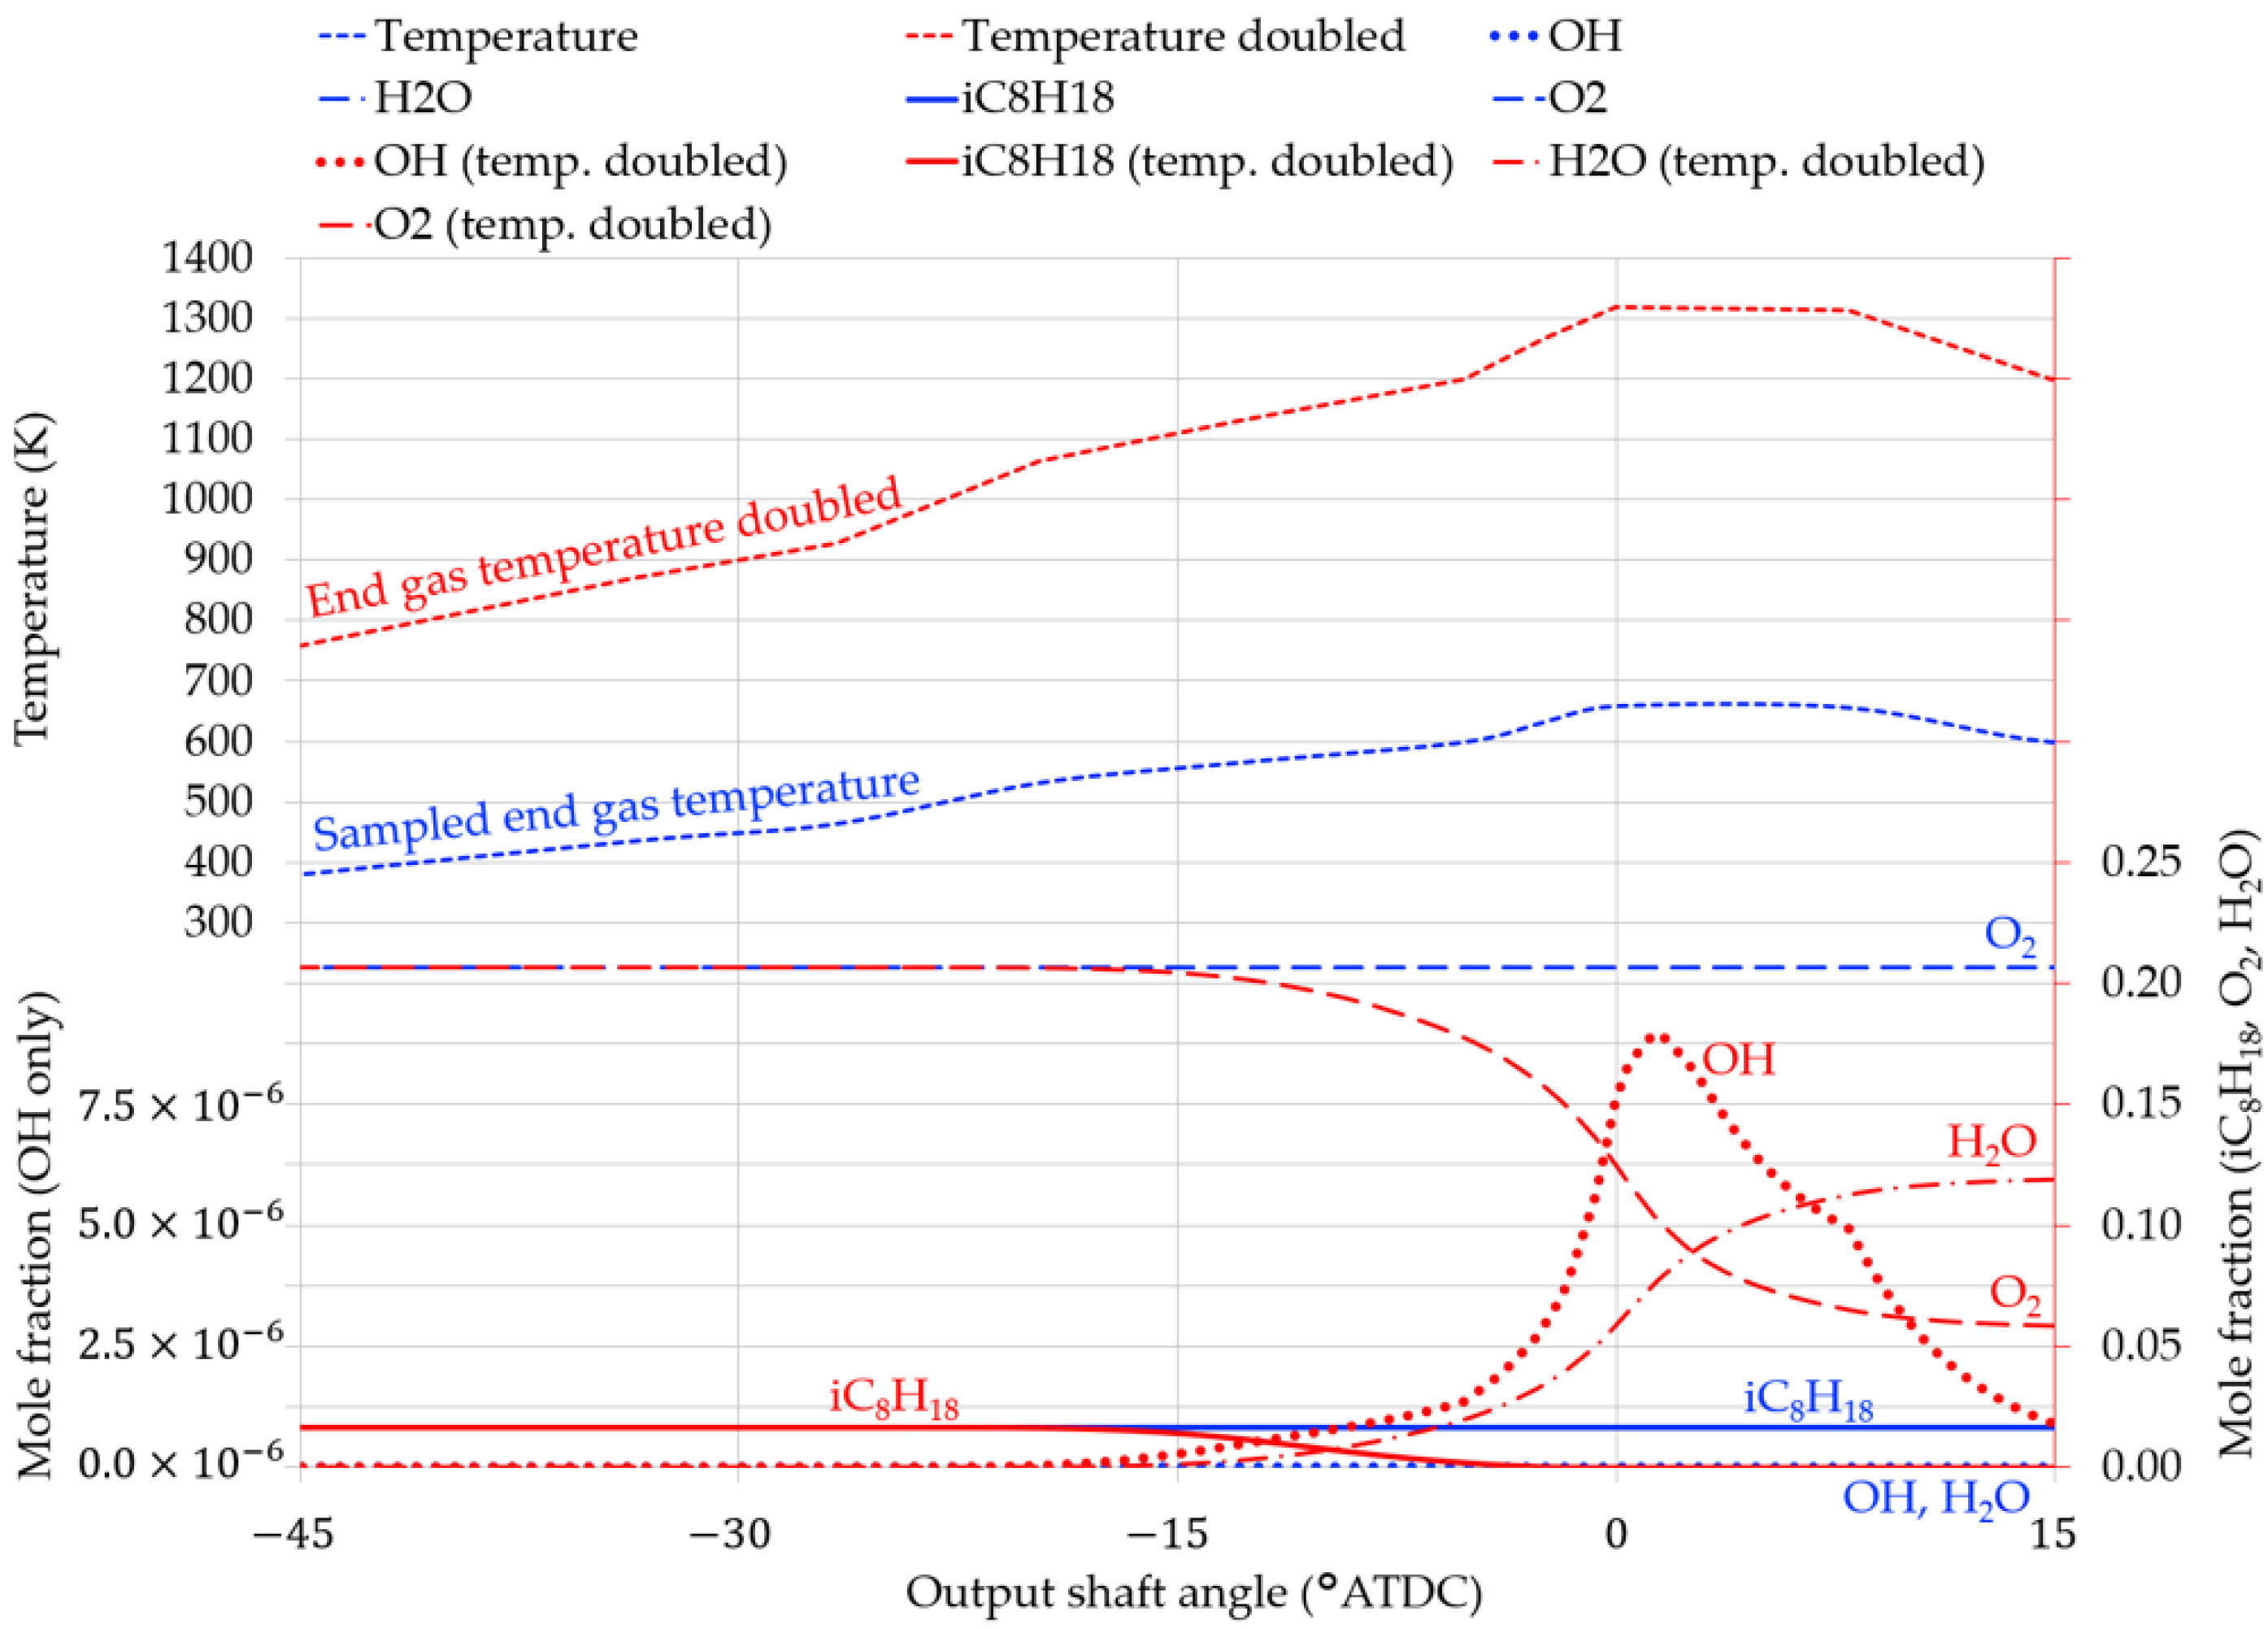
Figure 17.
(a) Approximate location of TJI pre-chamber installed in a Wankel engine housing; (b) the corresponding 3D CFD simulation domain.
Figure 17.
(a) Approximate location of TJI pre-chamber installed in a Wankel engine housing; (b) the corresponding 3D CFD simulation domain.
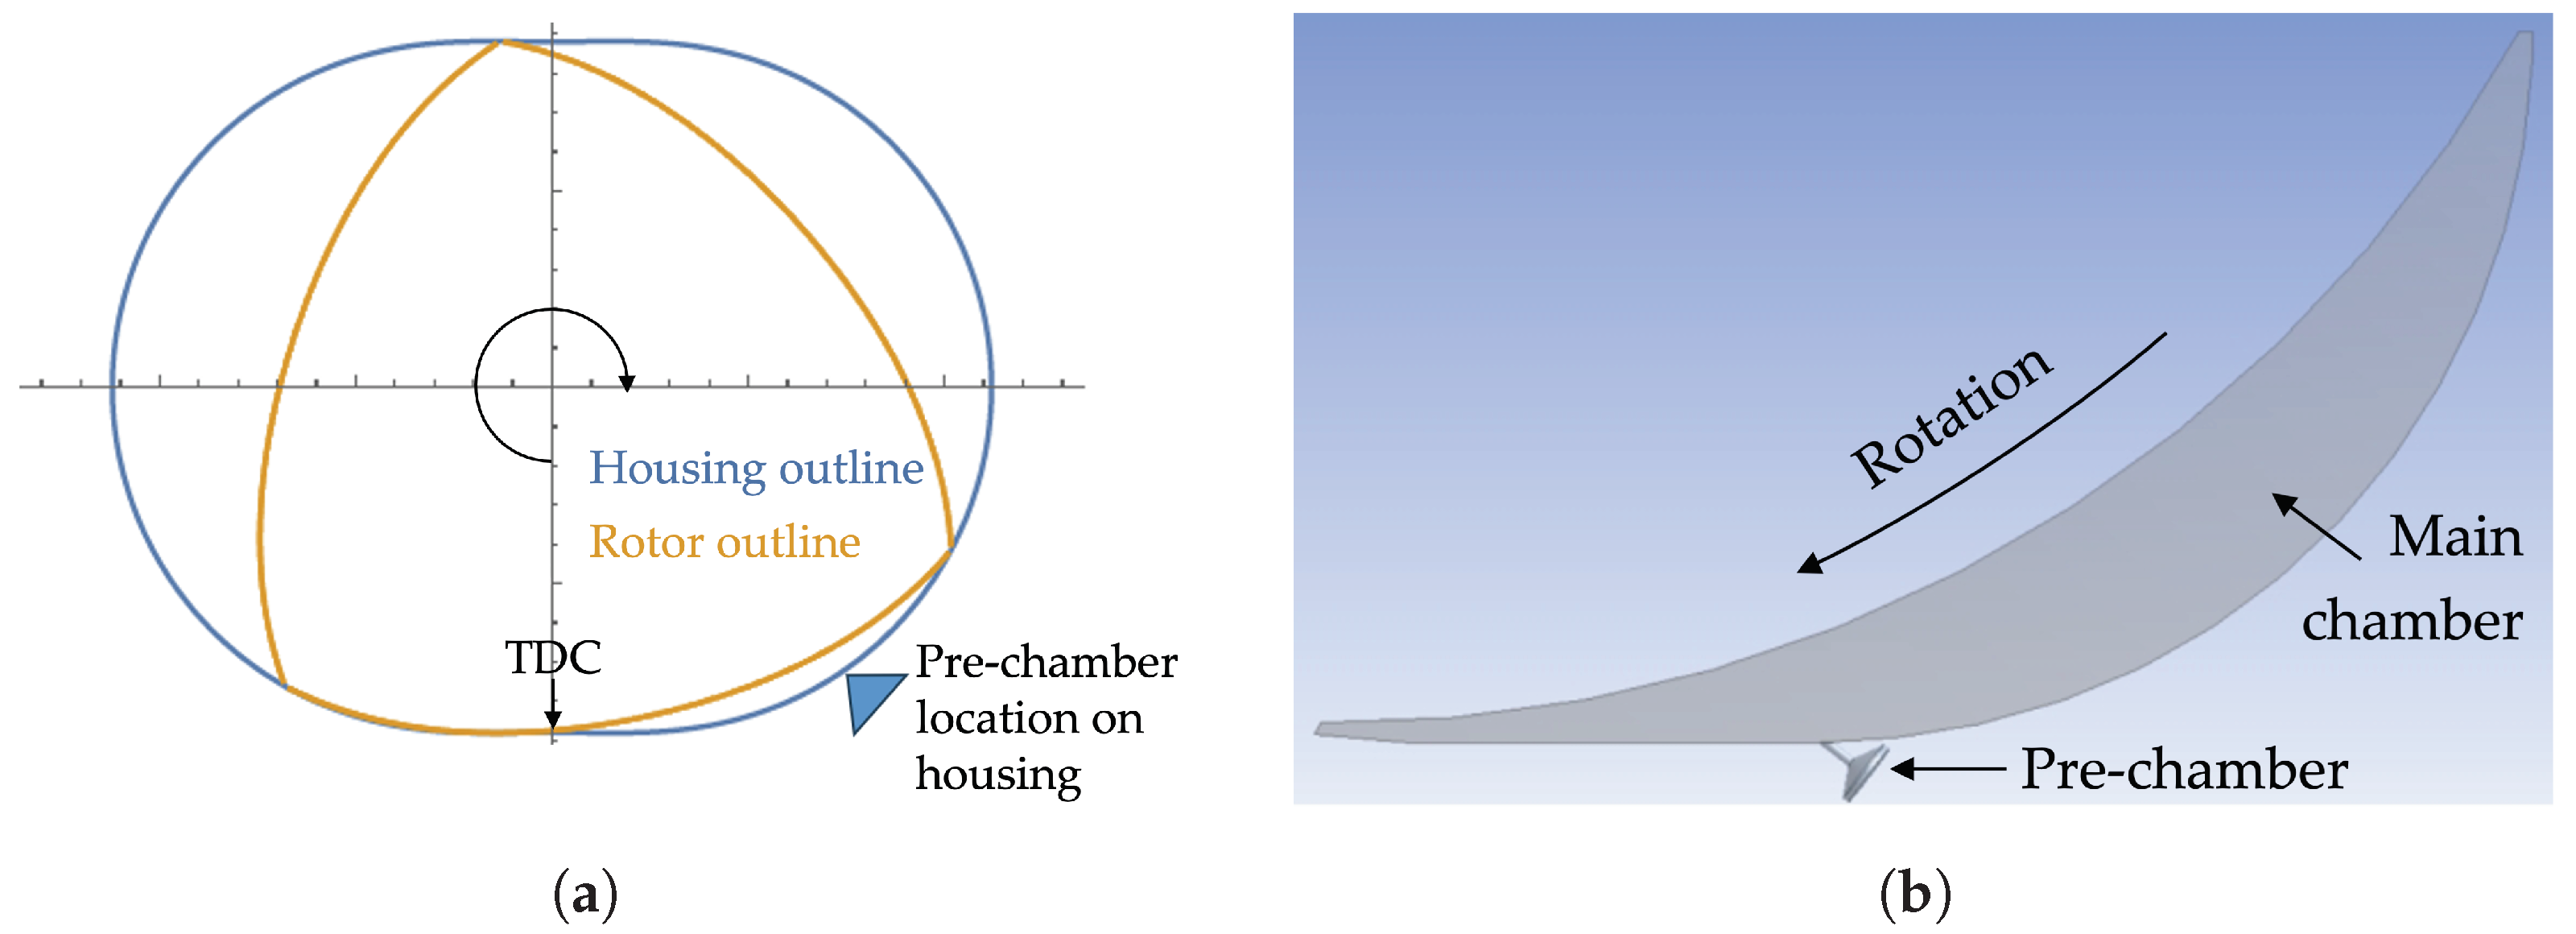
Figure 18.
CFD simulation of jet ignition with domed piston in pent-roof cylinder head showing LES-predicted temperature contours of the jet ignition process. The jet generated by the pre-chamber allows the flame to spread much faster than a conventional ignition system. (The temperature legend is provided without values since the contours are intended for an illustration of the concept only).

Figure 19.
LES-predicted velocity vectors (longer red vectors indicate higher velocity) of the charge entering the pre-chamber in (a) the reciprocating engine and (b) the Wankel engine.
Figure 19.
LES-predicted velocity vectors (longer red vectors indicate higher velocity) of the charge entering the pre-chamber in (a) the reciprocating engine and (b) the Wankel engine.
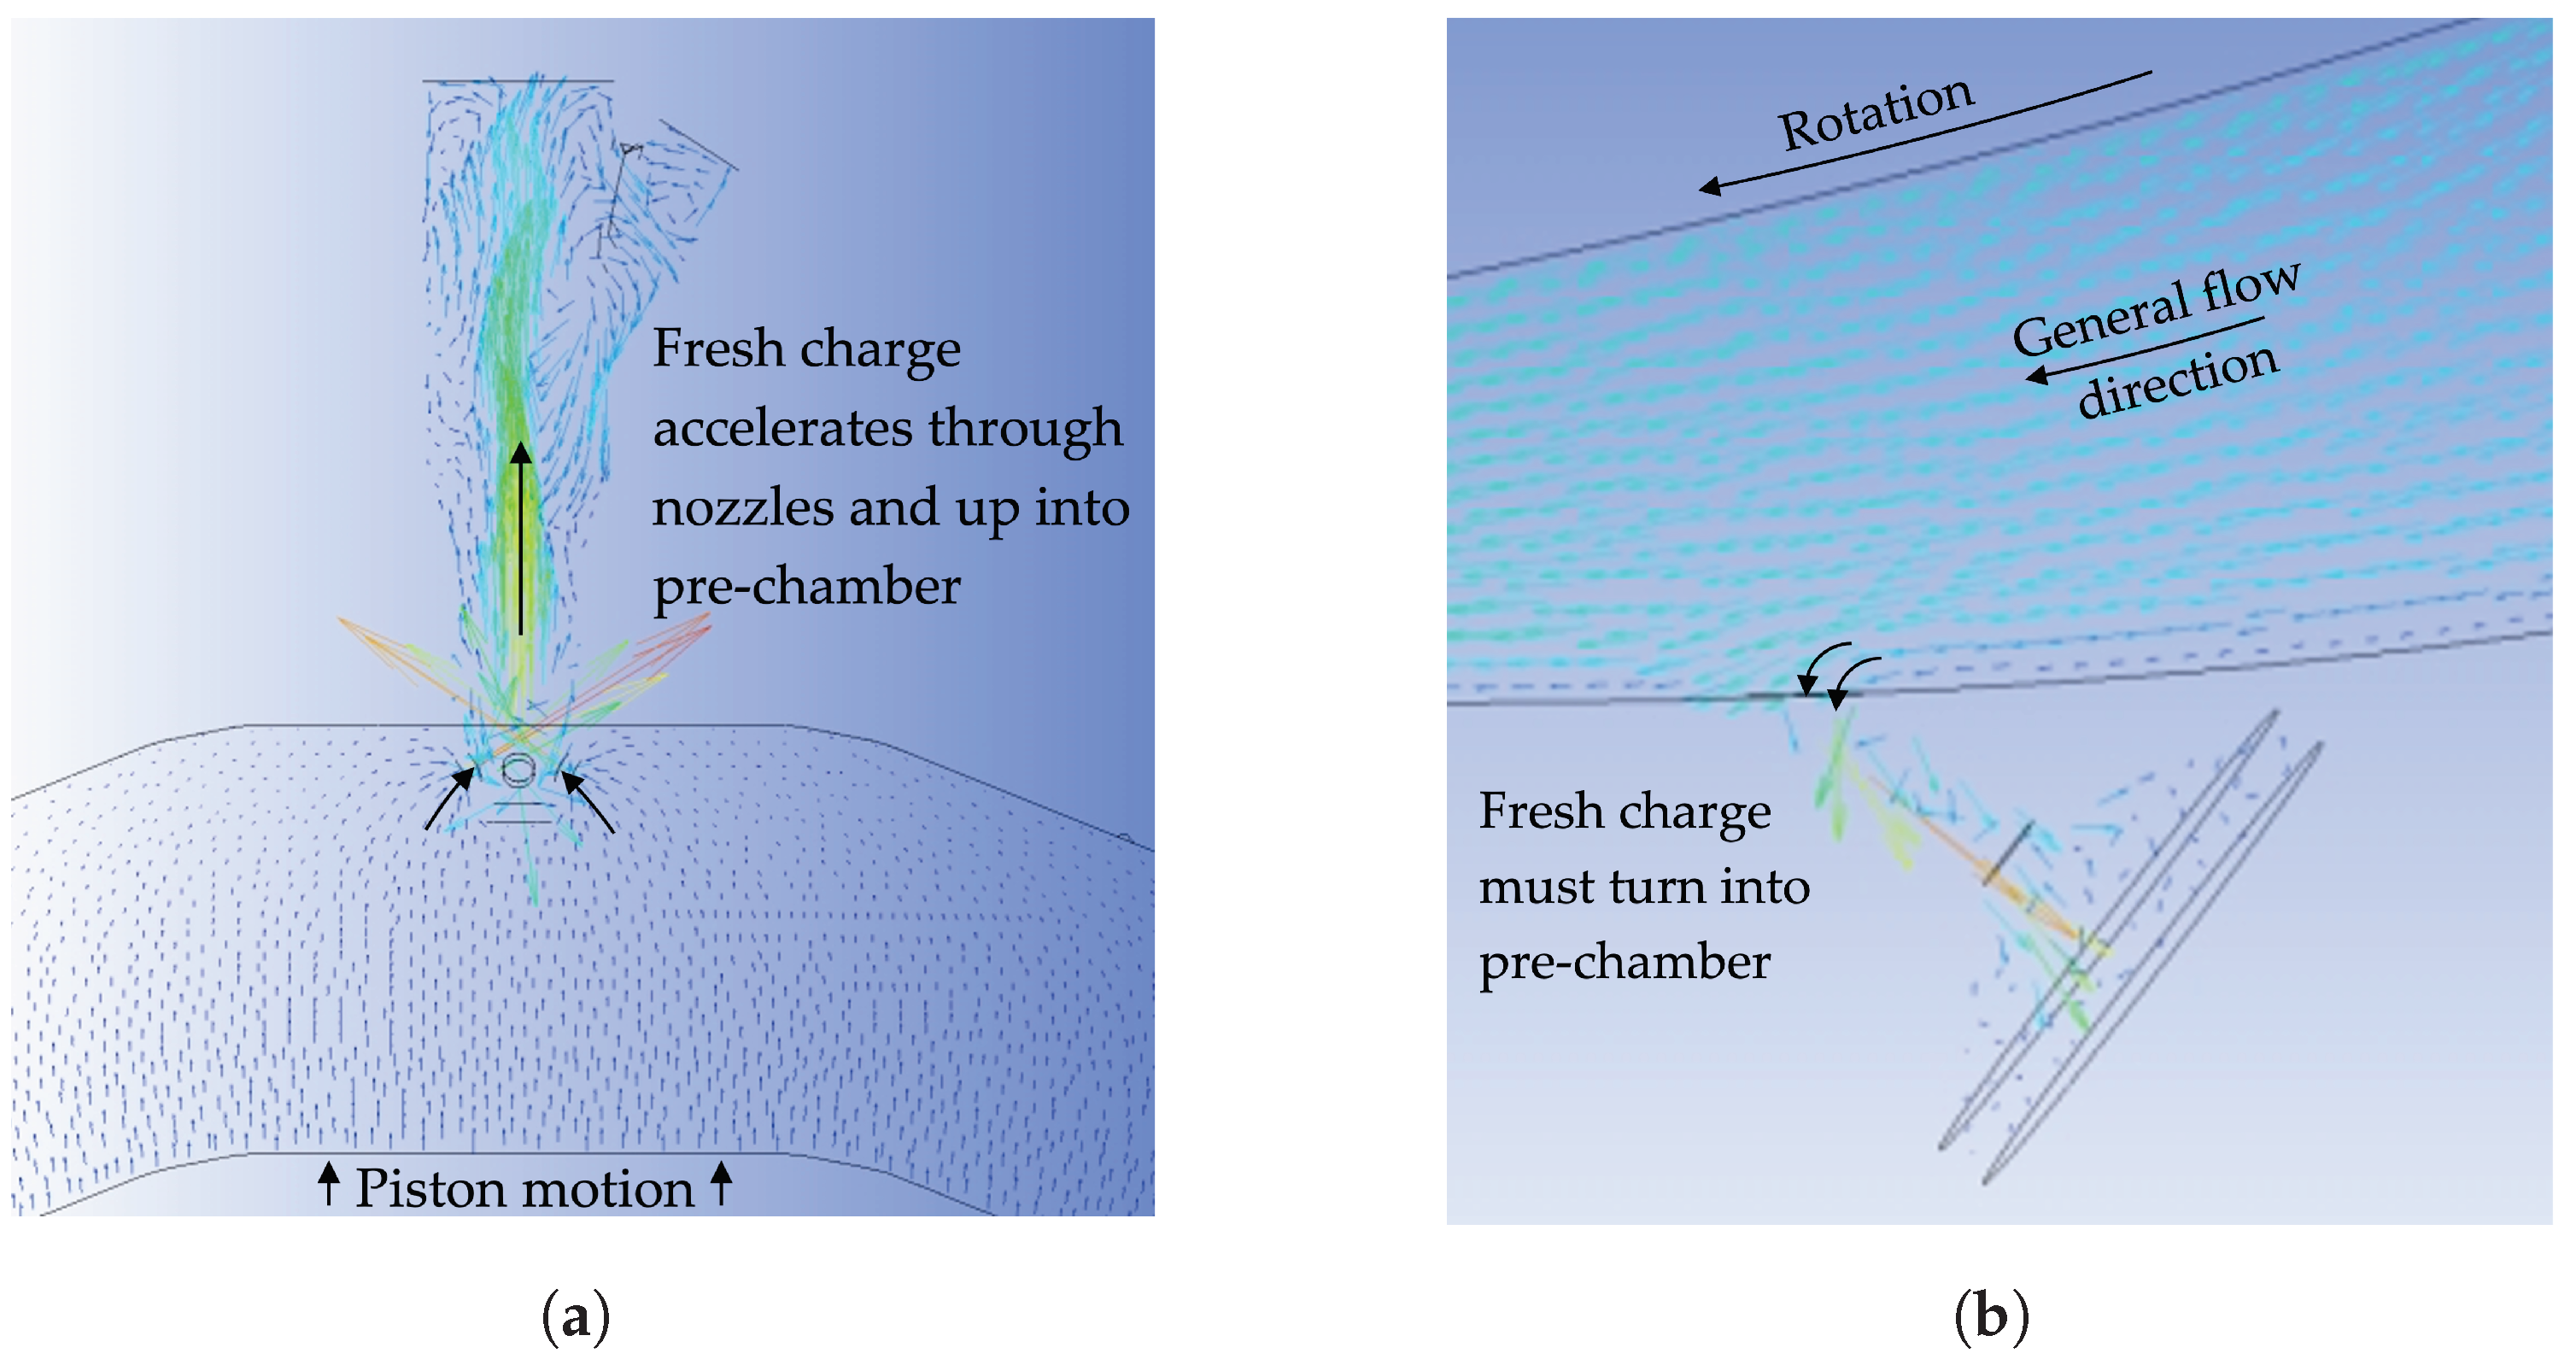
Figure 20.
(a) Twin pressure-connected pre-chamber nozzles located in the housing with valve-controlled connecting passage; (b) initial conditions in the CFD model (CO2 mass fraction contours).
Figure 20.
(a) Twin pressure-connected pre-chamber nozzles located in the housing with valve-controlled connecting passage; (b) initial conditions in the CFD model (CO2 mass fraction contours).
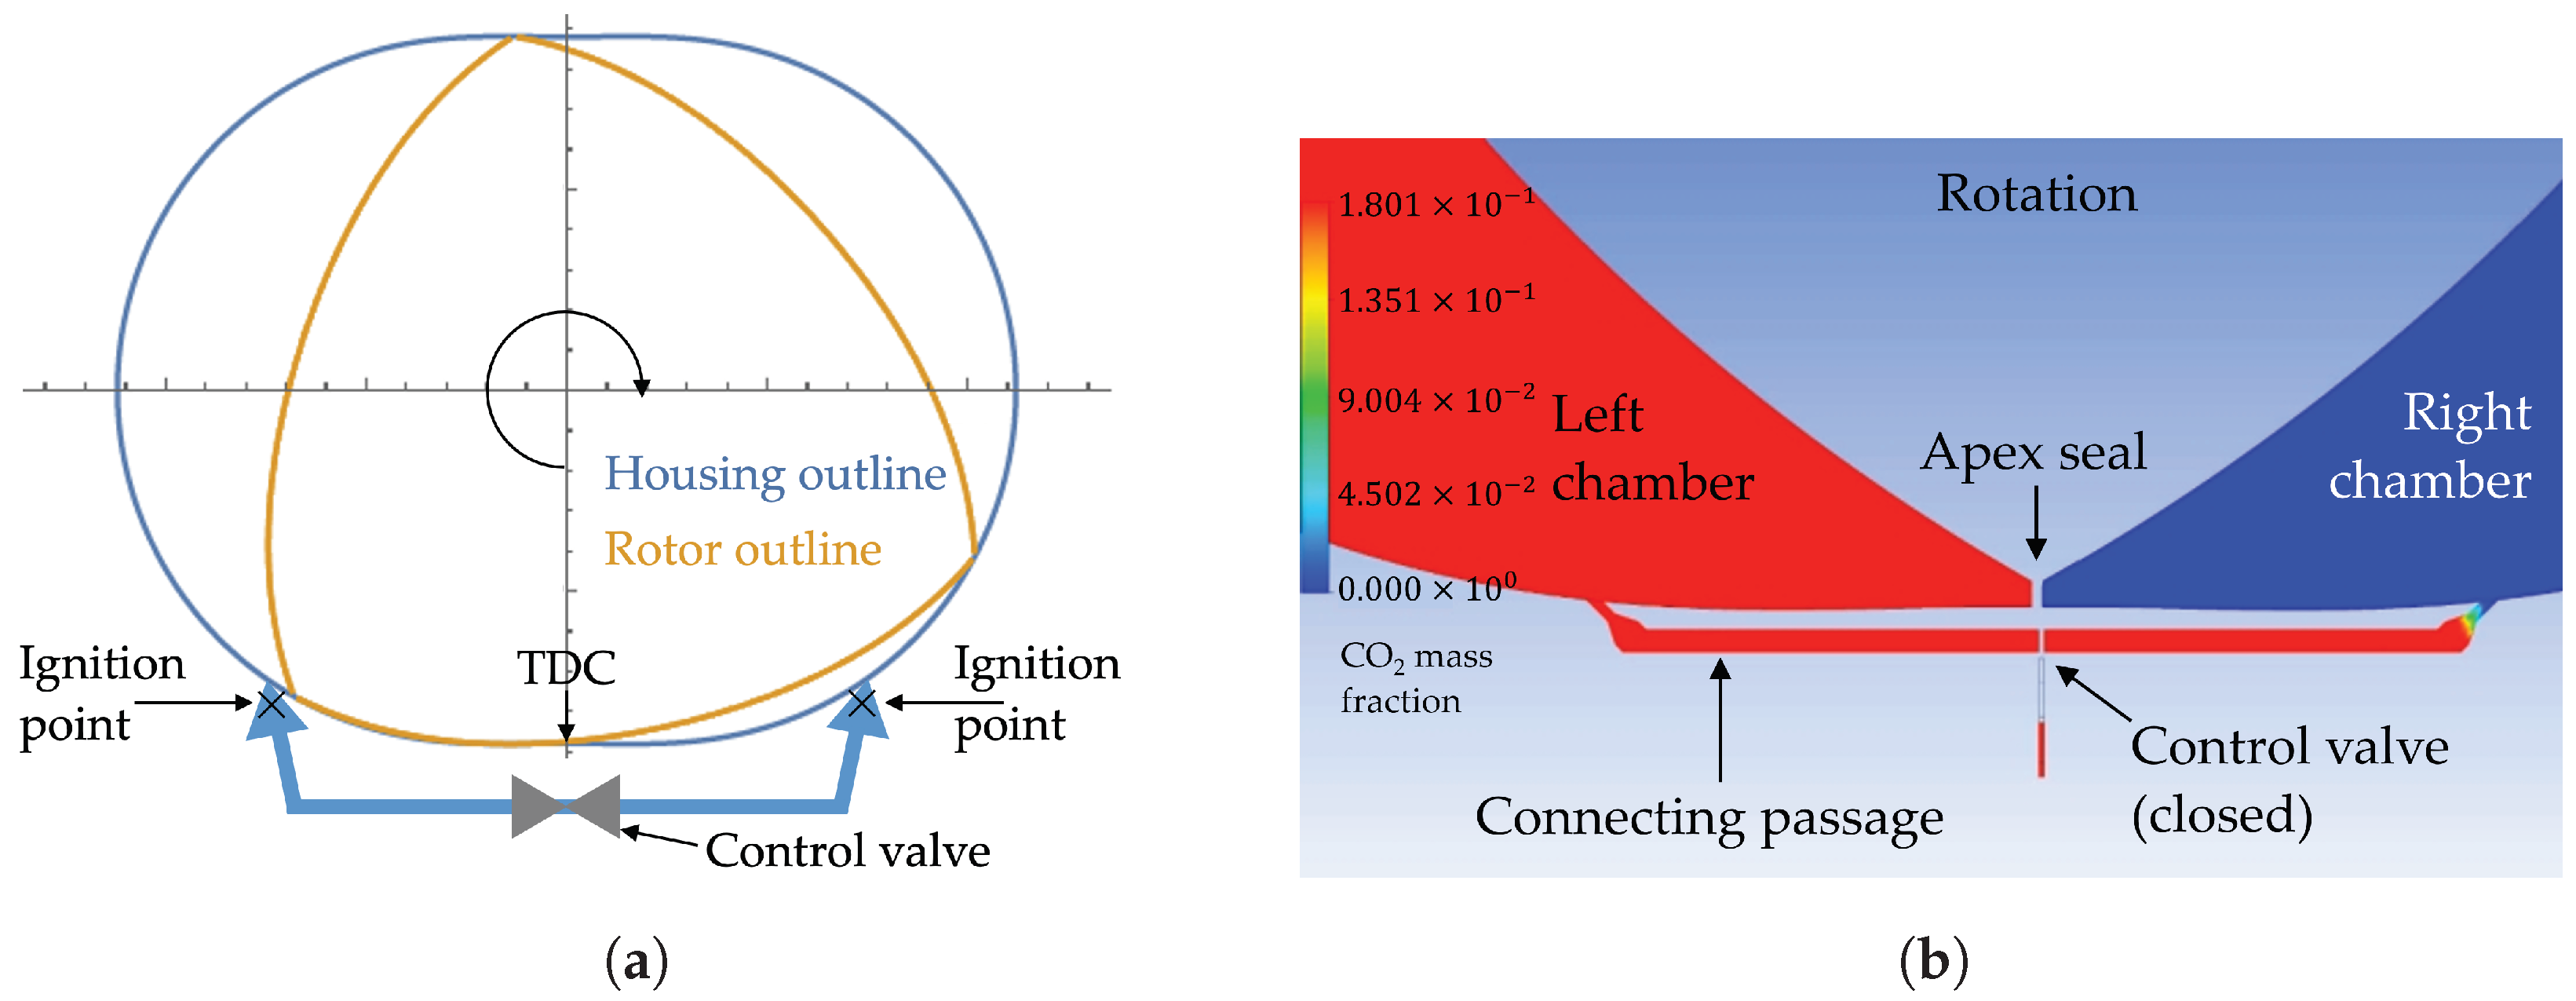
Figure 21.
(a) Simulation results (CO2 mass fraction contours) showing the opening of the passage control valve to promote the scavenging of the passage and pre-chambers; (b) qualitative combustion simulation in the twin pressure-connected pre-chamber nozzle system (temperature contours).
Figure 21.
(a) Simulation results (CO2 mass fraction contours) showing the opening of the passage control valve to promote the scavenging of the passage and pre-chambers; (b) qualitative combustion simulation in the twin pressure-connected pre-chamber nozzle system (temperature contours).
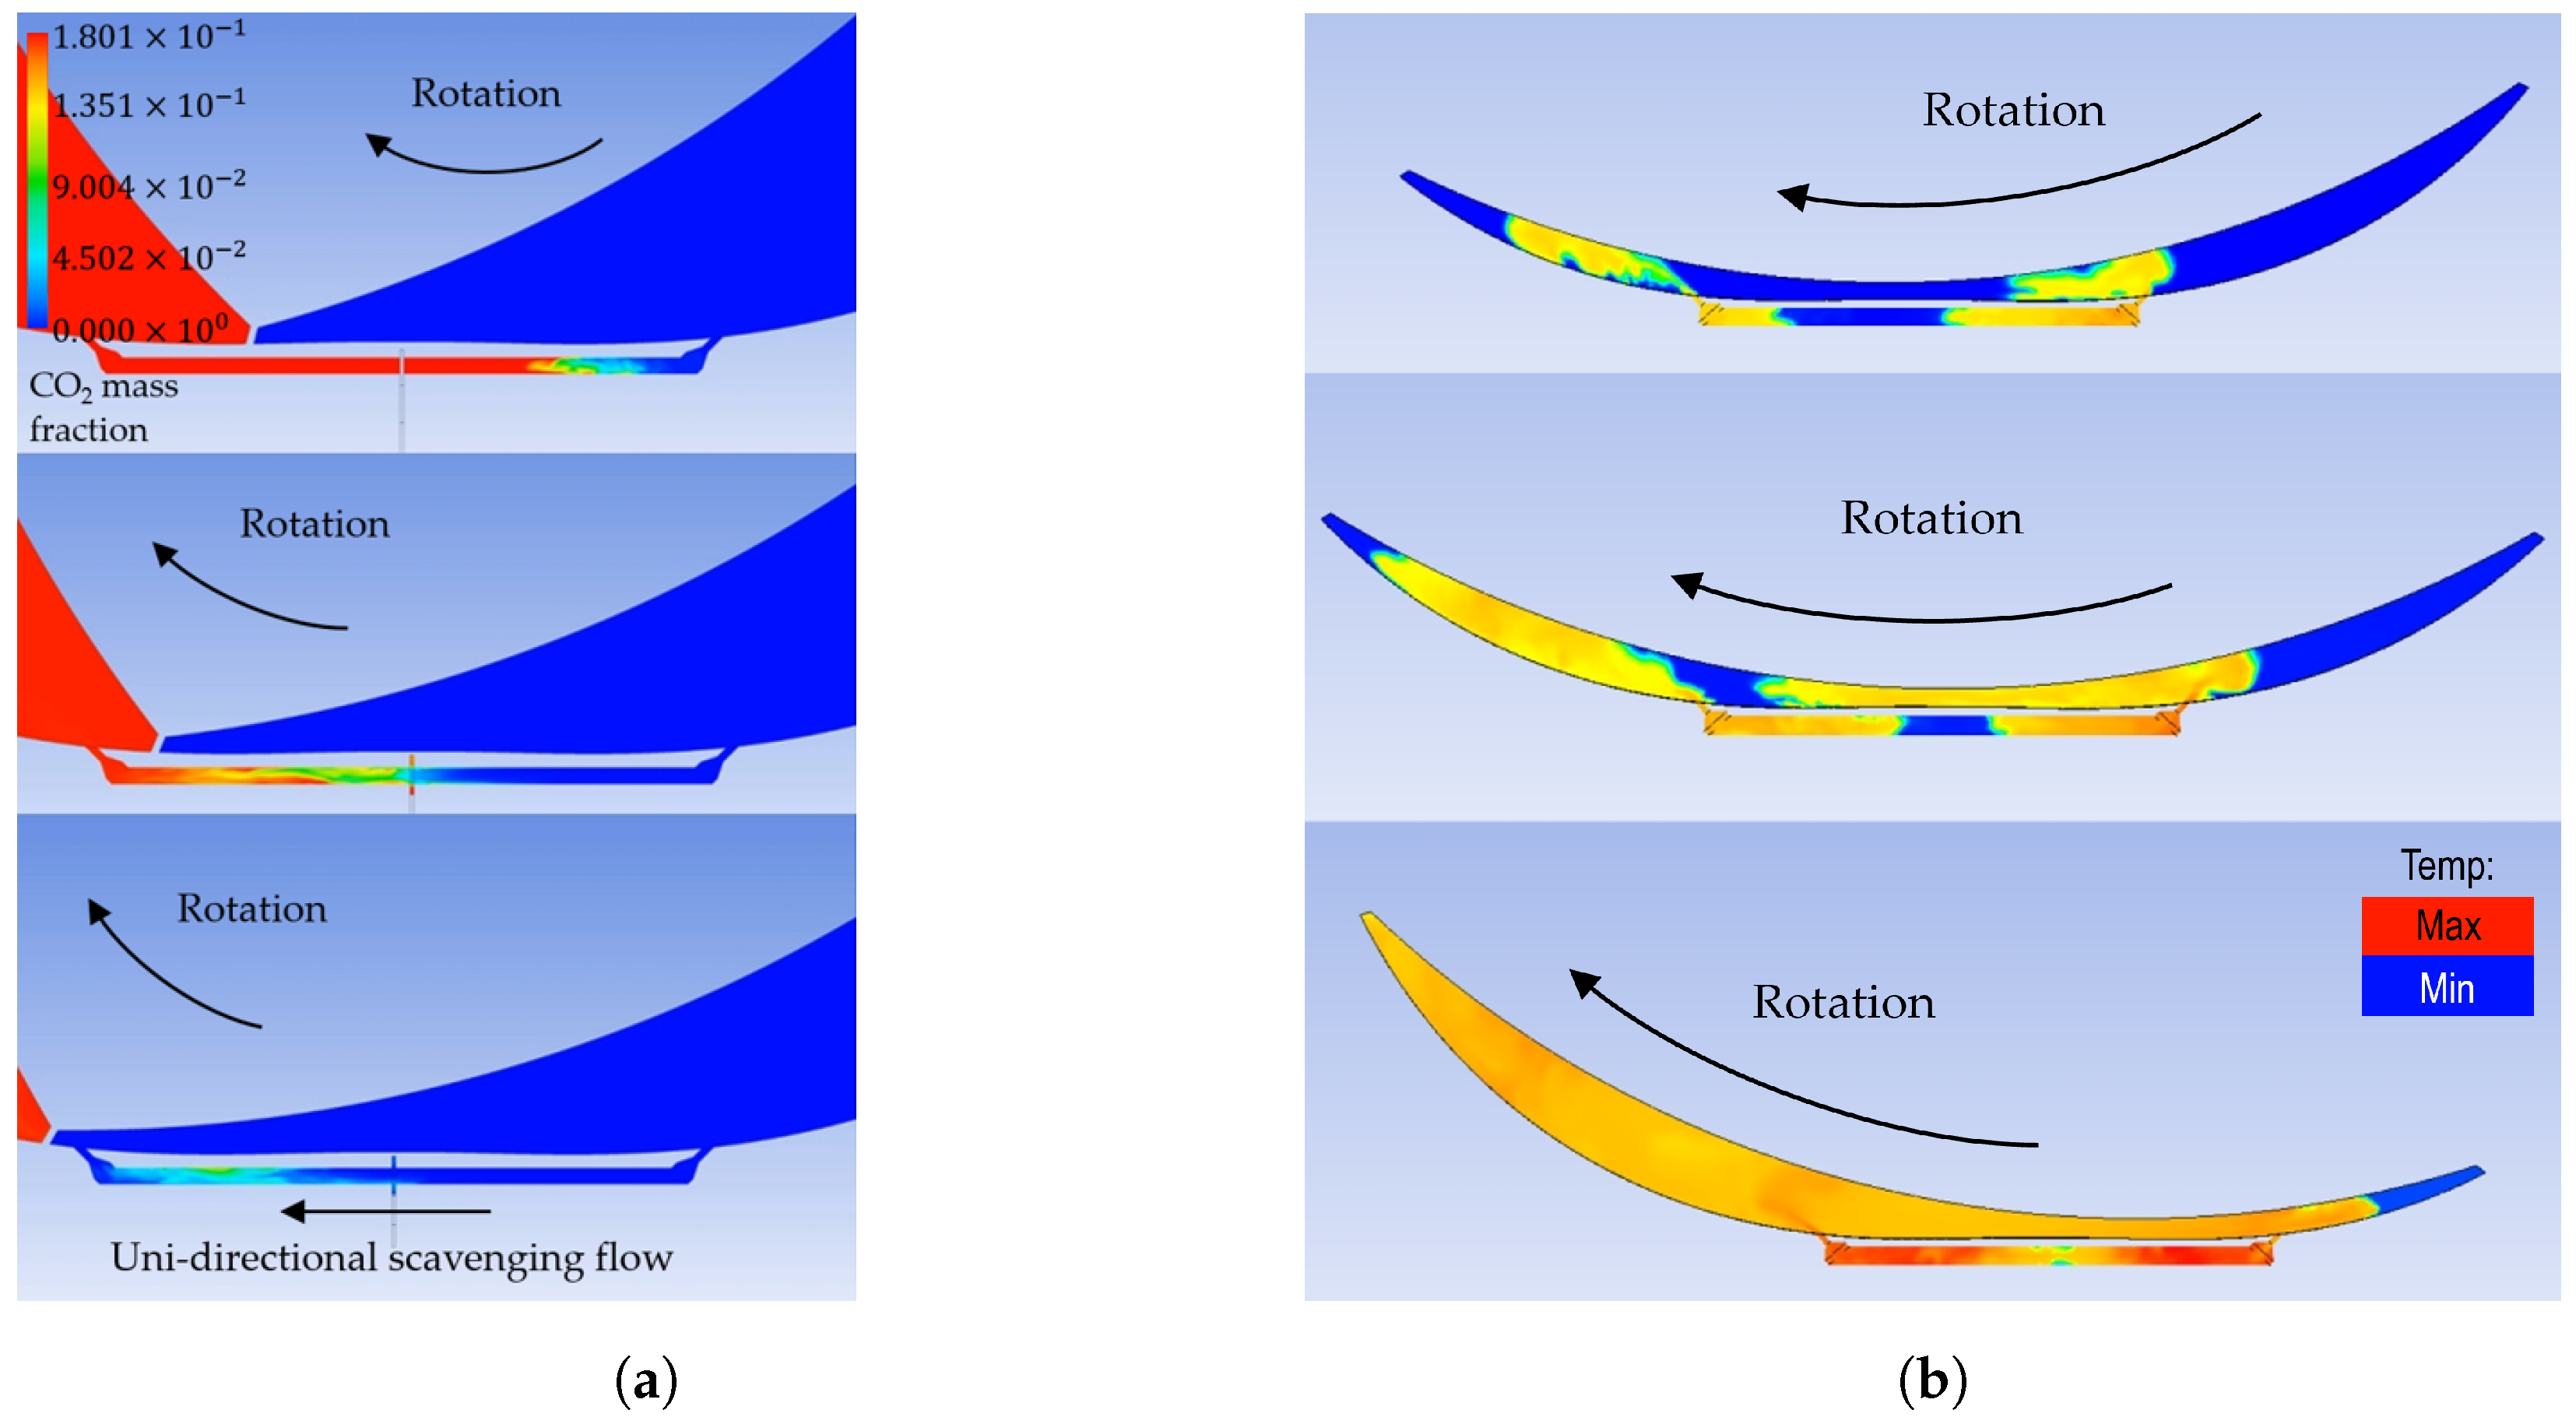
Figure 22.
(a) The Wankel rotary engine housing curve is described using the eccentricity, e, and the generating radius, R [28]. Epitrochoidal envelopes for three different ratios: (b) high, (c) low, (d) optimal. Drawings (b–d) were generated using the Wolfram project “Wankel Rotary Engine: Epitrochoidal Envelopes” [40].

Figure 23.
CFD model domain of the two-stage, two-rotor engine concept.
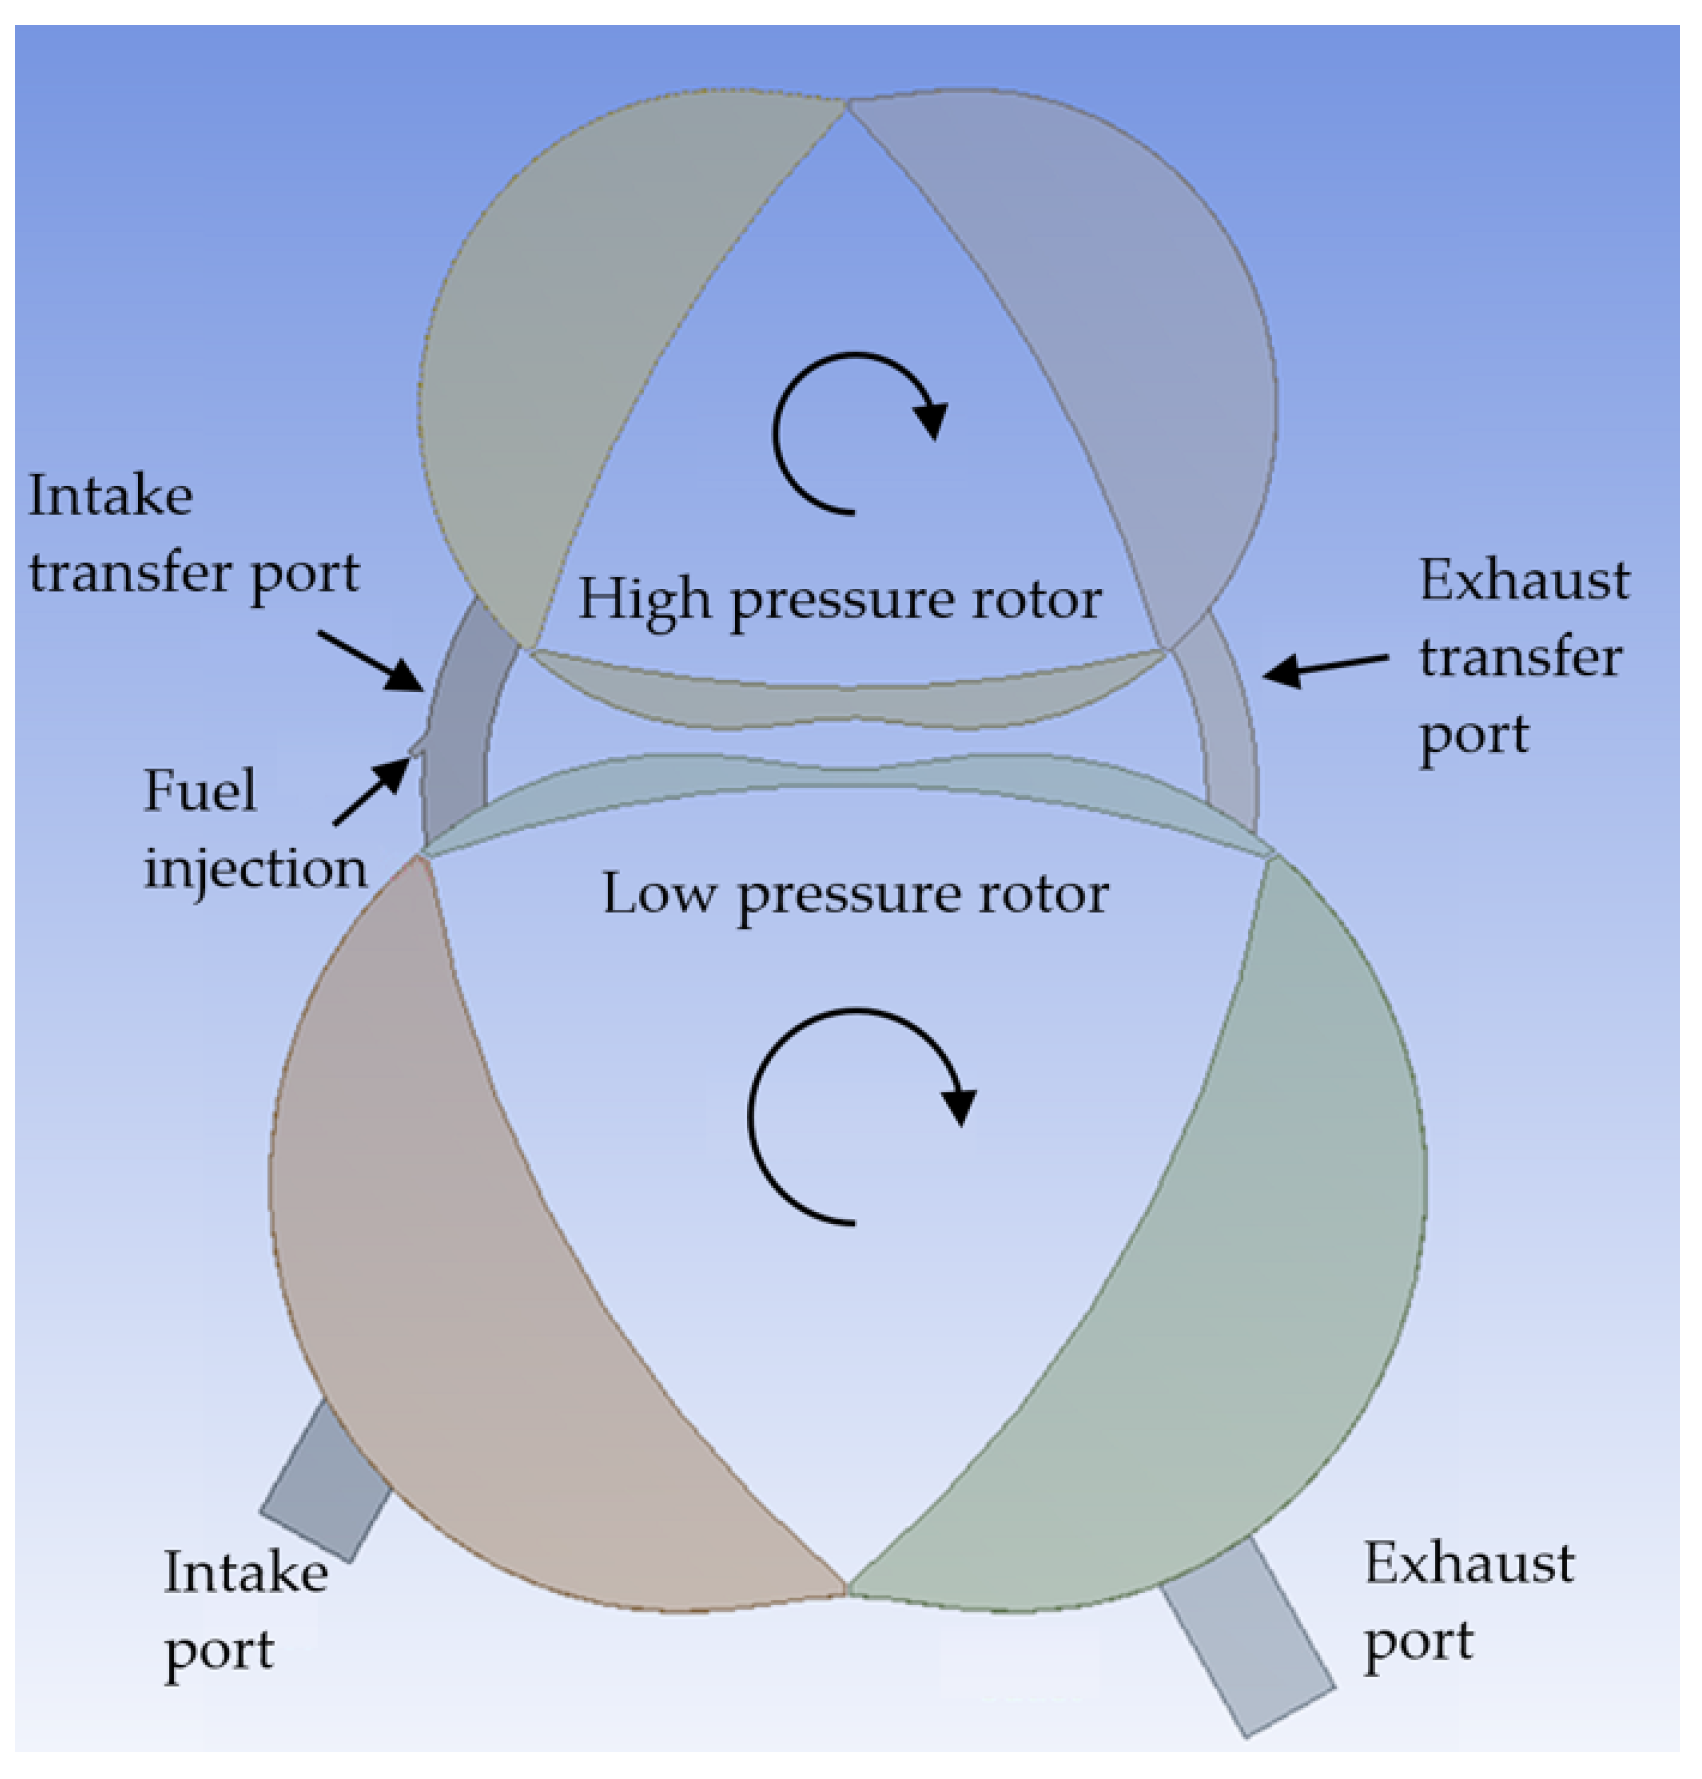
Figure 24.
Overlap between intake and exhaust ports in a peripherally ported Wankel engine creates a pathway the for blow-through of the fresh charge.
Figure 24.
Overlap between intake and exhaust ports in a peripherally ported Wankel engine creates a pathway the for blow-through of the fresh charge.
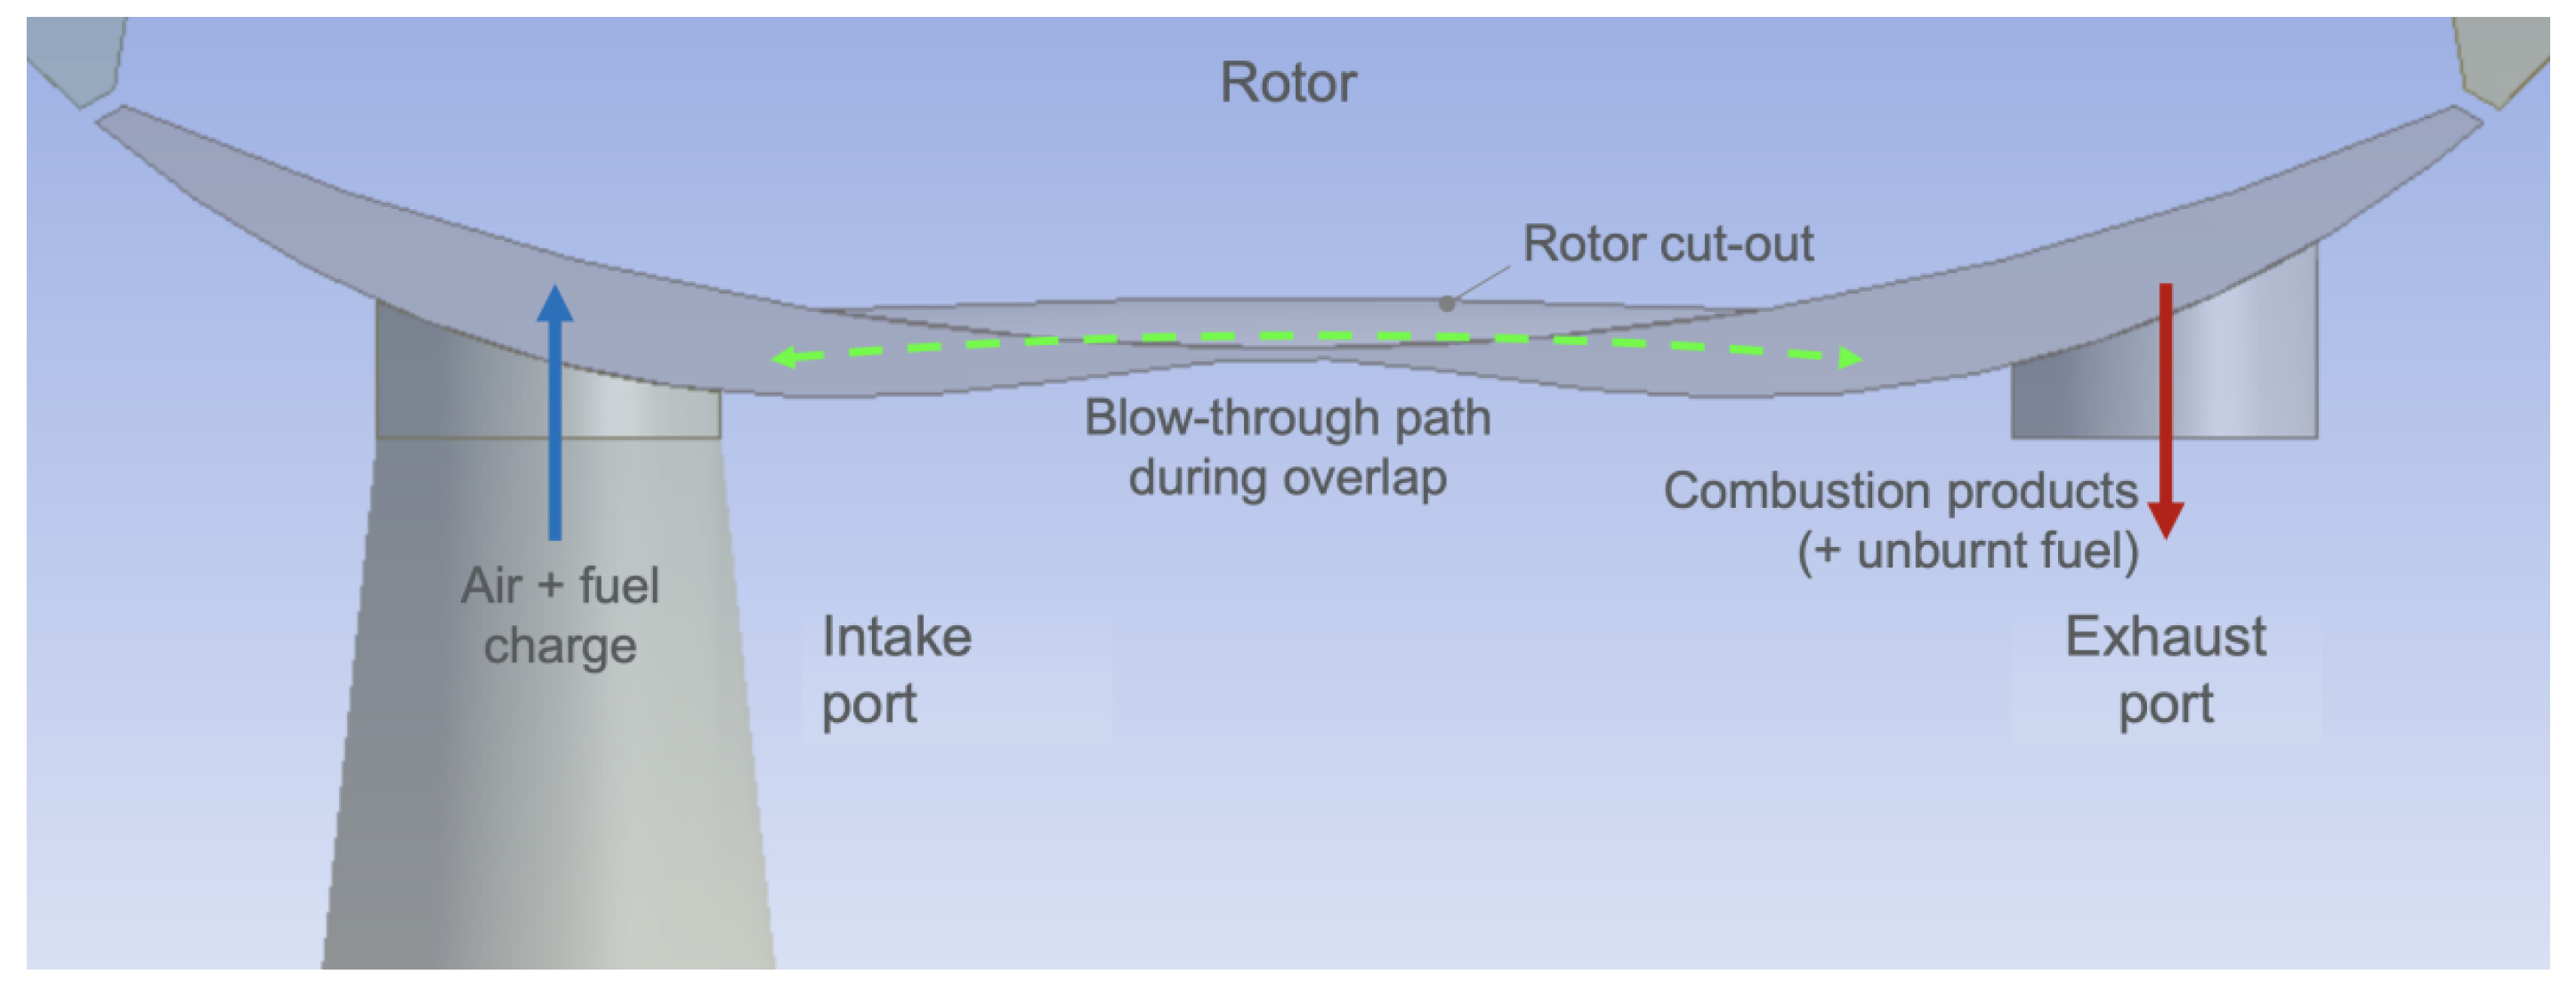
Figure 25.
Simulation of fuel injection and mixing in the high-pressure chamber (contours of fuel mass fraction): (a) fuel injection in the intake transfer port, (b–d) fuel mixing in the high-pressure chamber, and (e) achieving a homogeneous mixture. Arrows indicate direction of rotor rotation.
Figure 25.
Simulation of fuel injection and mixing in the high-pressure chamber (contours of fuel mass fraction): (a) fuel injection in the intake transfer port, (b–d) fuel mixing in the high-pressure chamber, and (e) achieving a homogeneous mixture. Arrows indicate direction of rotor rotation.
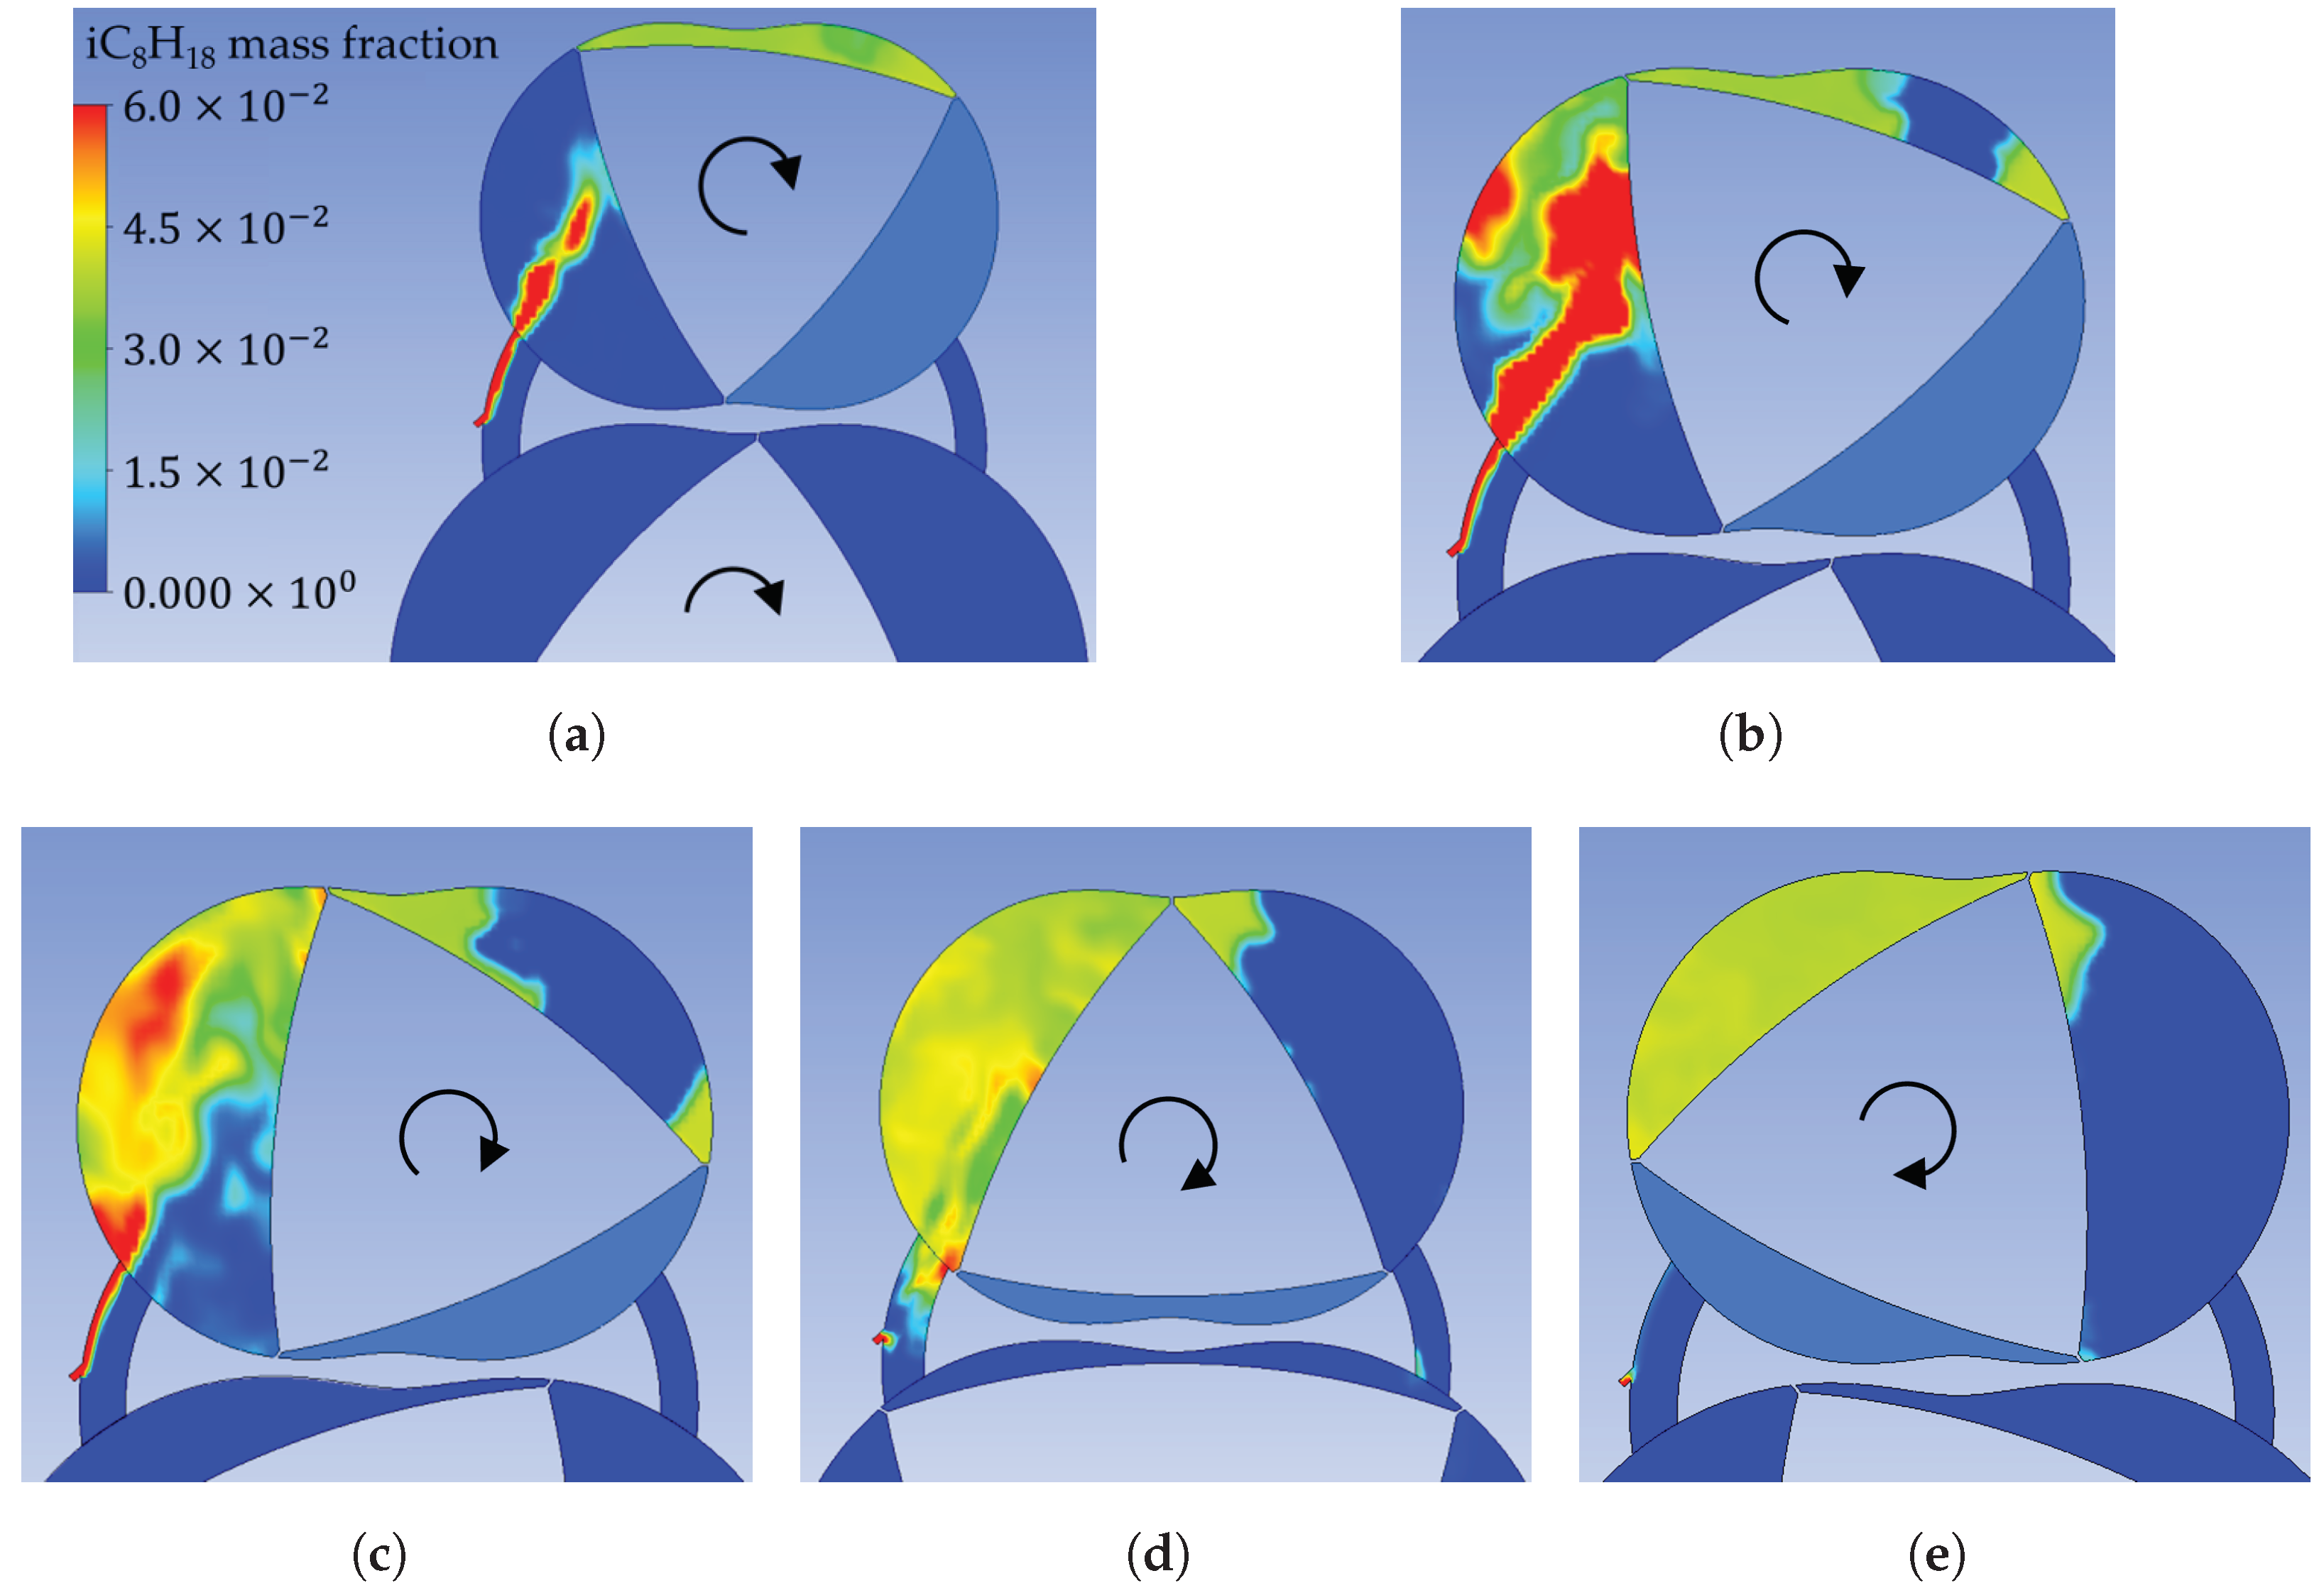
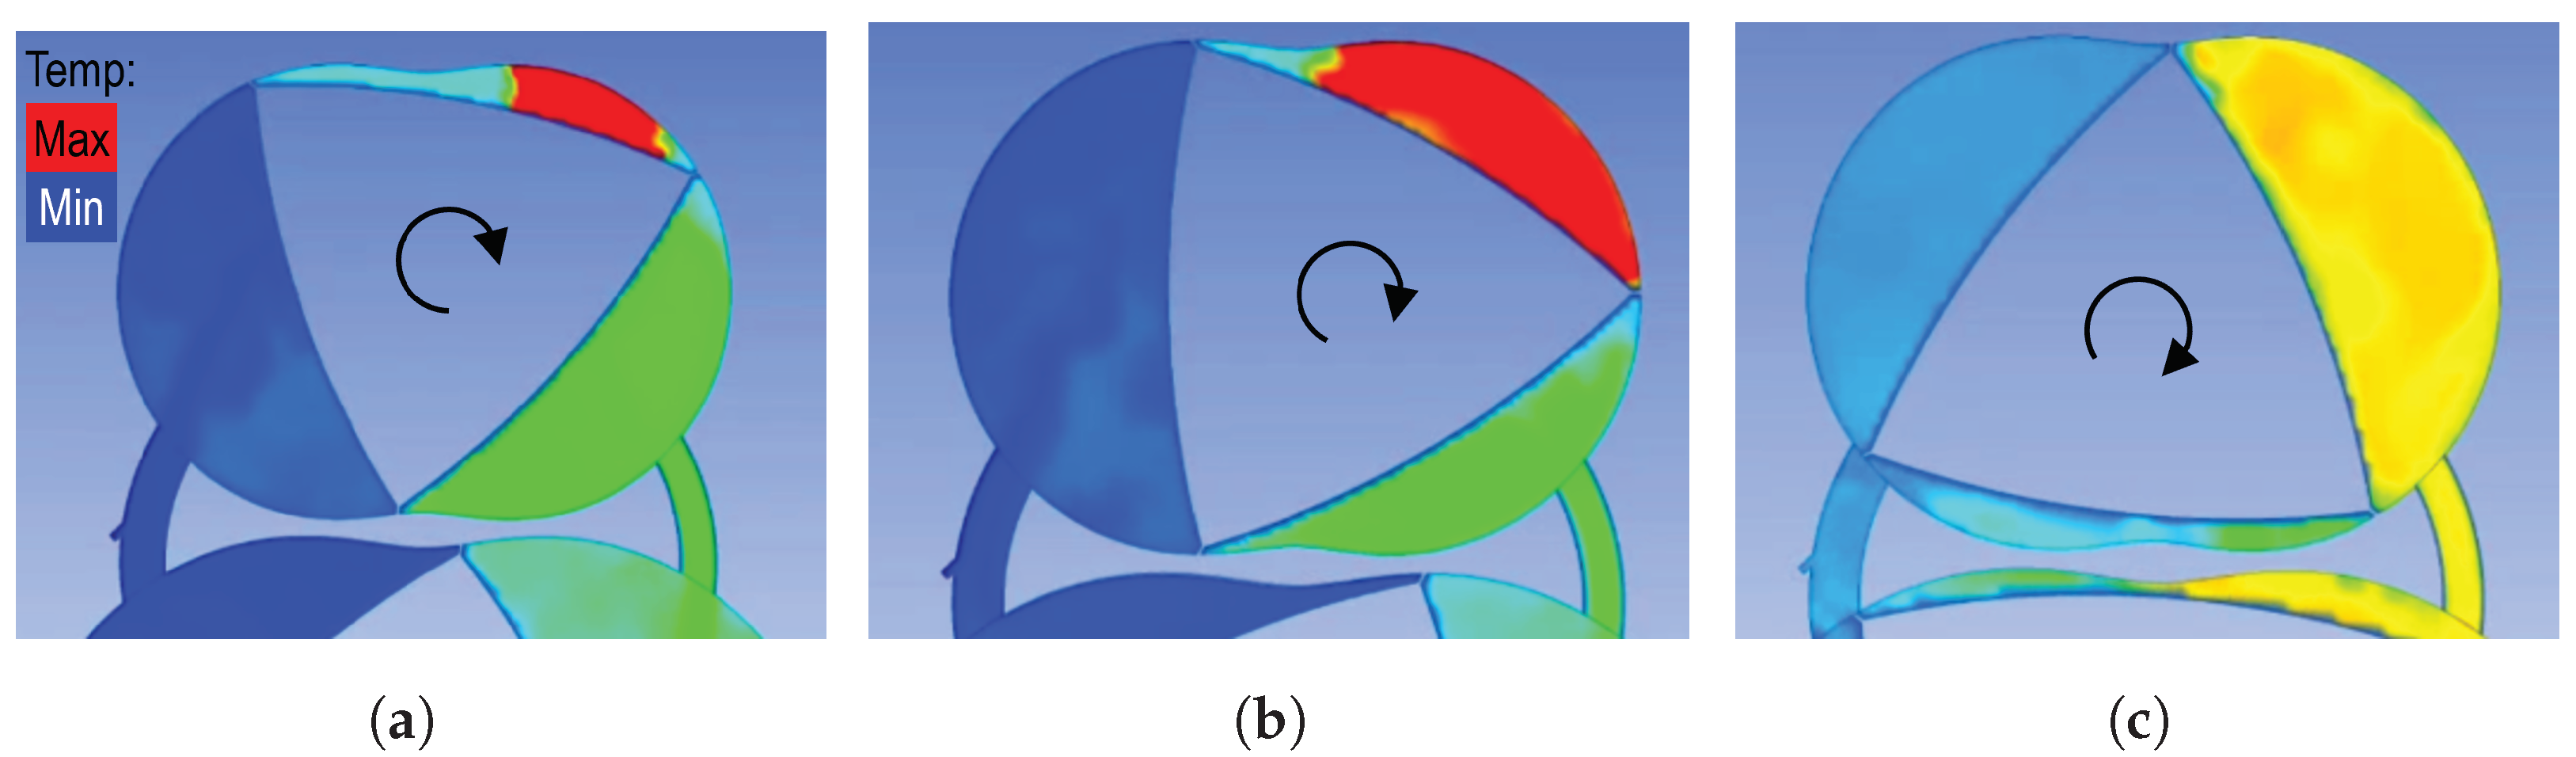
Figure 26.
Flame propagation in the high-pressure stage of a two-stage Wankel engine (qualitative temperature contours): (a) a wider pinch point offers less restriction to flame propagation; (b) the expansion of hot combustion products; and (c) the transfer of expanding gases to the low-pressure stage. Arrows indicate direction of rotor rotation.

Table 1.
AIE 225CS Wankel rotary engine specifications; angles correspond to the output shaft.
| Parameter | Value | Units |
|---|---|---|
| Generating radius (rotor), R | 69.5 | mm |
| Generating radius (housing) | 71.5 | mm |
| Eccentricity, e | 11.6 | mm |
| Eccentricity ratio, | 0.167 | - |
| Number of rotors | 1 | - |
| Displacement | 225 | cm3 |
| Compression ratio | 9.6 | - |
| Intake port opens | 71 | °BTDC |
| Intake port closes | 60 | °BTDC |
| Exhaust port opens | 69 | °BBDC |
| Exhaust port closes | 57 | °ATDC |
| Number of spark plugs | 2 | - |
| Ignition timing | 18 | °BTDC |
Disclaimer/Publisher’s Note: The statements, opinions and data contained in all publications are solely those of the individual author(s) and contributor(s) and not of MDPI and/or the editor(s). MDPI and/or the editor(s) disclaim responsibility for any injury to people or property resulting from any ideas, methods, instructions or products referred to in the content. |
© 2024 by the authors. Licensee MDPI, Basel, Switzerland. This article is an open access article distributed under the terms and conditions of the Creative Commons Attribution (CC BY) license (https://creativecommons.org/licenses/by/4.0/).
Share and Cite
MDPI and ACS Style
Shen, X.; Costall, A.W. Enhancing the Efficiency of Rotary Thermal Propulsion Systems. Energies 2024, 17, 2112. https://doi.org/10.3390/en17092112
AMA Style
Shen X, Costall AW. Enhancing the Efficiency of Rotary Thermal Propulsion Systems. Energies. 2024; 17(9):2112. https://doi.org/10.3390/en17092112
Chicago/Turabian StyleShen, Xuankun, and Aaron W. Costall. 2024. "Enhancing the Efficiency of Rotary Thermal Propulsion Systems" Energies 17, no. 9: 2112. https://doi.org/10.3390/en17092112
Note that from the first issue of 2016, this journal uses article numbers instead of page numbers. See further details here.