1. Introduction
During the well-completion testing phase of natural gas hydrates, it is necessary to lower various instruments, pipelines, and cables below the testing string. As the entire string is directly exposed to seawater during the lowering process, the vortex-induced lift and drag forces generate periodic lateral oscillations, which create instability in the testing string and fixed pipelines when subjected to wave action. As a result, collisions and interference occur, causing damage to the fixed-coupled testing pipelines, instrument cables, and other components. These damages significantly impede the progress of well-completion testing. An urgent investigation is required to examine the lateral displacement and stress distribution of the gas hydrate testing column under extreme operating conditions at sea. This investigation aims to effectively limit the displacement and buffer collision forces of the testing column caused by wave action, ultimately providing a theoretical foundation for calculating the load when inserting the hydrate completion into the testing column. An inadequate handling capacity to accommodate the sinking of the wellhead has been consistently observed during deepwater drilling operations in Brazil, West Africa, and Gulf of Mexico, leading to the abandonment of wellbores [
1,
2].
A great deal of research has been devoted to the analysis of the forces and loads to which the landing lines are subjected. Azar et al. introduced the notion of quasi-static environmental loads [
3]. In 2005, Everage et al. presented mathematical models for predicting the dynamic axial loads imposed on the deepwater landing string by the response of the drilling vessel to the oceanic wave action. The model could be adapted to a given landing string’s geometric and mechanical constraints [
4]. Bradford et al. used five sets of deepwater landing string hangers to perform caving tests on a tubular column, including elastic load tests near yield strength and overload tests beyond yield strength, to determine wellhead stresses on a tubular column during deepwater drilling when lowering a heavy tubular string [
5]. Zhang H. et al. proposed a tension load-based design method for the descent riser [
6]. Gao D. et al. considered the characteristics of deep-water environmental loads and non-segregating water pipe operations, mainly focusing on axial static loads for design. As a result, they developed static strength design and dynamic verification methods for inserting drill pipes into deep-water non-segregating water pipes [
7,
8,
9]. Guan Z. et al. developed a calculation model for quasi-static loads on drill pipes in a non-segregating water environment, based on the Euler–Bernoulli beam theory. They utilized the weighted residual method to solve and analyze the effects of marine environmental loads, drilling ship offset motion, and the gravity of the bottom casing column on the forces, deformation, and strength of the drill pipe, thus offering optimized structural solutions [
10]. He Li et al. researched the impact of the dynamic tensile load caused by the vertical movement of a drillship on the landing string. They created a mathematical model that considers the Bottom Hole Assembly (BHA) and Guide Base Plate (GBP) effects, aspects frequently overlooked by other scholars [
11]. Liu [
12], Dutta [
13], Karampour [
14], and Zhao [
15] addressed the impact of factors such as wind, waves, and constraints on the forces, deformations, and strength of the inserted pipe column during deepwater drilling. They presented numerical modeling, nonlinear dynamic analysis, and experimental assessments to understand the behavior and failure risks of the landing string in offshore environments. In addition, some scholars, taking into account the characteristics of deepwater environmental loads and the operational conditions of unsegregated water pipes, have developed a design approach primarily based on axial static loads. This approach focuses on the static strength design and dynamic verification of the deepwater unsegregated water pipe descent riser, leading to the acquisition of certain regular insights [
16,
17,
18,
19,
20].
Although there are numerous reports on the landing string design from foreign sources, little attention has been focused on the analysis of the constraints on the lateral movements of the rope and the impact on the tension of the rope during the descent of support [
21]. Consequently, it is imperative to undertake a thorough mechanical analysis to examine the load characteristics associated with landing strings.
The influence of marine environmental loads and gravity on the bottom casing column is comprehensively examined in this study. Utilizing theories on column mechanics and marine environmental load, the problem is solved using Ansys software 19.2. Through the analysis of various factors using engineering examples, the study investigates how these factors impact the forces, deformations, and strength safety of the inserted casing column during deep-water drilling. This research provides a theoretical foundation for the load calculations and strength design of the inserted casing column in deep-water drilling.
2. Landing Pipe Column-Lowering Condition and Environmental Load Analysis
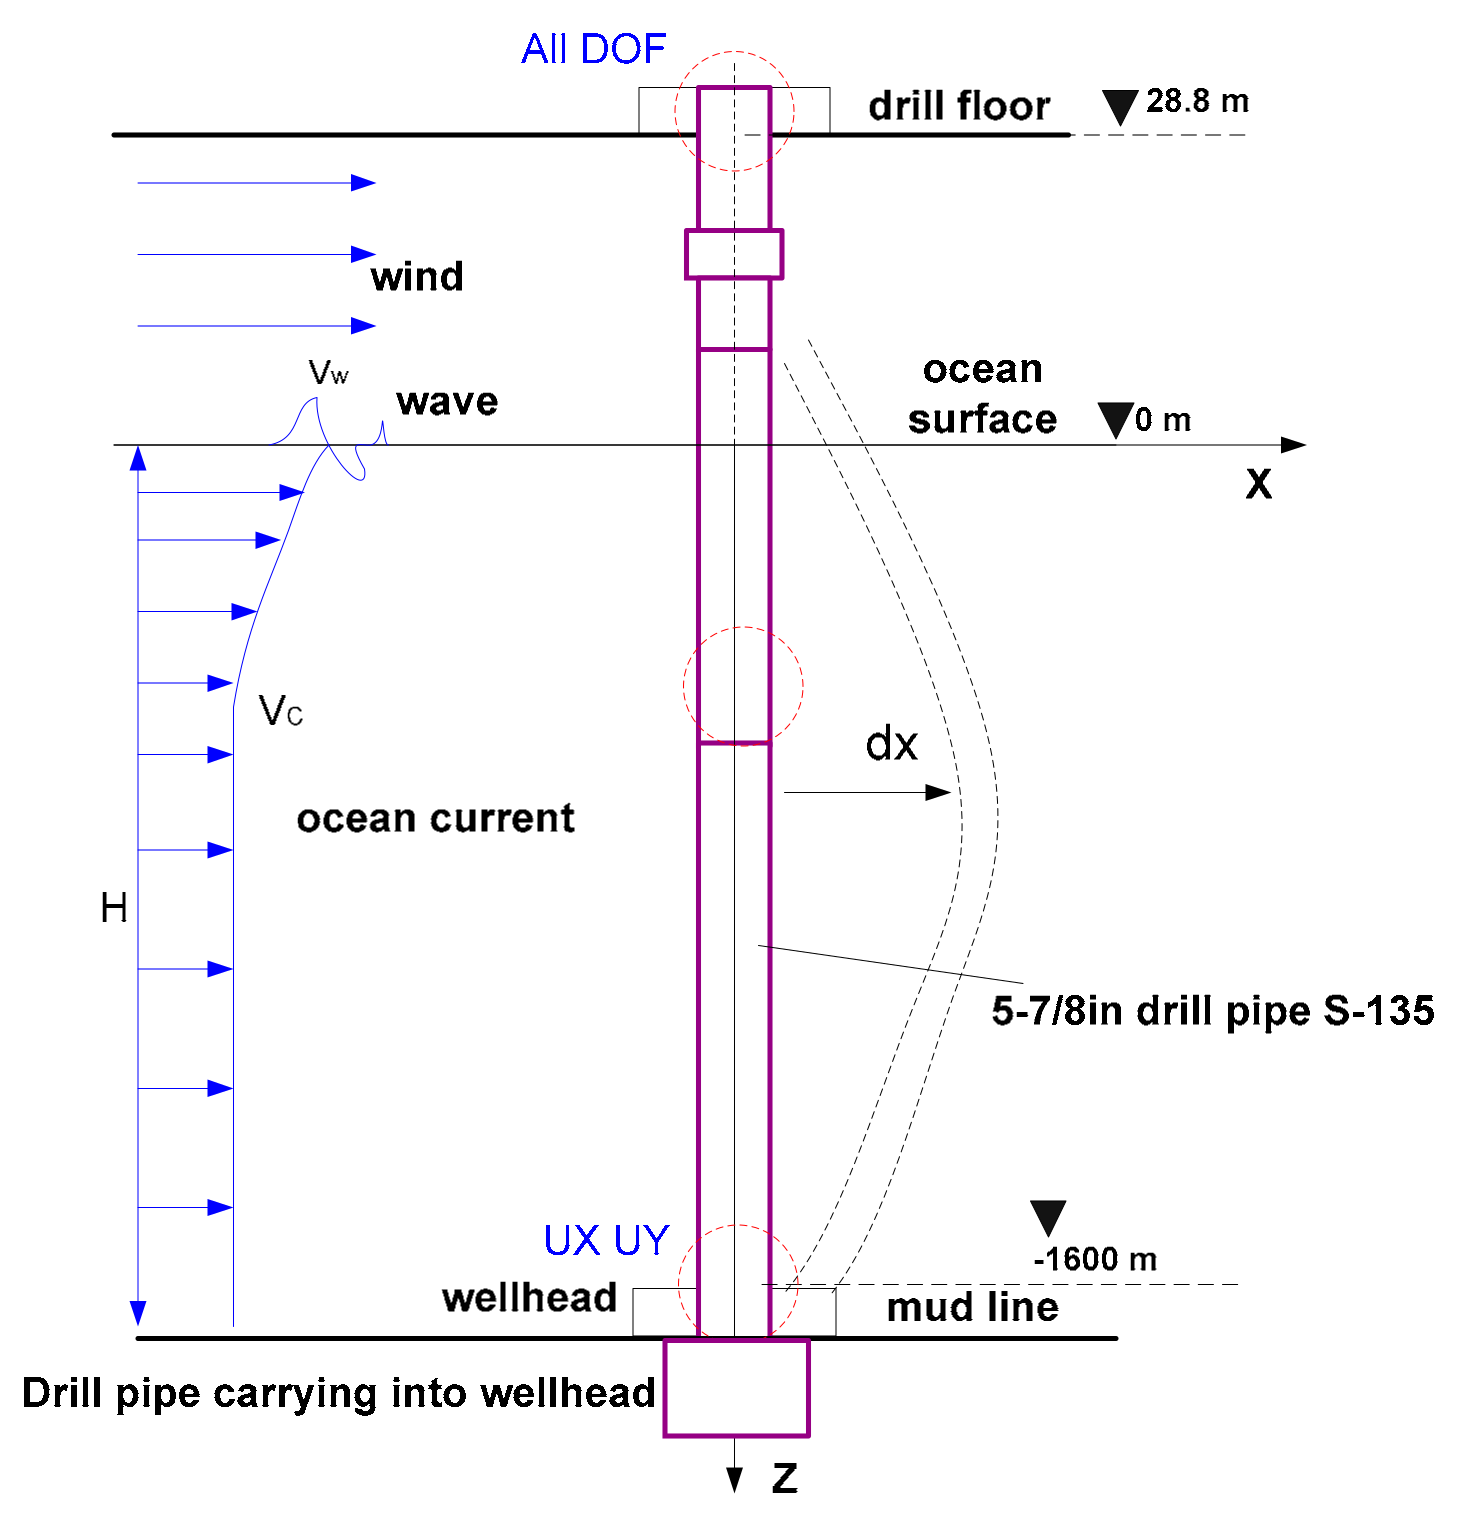
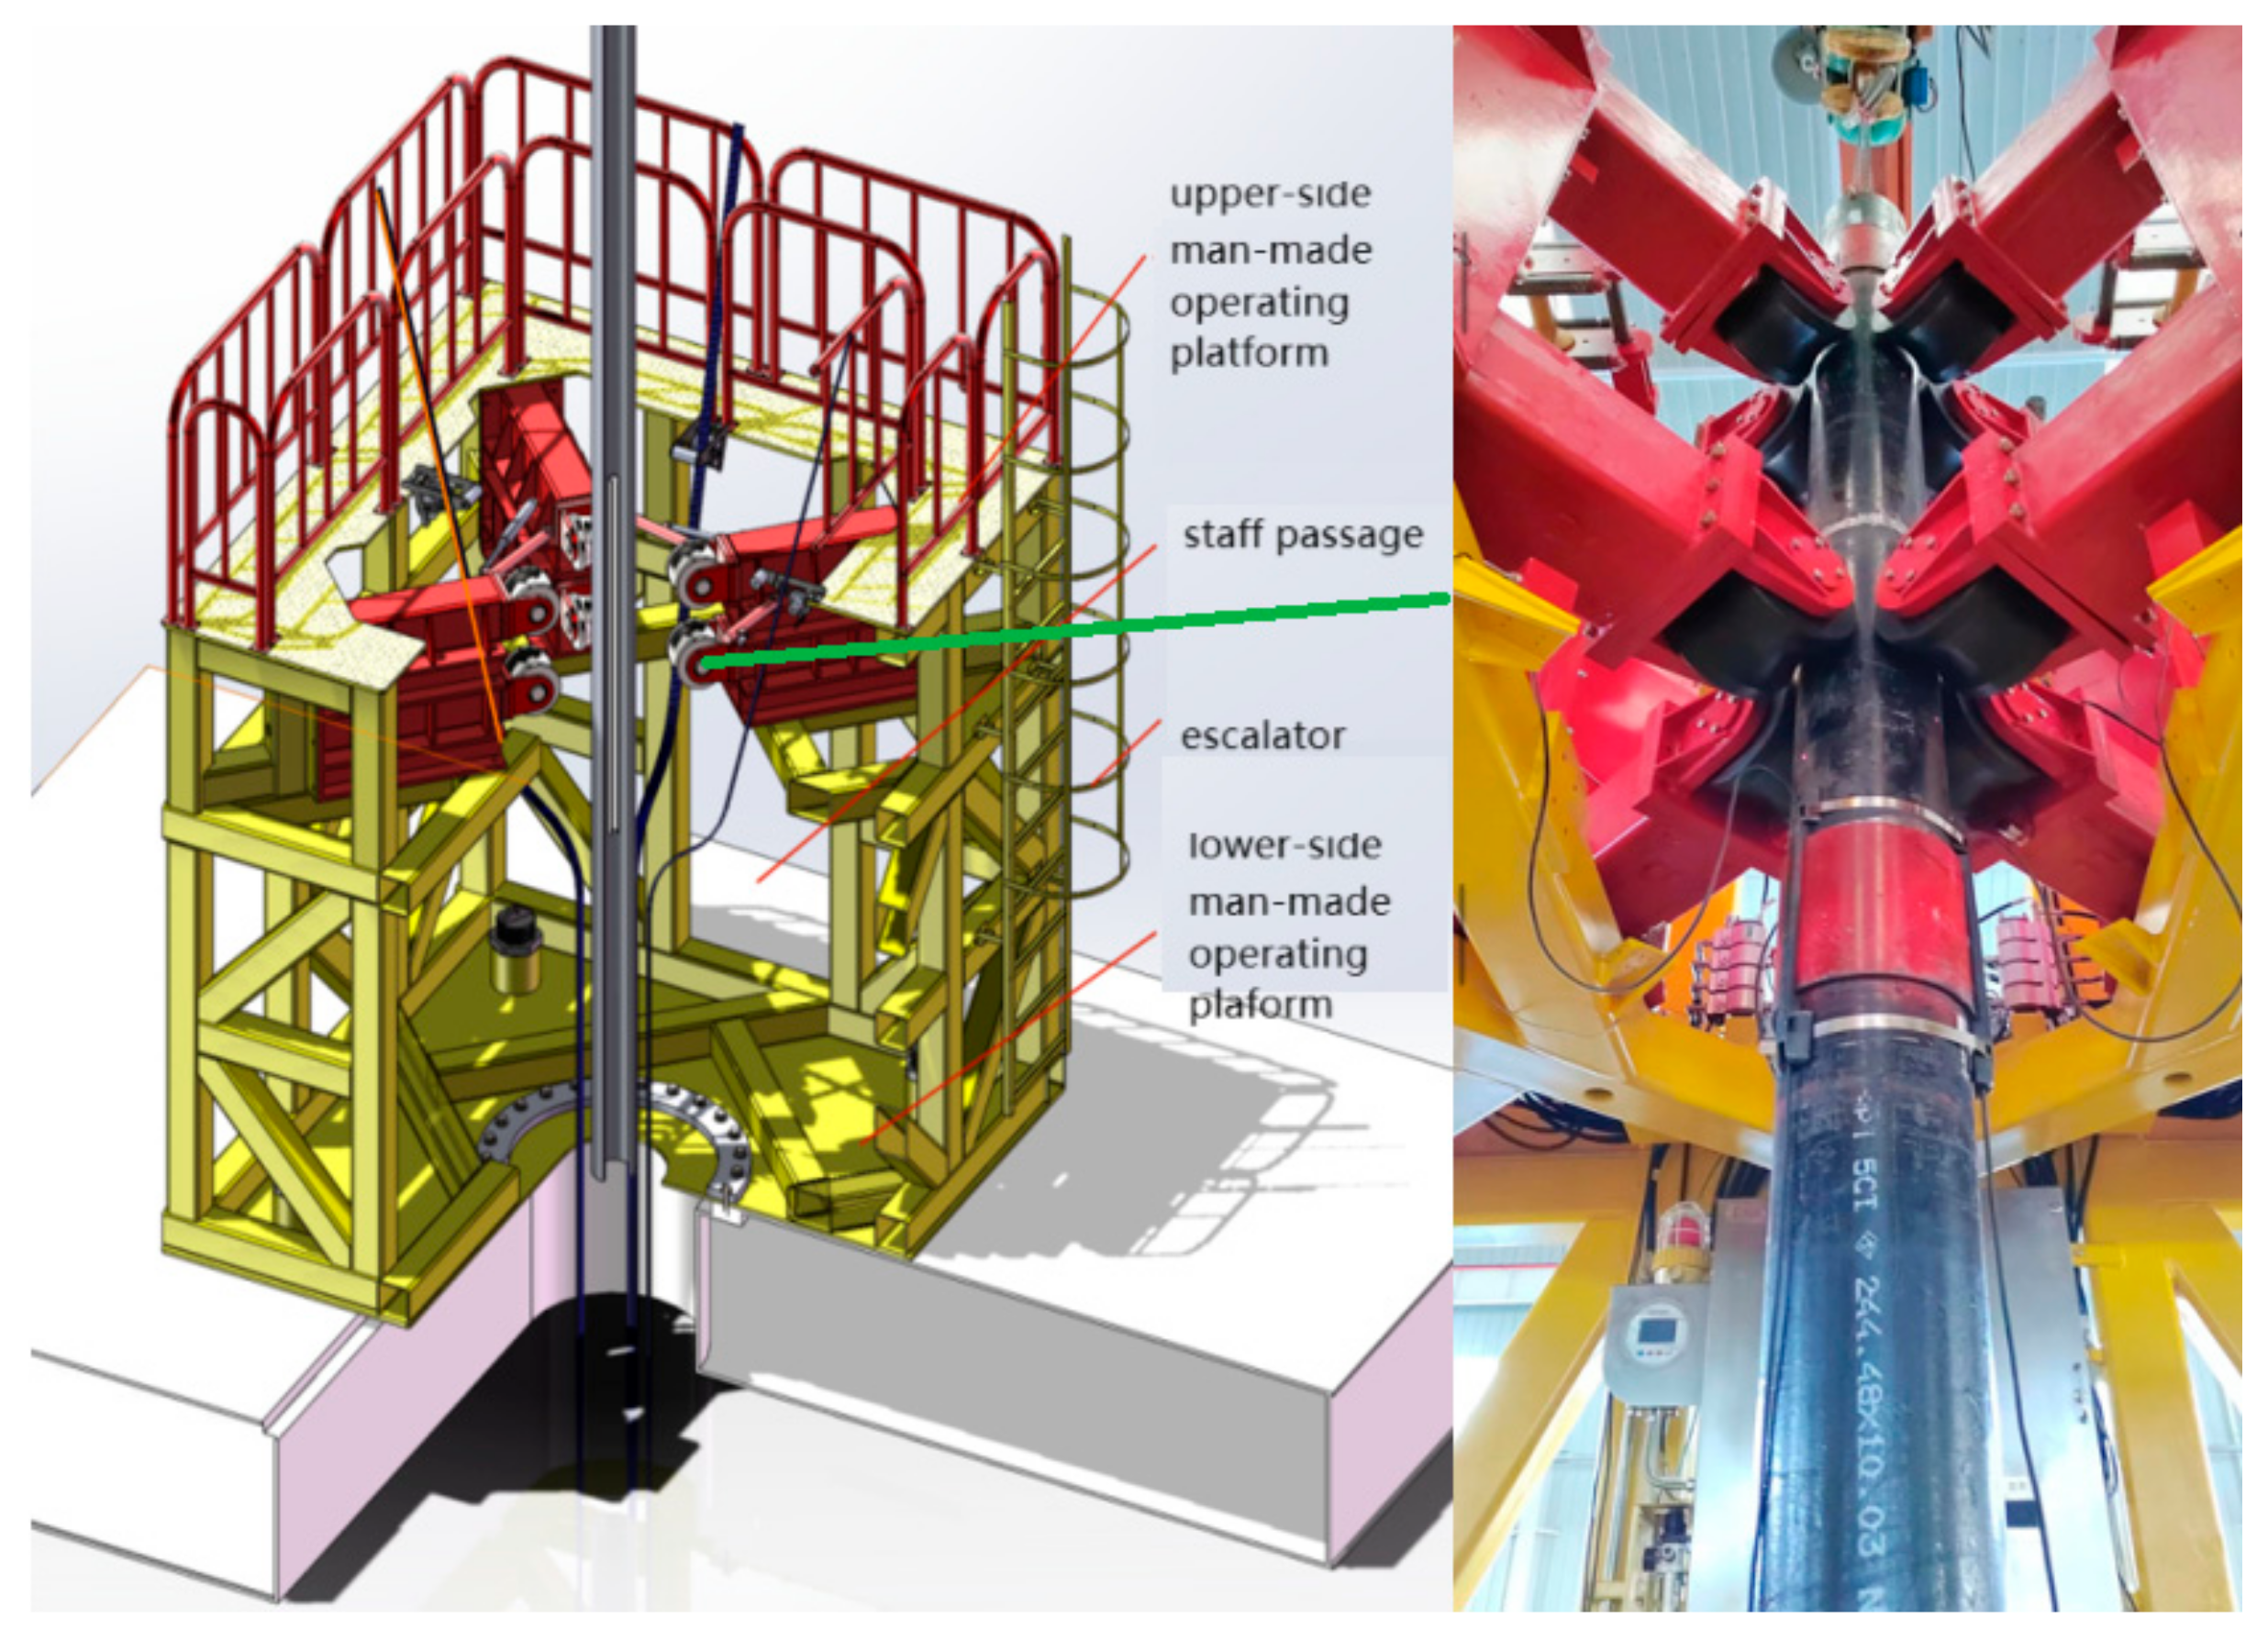
Figure 1 illustrates the connection of the hydrate test string to the derrick of the drilling pipe at the upper end and the running tool and casing string at the lower end. During the running process, the test string lacks lateral compensation and comes in contact with seawater. It experiences various loads including wind force, gravity, buoyancy, ocean current force, wave force, frictional force, and internal and external pressure from the casing string. Consequently, the test string undergoes lateral bending deformation. As water depth increases, the exposed test string encounters a more complex load environment from both seawater and the entire running string. The inability to mitigate string deformation through tensioning leads to the generation of significant bending stresses, thereby endangering string safety and impacting running operations. To tackle the issues of load, deformation, and strength safety encountered by the test string in deep water, it is necessary to develop a mathematical model for calculating the load [
22]. The following assumptions are made: (1) the string is a slender rod along its axis, disregarding joints and variations in cross-section; (2) the string material is linearly elastic, homogeneous, and isotropic; (3) the heave motion of the drilling vessel and the variation in the position of the running string along the vertical direction are disregarded, along with the lifting force of ocean currents; (4) the influence of the dynamic effects, such as the dynamic response of the landing string under wave-induced vibrations, are not considered.
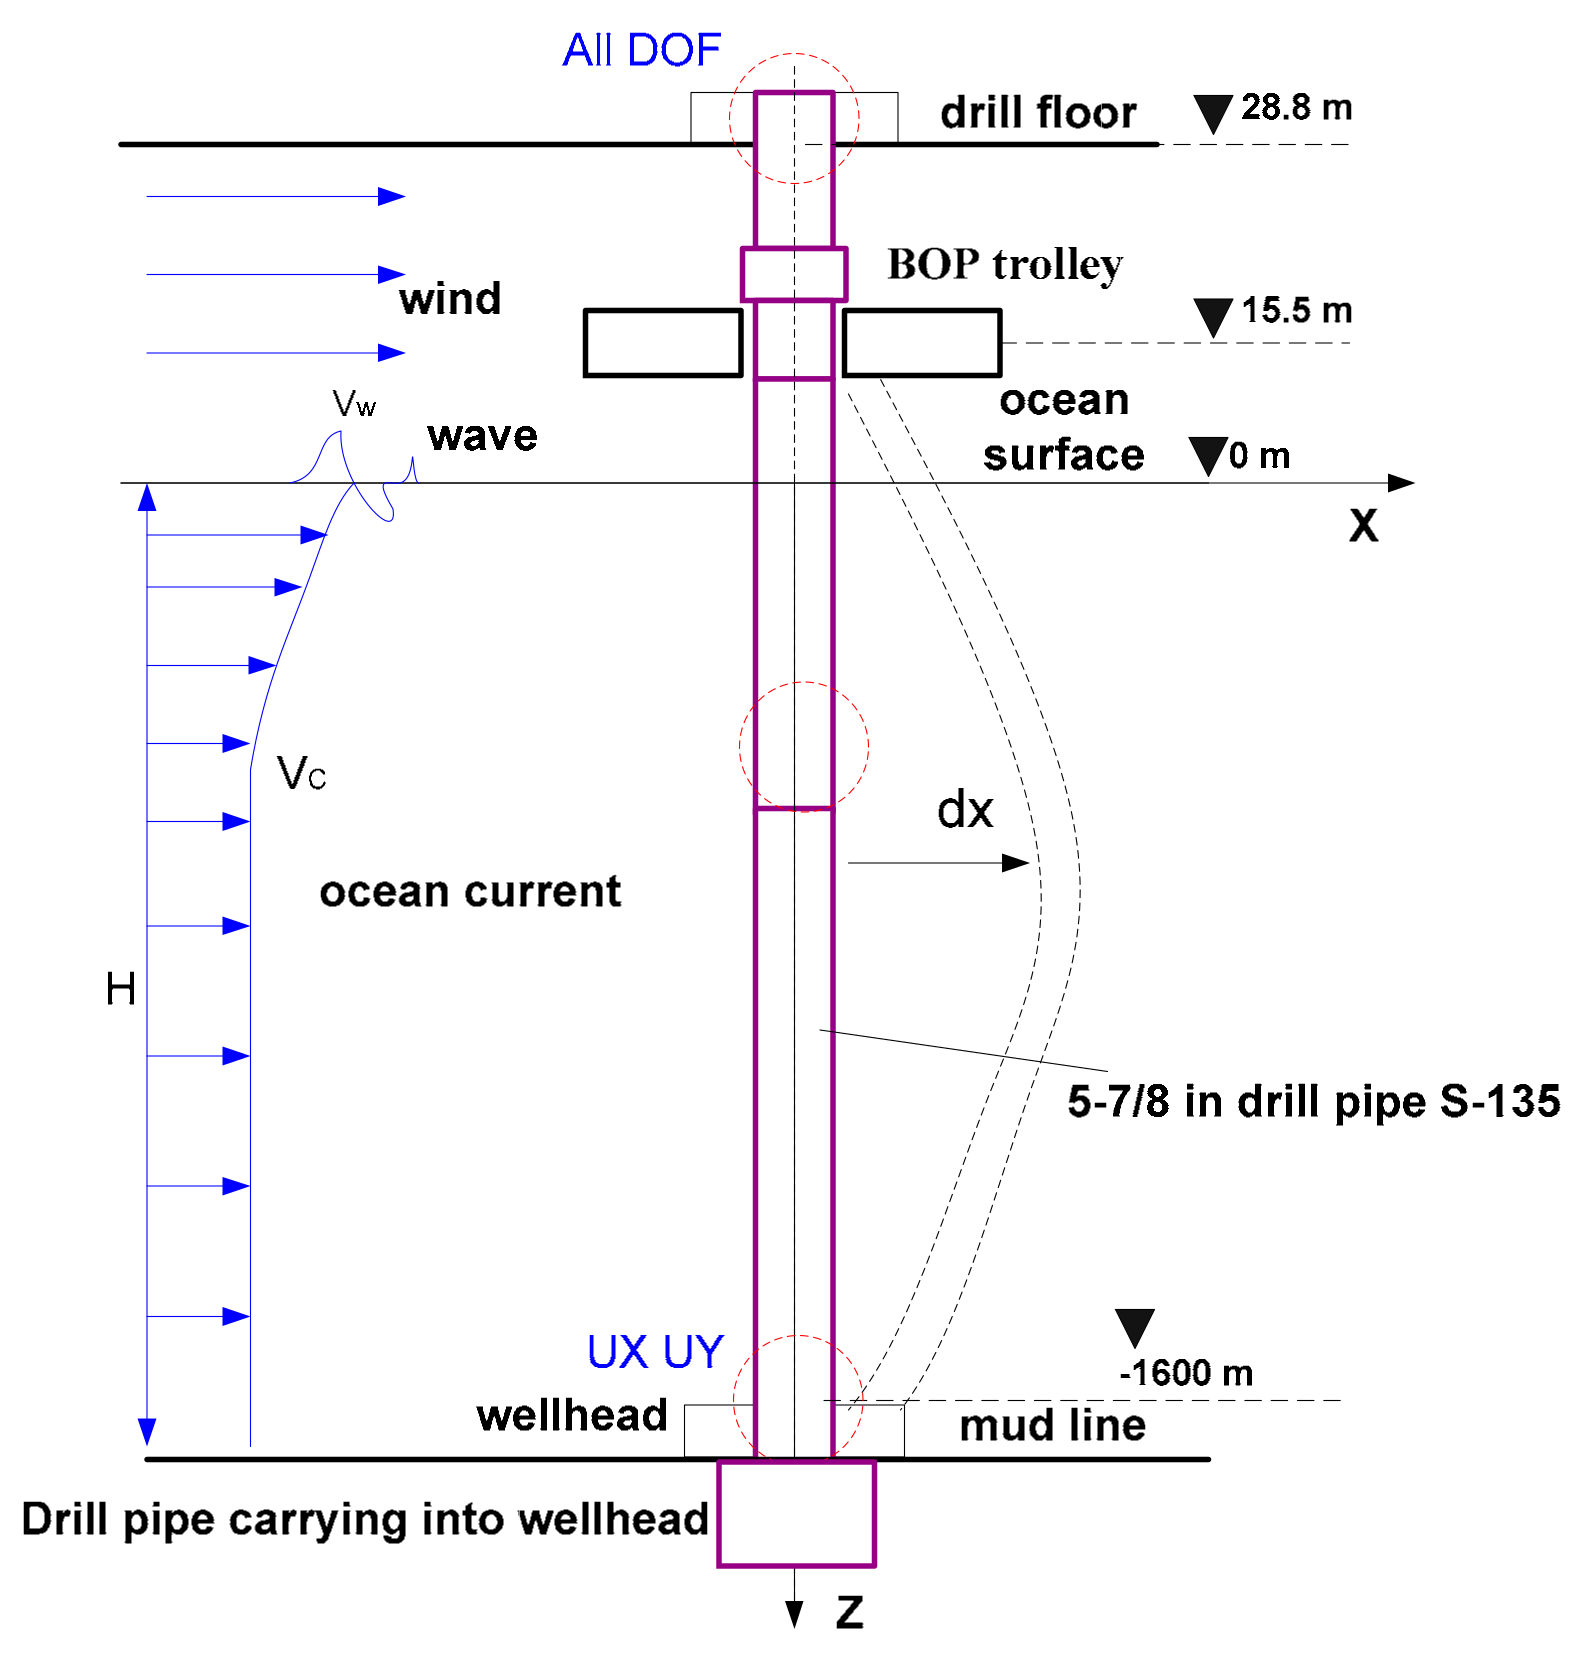
The deformation control equation of the test string can be established according to the schematic diagram in
Figure 1, which shows the string subjected to wind, wave, and current. This equation is derived from the Euler–Bernoulli beam theory and is given as follows:
In the equation,
E represents the modulus of elasticity, Pa;
I represents the moment of inertia of the cross-section, m
4;
T(
x) represents the effective axial load on the cross-section of the column at position
x, N;
W represents the gravitational force on the unit length of the column submerged in seawater, N;
F(
x) represents the wave-induced load on the unit length of the column at position
x, in N.
In the equation, T0 represents the tensile load applied at the bottom of the column, N; T1 represents the virtual tensile force induced by the pressure difference between the internal and external static liquid columns on the unit length of the column, N; D and d represent the outer and inner diameters of the column, respectively, m; ρs, ρm, and ρw represent the densities of the column material, drilling fluid, and seawater, respectively, kg/m3.
Lateral forces acting on the column are primarily induced by the combined effects of waves and ocean currents. Neglecting the dynamic influences, the resultant force, known as the wave–current load, can be determined using the formula provided below:
In the equation,
CD represents the drag coefficient,
vw represents the velocity of ocean currents at a specific depth beneath the surface of the sea, m/s;
vc represents the horizontal velocity of waves, m/s;
Cm represents the coefficient of inertial force of seawater. As per the “Riser Analysis Design Premises CNOOC (10001089936-PDC-000)”, the hydrodynamic parameters for the stability analysis of the column are as follows [
23]: drag coefficient is 1.2 for depths ranging from 0 to 150 m below the sea surface, and 0.7 for depths from 150 m to the seabed; the coefficient of inertial force of seawater is 2.0. The hydrodynamic load refers to the resistance imposed by the movement of water on a length of conduit:
The wave load is caused by the relative motion between the wave water quality point and the landing column. Since the landing column is a small-diameter component with a diameter-to-wavelength ratio of much less than 0.2, Morison’s equation and Stokes’ fifth-order wave theory are used to calculate the wave load per unit length of the landing column [
13], i.e.,
Airy’s linear micro-amplitude wave theory [
24] was employed to compute the horizontal velocity and acceleration at the wave’s water quality point, i.e.,
In the equation, a represents the horizontal acceleration of water particles in waves, m/s2; Hb represents the wave height, m; T represents the wave period, s; k represents the wave number within 2π length; w represents the angular frequency of the surface wave; t represents the moment when the wave takes effect, s; ky − wt represents the phase angle of the surface wave.
Above the sea surface, hydrate test columns are also subjected to wind loads. Assuming the projected area of the casing that withstands wind pressure is
the total wind force can be expressed as follows:
In the equation, Fw represents the wind load, N; K represents the wind load shape factor, which is taken as 0.5; KZ represents the coefficient of wind pressure height variation on the sea, which is taken as 1.0; A represents the wind-exposed area, m2; P0 represents the basic wind pressure, Pa, and P0 = 0.613Vt2, where Vt represents the design wind speed, m/s.
3. Analysis of Axial Tensile Strength of Pipe Columns
According to the specifications outlined in “GB/T 19830-2011 Steel Pipes for Oil and Gas Wells Casing or Tubing [
25]”, the chosen drill string for insertion into the pipe column has a diameter of 5-7/8 inches and a steel grade of S-135. The drill string’s outer diameter measures 149.2 mm, with a wall thickness of 15.25 mm and a density of 7850 kg/m
3. It has a tensile strength of 5974 kN, a yield strength of 930.83 MPa, an elastic modulus of 210 GPa, and a Poisson’s ratio of 0.3. In contrast, the casing itself has a diameter of 9-5/8 inches, an outer diameter of 244.48 mm, and a wall thickness of 11.99 mm. The casing exhibits a tensile strength of 8450 kN, a yield strength of 758.42 MPa, an elastic modulus of 210 GPa, and a Poisson’s ratio of 0.3. The drill pipe transports the casing into the wellbore. The length of the drill pipe measures 1628.8 m, with a corresponding depth of 1600 m in seawater. According to the recommended guidelines outlined in GB/T 24956-2010, which pertain to the design and operational limits of drilling columns within the oil and gas industry, the tensile strength of the pipe column is calculated and verified using an ultimate tensile load model to assess its safety [
26,
27]. The particular operational scenario being examined entails inserting the casing-carrying drill pipe into the wellbore, utilizing a 1628.8 m 5-7/8 inch drill pipe paired with a 400 m 9-5/8 inch casing. The maximum static tensile load on the pipe column is deemed a critical condition. By utilizing Equation (10), the buoyant weight of both the pipe column and casing column can be determined:
In this equation, P denotes the buoyant weight of the drilling string located beneath the drill pipe, expressed in kilonewtons (kN); Ldp stands for the length of the drill pipe, measured in meters; Wdp represents the linear weight of the drill pipe in air, set at 0.69727 kN/m; Lc indicates the length of the casing, expressed in meters; Wc denotes the linear weight of the casing in air, set at 0.68551 kN/m; and Kb signifies the buoyancy factor, which is considered as 0.869.
According to the API standards [
28], the specified theoretical tensile strength does not indicate the precise point where the material starts to show permanent deformation. Instead, it signifies the stress threshold at which a specific level of deformation has already taken place. This deformation comprises both elastic and partial plastic (permanent) deformation. If the drill pipe is subjected to a load exceeding the limit presented in the table, it may undergo a slight permanent elongation, leading to challenges in retaining its straightness. During the verification of design, the pipe column’s maximum permissible tensile load is established at 90% of its theoretical tensile strength. This measure is taken to prevent the occurrence of the aforementioned situation:
In the equation,
Pa denotes the maximum acceptable design tensile load, measured in kilonewtons (kN);
Pt stands for the theoretical tensile strength. The margin of pull (
MOP) is defined as the disparity between the computed ultimate tensile load
P and the maximum permissible tensile load
Pa.
The ratio between the maximum allowable tensile load
Pa and the calculated ultimate tensile load
is referred to as the safety factor
SF.
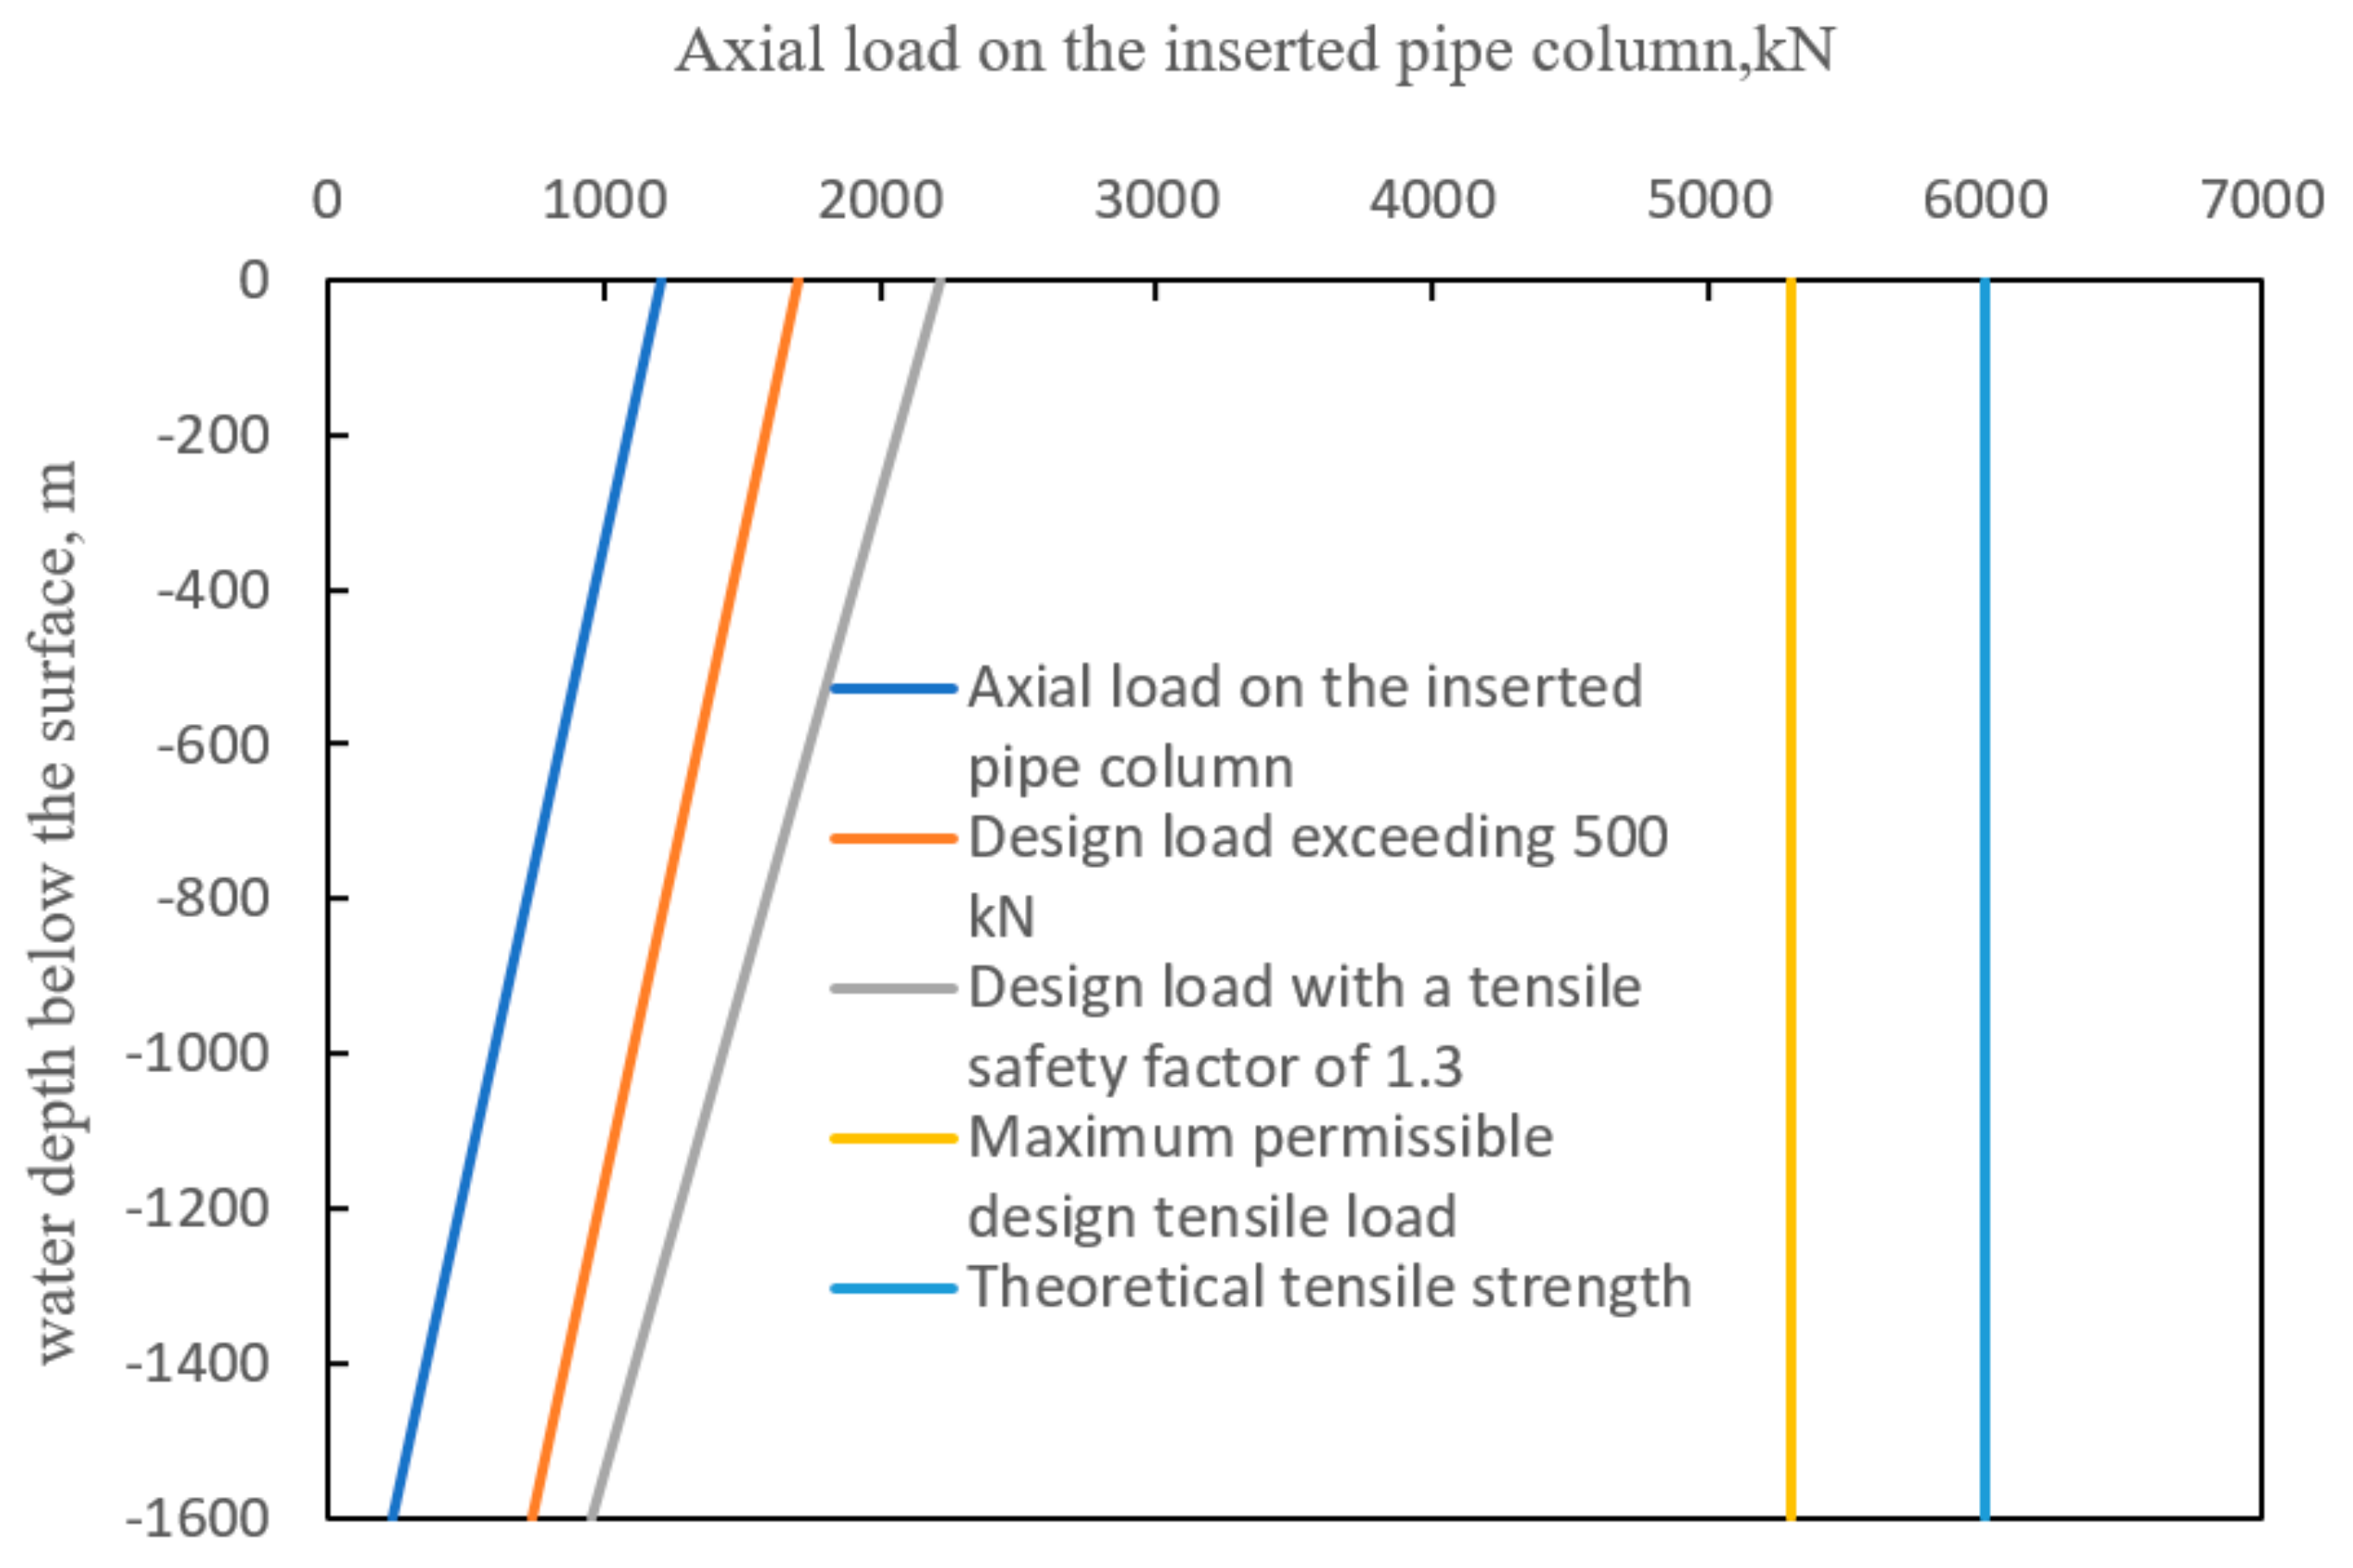
The calculation of the tensile load when running the 9-5/8 inch casing with a 5-7/8 inch drill pipe can be approached using two methods: the safety factor method, with a tension safety factor (
SF) of 1.3, and the tension margin method, with an overpull (
MOP) of 500 kN. During the operational phase, as shown in
Figure 2, the curve of the tensile load illustrates how the drill pipe supports the casing at the wellhead. This figure provides an overview of three distinct pipe strength design approaches: ultimate tensile load, tension margin method, and safety factor method. The maximum tensile load for the conduit, as determined using the safety factor method, is calculated to be 2220.1 kN. This value is significantly lower than the maximum allowable design tensile load of 5376.6 kN.
4. Simulation Analysis of Landing String
The hydrate test column depicted in
Figure 1 demonstrates the incorporation of the casing column into the wellbore through the drill pipe. At a specific location, precisely 28.8 m from the upper end, the column establishes contact with the drill floor, thereby serving as a fixed constraint. This particular position not only supports the weight of the column but also endures the lateral forces induced by wind and waves. It represents an area characterized by high levels of stress concentration. Above sea level, the column is influenced by wind forces, whereas from sea level downwards to the wellhead, it undergoes the combined impact of sea currents and waves. As a result, lateral displacement occurs, resulting in significant stress accumulation that could lead to column failure.
The numerical simulation will be conducted on the ANSYS software 19.2 platform using the Pipe59 element, which can withstand tensile, compressive, and bending forces. Additionally, this element allows for the simulation of uniaxial ocean waves and water currents.
A thorough investigation was conducted over the course of several years to calculate the impact of oceanic environmental loads on the forces, deformations, and stresses experienced by the riser. In this study, an average environmental load in the operational area was selected for analysis. Five specific load conditions, as presented in
Table 1, were chosen for further examination.
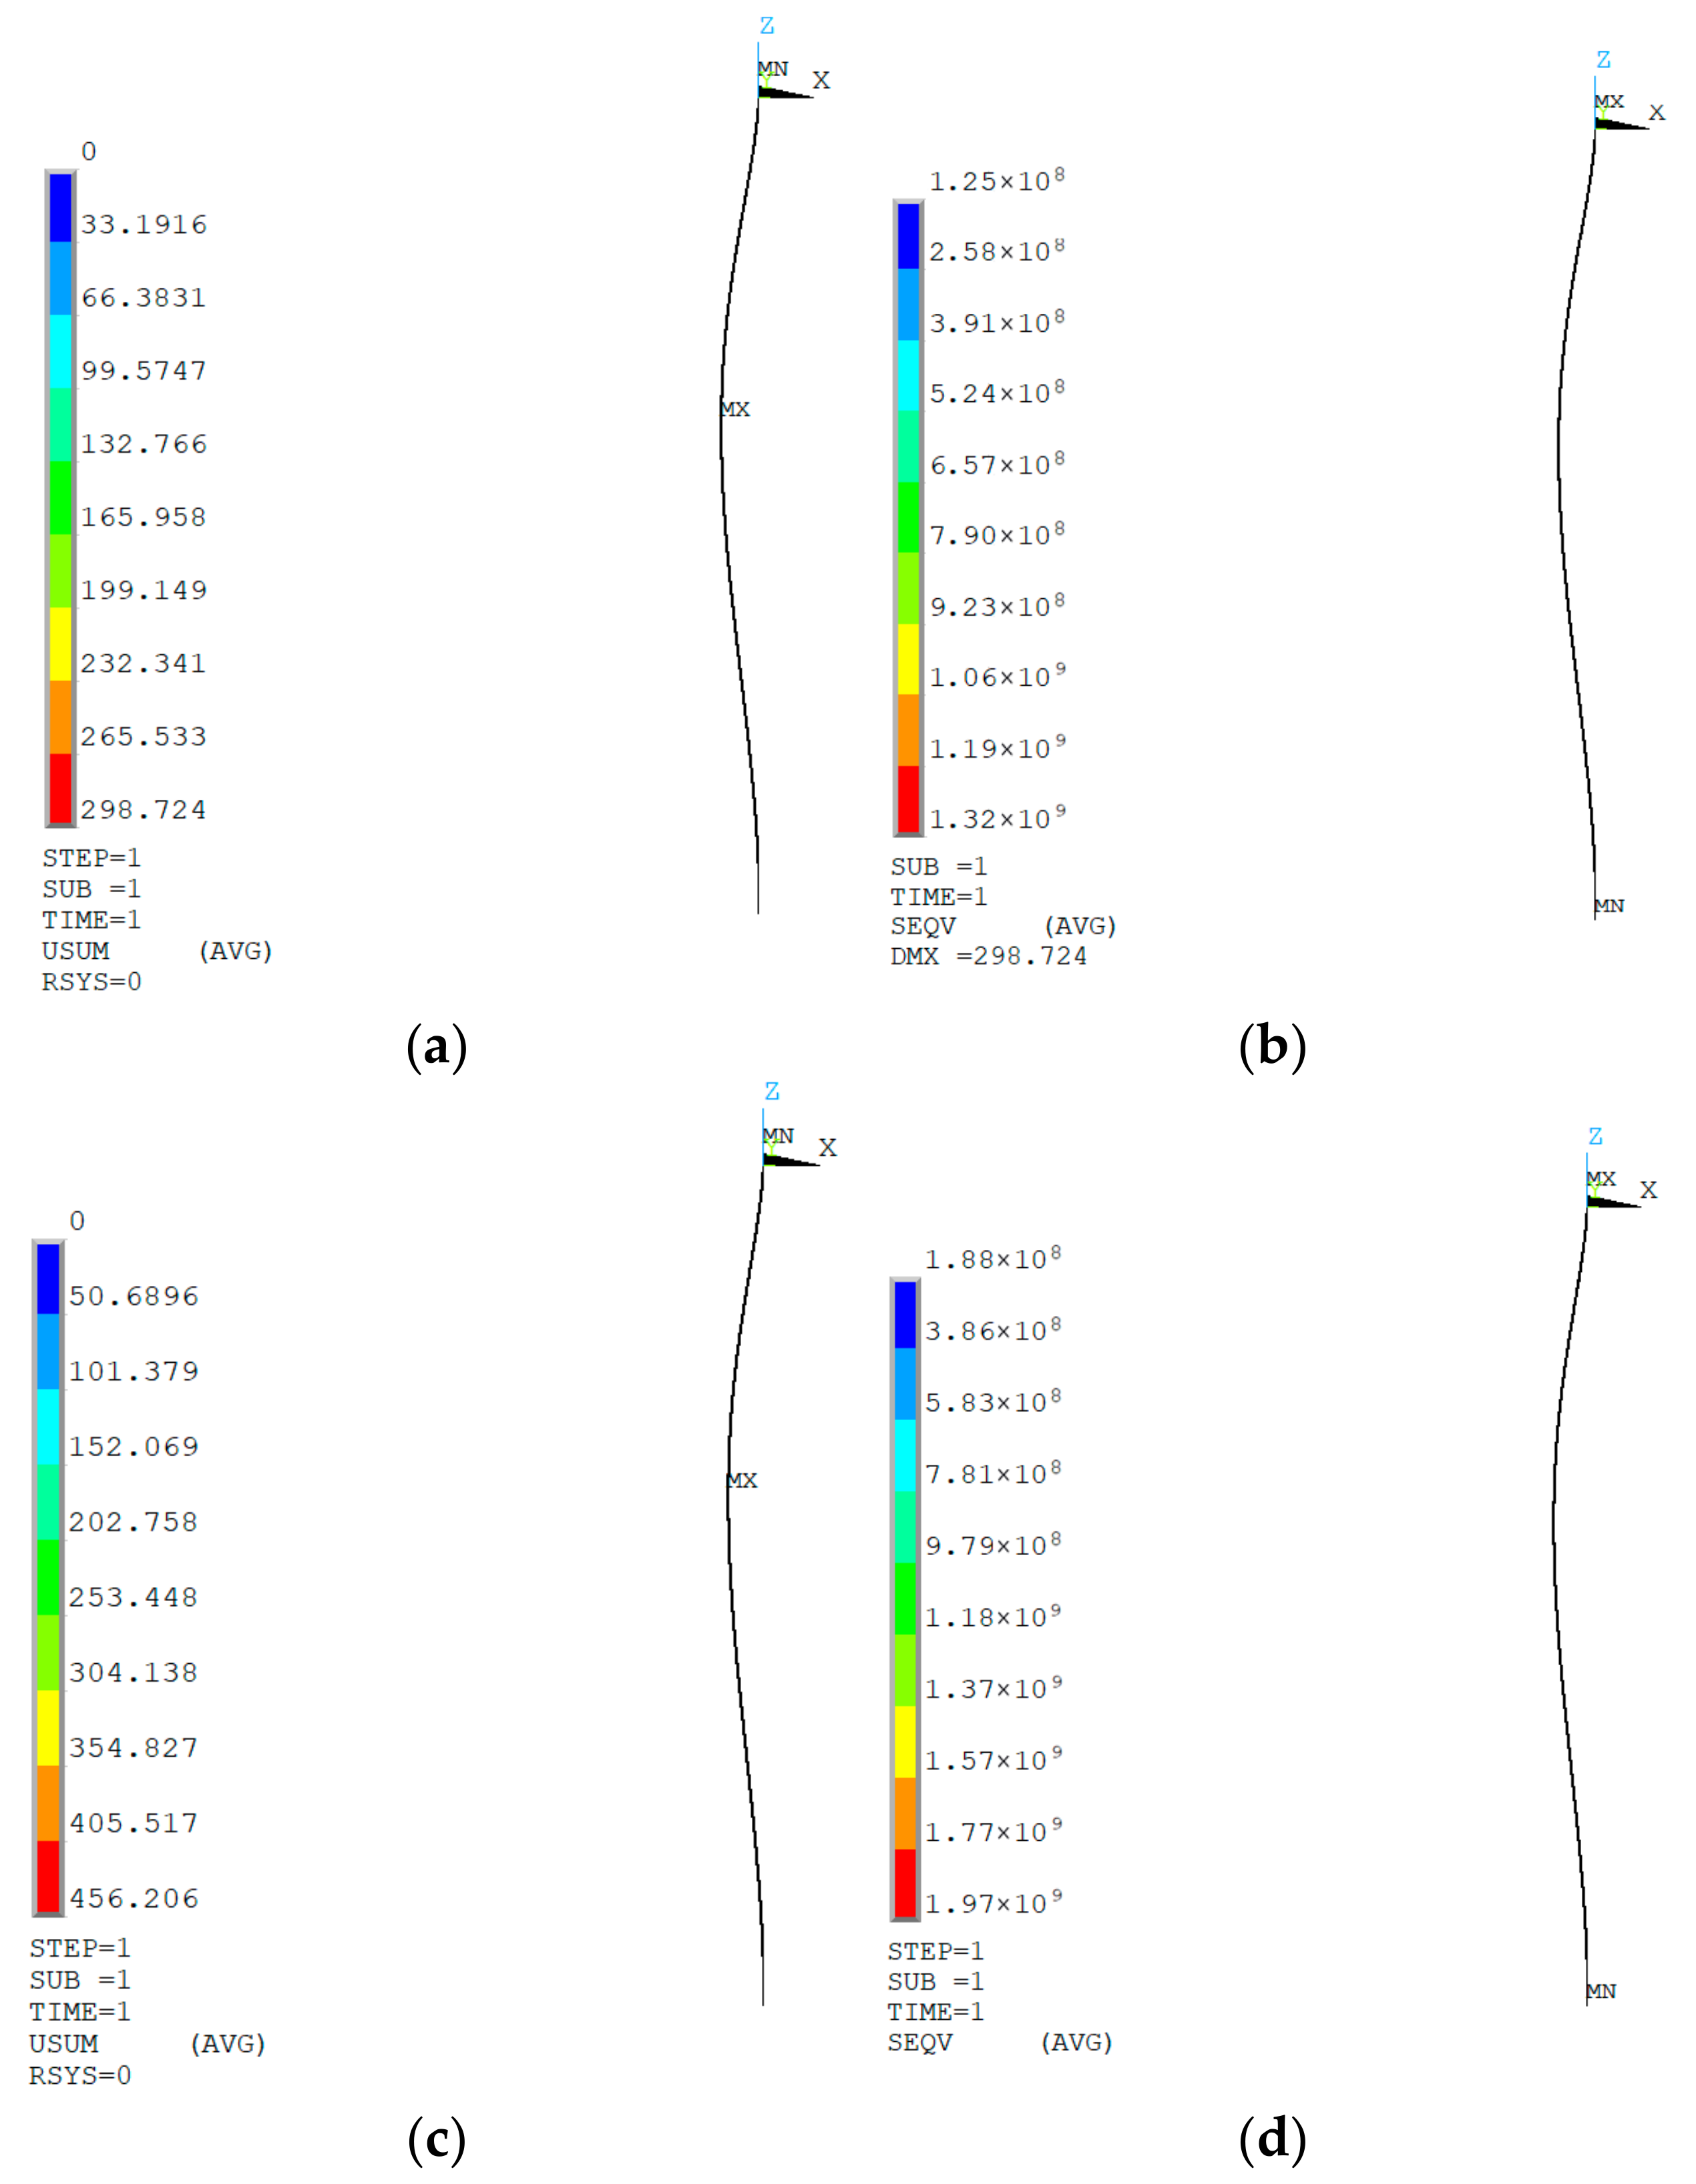
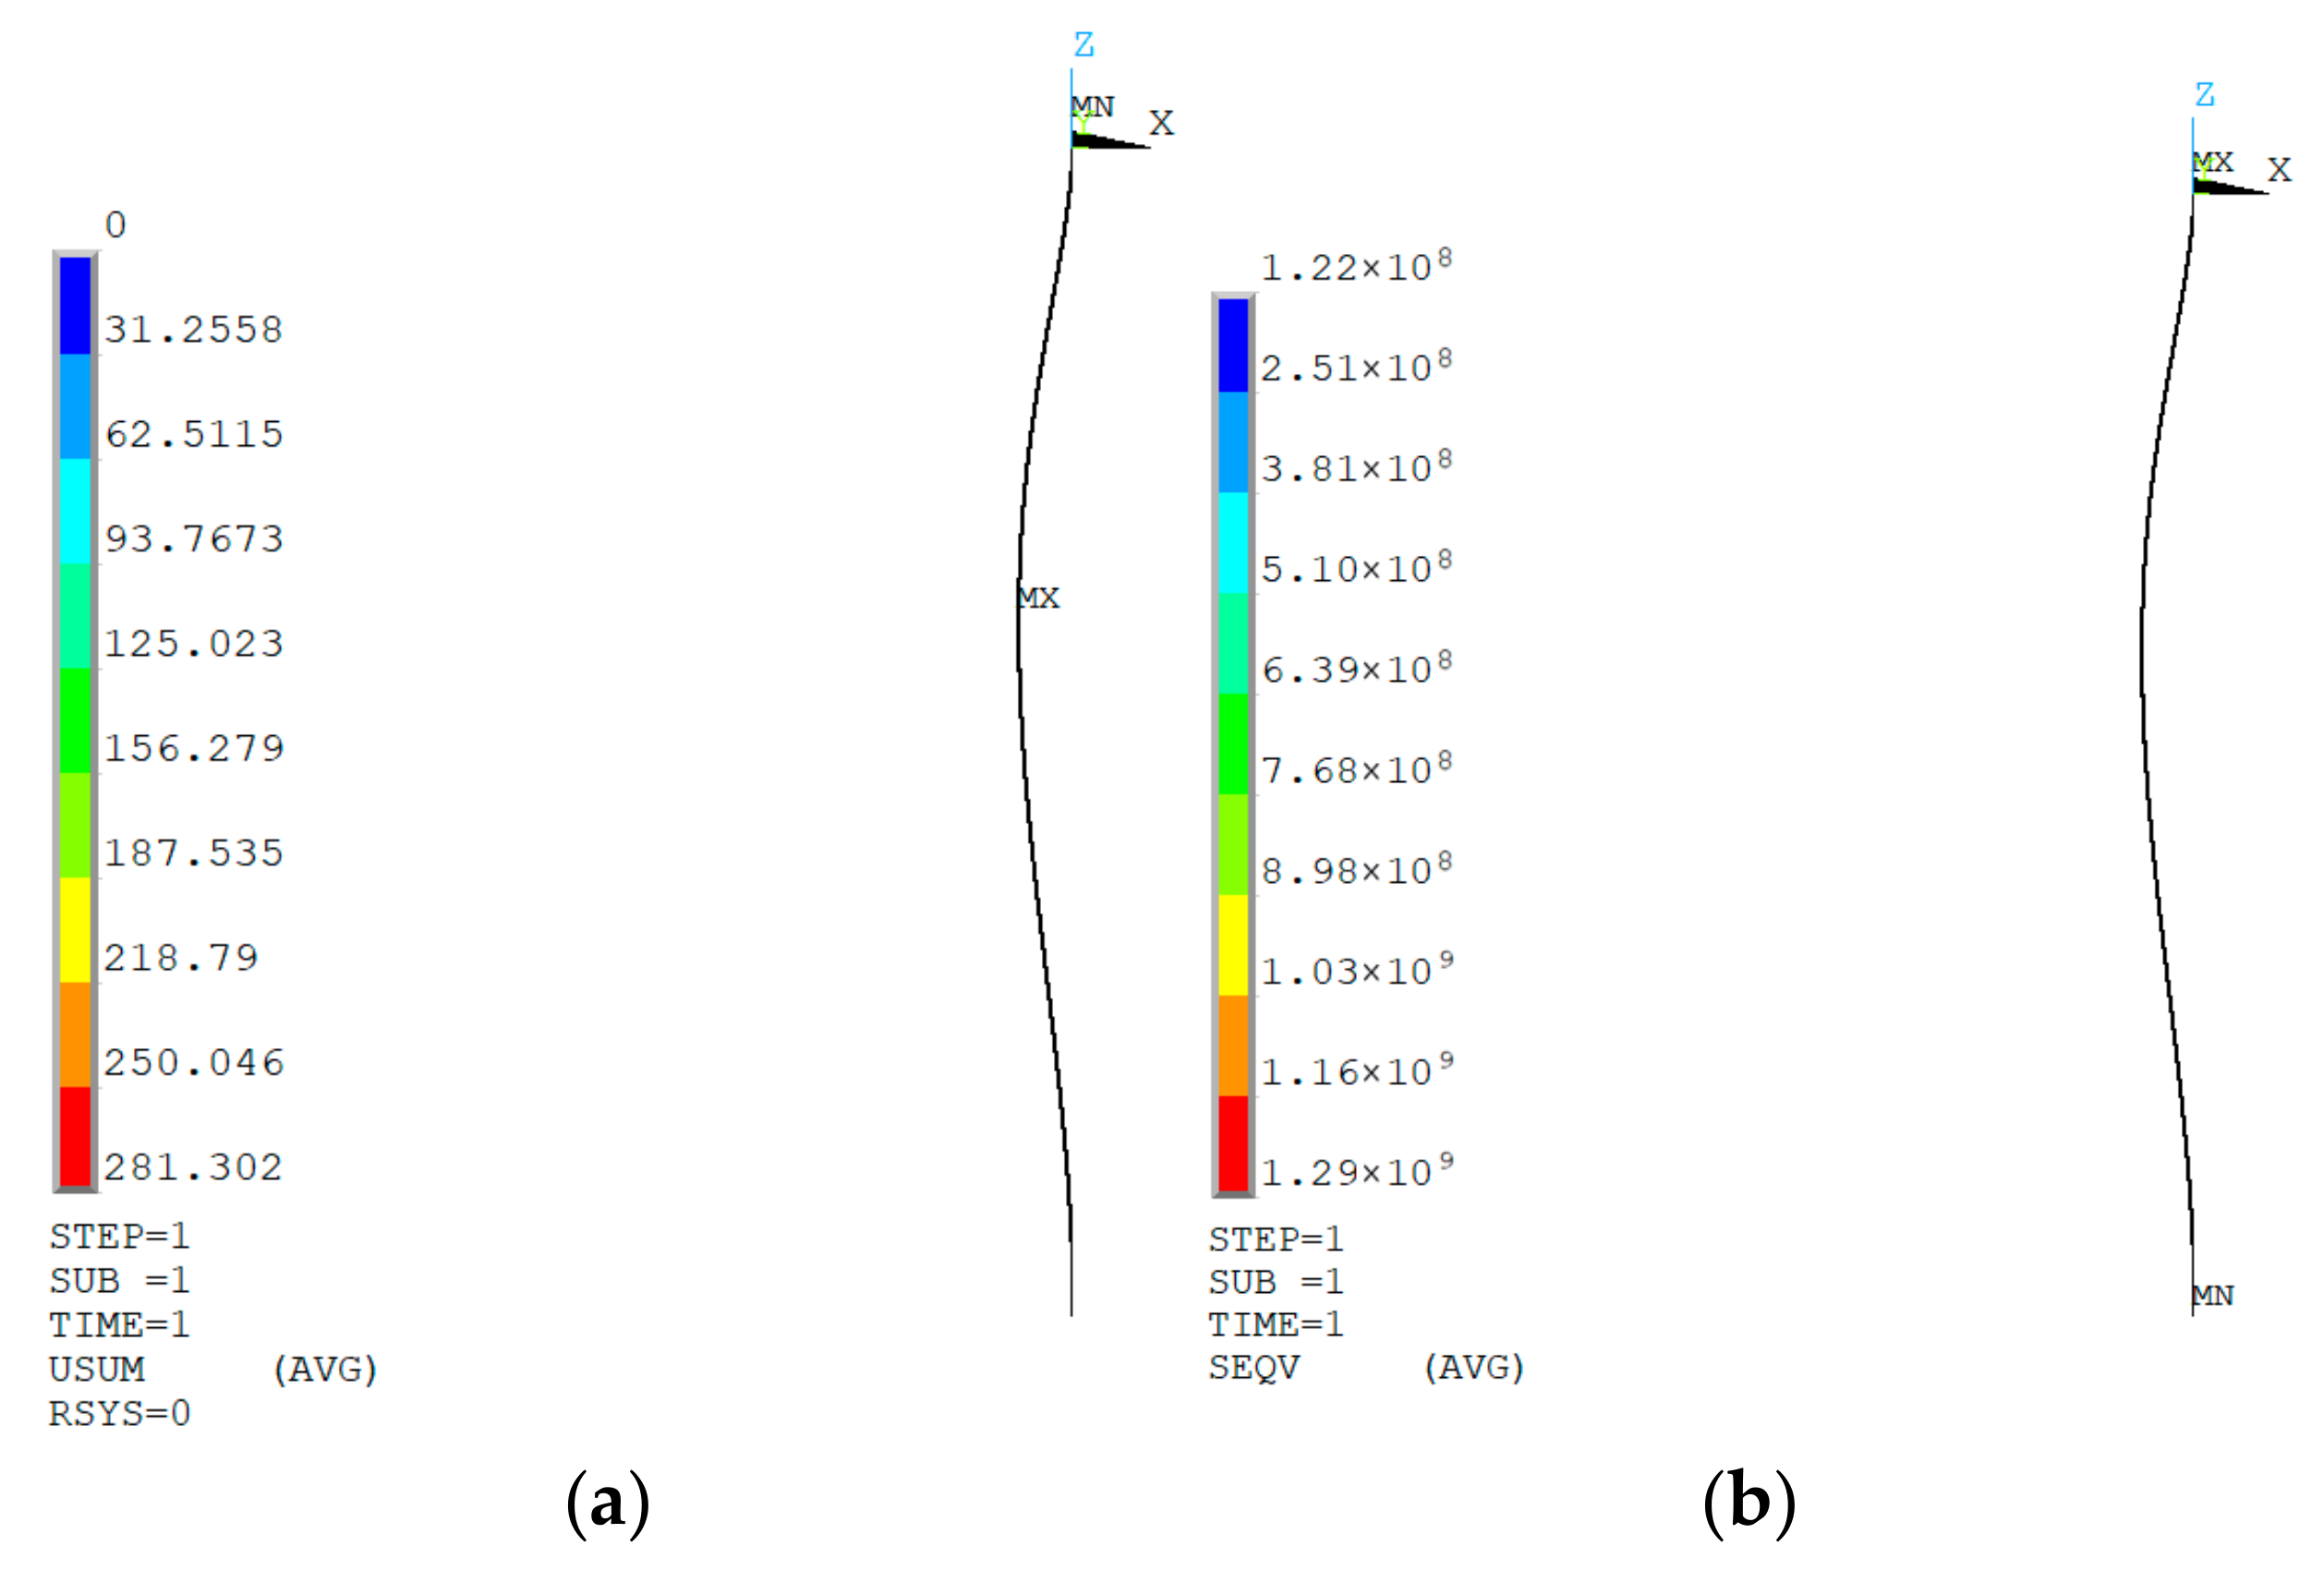
Figure 3 presents the lateral displacement and Mises stress distribution of the riser under different operating conditions. Specifically,
Figure 3a,b demonstrate the lateral displacement and Mises stress pattern under operating condition 4, whereas
Figure 3c,d showcase the lateral displacement and Mises stress distribution under operating condition 5. The figures indicate that the surface velocity in operating condition 4 is lower than that in operating condition 5. Moreover, the lateral displacement and Mises stress in operating condition 4 are considerably smaller compared to operating condition 5. According to Formula 6, the lateral force caused by seawater is proportional to the square of the surface velocity. Hence, an increase in surface velocity leads to a rise in lateral displacement and Mises stress, thereby increasing the likelihood of failure for the riser.
Figure 4 illustrates the correlation between the depth of seawater and the lateral displacement deformation of the drill string across five distinct operational scenarios. It can be observed from
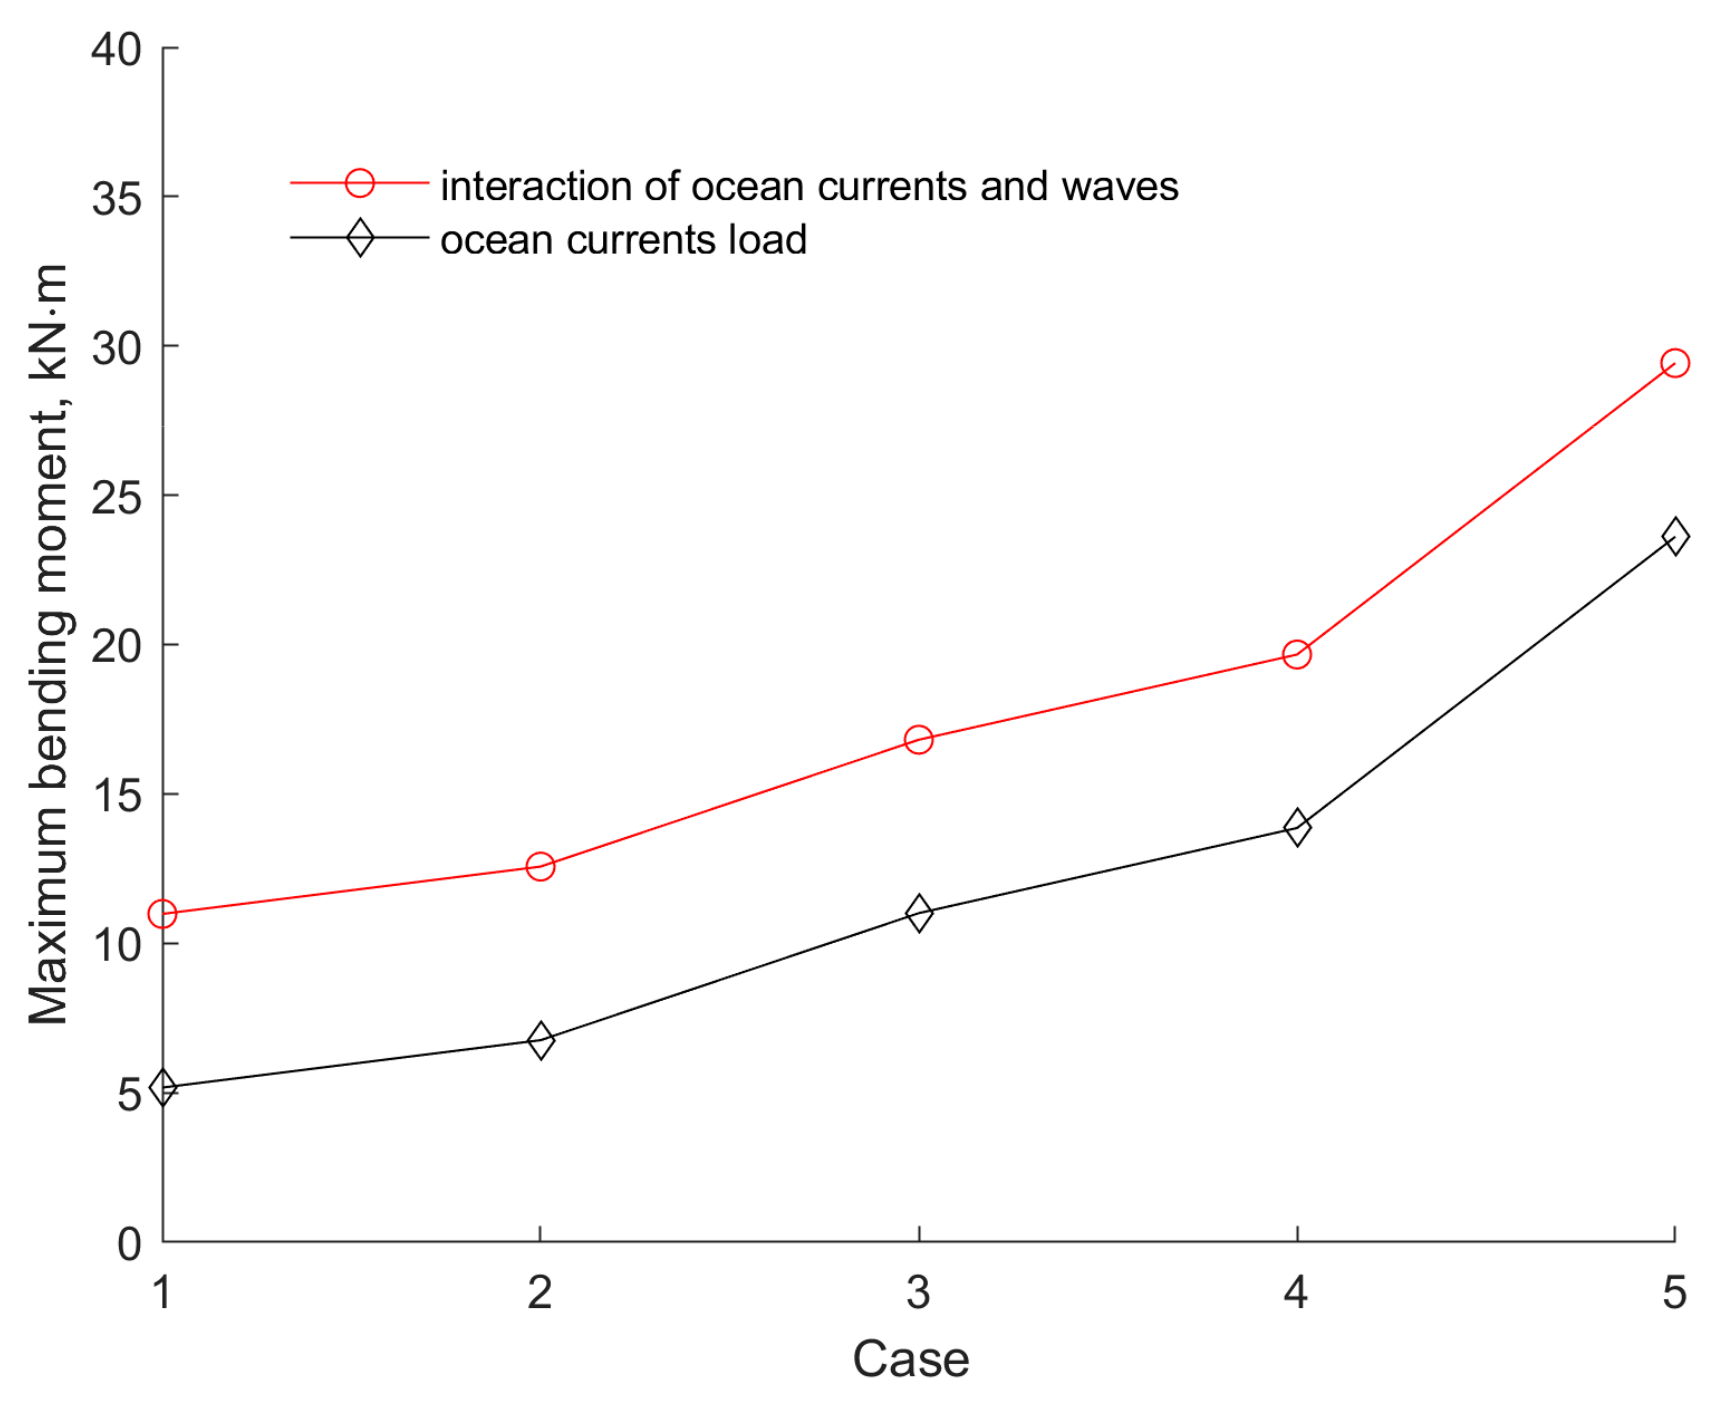
Figure 4 that the lateral displacement of the drill string increases with increasing water depth, reaching a maximum deformation at around a water depth of 645 m. This is because the drill string experiences lateral constraint at the seabed, and the velocity of the ocean current gradually decreases with increasing water depth, leading to a corresponding reduction in the ocean current load. This indicates that the lateral displacement input to the drill string is highly sensitive to ocean current velocity, with greater ocean current velocities resulting in larger lateral displacements of the drill string. However, wave loads have almost no effect on the lateral deformation and stress of the drill string. With higher ocean current velocities, the bending moment at the top of the drill string increases, as shown in
Figure 5. In the presence of consistent ocean current velocities, wave loads exert a growing influence on the bending moment experienced at the upper end of the drill string. This underscores the substantial impact of wave loads on the bending moment transmitted to the upper section of the drill string.
Due to the fact that the top of the drill string is always fixedly suspended on the drilling rig floor, and the most likely collision point is in the moon pool area, it is proposed to use the BOP (Blowout Preventer) trolley in the mother ship’s moon pool area as a device to carry the test drill string’s stability protection system. The BOP trolley shown in
Figure 6 is approximately 9 m long, 6 m wide, and designed with a safe load of 120 tons. The entire trolley can move freely along the bow-stern direction of the ship, with a travel distance of nearly 20 m. Additionally, there is an approximately 3 m long and 1 m wide opening designed in the middle of the trolley, which can accommodate most diameter drill strings. The trolley with a roller straightening mechanism is positioned at a depth of 15.5 m below sea level, as illustrated in
Figure 7. The roller at the 15.5 m depth imposes lateral constraints on the drill string to mitigate the lateral displacement of the casing caused by seawater currents.
Figure 8 depicts the lateral displacement and distribution of Mises stress in the riser when it is exposed to the lateral constraint of the trolley in working condition 4. Upon the application of the trolley constraint, the maximum lateral displacement of the riser is reduced from 298.772 m (
Figure 3a) to 281.308 m, while the maximum Mises stress decreases from 1320 MPa (
Figure 3b) to 1290 MPa. Additionally, the maximum stress point shifts from 28.8 m to 15.5 m. The trolley constraint significantly improves the lateral deformation and Mises stress of the riser.
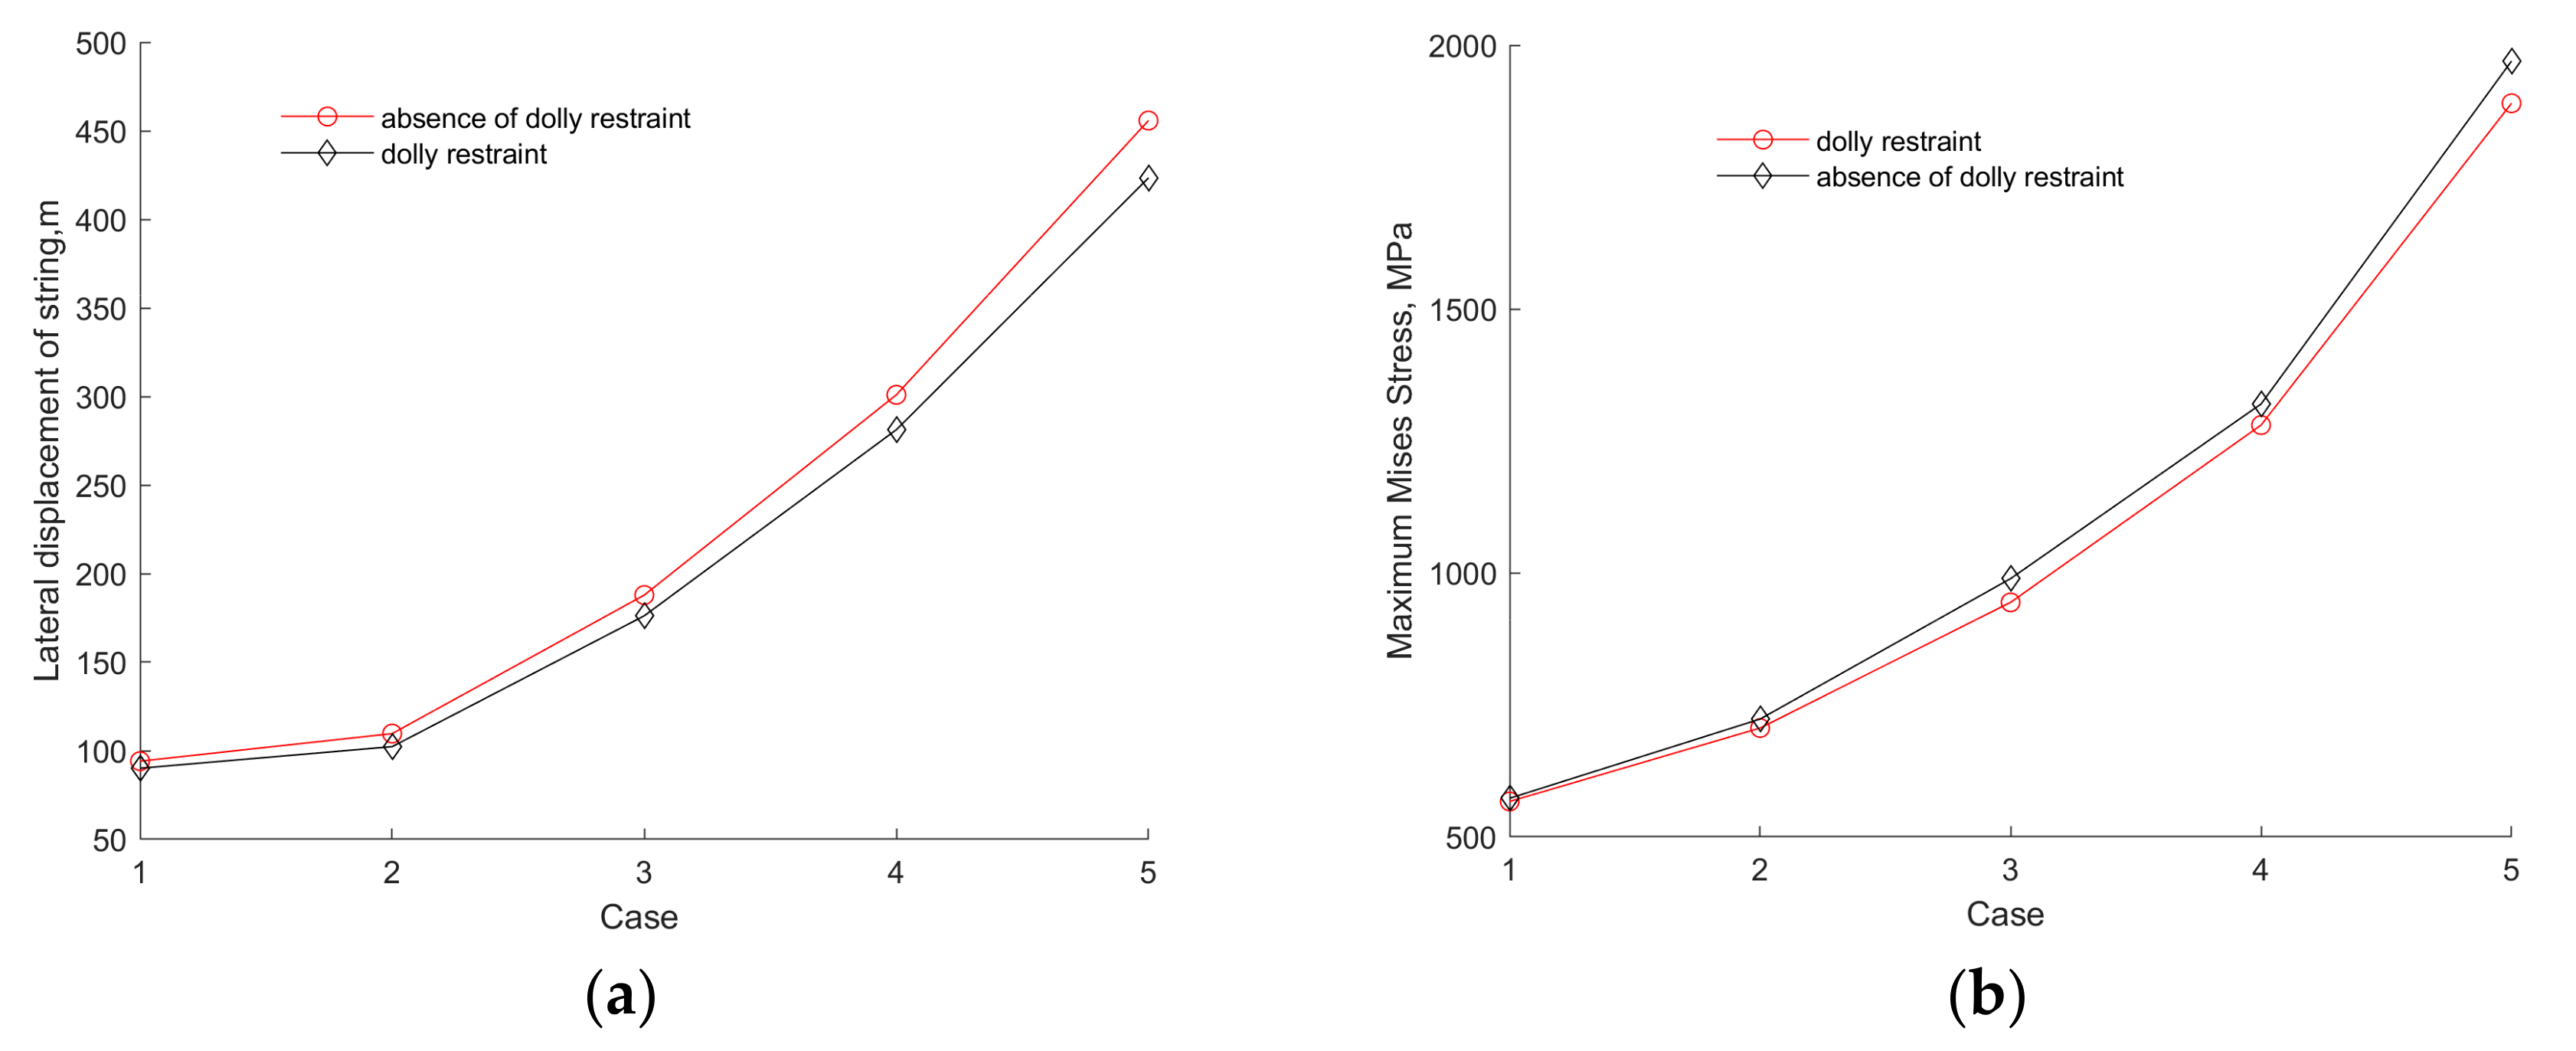
Figure 9 illustrates the substantial impact of the trolley constraint on both the maximum lateral displacement and maximum Mises stress across five distinct working conditions. The trolley constraint successfully mitigates the lateral displacement and maximum Mises stress exerted on the casing. Specifically, the maximum lateral displacement decreases by approximately 5.5%, and the maximum Mises stress decreases by around 3%.
5. Example Analysis
The first self-operated deepwater gas field in the South China Sea was discovered by an independent exploration of CNOOC (China National Offshore Oil Corporation), which is named LS17-2 block, where the water depth ranges from 1220 m to 1560 m. The deep water floater was determined based on the present offshore industrial technological capability of China and its adaptability to the South China Sea [
29]. Statistical data regarding the monthly average wind, wave, and ocean current conditions within the operational area are presented in
Table 2. A comprehensive analysis was conducted to assess the structural strength of the drilling riser under the combined effects of wind, waves, and ocean current. The maximum lateral displacement and Mises stress were determined under controlled and uncontrolled conditions, both with and without the use of a BOP trolley.
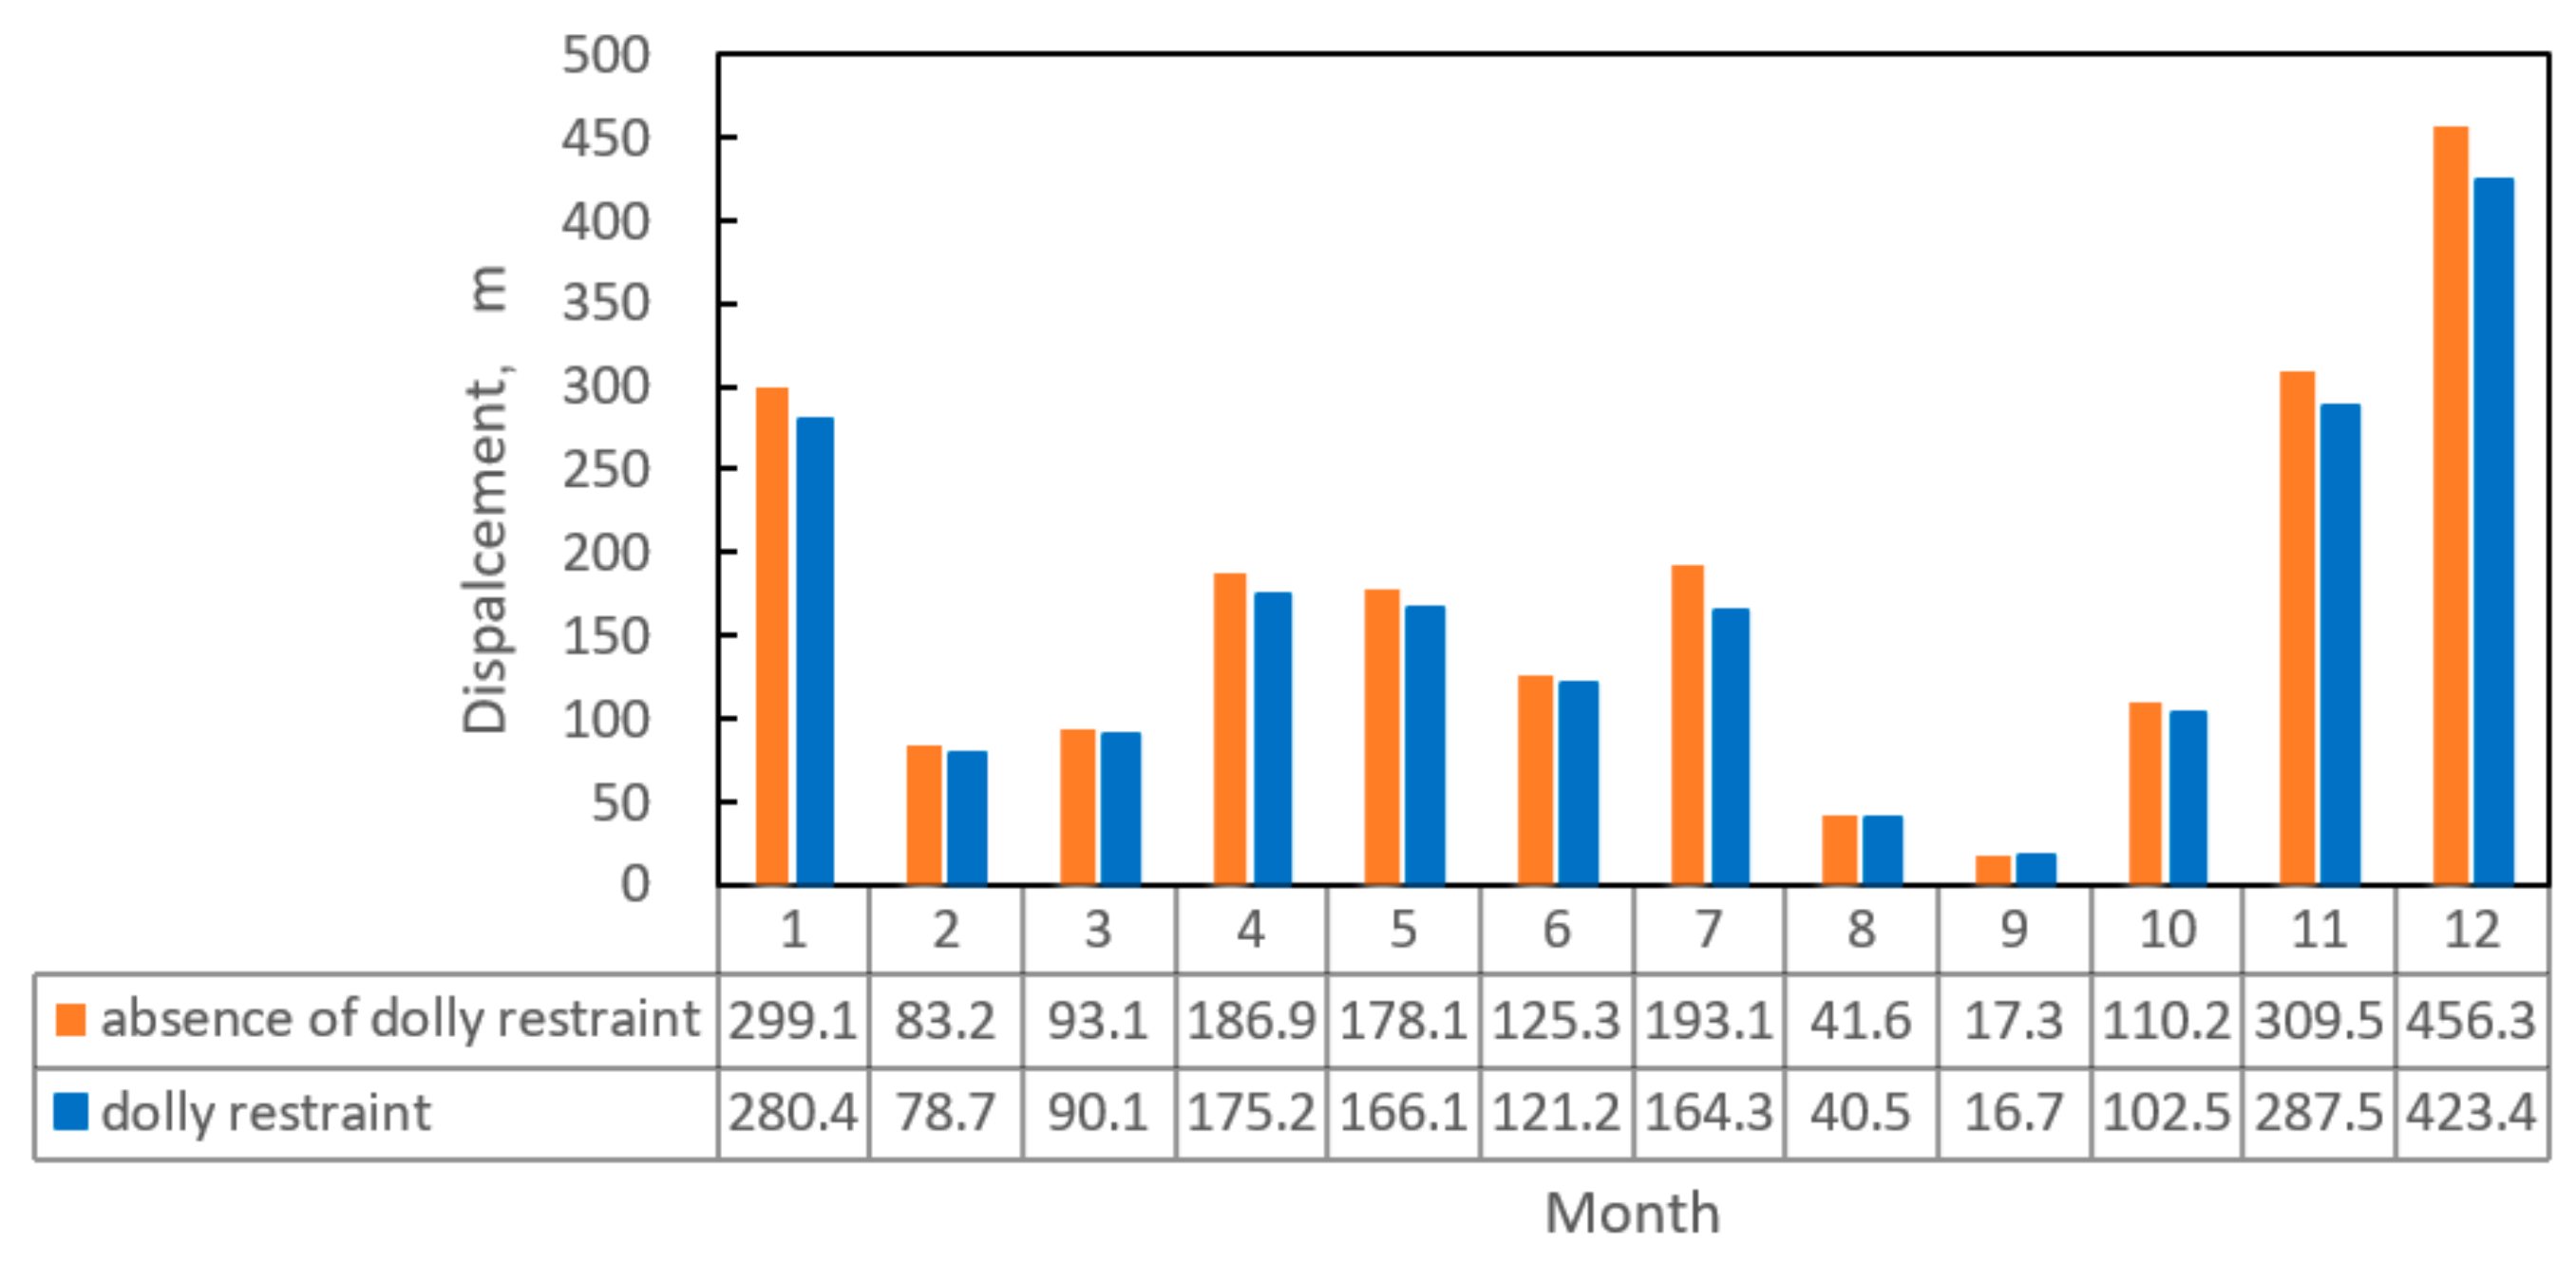
Figure 9 depicts the maximum lateral displacement of the drilling riser under different conditions, while
Figure 10 shows the maximum Mises stress. The results from both figures demonstrate that the implementation of a derrick constraint leads to a reduction in both the maximum lateral displacement and Mises stress of the drilling riser, effectively suppressing lateral offset.
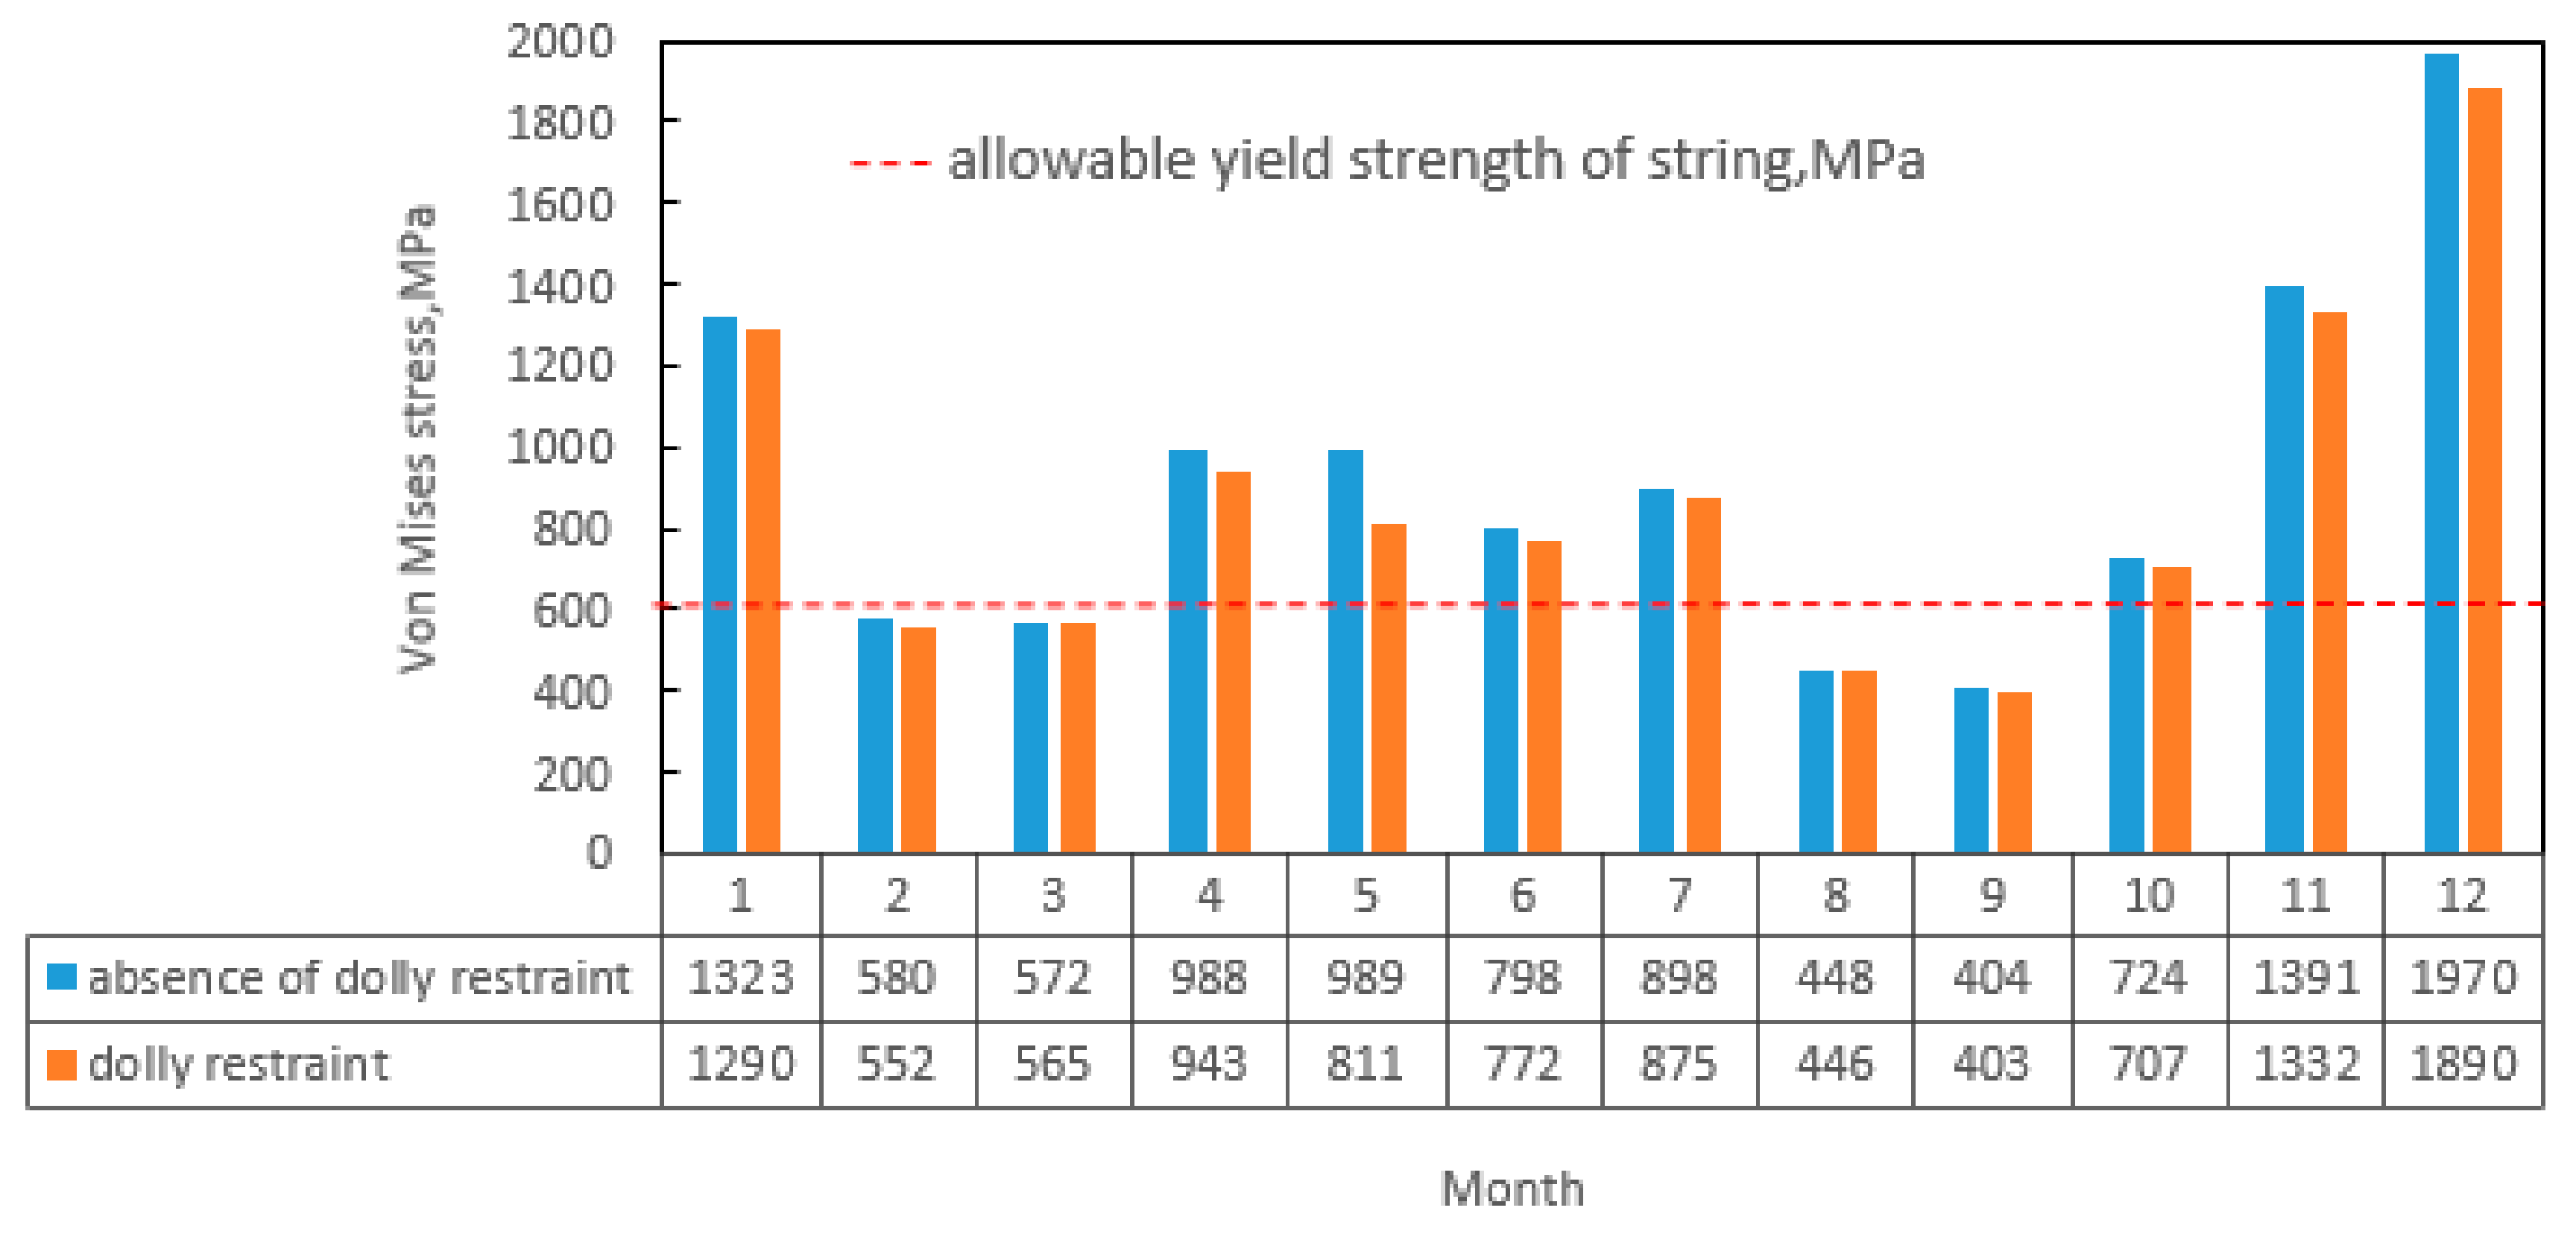
Based on the API Spec 16 standard recommended practice [
17], the equivalent stress on the drillstring carrying the casing should not exceed 0.67 times the yield stress of the drillstring during casing run-in. Considering a casing yield stress of 930.83 MPa, the equivalent stress limit when running in the casing is determined to be 623.6561 MPa, as indicated by the red dashed line in
Figure 11.
The simulation findings show that over the course of the year, the average stress levels experienced by the drill string casing entering the wellbore due to wind and waves fluctuate. The drill string casing experiences the minimum Mises stress in February (580 MPa without a trolley constraint and 552 MPa with a trolley constraint). Conversely, the casing experiences the maximum Mises stress in December (1970 MPa without a trolley constraint and 1890 MPa with a trolley constraint). During the October-to-January periods and from April to July, the Mises stress surpasses the permissible yield strength of the casing. However, imposing a stricter trolley constraint significantly reduces the stress on the drill string casing. For safe casing-lowering operations, it is advisable to carry them out in February, March, August, and September. On the other hand, it is not recommended to perform casing-lowering operations between October and the subsequent January, as well as from April through July.
In conclusion, the suggested safe operational timeframe for the drill pipe transporting casing to the wellhead stage all year round includes February, March, and August, with the surface velocity of flow for safe operations needing to remain below 0.18 m/s.
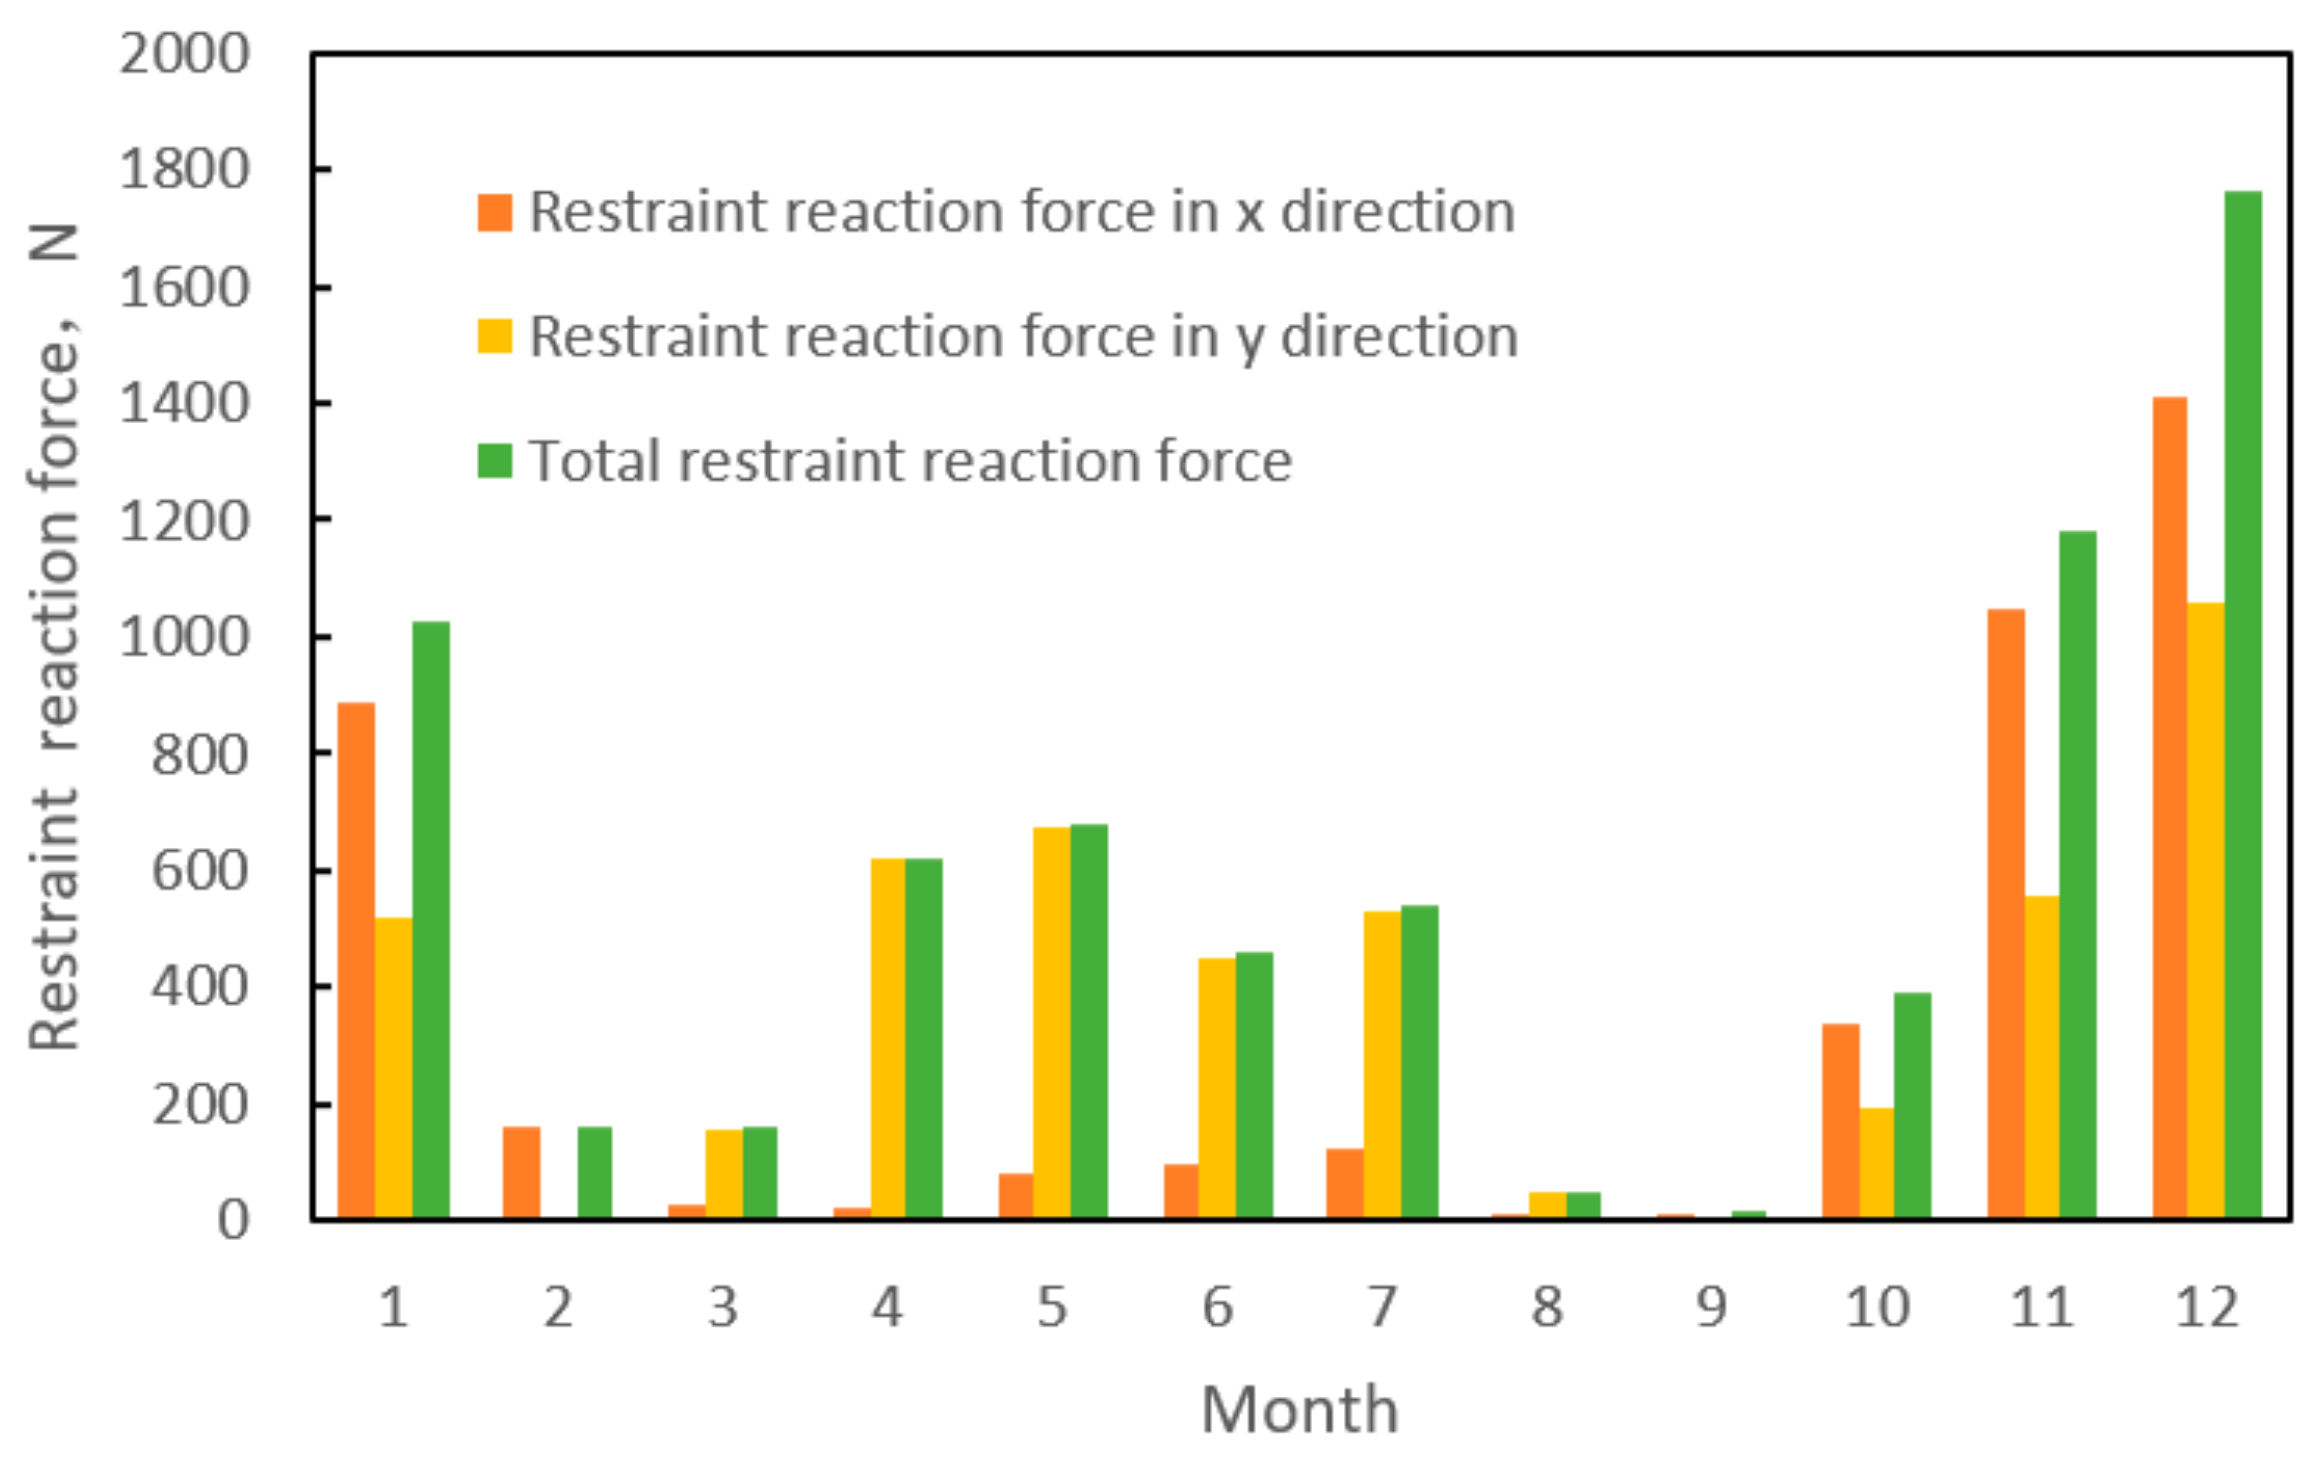
Figure 12 provides the required restraint reaction force for limiting the lateral displacement of the drill string during the year-round operation when the casing is carried into the wellhead through the BOP trolley. It is worth noting that the lowest constraint counterforce required for the drill pipe operation was in September (15.1 N), and the highest constraint counterforce required for the drill pipe operation was in December (1764.4 N).
6. Example Validation
In this section, the results of pilot wells are incorporated as additional cases to validate the accuracy of the simulation results. According to the specifications outlined in “GB/T 19830-2011 Steel Pipes for Oil and Gas Wells Casing or Tubing [
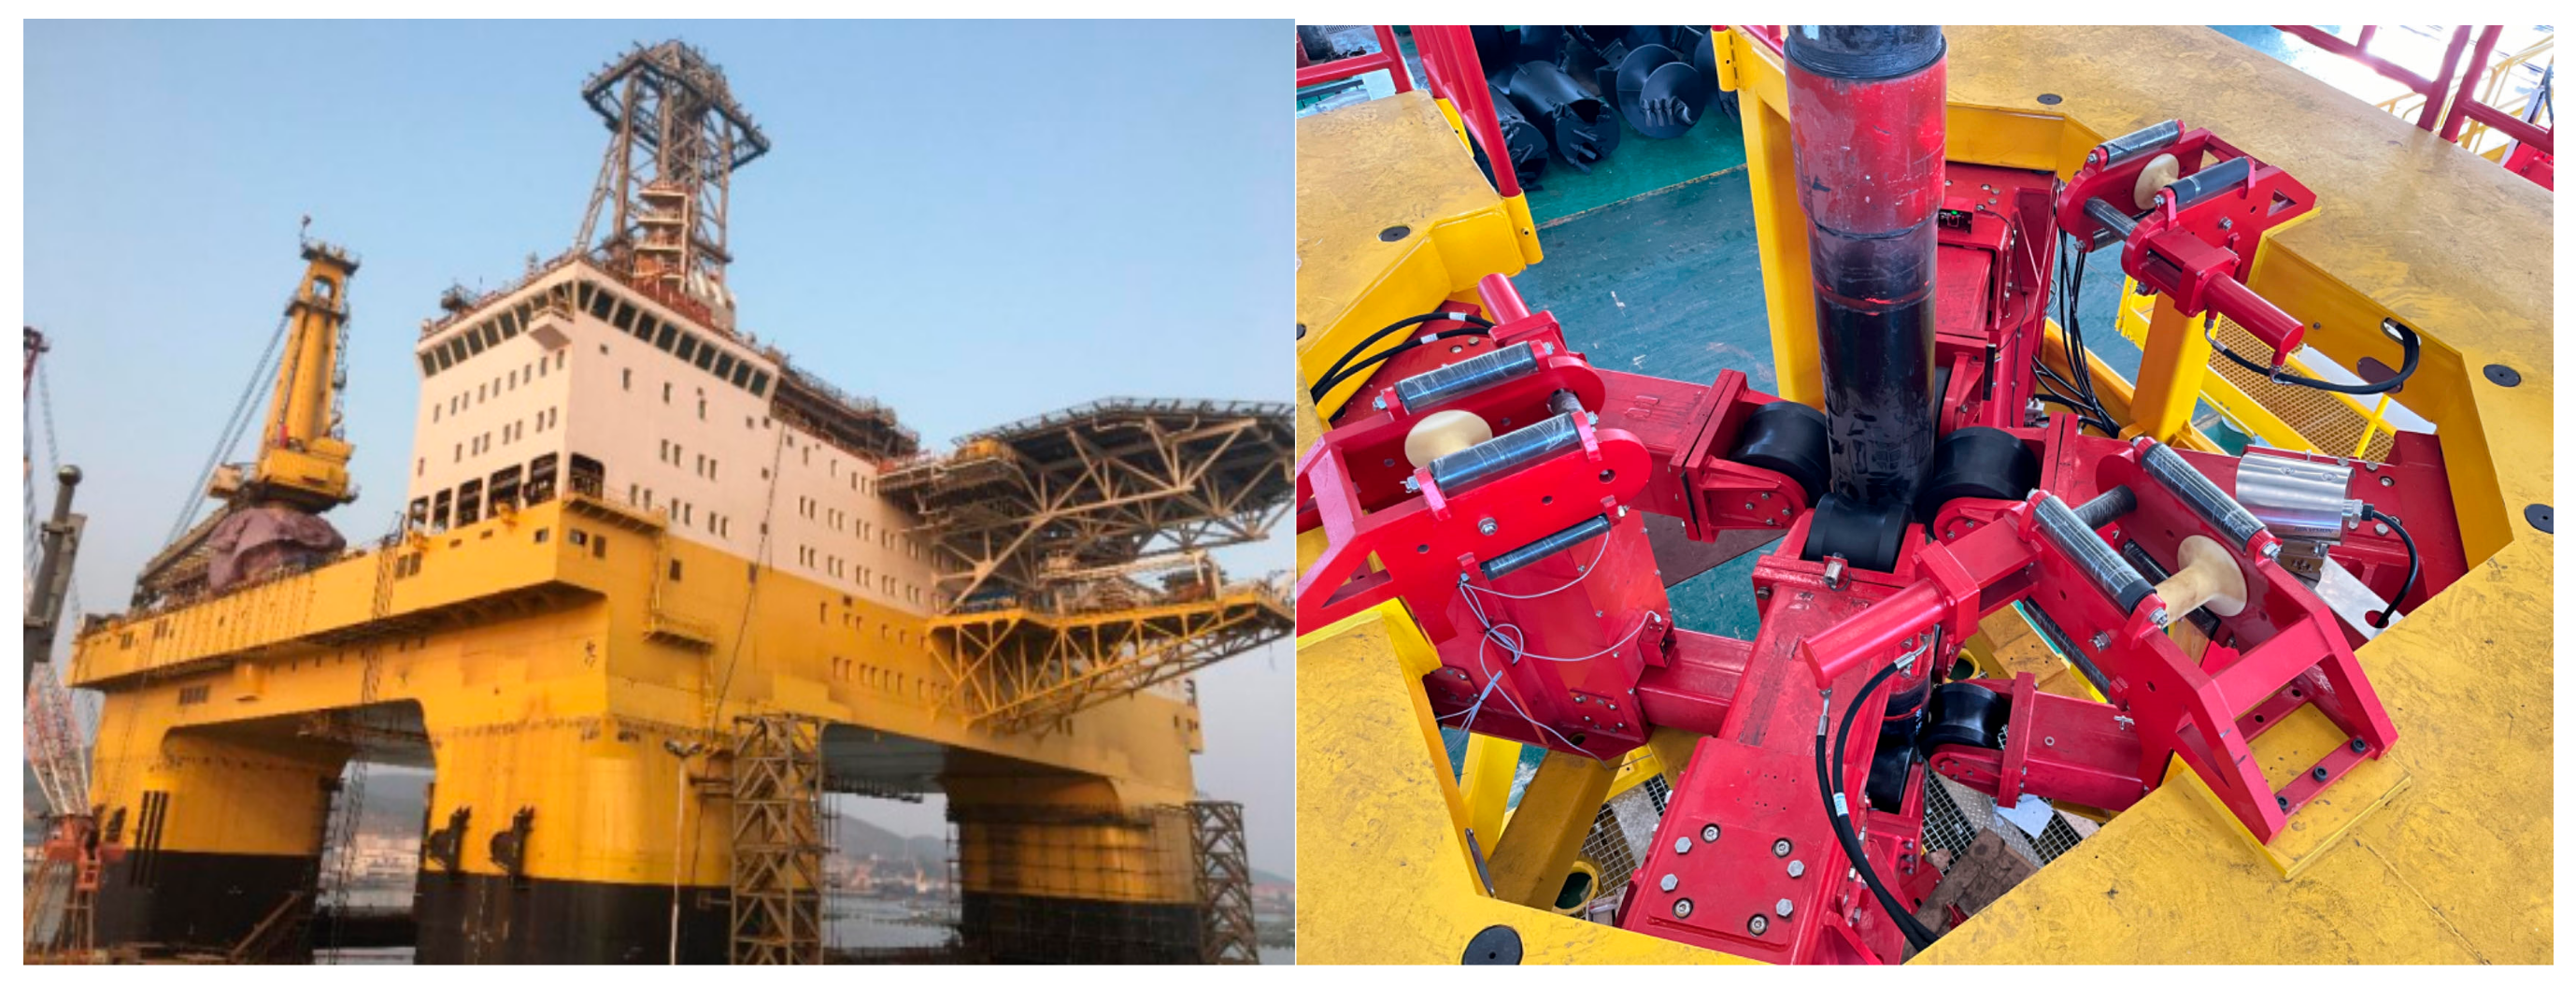
24]”, the chosen casing of pilot wells has a diameter of 9-5/8 inches, an outer diameter of 244.48 mm, and a wall thickness of 11.99 mm. The length of the casing measures 760 m, with a corresponding depth of 749 m in seawater. Operations and construction were conducted in the South China Sea’s western area in August 2020. The construction vessel employed was the Blue Whale I (
Figure 13), utilizing a BOP trolley to restrict lateral displacement. The surface current velocity was 0.06 m/s, which was less than 0.18 m/s, the wind speed was 6.5 m/s, and the wave height was 1 m. During the casing run operation, there was no collision with the moon pool. This indicates that the simulation results are reliable.
7. Conclusions
This study focused on the effects of wind, waves, and ocean currents on the lateral displacement and Mises stress of the drill string during deepwater drill string-lowering operations. Based on the Euler–Bernoulli beam theory, a quasi-static load calculation model was developed, and a simulation analysis was performed using the ANSYS platform. Utilizing historical statistical data on the typical monthly wind and wave patterns within the operational zone spanning several years, the impacts of wind, waves, ocean currents, and the BOP trolley restraint on the lateral displacement, Mises stress, and top bending moment of the landing string were evaluated. In accordance with applicable standards, the recommended safe operational window and the results of the BOP trolley design’s restraint reaction force are provided for the entire year of the landing string-lowering operation. The findings are as follows:
(1) The safety factor method calculates the landing string’s ultimate tensile load as 2220.1 kN, significantly below the maximum allowable design tensile load of 5376.6 kN. Therefore, the ultimate tensile load satisfies the requirements for tensile design.
(2) The recommended safe operation windows are given according to the statistical data from the Lingshui 17-2 block. Under the constraint conditions of the BOP trolley, the lateral displacement reaches a minimum of 17 m in September while it reaches its maximum of 423 m in December. The maximum Mises stress on the landing string in February, March, August, and September remains below the allowable yield strength, rendering it suitable for landing string operations, and the suggested maximum safe working surface velocity is below 0.18 m/s.
While this study did not consider dynamic effects, such as the response of the landing string to vibrations induced by waves, it still holds engineering significance. Future research can delve deeper into exploring the impact of dynamic effects.

 ,
, 

