
Optimization and Scheduling Method for Power Systems Considering Wind Power Forward/Reverse Peaking Scenarios

School of Electrical Engineering, Northeast Electric Power University, Jilin 132012, China
*
Author to whom correspondence should be addressed.
Energies 2024, 17(5), 1257; https://doi.org/10.3390/en17051257
Submission received: 5 February 2024
/
Revised: 27 February 2024
/
Accepted: 5 March 2024
/
Published: 6 March 2024
(This article belongs to the Section A3: Wind, Wave and Tidal Energy)
Abstract
:With the promotion of the dual carbon target, the scale of the wind power grid connection will significantly increase. However, wind power has characteristics such as randomness and volatility, and its grid connection challenges the pressure of system peak shaving, making it increasingly difficult to regulate the power system. To solve the problem of wind power abandonment, the positive and negative peak shaving characteristics of wind power were first analyzed. Based on this, it is proposed that demand response resources and energy storage with adjustable characteristics are used as the new means of wind power consumption. Together with the thermal power units, they participate in the optimization and scheduling of the power grid, forming a coordinated and optimized operation mode of source load storage. With the goal of minimizing system operating costs, a two-stage economic scheduling model was formed for the day-ahead and intra-day periods. Finally, optimization software was used to solve the problem, and the simulation results showed the effectiveness of the proposed economic scheduling model, which can improve the system’s new energy consumption and reduce the system’s operating costs.
1. Introduction
A new power system characterized by equipment for renewable energy power generation and new energy grid-connecting technologies, has gradually emerged with rapid development [1,2,3,4,5]. According to the national electricity industry statistics released by the National Energy Administration of China [6], China’s installed wind power capacity is increasing year on year, and its volatility and the need for anti-peak regulation will cause electricity costs to rise in proportion to this trend. If only traditional dispatching methods are used to smooth out system fluctuations, it will have an impact on the stable operation of thermal power units, and will also lead to serious abandoned wind and light problems [7,8,9,10,11]. Enhancing the consumption level of wind power is a pivotal issue within modern power systems. This problem requires urgent attention and resolution due to the presence of large-scale wind power integration.
With the reform of electricity marketization, demand response (DR) resources have been involved in the dispatching operation as adjustable resources of the power system [12,13,14]. In recent years, the Northeast Energy Regulatory Bureau and relevant departments have formulated implementation plans regarding power demand response, aiming to further implement the work of the National Energy Board to comprehensively promote the development of the electricity market and improve the electricity market rules system. The ability of DR resources to absorb wind power has been paid more and more attention by experts. The literature [15,16] investigated the impact of price-based demand response resources on the disruption of wind power consumption and highlighted their growing significance; these resources play an increasingly crucial role in maintaining the equilibrium between the short-term power supply and demand, considering the cross-price elasticity coefficient of load changes between hours to adjust the demand situation in response to price changes. The literature [17] analyzed the results of PDR and IDR participation in peaking, and the results showed that the two are interrelated and independent, and could be coordinated according to the system’s requirements for economy and reliability. The literature [18] established a model for demand response resource agents to provide DR standby resources, and a two-stage stochastic model was used to achieve optimal scheduling of the DR standby resources. The literature [19] established a centralized control and tariff response-based wind power consumption strategy, which considered different users to develop different strategies. The studies included only considered the scheduling of the demand response resources, so the paper added energy storage resources as a means of wind power consumption, making the system more flexible in the use of regulatory resources.
The literature [20,21] proposed that DR resources are involved at the planning level to improve the system flexibility, reduce the capacity demand of the wind power access system peaking units, and improve the system operation efficiency. The literature [22,23,24,25,26] established a stochastic unit combination model to analyze the impact of wind power uncertainty on the system. It was somewhat better than the deterministic model [8] in terms of economy and reliability. The literature [27] considered the combination of both uncertainty optimization methods and the DR consumption of wind power, and the results demonstrated that both can work synergistically to reduce the cost incurred by the uncertainty of wind power. The literature further improved the grid-connected consumption of new energy generation in practical applications, while also reducing carbon emissions to improve the operational performance of comprehensive energy. This article also provides inspiration for future research to introduce the goal of reducing carbon emissions in integrated energy systems, while balancing the low-carbon and economic benefits. However, there are the following shortcomings: one is the volatility and randomness of the new energy output, and the uncertainty regarding how the demand response load will affect the accuracy of the day-ahead dispatching plan formulated by the grid. Another point is that most of the research in the literature only considers the scheduling situation of the power grid in the day ahead, and only considers the scheduling of the demand response resources at the day-ahead timescale. The advantage of its multi-timescale characteristics has not been emphasized in many DR resource scheduling models. In the literature [28], one study proposes an optimal scheduling model for the integrated energy system within the park, incorporating multiple demand response models. To minimize the scheduling cost within the park, an enhanced particle swarm algorithm and a fuzzy chance-conditional constraint planning method were employed to formulate a rolling optimization model.
There are also many studies on the coordinated optimal dispatch of adjustable resources on the source-side and load-side to reduce the system’s wind curtailment [29,30]. The literature [29] proposes a low-carbon economic operation model with a source-load interaction. In [30], a multi-scenario optimization strategy for energy accumulation in heating networks considering source-load uncertainty was proposed to improve the operational performance of the integrated energy sources.
In recent years, energy storage systems have gained attention as potential solutions to mitigate the intermittent nature of renewable energy sources such as wind power and photovoltaics. Research on energy storage has also progressed considerably. Considering the different energy storage technologies, mechanical energy storage systems are among the various options considered to address the intermittency of renewable energy sources (e.g., flywheel energy storage [31,32] and compressed air [33]), electrical energy storage (e.g., energy storage batteries [34] and supercapacitors [35]), and other types of energy storage (e.g., hydrogen, biomass, and thermal energy storage [36]). Each type of energy storage is dependent on its own charging and discharging characteristics, as well as its primary role in the grid. Energy storage can also regulate loads through ancillary services with the aim of balancing the grid [37]. Moreover, energy storage systems can also meet the reserves to cope with the uncertainty of wind power generation [38], thus improving the stable operation of the system, and can also improve power quality [39].
Among the theoretical studies on the optimal dispatching of source-grid load and storage, the literature [40,41,42,43,44,45] presents innovations in terms of the integrated energy management system, hierarchical optimization of the model, and fast capability of the solution algorithm to improve the new energy consumption capacity of the system by developing a scheduling scheme. However, these studies have also considered the inadequacies in their research, and most of these model studies only consider the dispatching situation of the grid the day before, which may cause the effects of inefficient grid dispatching, energy waste, and inability to cope with unexpected situations; these factors impede the safe, stable, and economically efficient operation of the grid.
To address the above-mentioned problems in the demand response and new energy development, this paper coordinates and optimizes the thermal power, wind power, energy storage devices, and demand response resources on two timescales: day-ahead and intra-day. Through the demand response mechanism, the flexible load, as one of the dispatching resources, and the energy storage plant jointly participate in the dispatching plan, and establish an optimal dispatching model with the objective of minimizing the operating cost of the power system on both the day-ahead and intra-day-ahead timescales. The primary objective is to maximize wind power utilization while ensuring its optimal consumption. The method is also analyzed using arithmetic results to improve the system peaking flexibility and to improve the wind power consumption capacity. In response to the above-mentioned demand response and issues in the development of new energy, the first part of this article analyzes the characteristics of wind power generation. The second part coordinates and optimizes the thermal power, wind power, energy storage equipment, and demand response resources in two stages: day-ahead and intra-day, forming a scheduling mode for coordinated and optimized operation of source load storage, and modeling and solving it. Finally, CPLEX was used as a solving method, and the results showed the economic feasibility of the model.
2. Wind Power Characteristics Study
2.1. Analysis of Wind Power Forward/Reverse Peaking Characteristics
With the increasing scale of wind power, the range of fluctuations in the wind power output increases accordingly, and may even vary from near-zero output to rated output. Wind power exhibits a wide range of volatility, as well as a large day-to-day variability and uncertainty. By studying the typical curves of wind power, two distinct and regular types of wind power characteristic curves can be derived, as shown in the figure below. For power system dispatch, the grid-connected wind power counter-peaking scenario has a greater impact on the power system stability, and the frequency of counter-peaking scenarios is higher. Figure 1 is a schematic diagram of a wind power forward peaking curve and a daily load curve; there is no significant difference between the wind power output curve and the load curve trend. Figure 2 is a schematic diagram of a wind power reverse peaking curve and a daily load curve; there is a significant difference between the wind power output curve and the load curve trend. In both figures, the green curve is the wind power output curve and the red curve is the load curve. The left vertical axis is the load power unit and the right vertical axis is the wind power unit.
2.2. Analysis of Wind Power Consumption Mechanism under Forward/Reverse Peaking Scenarios
The grid-connected capacity of wind power is gradually increasing. The randomness, volatility, and reverse peaking regulation of wind power increase the equivalent load peak-to-valley difference (difference between load power and wind power) of the system after large-scale grid-connected consumption, leading to a multiplication of peak regulation pressure on the thermal power units. When the regulation capacity of the thermal power units cannot meet the regulation demand of the wind power and the load, one solution is to introduce an energy storage system and flexible load regulation to ensure the balance of the system’s supply and demand, thus enhancing the system’s ability to accommodate the wind power. Figure 3 and Figure 4 show the analysis of the wind power consumption mechanism based on the reverse regulation and forward peaking regulation characteristics, respectively.
Under the traditional mode of dispatch, the net load of the power system is:
where Pl is the conventional load of the system and PW is the wind power output. The blocked wind power (① + ② + ③) at this time is:
where PGmin is the minimum value of the peaking capacity of conventional units.
If the flexible load participates in system peaking, its blocked wind power (① + ②) is:
where P′l_eq is the net load after the participation of the flexible load in the peaking. It can be seen from the figure that the abandoned wind volume of the system is reduced due to the participation of the flexible load.
As can be seen from the figure below, the participation of the energy storage system can shift the peak hours in the demand-side management planning to off-peak hours on the basis of the flexible loads for peaking. Simply put, during the hours of low electricity prices, the energy storage system undergoes charging, and during the hours of high electricity prices, it discharges stored energy. The system wind curtailment (①) is also further reduced, and the net load peak-to-valley difference is somewhat smaller for the forward peaking scenario compared with the anti-peaking scenario.
3. Multi-Timescale Scheduling Model Considering Wind Power Forward/Reverse Peaking Scenarios
3.1. Multi-Timescale Models
These new energy sources have characteristics such as volatility and uncertainty, which have important impacts on the power system. In the study of this paper, the wind power is divided into two scenarios; one type exhibits a positive correlation with the daily load curve, while the other type demonstrates a reverse correlation with the daily load curve. When data from these two different scenarios are brought into the model for calculation, firstly, the prediction accuracy of the wind power has some deviation; however, this improves as the prediction scale is reduced. Secondly, there is a problem of differentiation in the regulation characteristics of the dispatching resources in the system, so a level-by-level refinement of the dispatching model is needed to accommodate different timescales. It is difficult to satisfy the operational characteristics of the various types of resources by only performing optimal scheduling on a single timescale. Therefore, to address these problems, further research and optimization of scheduling strategies are necessary to effectively meet the challenges of new energy consumption.
The two-stage optimization problem established in this article belongs to the mixed integer linear programming (MILP) problem, which has many solving methods. This article uses CPLEX to solve this type of problem. The standard form of the MILP problem [46] is:
In the formula, x is the variable to be optimized and includes the wind power, operating cost of the thermal power units, penalty cost for the wind curtailment, output of the thermal power units, etc. Y is the start-stop plan for the thermal power units.
Considering the above factors, for the purpose of better improving the new energy consumption capacity and system economy, this paper establishes a multi-timescale scheduling model for the wind power forward/reverse peaking scenarios, the framework of which is shown in Figure 5.
In the following sections, the day-ahead and intra-day scheduling models are explained separately from an economic perspective.
3.2. Day-Ahead Scheduling Model
3.2.1. Objective Function
The day-ahead optimal dispatch model, incorporating thermal power, wind power, and flexible load, constructed in this paper aims to achieve the economic operation of the power systems containing wind power by coordinating and optimizing the generation-side and load-side resources. The model converts the wind curtailment and load shortage into penalty costs by incorporating them into the system operating costs to achieve economic optimization and improves the grid new energy consumption capacity and power supply reliability in an emergency mode. The objective function includes the operating costs of conventional units, start-up and shutdown costs, wind farm operating costs, wind curtailment penalty costs, incentive-based demand response resource call compensation costs, energy storage costs, and load outage costs, aiming to minimize the total operating costs of the system. The day-ahead scheduling plan is implemented on a daily basis, utilizing an hourly timescale. The objective function is expressed as follows:
In Formula (5), fTH,t is the cost of the conventional unit operation; fQT,t is the cost of the start-up and shutdown; fw,t is the cost of the wind farm operation; fqw,t is the cost of the wind curtailment penalty; fIDR,t is the cost of the IDR incentive-based demand response resource call compensation; fbat,t is the cost of the energy storage; and floss,t is the cost of the load shortage. Formula (6) is the expansion of each cost in Formula (5). In Formula (6), Ns is the number of scenarios; NG is the conventional unit; Ps is the probability coefficient of occurrence of s scenario; PGi,s,t is the generation capacity of the i-th conventional unit in s scenario at time t; ai, bi, and ci are the generation cost coefficients of the i-th unit, respectively; Si is the start-stop cost coefficient of the i-th conventional unit; uGi,t is the start-stop status of the i-th unit at time t, which is a decision variable, where 1 means start and 0 means stop; kW is the wind farm operation cost coefficient; Pw,s,t is the wind farm output in scenario s at moment t; kqw is the wind curtailment penalty coefficient; is the predicted wind power output of the previous day’s wind farm in scenario s at moment t; kIDRA and kIDRB are the class A IDR load and class B IDR load invocation cost coefficients, respectively; ΔPIDRA,t and ΔPIDRB,t are the class A IDR and class B IDR invocations at moment t, respectively; and are the charging and discharging energy storage cost coefficients, respectively; and are the charging and discharging powers of the energy storage, respectively; λloss is the cost coefficient of the load deficiency; and Ploss,t is the amount of load deficiency.
3.2.2. Binding Conditions
Equation (7) is the active power balance constraint, where ΔPPDR,t is the PDR call at time t, PL0,t is the initial state load value of the system, and Pw,t is the wind power output.
Equation (8) is the unit output constraint, where the regulating capacity of thermal power units is limited [47], and and are the upper and lower limits of the output, respectively.
Equation (9) is the unit climbing constraint, where Ri is the climbing rate.
Equation (10) is the minimum start/stop time constraint for the unit, where Ton,i and Toff,i are the minimum continuous start time and the minimum continuous stop time, respectively.
Equation (11) is a constraint on the upper and lower limits of the wind power output, where is the wind power forecast at time t.
Equation (12) is the climbing constraint of the wind power output, where Rw_down and Rw_up are the climbing rate limits of the increase and decrease in the wind power, respectively.
PDR mainly influences customers’ electricity consumption plans through the electricity price, so its response amount is related to the electricity price. Equation (13) is the elasticity matrix, where Δqt is the rate of change in the load at moment t; Δpt is the rate of change in the electricity price at moment t; and E is the price-based elasticity coefficient.
Equation (14) provides the upper and lower bound constraints of the PDR resource invocation, where and are the lower and upper limits of the PDR load calls, respectively.
Equation (15) is the IDR constraint, where and are the IDR increase load amounts of class A and B, respectively; and and are the IDR decrease load amounts of class A and B, respectively.
Equation (16) is the SOC calculation formula, where Ebat is the current battery storage capacity and Cbat is the energy storage battery capacity.
Equation (17) shows the change in power during the charging and discharging of the battery. The prolonged use of a battery can cause its capacity to drop [48]. Δ is the moment t energy storage device charging power, and similarly, Δ is the moment t energy storage device discharging power. ηcha and ηdis are the energy storage charging and discharging efficiencies, respectively, and Δt is the charging and discharging time interval.
In Equation (18), SOCmax and SOCmin are the maximum and minimum values of the charge state of the energy storage device, respectively; and are the minimum charge power and maximum charge power of the energy storage device, respectively; and similarly, and are the upper and lower limits of the discharge power of the energy storage device, respectively.
Equation (19) is the transmission line power constraint, where, Pex,t is the power of the grid transmission line and is the transmission line power limit.
3.2.3. Optimization Results
The model was analyzed by the optimal solution algorithm to obtain the regular unit start/stop schedule. The PDR callable resource calls and class A IDR resource calls were brought into the subsequent scheduling model as the deterministic quantities.
3.3. Intra-Day Scheduling Model
3.3.1. Objective Function
The intra-day optimal scheduling objective is still to minimize the system operation cost, and the scheduling plan for this subsection is to schedule every 15 min with a timescale of 15 min in the next 4 h. With the gradual improvement of the accuracy of the new energy and load forecasting, at this time, the class B IDR and energy storage can respond in a shorter period of time with the following objective function:
3.3.2. Binding Conditions
The constraints in these two phases are similar. Since the regular unit start/stop schedule, PDR resource calls, and class A IDR resource calls were determined in the scheduling optimization results a few days ago, these constraints do not exist in this subsection and will not be repeated here.
3.3.3. Optimization Results
Using the algorithm to solve the model, the conventional unit output plan, class B IDR dosage, and electrochemical energy storage power station charge and discharge amounts were obtained.
4. Example Analysis
4.1. Example Overview
For the model in this paper, the IEEE 30-node system was used as the base system model for improvement. The improved system contains six conventional units; Table 1 shows the operating parameters of the conventional thermal units: one wind farm with an installed capacity of 300 MW, an energy storage plant, and two IDR demand resource dispatching stations, whose topology diagram is shown in Figure 6 below. It is assumed that the variation range of the PDR does not exceed 6% of the total load, the invocation of the class A IDR load does not exceed 3% of the total load, the invocation of the class B IDR load does not exceed 2% of the total load, and the compensation cost of both the class A IDR and class B IDR are fixed values of 50 and 60, respectively. Table 2 shows the demand response resources classified as incentive-based according to the dispatch response speed, and the model that can be found in the MATLAB 2018 platform of the YALMIP 2018 toolkit to call the solver for solving.
The load and wind power forecasts are generated based on measured data plus white noise, where the day-ahead forecast curve is extended from the original 1-h interval (24 data points) to 96 data points at 15-min intervals (the four extended data points within each hour are taken to be the same value). The prediction errors are 4% and 1% for the day-ahead and intra-day loads, respectively, and 6% and 3% for the corresponding wind powers, respectively. With the objective of verifying the effect of the proposed scheduling strategy in different wind power output scenarios, two typical scenarios of forward and reverse peaking regulation of wind power are selected for analysis in the example part, and the ratio of forward and reverse peaking regulation probability is taken as 3:7. The measured and forecasted load and wind power curves are shown in the following figures: Figure 7, Figure 8 and Figure 9 show the day-ahead and intra-day prediction curves of the load and the forward and reverse peaking regulation of the wind power, respectively.
4.2. Analysis of Scheduling Results
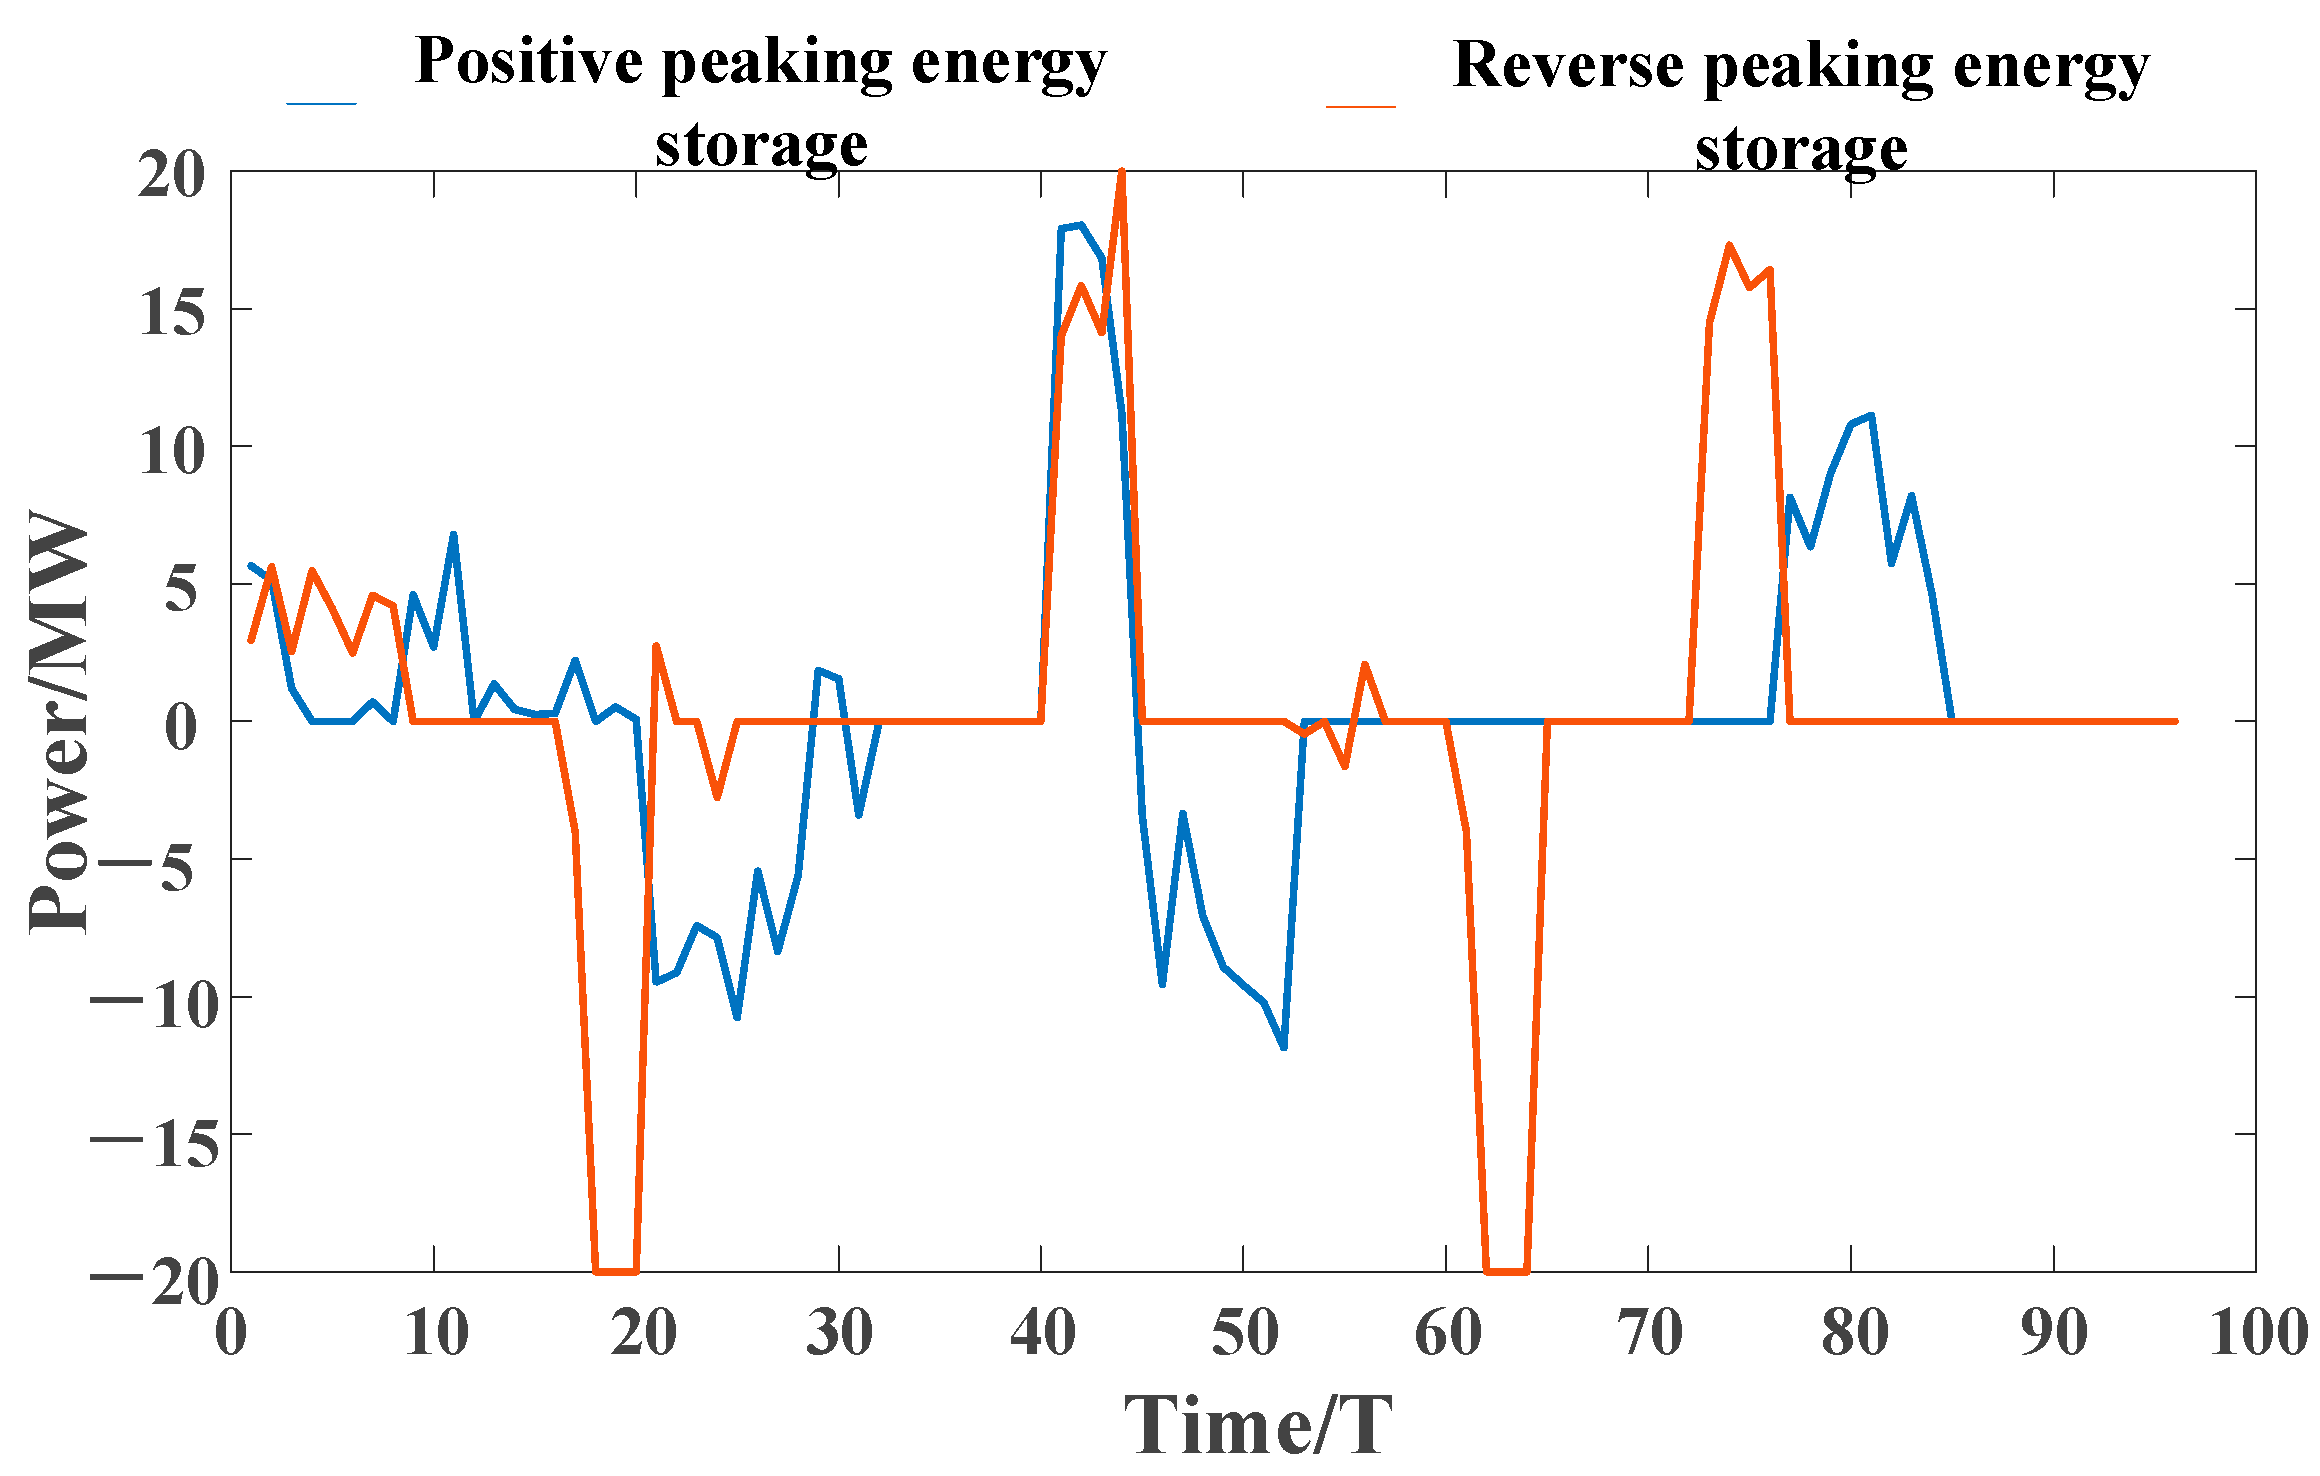
In this paper, the results of the established scheduling model are analyzed under the two scenarios of forward and reverse peaking. Figure 10 and Figure 11 below show the scheduling results of the two scenarios of forward and reverse peaking. Figure 12 and Figure 13 show the demand response resource calling plans under the two scenarios, and Figure 14 shows the scheduling of the energy storage plants.
This study examines the forward and reverse peaking regulation scenarios. The scheduling model’s results were analyzed comprehensively. During the forward peaking scenario, the wind power exhibits peak periods from 1:15 to 3:00, 5:00 to 11:00, and 17:00 to 19:30. The wind power output aligns closely with the load curve during these periods, and can efficiently absorb the wind power without any extensive demand response resource adjustments. Consequently, the system has a high non-DR capacity, requiring less IDR resource allocation compared with the wind power reverse peaking scenario. In the wind power reverse peaking scenario, the wind power peaks from 3:00 to 8:00 and from 13:30 to 17:00, with a significantly different output curve trend from the load curve and a lower load demand. During these periods, positive adjustments in the demand response resources and energy storage charging improve the level of wind power consumption.
It can be seen, based on the integrated result scheduling diagrams in Figure 10 and Figure 11, and the demand response resource regulation diagrams in Figure 12 and Figure 13, that the system still primarily relies on the conventional units for power adjustment to fulfill the peaking plan. Although the total amount of the load that can be transferred by the class B IDR resources and energy storage plants is less, it is more flexible compared with the class A IDR resources, which can only respond over a short period of time and need to be called upon frequently to alleviate wind power fluctuations over a short period of time. The magnitude of the class B IDR resources fluctuation is smaller, but its changes are more dramatic; in the figure, this can be seen in the intra-day dispatch of the class B IDR resources with the changes reflected being more dramatic, and suitable for some sudden load fluctuations or to calm the wind power fluctuations in a shorter timescale. From Figure 14, it can be concluded that the amount of energy storage called during the forward peaking regulation is smaller than that during the reverse peaking regulation, so that it can respond to regulation more quickly in the face of changing wind power or sudden load changes.
4.3. Comparison Analysis of Different Scheduling Modes
To compare and analyze the roles of the different scheduling methods in promoting wind power consumption and reducing system costs, this paper also set up different scheduling schemes for comparison and analysis under the two scenarios of forward and reverse peaking of wind power:
- (1)
- No energy storage plants are involved, while no multi-timescale dispatch is considered and only the thermal power units are involved in peaking;
- (2)
- Add DR resources on the basis of scheme (1) and only perform the day-ahead scheduling;
- (3)
- Based on the scheduling method proposed in this paper.
Table 3 shows the comparison of the results.
In the day-ahead dispatching in option 1, where both the energy storage and flexible loads are not involved in regulation, especially in the high wind power new energy time, a single thermal power unit cannot meet the large-scale wind power consumption after the new energy is connected to the grid, leading to a serious wind curtailment phenomenon. The forward and reverse peaking scenarios in option 1 have abandonment rates of 8.4% and 12.3%, respectively, and the total system cost in the first option is also the highest, reaching 647,216 CNY. In the same scenario, the wind power abandoned in the reverse peaking scenario is larger than the wind power abandoned in the forward peaking scenario. This reverse peaking characteristic of the wind power increases the net load peak-to-valley difference and further enhances the difficulty of peak regulation.
Option 2 and option 3 increase the flexible load on the basis of option 1. Adding an energy storage power station in option 3 alleviates part of the peak load of thermal power, and the total cost is reduced by 156,584 CNY and 200,935 CNY compared with option 1. Compared with option 1, option 2 adds an adjustable flexible load, which can decrease the system’s curtailment wind to a certain extent. Under the two scenarios of forward and reverse peaking regulation, the wind curtailment rate is reduced by 4.8% and 7.4%, respectively, and the total system cost is also significantly reduced due to the absorption of a large amount of wind power. The flexible load and the thermal power jointly participate in peaking regulation, so that the overall benefit of the system is improved, and the flexible load can adjust the load change according to the flexible fluctuation of the wind power, which better promotes the consumption of new energy. On the basis of option 2, option 3 makes full use of the multi-timescale characteristics of the energy storage and other demand response resources, and can adjust wind power fluctuations in a short timescale in a timely manner. The class B IDR and energy storage can be more accurately invoked in the intra-day optimal scheduling, further reducing the system’s wind curtailment rate and improving the system’s benefits. In option 3, under the two scenarios of forward and reverse peaking regulation, the wind curtailment rate is reduced by 2% and 2.4%, respectively. The total system cost of option 3 is also the smallest at 446,281 CNY.
In summary, the scheduling model designed in this paper can make full use of the more or less timescale characteristics of the demand response resources to develop a reasonable scheduling plan, which can play a role in alleviating the wind curtailment problem and improving the system’s economy.
5. Conclusions
In order to improve the wind power consumption, reduce the loss caused by the wind power fluctuations, and reduce the peak load balancing pressure of the power system, this paper proposes a two-stage scheduling method under the scenario of positive and negative peak balancing of the wind power. In these two stages, the wind power utilizes energy storage devices and demand response resources to participate in grid optimization scheduling through a smaller timescale, flexibly reducing the impact of the wind power grid-connection on the power system. With the continuous reduction in the thermal power generation scale and the continuous increase in the grid-connected capacity of the wind power, the coordination of the various resources in the power system is a very important research direction.
The composition of the energy storage power station proposed in this paper only considers electrochemical energy storage. Different energy storage technologies have different characteristics, and future power systems will be connected with various types of large-scale energy storage systems. In the future, we can consider adding a real-time phase on the basis of the two phases (day-ahead and intra-day) used in this paper to assess the scheduling performance of the system at a deeper level.
Author Contributions
Conceptualization, Y.W. and S.W.; Methodology, H.Y. and Y.W.; Validation, C.H. and J.X.; Investigation, C.L., S.W. and C.H.; Resources, C.L. and J.X.; Data curation, Y.W.; Writing—original draft, H.Y.; Writing—review & editing, H.Y. and Y.W.; Supervision, C.L., S.W. and C.H. All authors have read and agreed to the published version of the manuscript.
Funding
This research received no external funding.
Data Availability Statement
The data presented in this study are available on request from the corresponding author. The data are not publicly available due to fear of data leakage.
Conflicts of Interest
The authors declare no conflict of interest.
References
- Qays, M.O.; Ahmad, I.; Habibi, D.; Aziz, A.; Mahmoud, T. System Strength Shortfall Challenges for Renewable Energy-Based Power Systems: A Review. Renew. Sustain. Energy Rev. 2023, 183, 113447. [Google Scholar] [CrossRef]
- Liu, L.; Xu, J. Multi-Objective Generation Scheduling towards Grid-Connected Hydro–Solar–Wind Power System Based the Coordination of Economy, Management, Society, Environment: A Case Study from China. Int. J. Electr. Power Energy Syst. 2022, 142, 108210. [Google Scholar] [CrossRef]
- Yang, C.; Wu, Z.; Li, X.; Fars, A. Risk-Constrained Stochastic Scheduling for Energy Hub: Integrating Renewables, Demand Response, and Electric Vehicles. Energy 2024, 288, 129680. [Google Scholar] [CrossRef]
- Li, S.; Zhao, X.; Liang, W.; Hossain, M.T.; Zhang, Z. A Fast and Accurate Calculation Method of Line Breaking Power Flow Based on Taylor Expansion. Front. Energy Res. 2022, 10, 943946. [Google Scholar] [CrossRef]
- Yang, Y.; Si, Z.; Jia, L.; Wang, P.; Huang, L.; Zhang, Y.; Ji, C. Whether Rural Rooftop Photovoltaics Can Effectively Fight the Power Consumption Conflicts at the Regional Scale—A Case Study of Jiangsu Province. Energy Build. 2024, 306, 113921. [Google Scholar] [CrossRef]
- National Energy Administration releases the statistical data of national electric power industry from January to March. Electr. Power Surv. Des. 2023, 4, 98.
- Porate, K.B.; Thakre, K.L.; Bodhe, G.L. Impact of Wind Power on Generation Economy and Emission from Coal Based Thermal Power Plant. Int. J. Electr. Power Energy Syst. 2013, 44, 889–896. [Google Scholar] [CrossRef]
- Li, L.; Li, Y.; Zhou, B.; Wu, Q.; Shen, X.; Liu, H.; Gong, Z. An Adaptive Time-Resolution Method for Ultra-Short-Term Wind Power Prediction. Int. J. Electr. Power Energy Syst. 2020, 118, 105814. [Google Scholar] [CrossRef]
- Bird, L.; Lew, D.; Milligan, M.; Carlini, E.M.; Estanqueiro, A.; Flynn, D.; Gomez-Lazaro, E.; Holttinen, H.; Menemenlis, N.; Orths, A.; et al. Wind and Solar Energy Curtailment: A Review of International Experience. Renew. Sustain. Energy Rev. 2016, 65, 577–586. [Google Scholar] [CrossRef]
- Simla, T.; Stanek, W. Influence of the Wind Energy Sector on Thermal Power Plants in the Polish Energy System. Renew. Energy 2020, 161, 928–938. [Google Scholar] [CrossRef]
- Emblemsvåg, J. Wind Energy Is Not Sustainable When Balanced by Fossil Energy. Appl. Energy 2022, 305, 117748. [Google Scholar] [CrossRef]
- Zhao, C.; Wang, J.; Watson, J.-P.; Guan, Y. Multi-Stage Robust Unit Commitment Considering Wind and Demand Response Uncertainties. IEEE Trans. Power Syst. 2013, 28, 2708–2717. [Google Scholar] [CrossRef]
- Huang, W.; Zhang, N.; Kang, C.; Li, M.; Huo, M. From Demand Response to Integrated Demand Response: Review and Prospect of Research and Application. Prot. Control Mod. Power Syst. 2019, 4, 12. [Google Scholar] [CrossRef]
- Yang, Z.; Qin, Z. Demand Response Model by Locational Marginal Electricity–Carbon Price Considering Wind Power Uncertainty and Energy Storage Systems. Energy Rep. 2023, 9, 742–752. [Google Scholar] [CrossRef]
- De Jonghe, C.; Hobbs, B.F.; Belmans, R. Value of Price Responsive Load for Wind Integration in Unit Commitment. IEEE Trans. Power Syst. 2014, 29, 675–685. [Google Scholar] [CrossRef]
- Corinaldesi, C.; Schwabeneder, D.; Lettner, G.; Auer, H. A Rolling Horizon Approach for Real-Time Trading and Portfolio Optimization of End-User Flexibilities. Sustain. Energy Grids Netw. 2020, 24, 100392. [Google Scholar] [CrossRef]
- Behrangrad, M.; Sugihara, H.; Funaki, T. Analyzing the System Effects of Optimal Demand Response Utilization for Reserve Procurement and Peak Clipping. In Proceedings of the IEEE PES General Meeting, Minneapolis, MI, USA, 25–29 July 2010; pp. 1–7. [Google Scholar]
- Parvania, M.; Fotuhi-Firuzabad, M. Demand Response Scheduling by Stochastic SCUC. IEEE Trans. Smart Grid 2010, 1, 89–98. [Google Scholar] [CrossRef]
- Dietrich, K.; Latorre, J.M.; Olmos, L.; Ramos, A. Demand Response in an Isolated System with High Wind Integration. IEEE Trans. Power Syst. 2012, 27, 20–29. [Google Scholar] [CrossRef]
- Jin, S.; Botterud, A.; Ryan, S.M. Impact of Demand Response on Thermal Generation Investment with High Wind Penetration. IEEE Trans. Smart Grid 2013, 4, 2374–2383. [Google Scholar] [CrossRef]
- De Jonghe, C.; Hobbs, B.F.; Belmans, R. Optimal Generation Mix with Short-Term Demand Response and Wind Penetration. IEEE Trans. Power Syst. 2012, 27, 830–839. [Google Scholar] [CrossRef]
- Barth, R.; Brand, H.; Meibom, P.; Weber, C. A Stochastic Unit-Commitment Model for the Evaluation of the Impacts of Integration of Large Amounts of Intermittent Wind Power. In Proceedings of the 2006 International Conference on Probabilistic Methods Applied to Power Systems, Stockholm, Sweden, 11–15 June 2006; pp. 1–8. [Google Scholar]
- Tuohy, A.; Meibom, P.; Denny, E.; O’Malley, M. Unit Commitment for Systems with Significant Wind Penetration. IEEE Trans. Power Syst. 2009, 24, 592–601. [Google Scholar] [CrossRef]
- Siahkali, H.; Vakilian, M. Stochastic Unit Commitment of Wind Farms Integrated in Power System. Electr. Power Syst. Res. 2010, 80, 1006–1017. [Google Scholar] [CrossRef]
- Liu, G. Data Collection in MI-Assisted Wireless Powered Underground Sensor Networks: Directions, Recent Advances, and Challenges. IEEE Commun. Mag. 2021, 59, 132–138. [Google Scholar] [CrossRef]
- Li, S.; Wang, F.; Ouyang, L.; Chen, X.; Yang, Z.; Rozga, P.; Li, J.; Fofana, I. Differential Low-Temperature AC Breakdown between Synthetic Ester and Mineral Oils: Insights from Both Molecular Dynamics and Quantum Mechanics. IEEE Trans. Dielect. Electr. Insul. 2023, 1. [Google Scholar] [CrossRef]
- Papavasiliou, A.; Oren, S.S. A Stochastic Unit Commitment Model for Integrating Renewable Supply and Demand Response. In Proceedings of the 2012 IEEE Power and Energy Society General Meeting, San Diego, CA, USA, 22–26 July 2012; pp. 1–6. [Google Scholar]
- Wang, L.; Lin, J.; Dong, H.; Wang, Y.; Zeng, M. Demand Response Comprehensive Incentive Mechanism-Based Multi-Time Scale Optimization Scheduling for Park Integrated Energy System. Energy 2023, 270, 126893. [Google Scholar] [CrossRef]
- Chen, M.; Lu, H.; Chang, X.; Liao, H. An Optimization on an Integrated Energy System of Combined Heat and Power, Carbon Capture System and Power to Gas by Considering Flexible Load. Energy 2023, 273, 127203. [Google Scholar] [CrossRef]
- Wang, J.; Huo, S.; Yan, R.; Cui, Z. Leveraging Heat Accumulation of District Heating Network to Improve Performances of Integrated Energy System under Source-Load Uncertainties. Energy 2022, 252, 124002. [Google Scholar] [CrossRef]
- Gao, Q.; Yuan, R.; Ertugrul, N.; Ding, B.; Hayward, J.A.; Li, Y. Analysis of Energy Variability and Costs for Offshore Wind and Hybrid Power Unit with Equivalent Energy Storage System. Appl. Energy 2023, 342, 121192. [Google Scholar] [CrossRef]
- Li, Q.; Li, X.; Mi, J.; Jiang, B.; Chen, S.; Zuo, L. Tunable Wave Energy Converter Using Variable Inertia Flywheel. IEEE Trans. Sustain. Energy 2021, 12, 1265–1274. [Google Scholar] [CrossRef]
- Li, B.; DeCarolis, J.F. A Techno-Economic Assessment of Offshore Wind Coupled to Offshore Compressed Air Energy Storage. Appl. Energy 2015, 155, 315–322. [Google Scholar] [CrossRef]
- Roy, A.; Kedare, S.B.; Bandyopadhyay, S. Optimum Sizing of Wind-Battery Systems Incorporating Resource Uncertainty. Appl. Energy 2010, 87, 2712–2727. [Google Scholar] [CrossRef]
- Ceballos, S.; Rea, J.; Robles, E.; Lopez, I.; Pou, J.; O’Sullivan, D. Control Strategies for Combining Local Energy Storage with Wells Turbine Oscillating Water Column Devices. Renew. Energy 2015, 83, 1097–1109. [Google Scholar] [CrossRef]
- Zhao, H.; Wu, Q.; Hu, S.; Xu, H.; Rasmussen, C.N. Review of Energy Storage System for Wind Power Integration Support. Appl. Energy 2015, 137, 545–553. [Google Scholar] [CrossRef]
- Zafirakis, D.; Chalvatzis, K.J.; Baiocchi, G.; Daskalakis, G. Modeling of Financial Incentives for Investments in Energy Storage Systems That Promote the Large-Scale Integration of Wind Energy. Appl. Energy 2013, 105, 138–154. [Google Scholar] [CrossRef]
- Korpaas, M.; Holen, A.T.; Hildrum, R. Operation and Sizing of Energy Storage for Wind Power Plants in a Market System. Int. J. Electr. Power Energy Syst. 2003, 25, 599–606. [Google Scholar] [CrossRef]
- Liu, J.; Sun, X.; Bo, R.; Wang, S.; Ou, M. Economic Dispatch for Electricity Merchant with Energy Storage and Wind Plant: State of Charge Based Decision Making Considering Market Impact and Uncertainties. J. Energy Storage 2022, 53, 104816. [Google Scholar] [CrossRef]
- Li, Y.; Wang, J.; Zhang, Y.; Han, Y. Day-Ahead Scheduling Strategy for Integrated Heating and Power System with High Wind Power Penetration and Integrated Demand Response: A Hybrid Stochastic/Interval Approach. Energy 2022, 253, 124189. [Google Scholar] [CrossRef]
- Chen, C.; Wu, X.; Li, Y.; Zhu, X.; Li, Z.; Ma, J.; Qiu, W.; Liu, C.; Lin, Z.; Yang, L.; et al. Distributionally Robust Day-Ahead Scheduling of Park-Level Integrated Energy System Considering Generalized Energy Storages. Appl. Energy 2021, 302, 117493. [Google Scholar] [CrossRef]
- Chen, Z.; Zhang, Y.; Tang, W.; Lin, X.; Li, Q. Generic Modelling and Optimal Day-Ahead Dispatch of Micro-Energy System Considering the Price-Based Integrated Demand Response. Energy 2019, 176, 171–183. [Google Scholar] [CrossRef]
- Yang, H.; Liang, R.; Yuan, Y.; Chen, B.; Xiang, S.; Liu, J.; Zhao, H.; Ackom, E. Distributionally Robust Optimal Dispatch in the Power System with High Penetration of Wind Power Based on Net Load Fluctuation Data. Appl. Energy 2022, 313, 118813. [Google Scholar] [CrossRef]
- Hu, W.; Wang, T.; Chu, F. Novel Ramanujan Digital Twin for Motor Periodic Fault Monitoring and Detection. IEEE Trans. Ind. Inform. 2023, 19, 11564–11572. [Google Scholar] [CrossRef]
- Song, J.; Mingotti, A.; Zhang, J.; Peretto, L.; Wen, H. Accurate Damping Factor and Frequency Estimation for Damped Real-Valued Sinusoidal Signals. IEEE Trans. Instrum. Meas. 2022, 71, 1–4. [Google Scholar] [CrossRef]
- Kong, J.; Skjelbred, H.I.; Fosso, O.B. An Overview on Formulations and Optimization Methods for the Unit-Based Short-Term Hydro Scheduling Problem. Electr. Power Syst. Res. 2020, 178, 106027. [Google Scholar] [CrossRef]
- Hongbin, S.; Bi, Z. An Alternating Direction Method of Multipliers for Unit Commitment Optimization Based on Wind Power Accommodation. In Proceedings of the 2021 IEEE 2nd International Conference on Big Data, Artificial Intelligence and Internet of Things Engineering (ICBAIE), Nanchang, China, 26–28 March 2021; pp. 952–955. [Google Scholar]
- Xu, B.; Oudalov, A.; Ulbig, A.; Andersson, G.; Kirschen, D.S. Modeling of Lithium-Ion Battery Degradation for Cell Life Assessment. IEEE Trans. Smart Grid 2018, 9, 1131–1140. [Google Scholar] [CrossRef]
Figure 1.
Diagram of wind power forward peaking and daily load curves.

Figure 2.
Diagram of wind power reverse peaking and daily load curves.

Figure 3.
Diagram of wind power consumption mechanism analysis based on reverse peaking characteristics.
Figure 3.
Diagram of wind power consumption mechanism analysis based on reverse peaking characteristics.
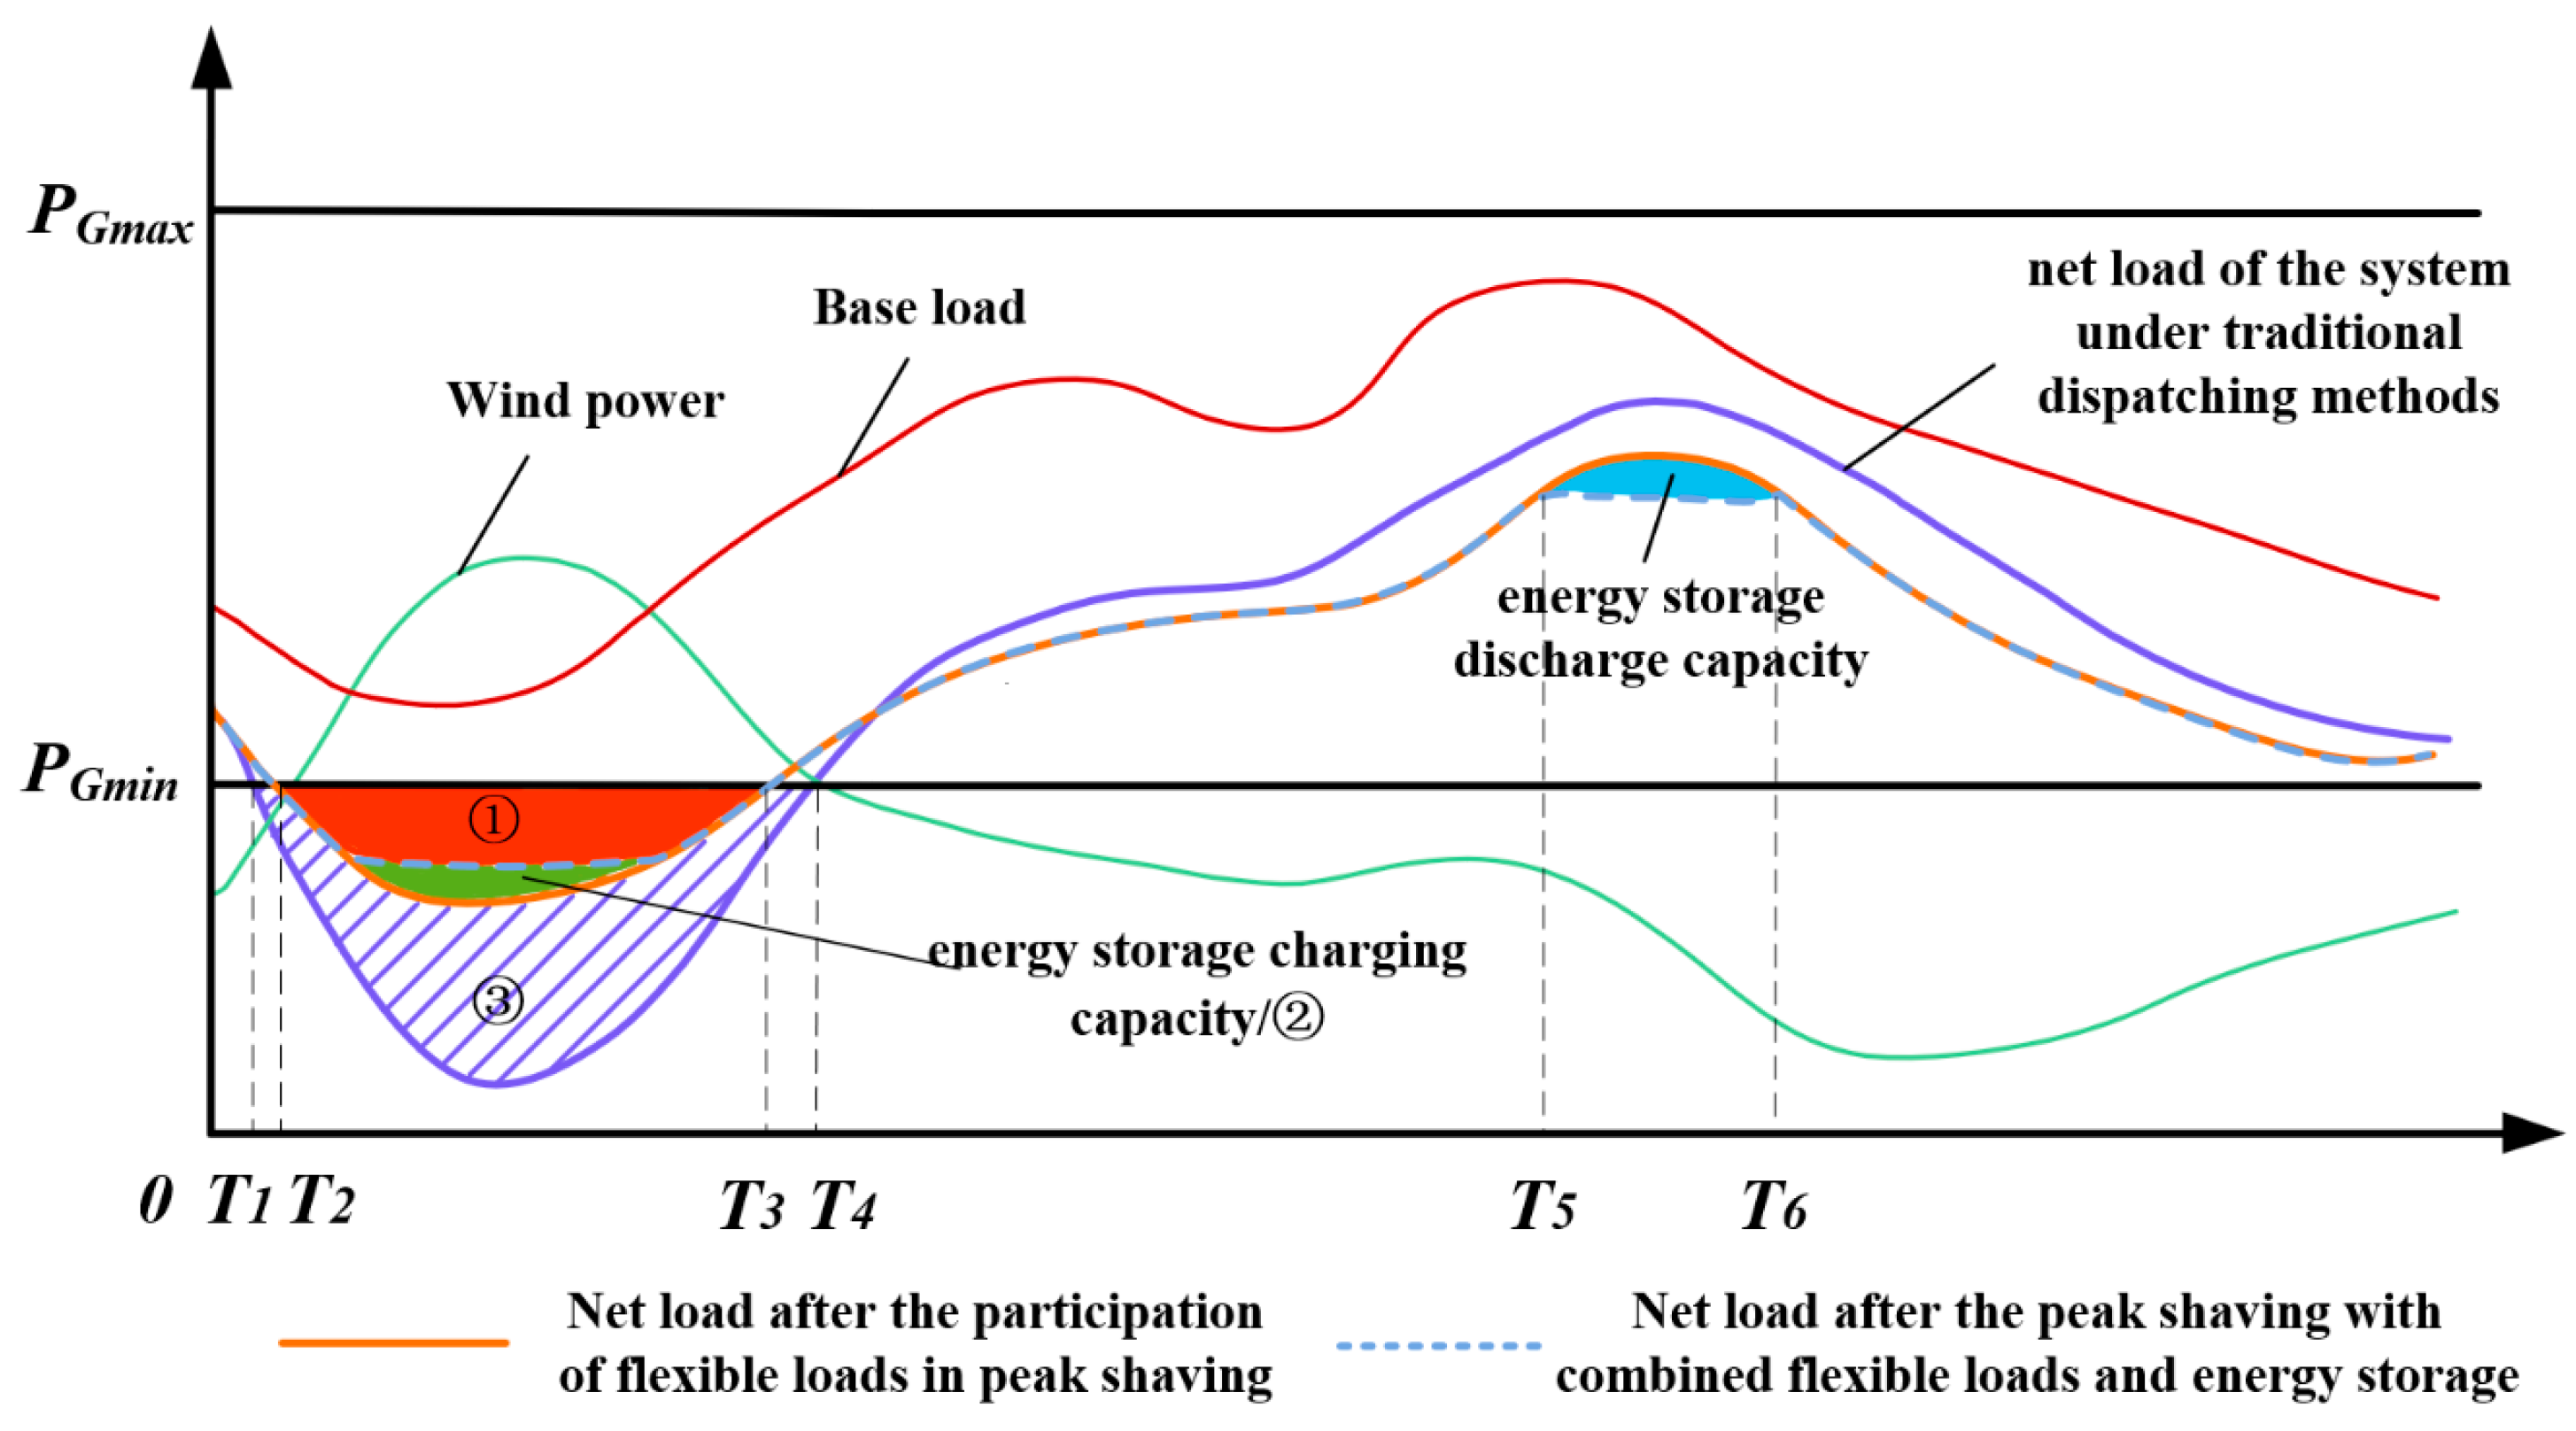
Figure 4.
Diagram of wind power consumption mechanism analysis based on forward peaking characteristics.
Figure 4.
Diagram of wind power consumption mechanism analysis based on forward peaking characteristics.
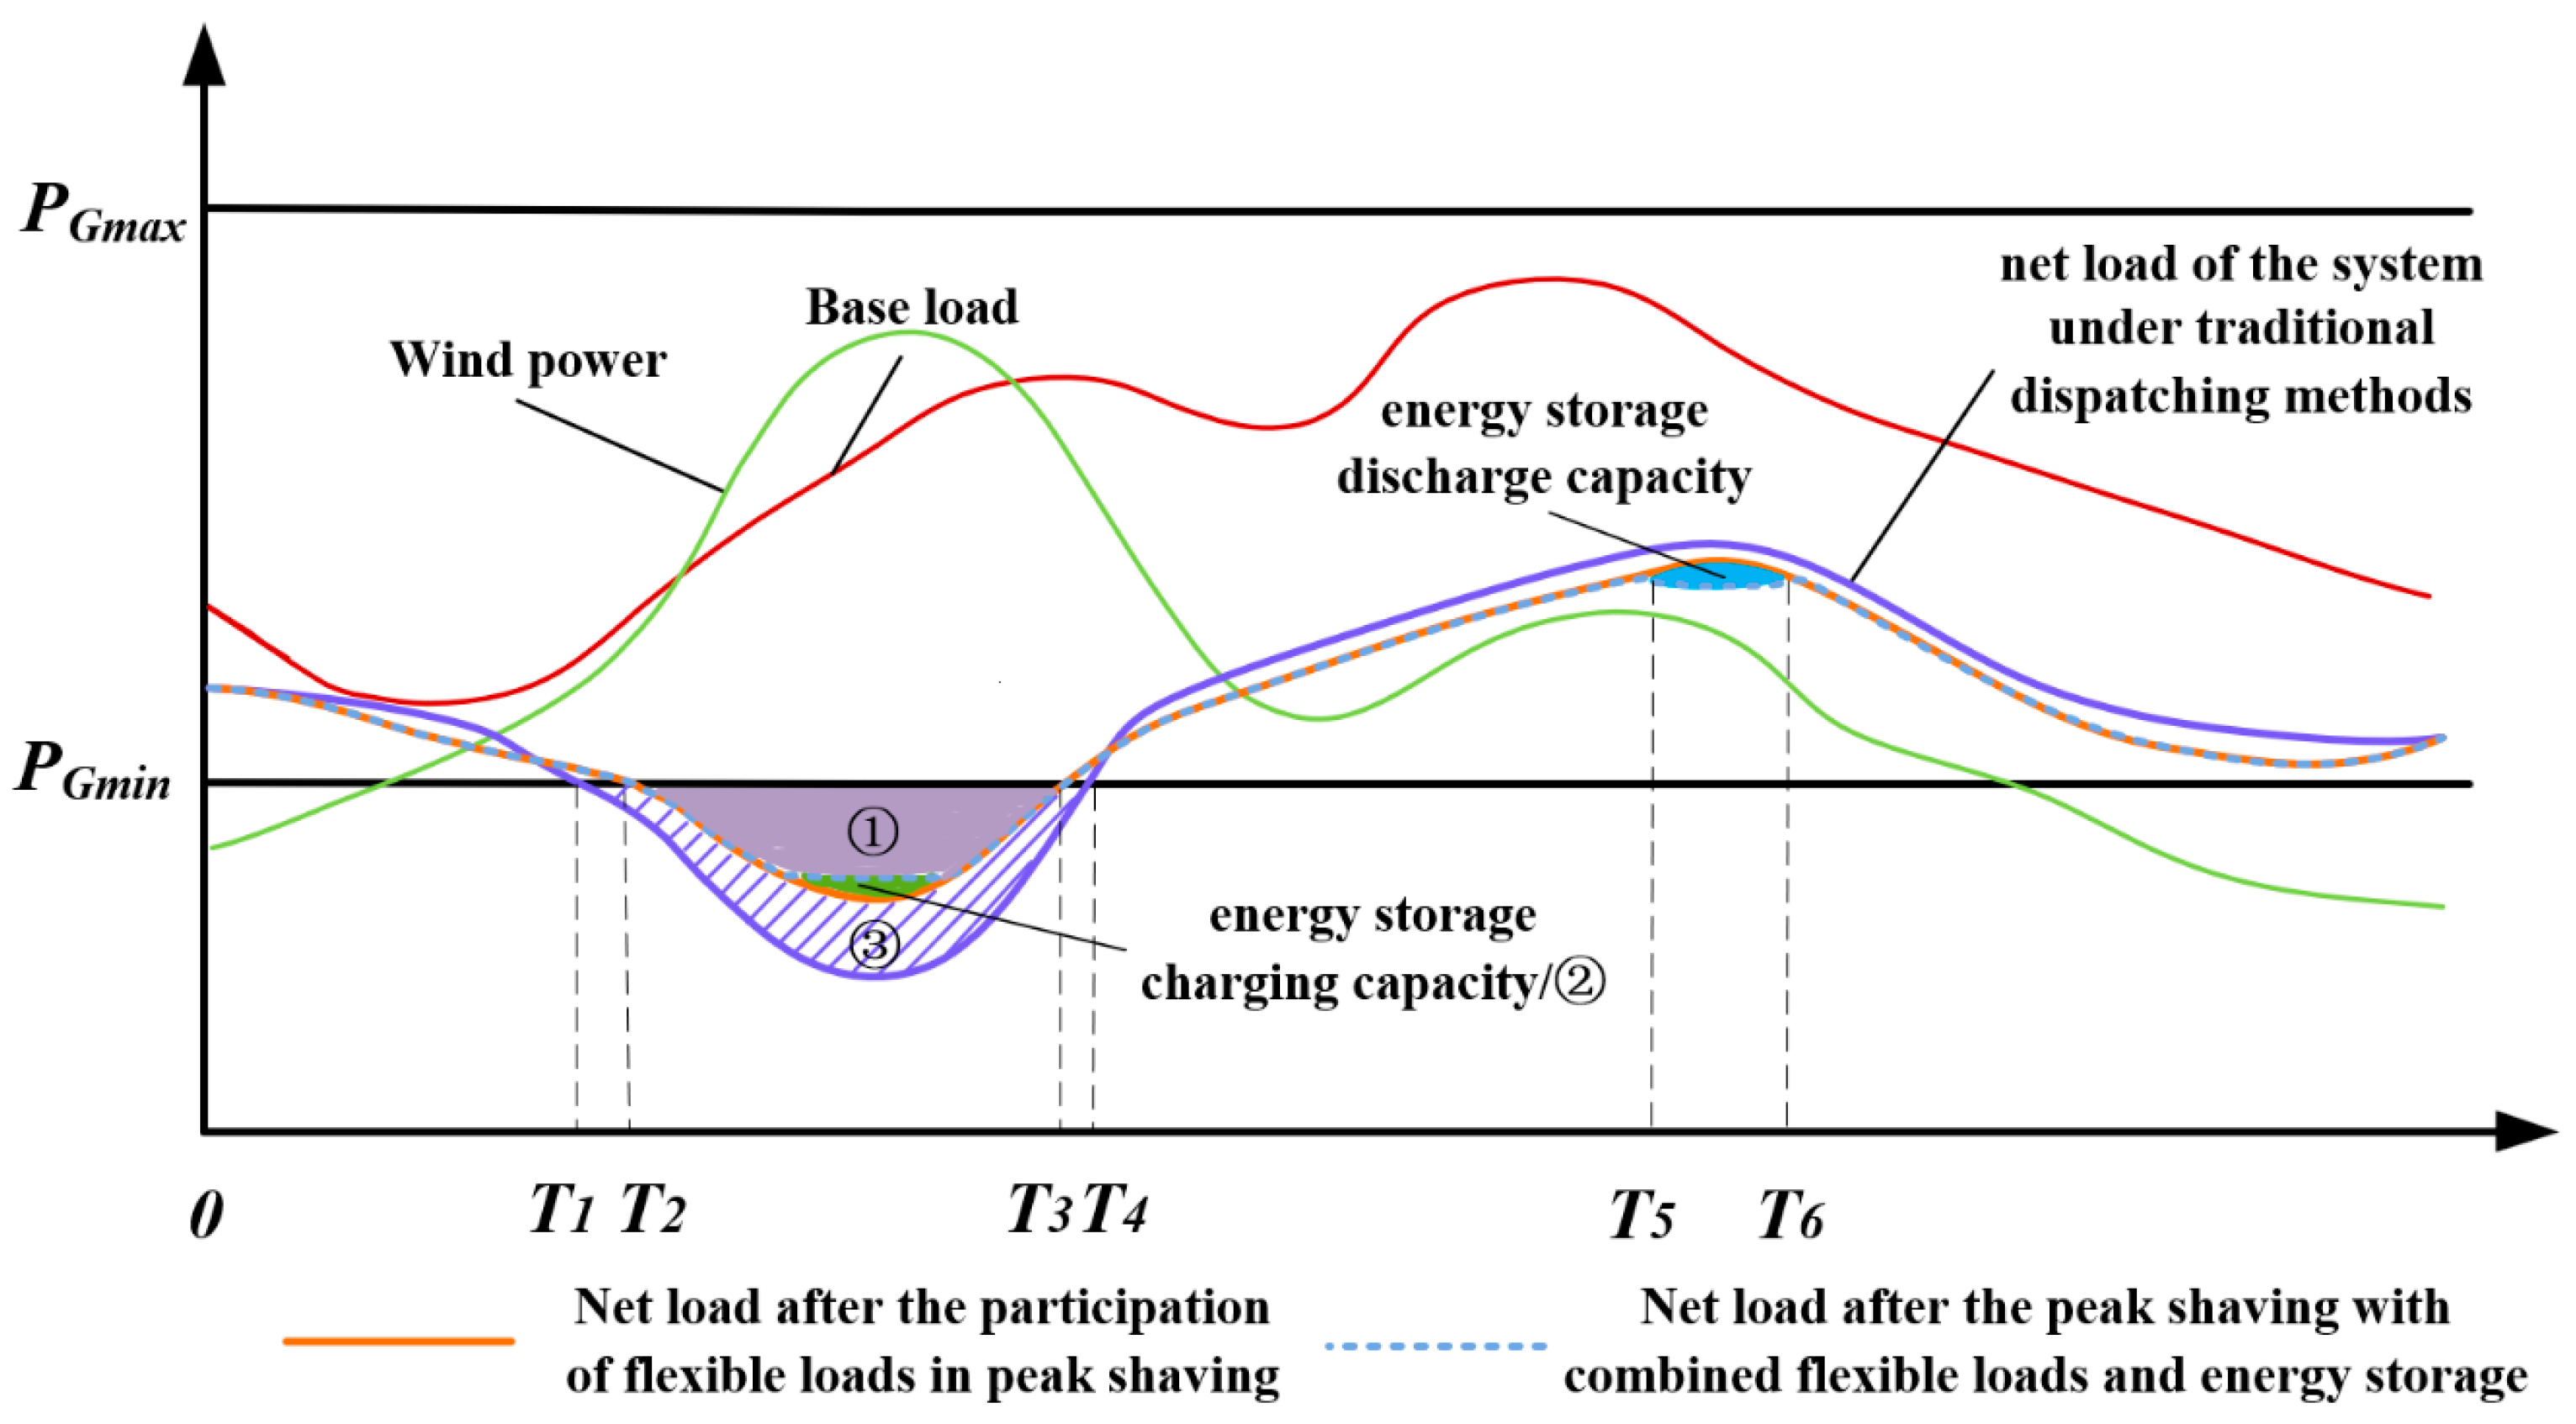
Figure 5.
Multi-timescale scheduling framework.

Figure 6.
IEEE 30-node system architecture diagram.
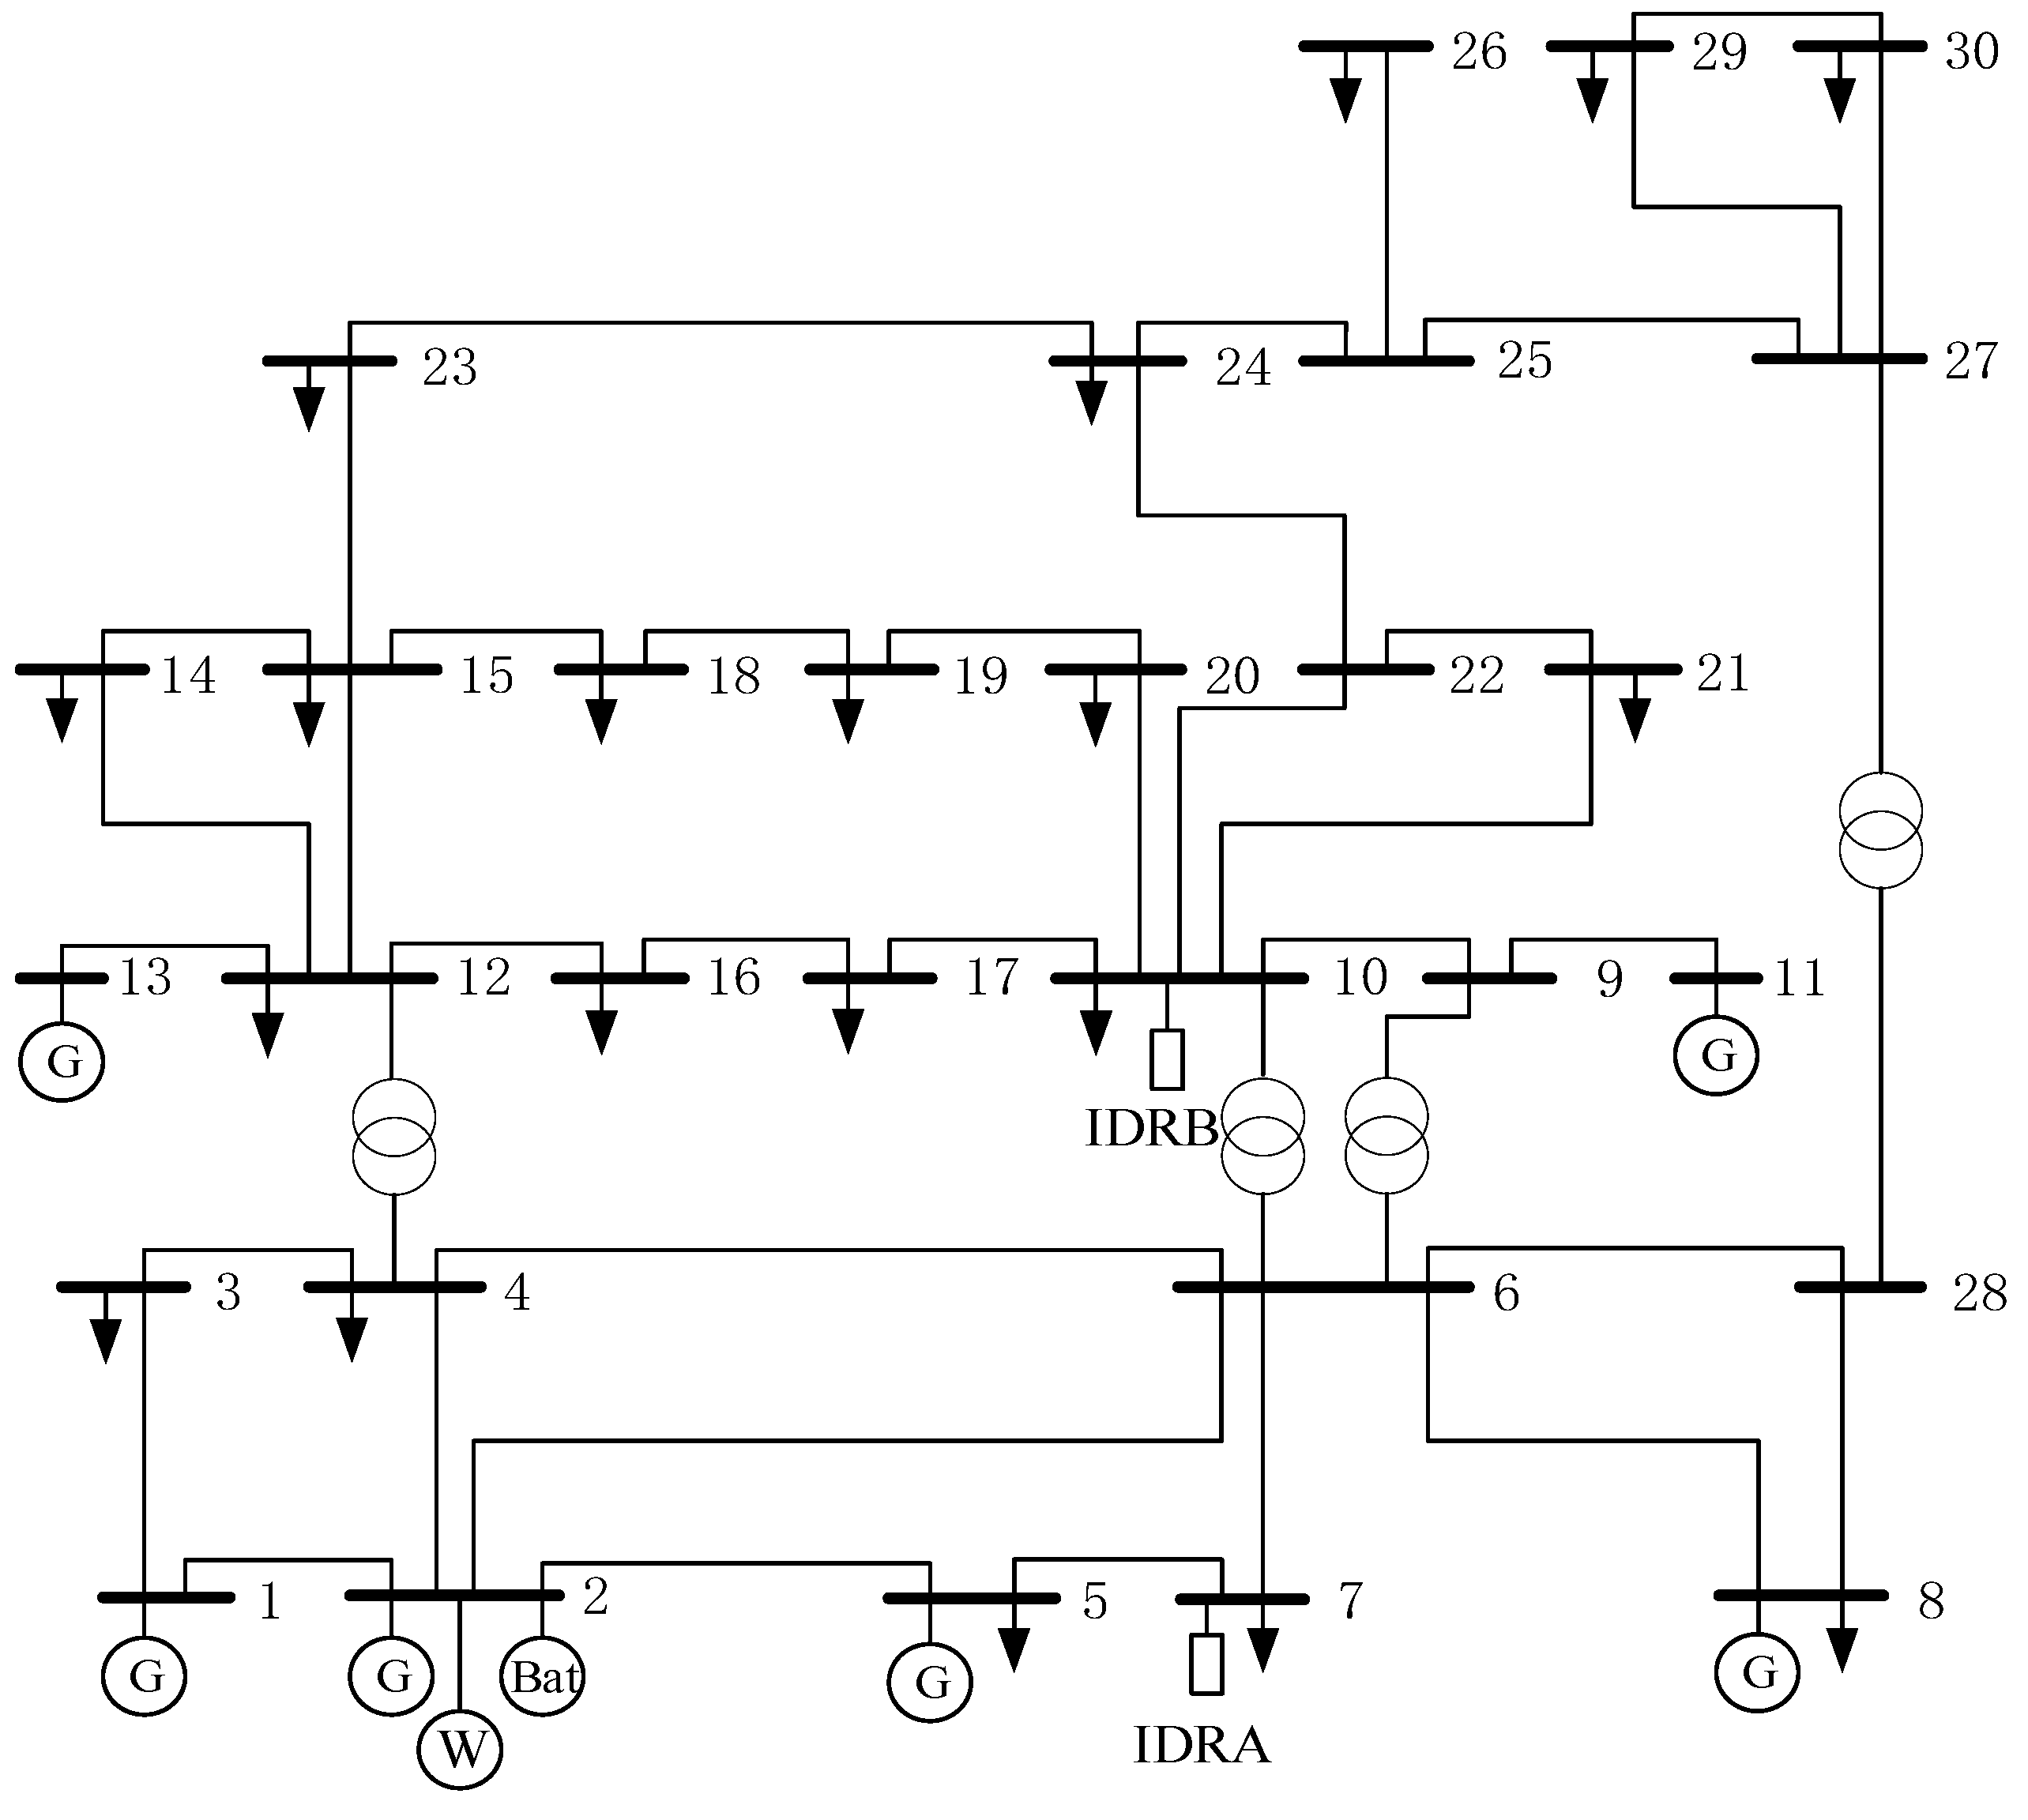
Figure 7.
Load day-ahead and intra-day forecast graphs.
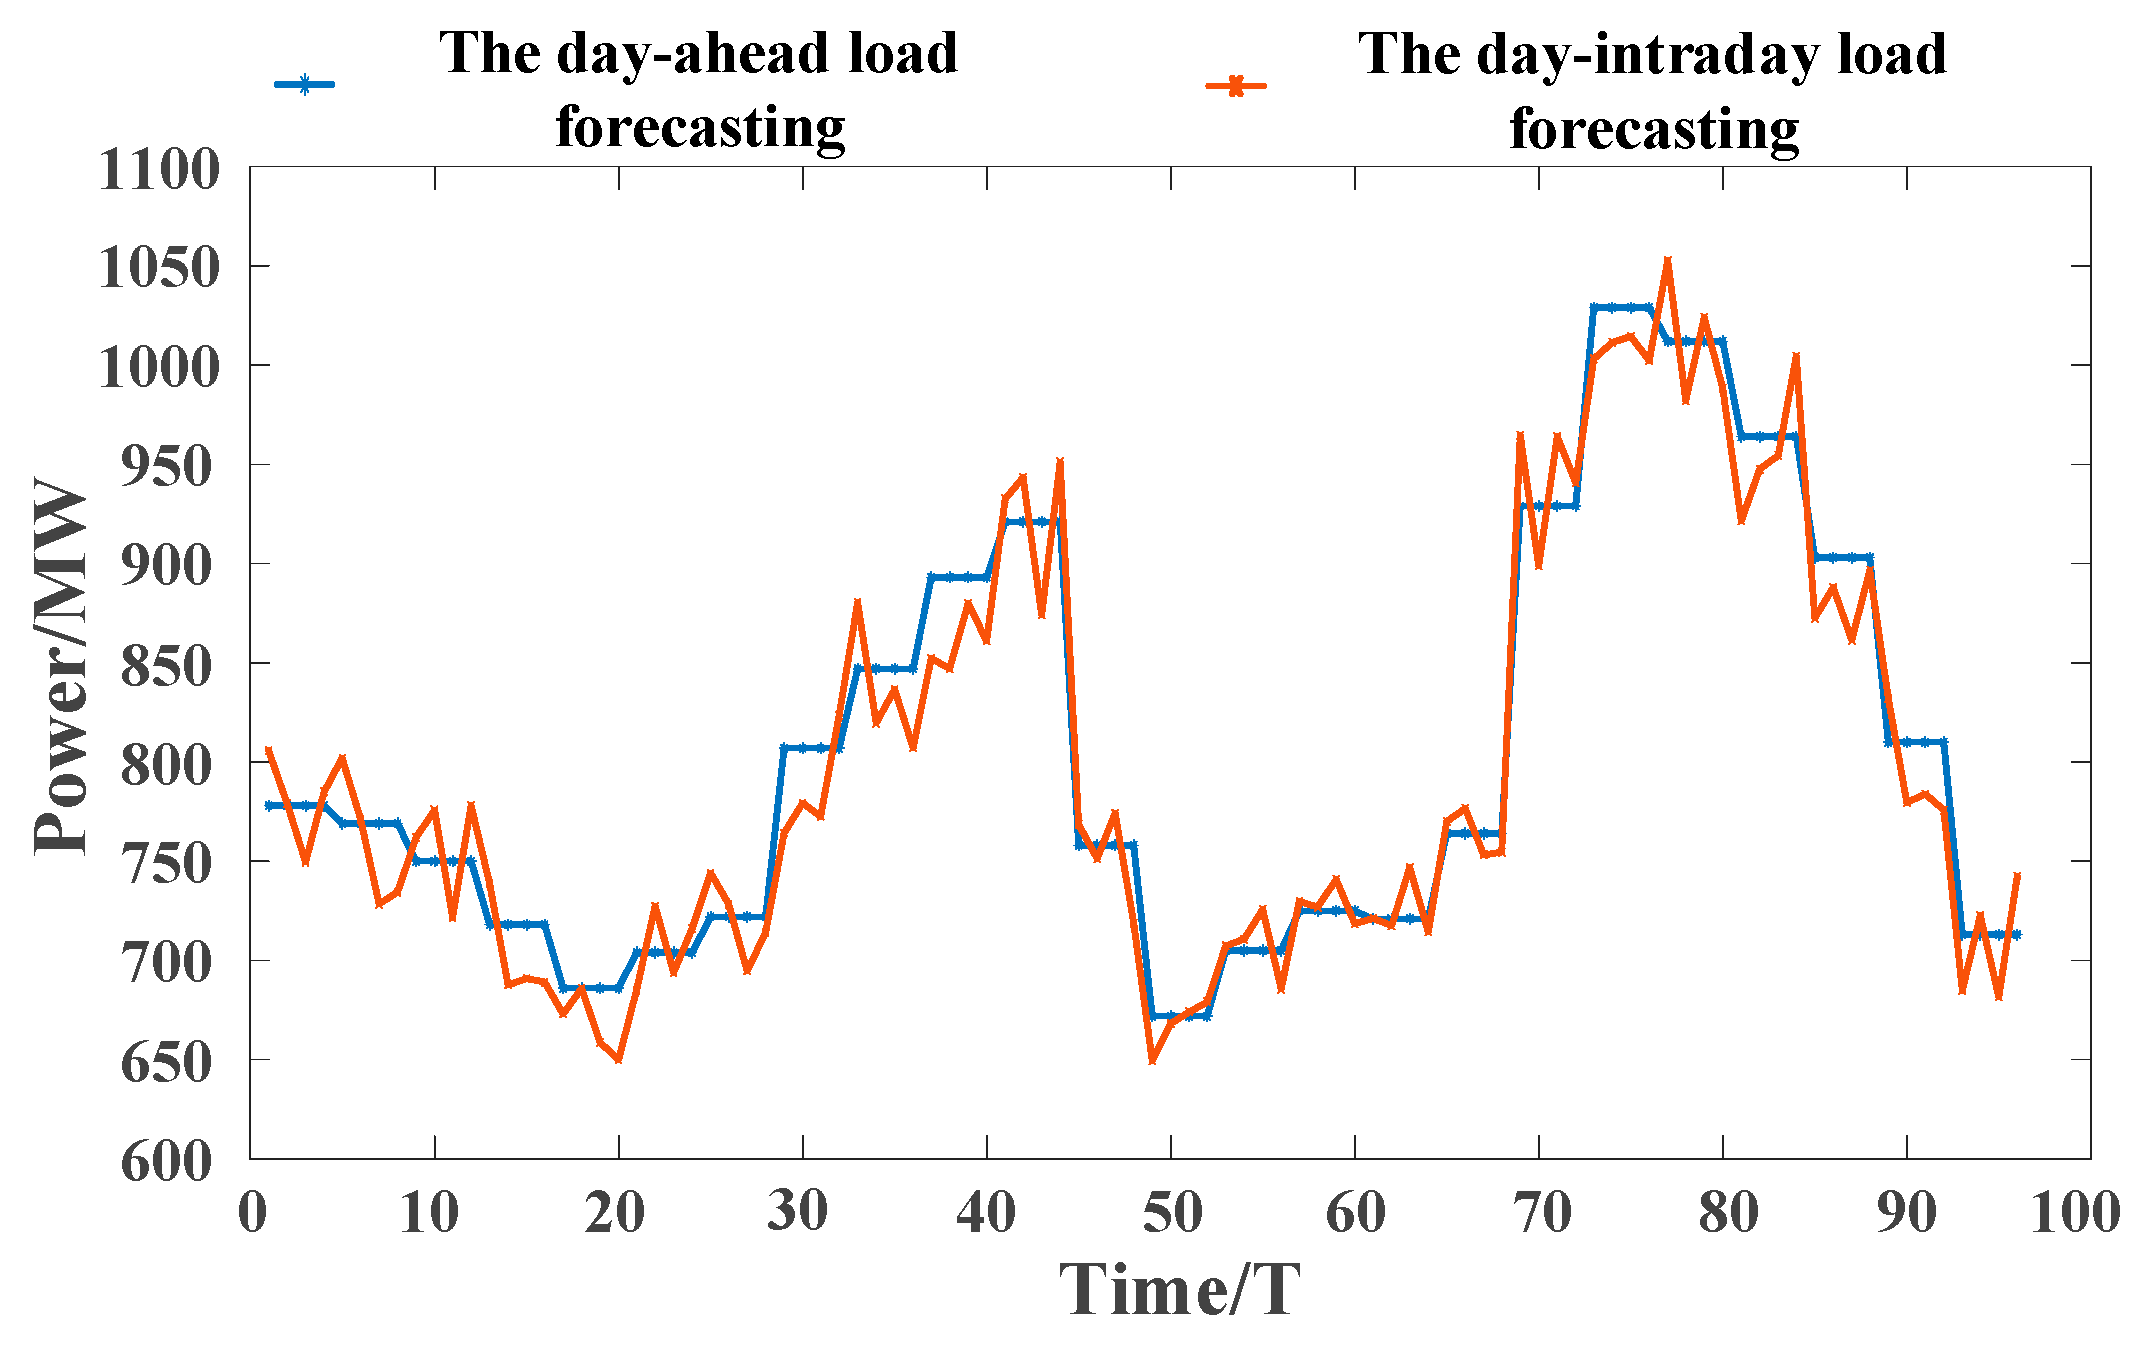
Figure 8.
Day-ahead and intra-day forecast curves for wind power forward peaking.
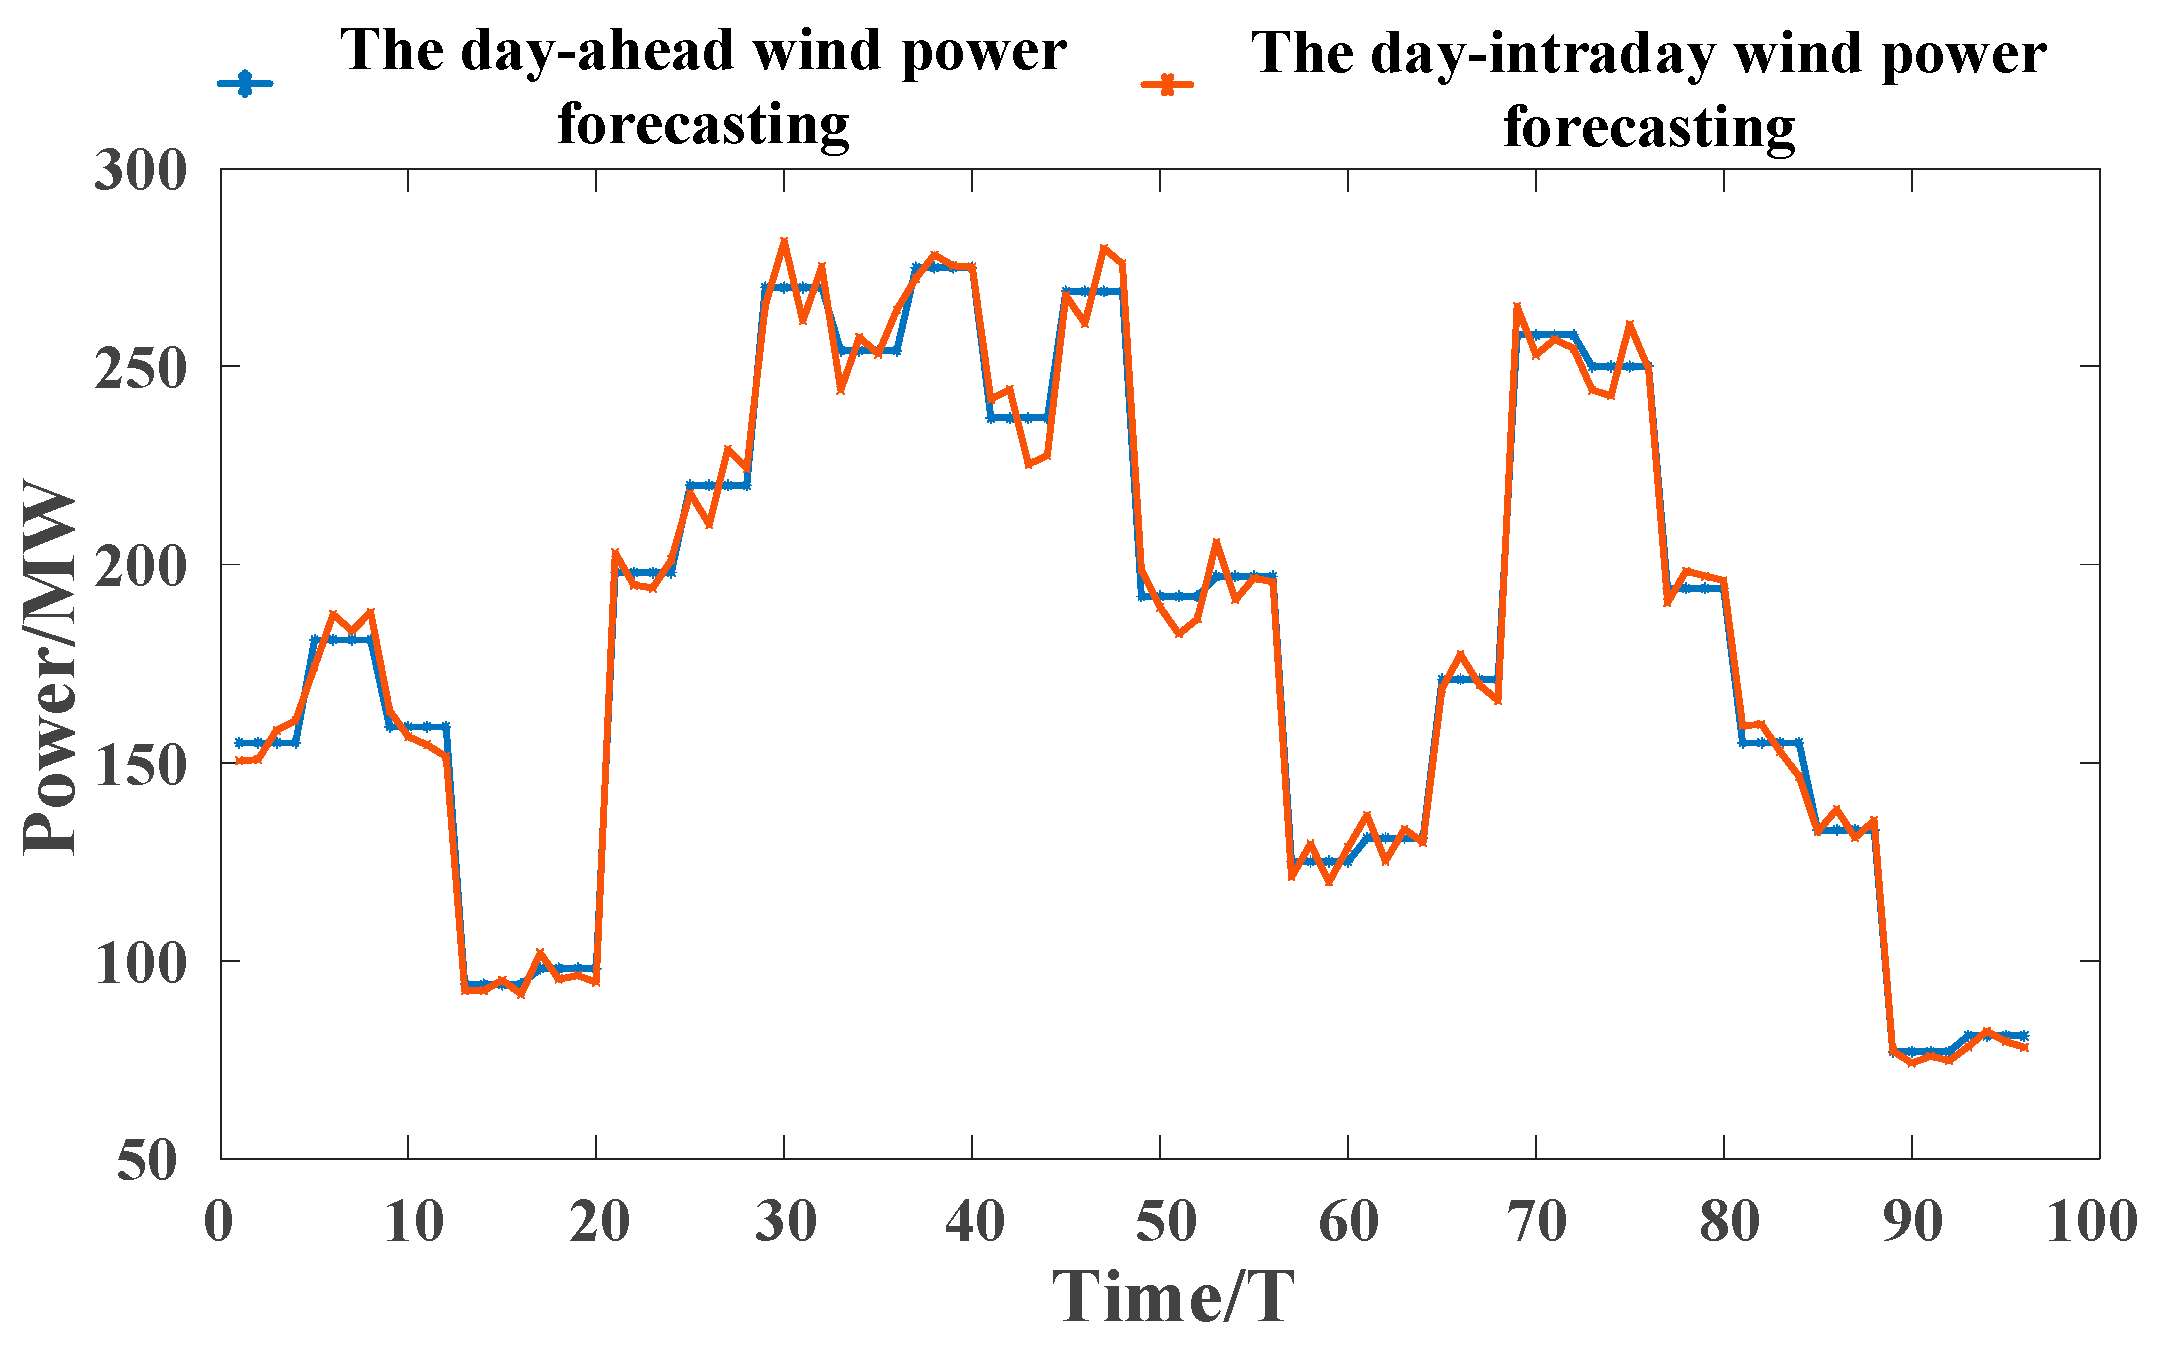
Figure 9.
Day-ahead and intra-day forecast curves for wind power reverse peaking.
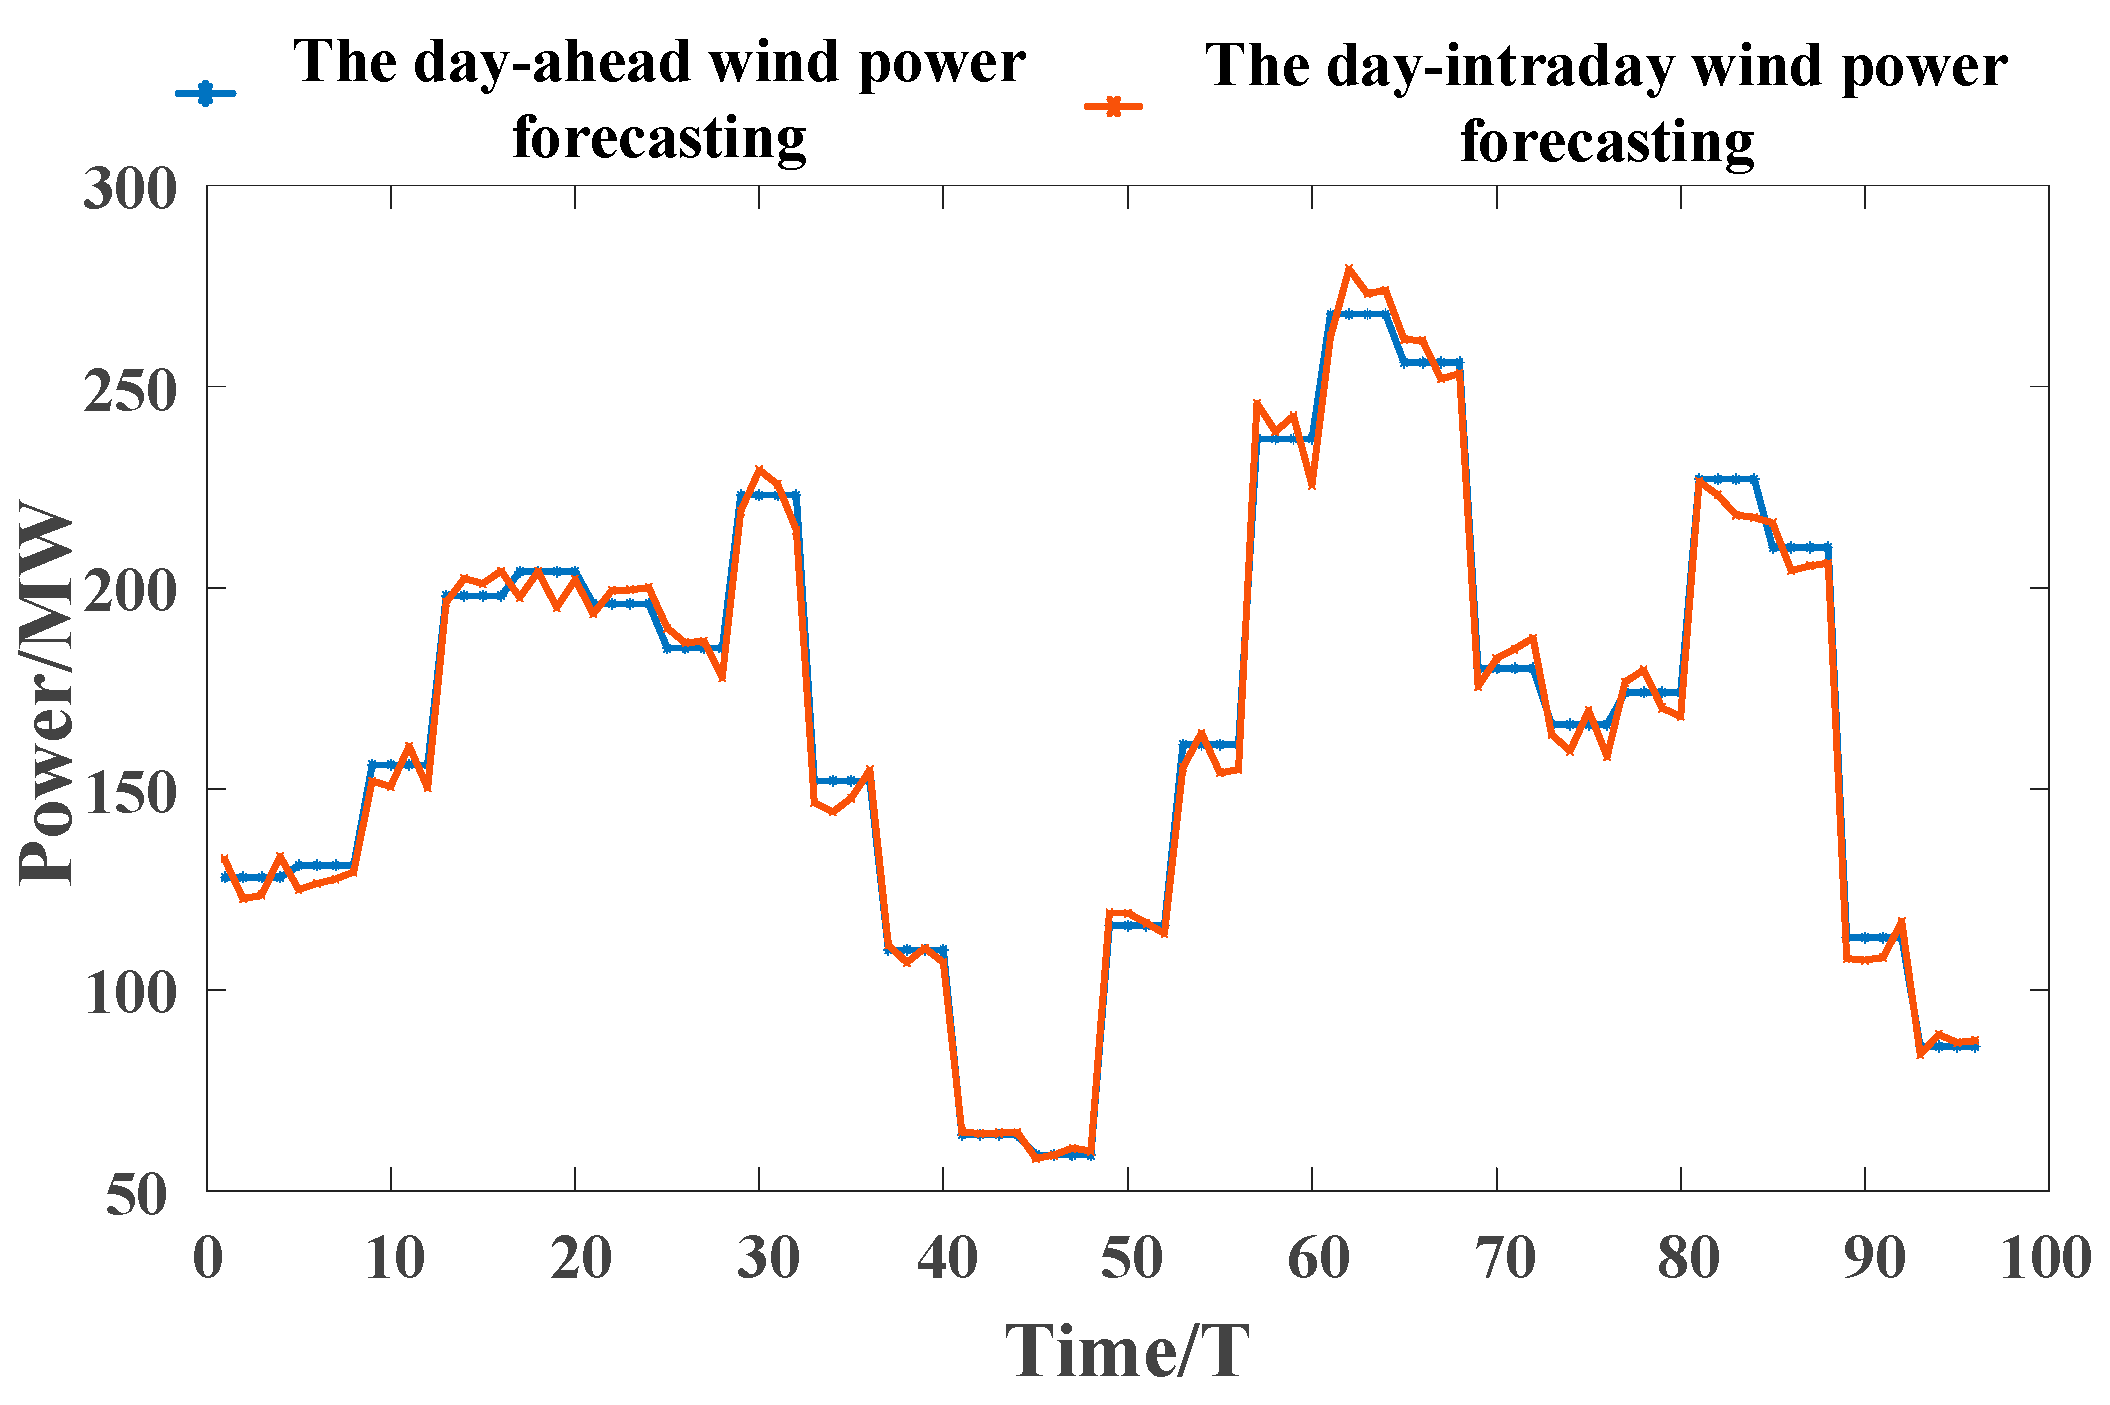
Figure 10.
Graph of wind power forward peaking shaving dispatch results.
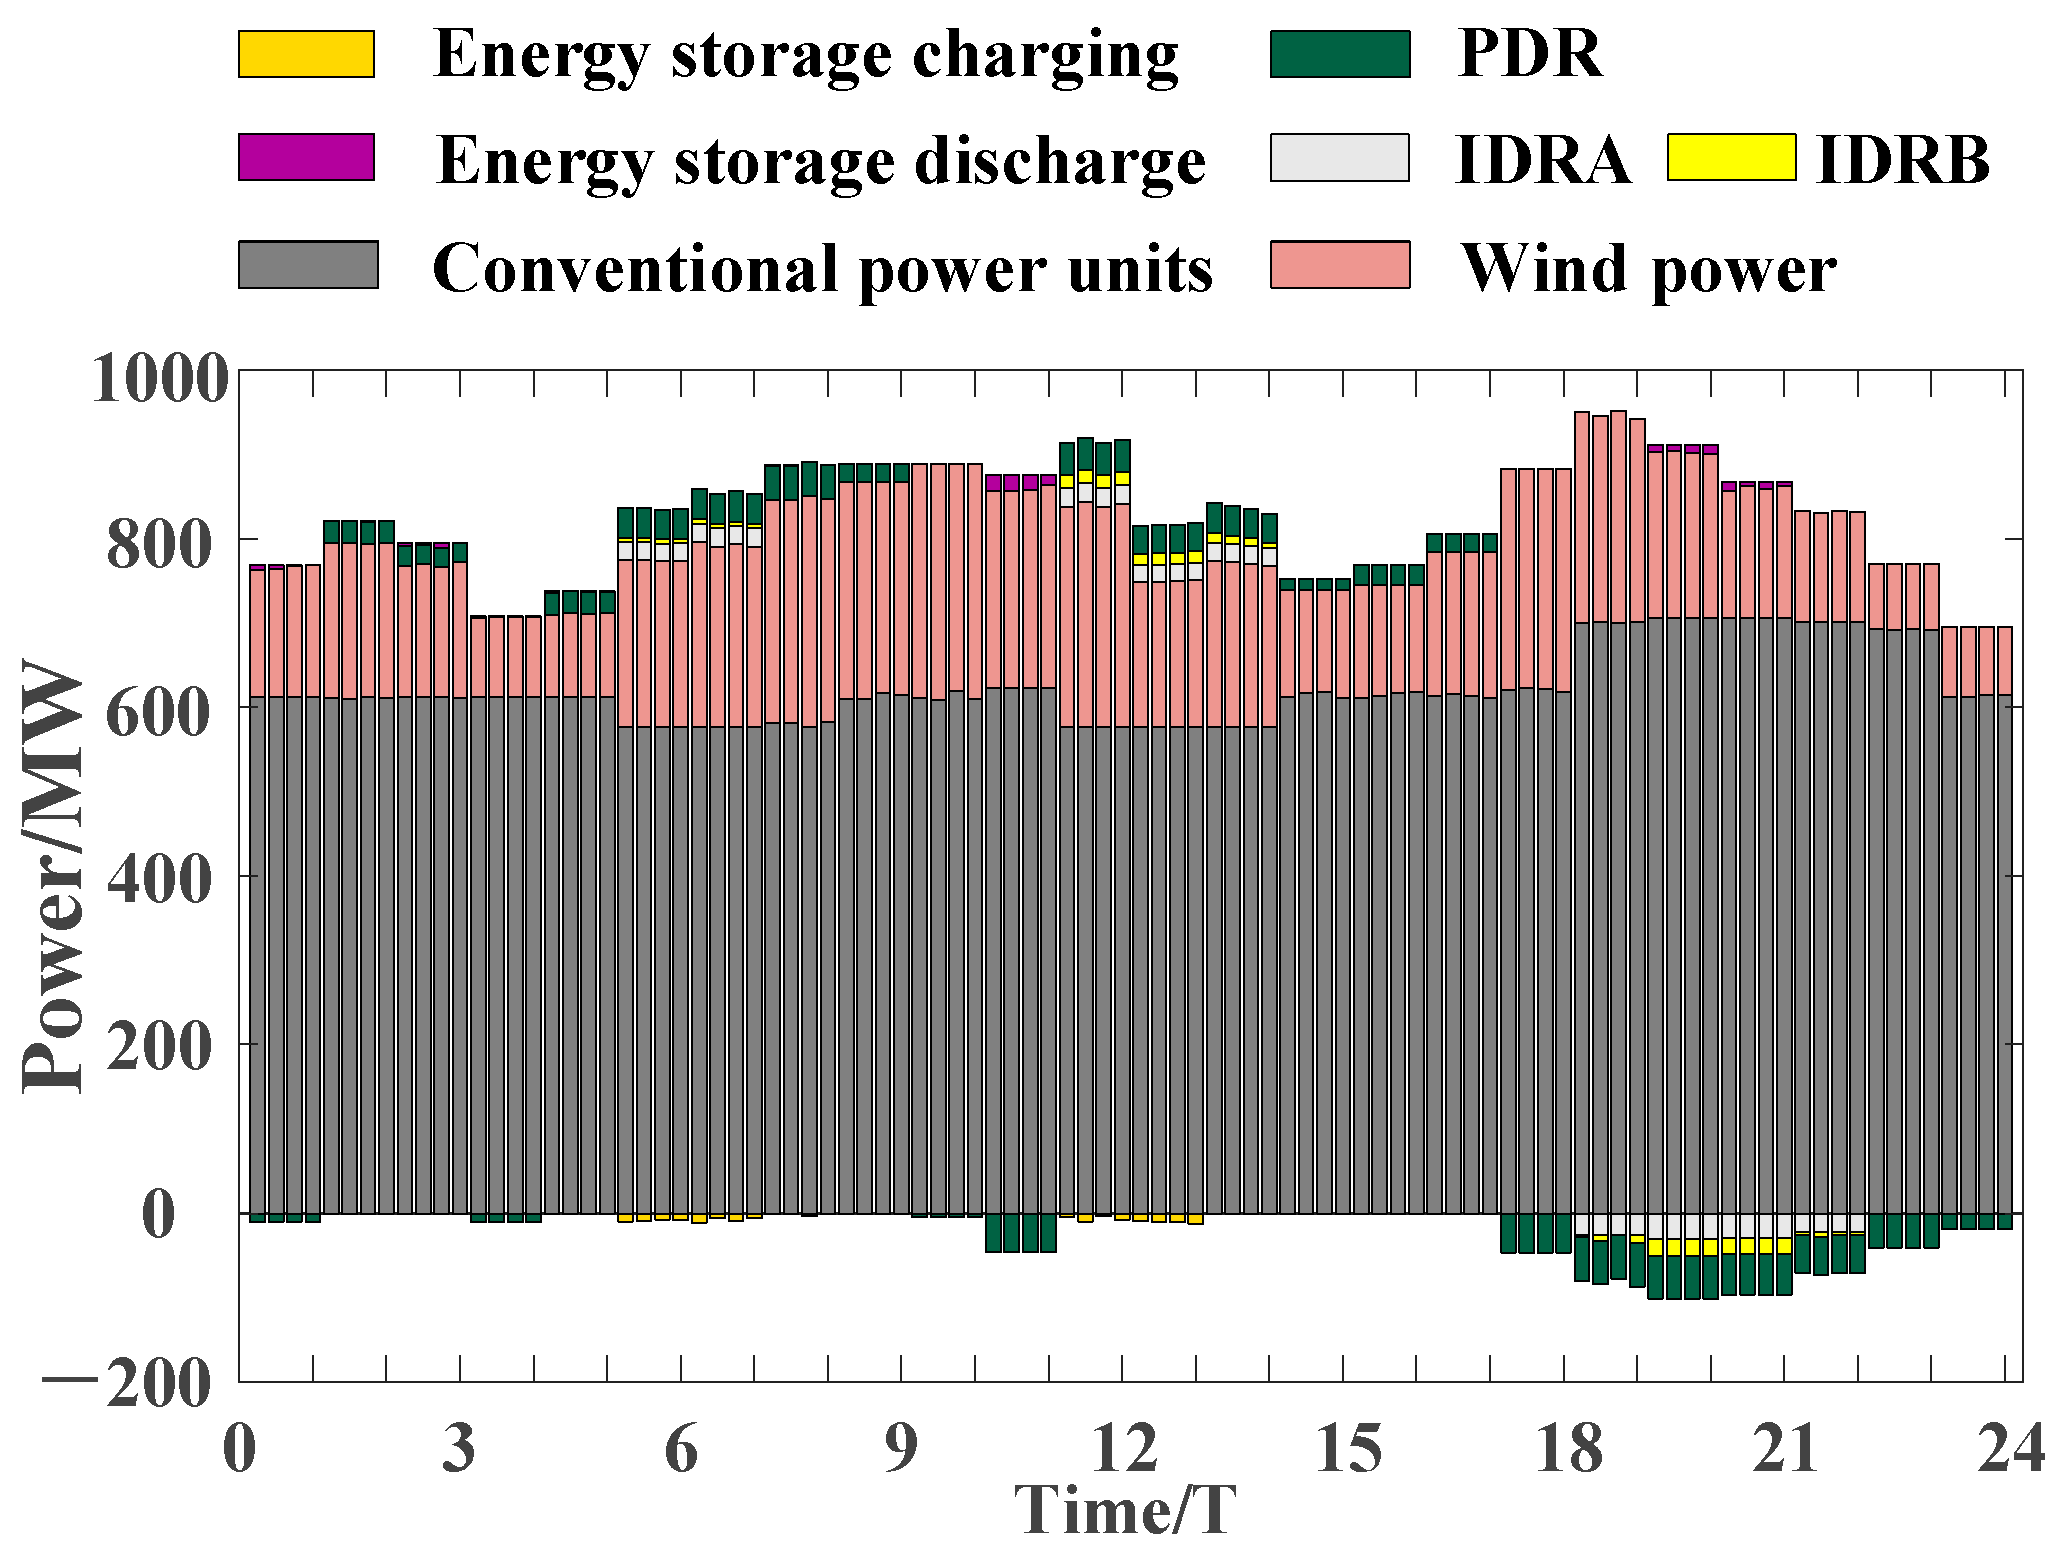
Figure 11.
Graph of wind power reverse peaking dispatch results.
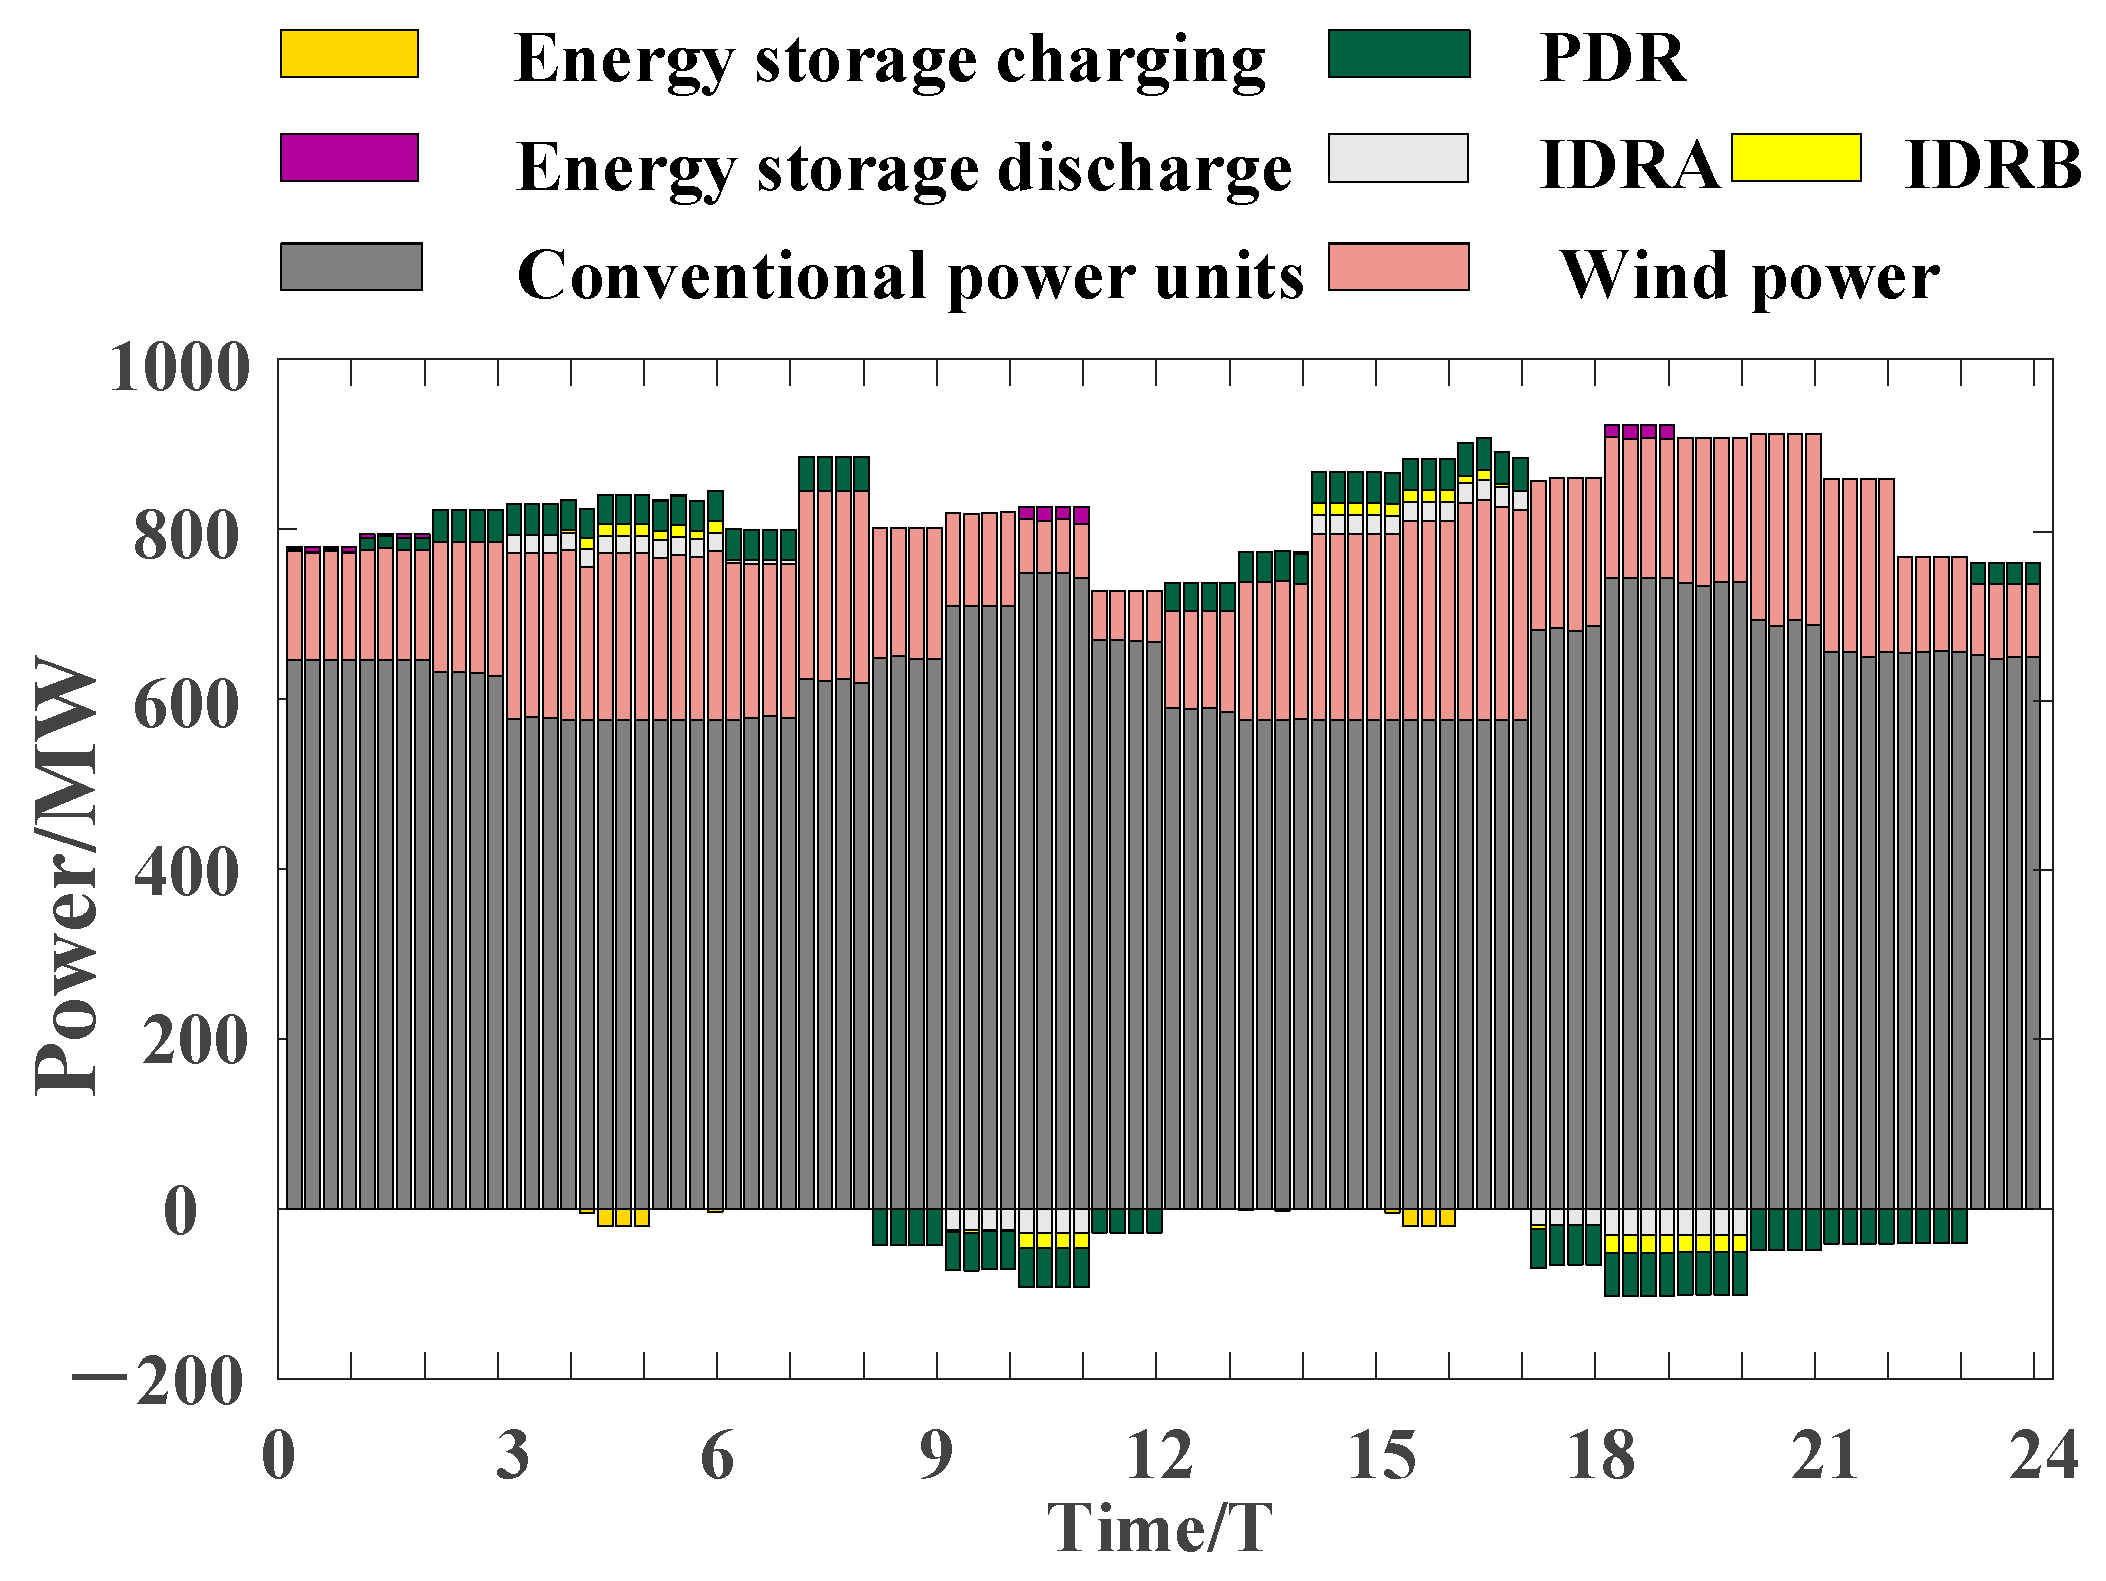
Figure 12.
Graph of wind power forward peaking shaving demand response resource utilization.
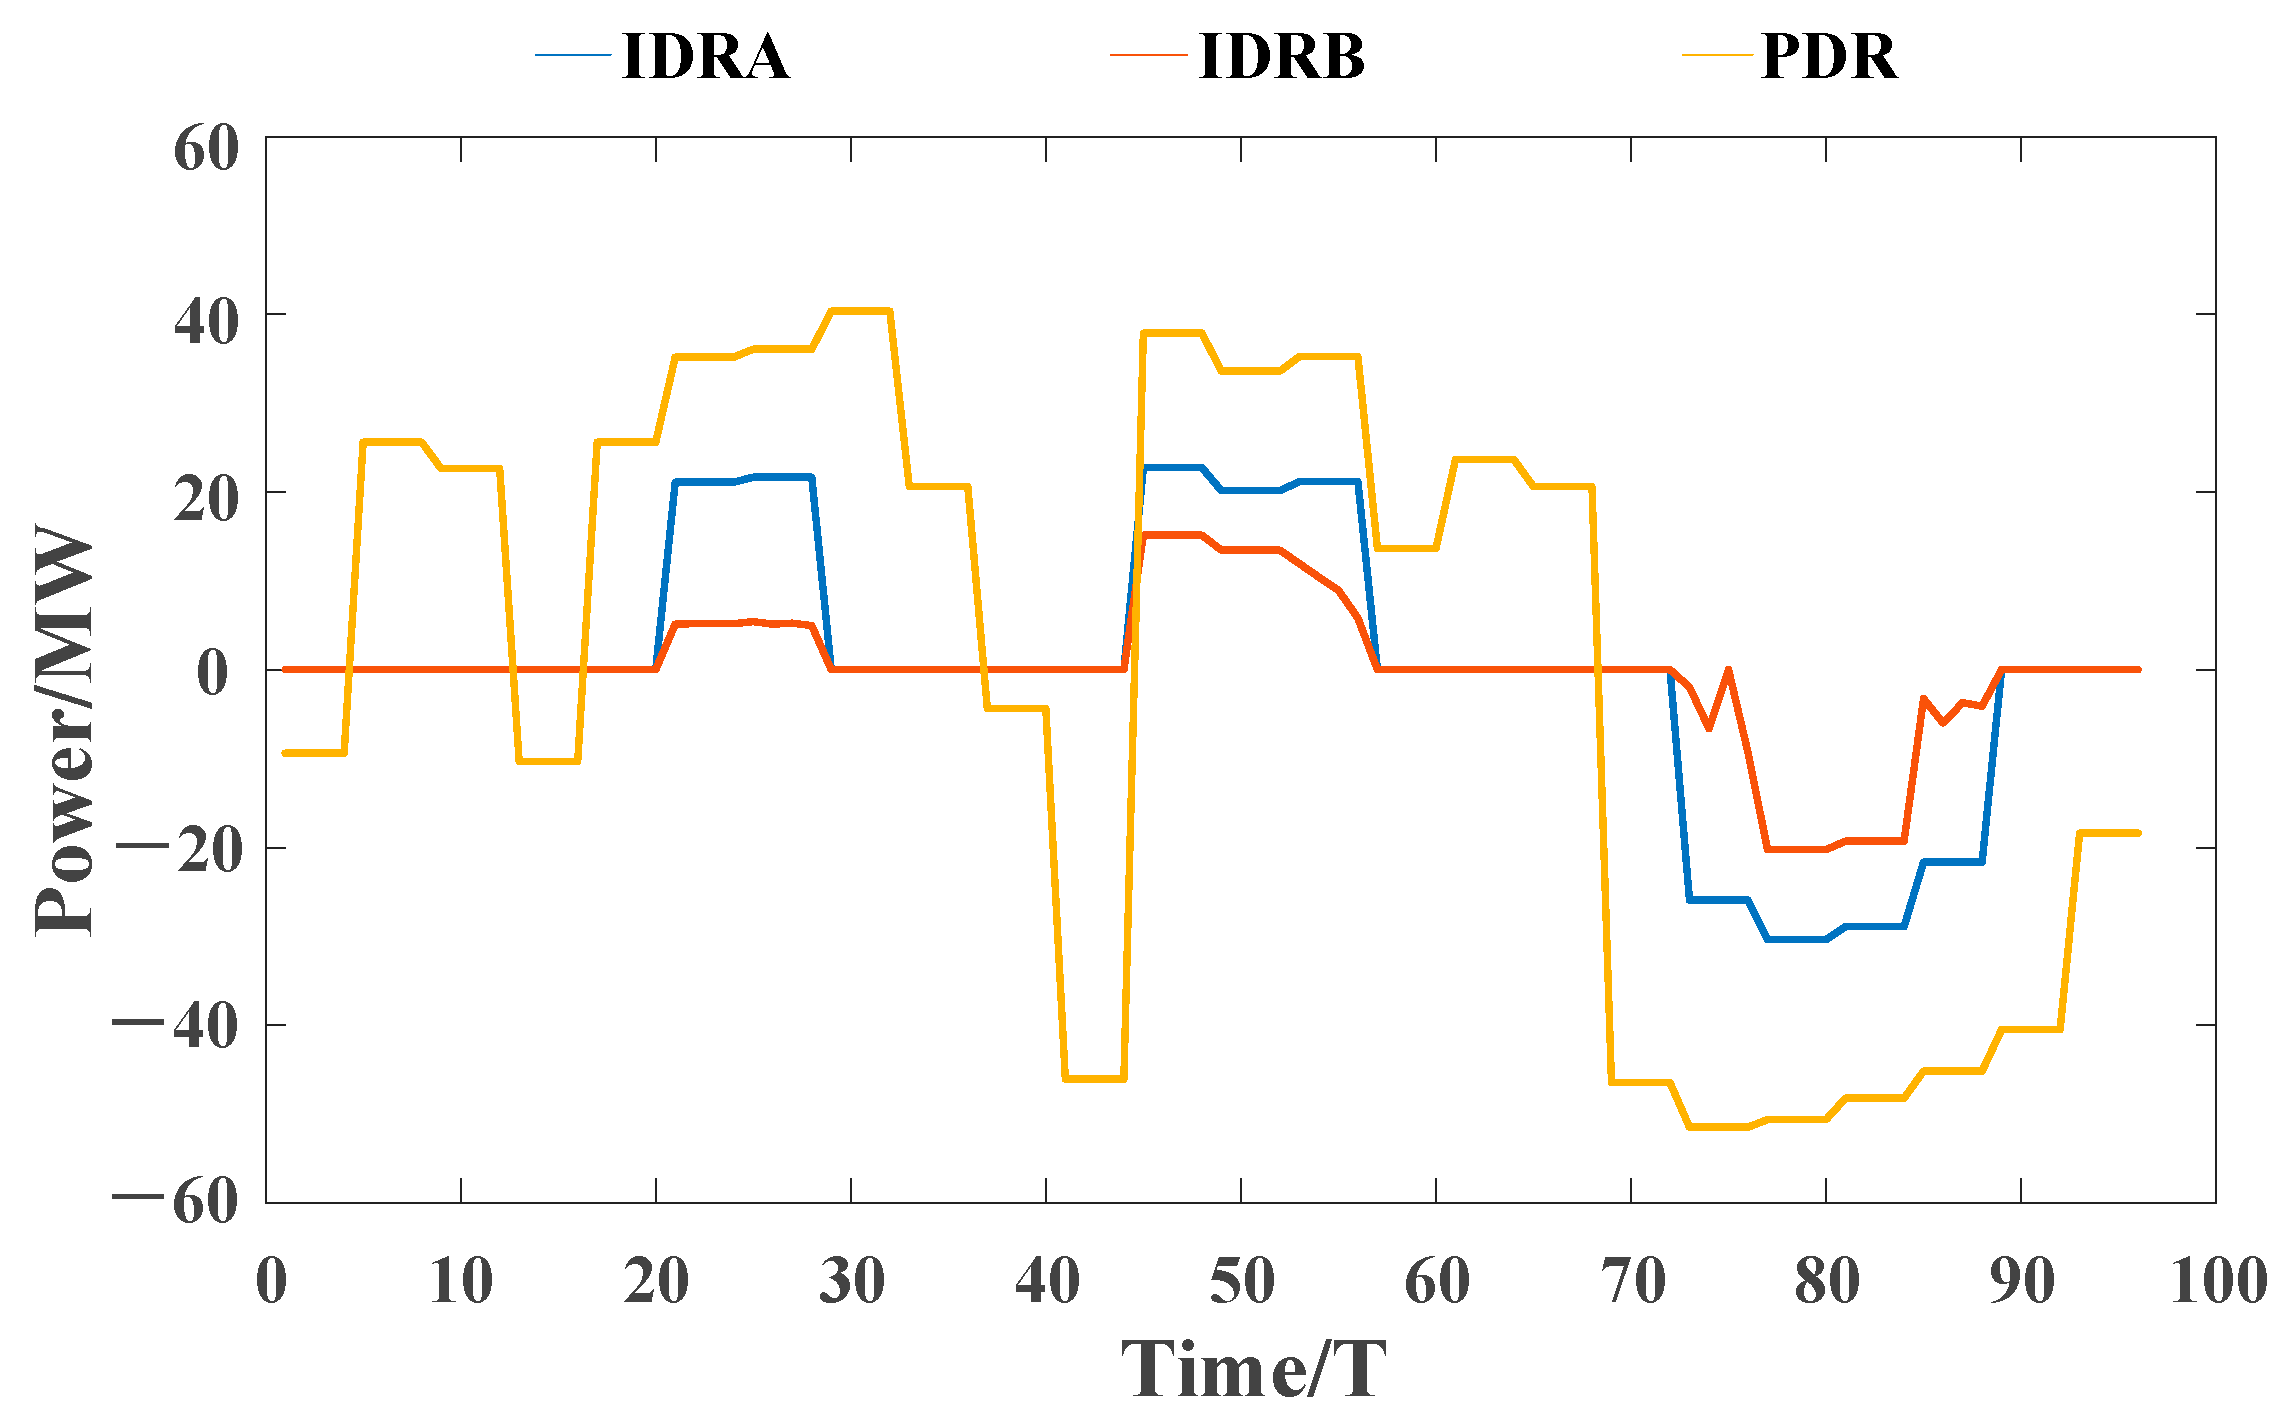
Figure 13.
Graph of wind power reverse peaking demand response resource utilization.
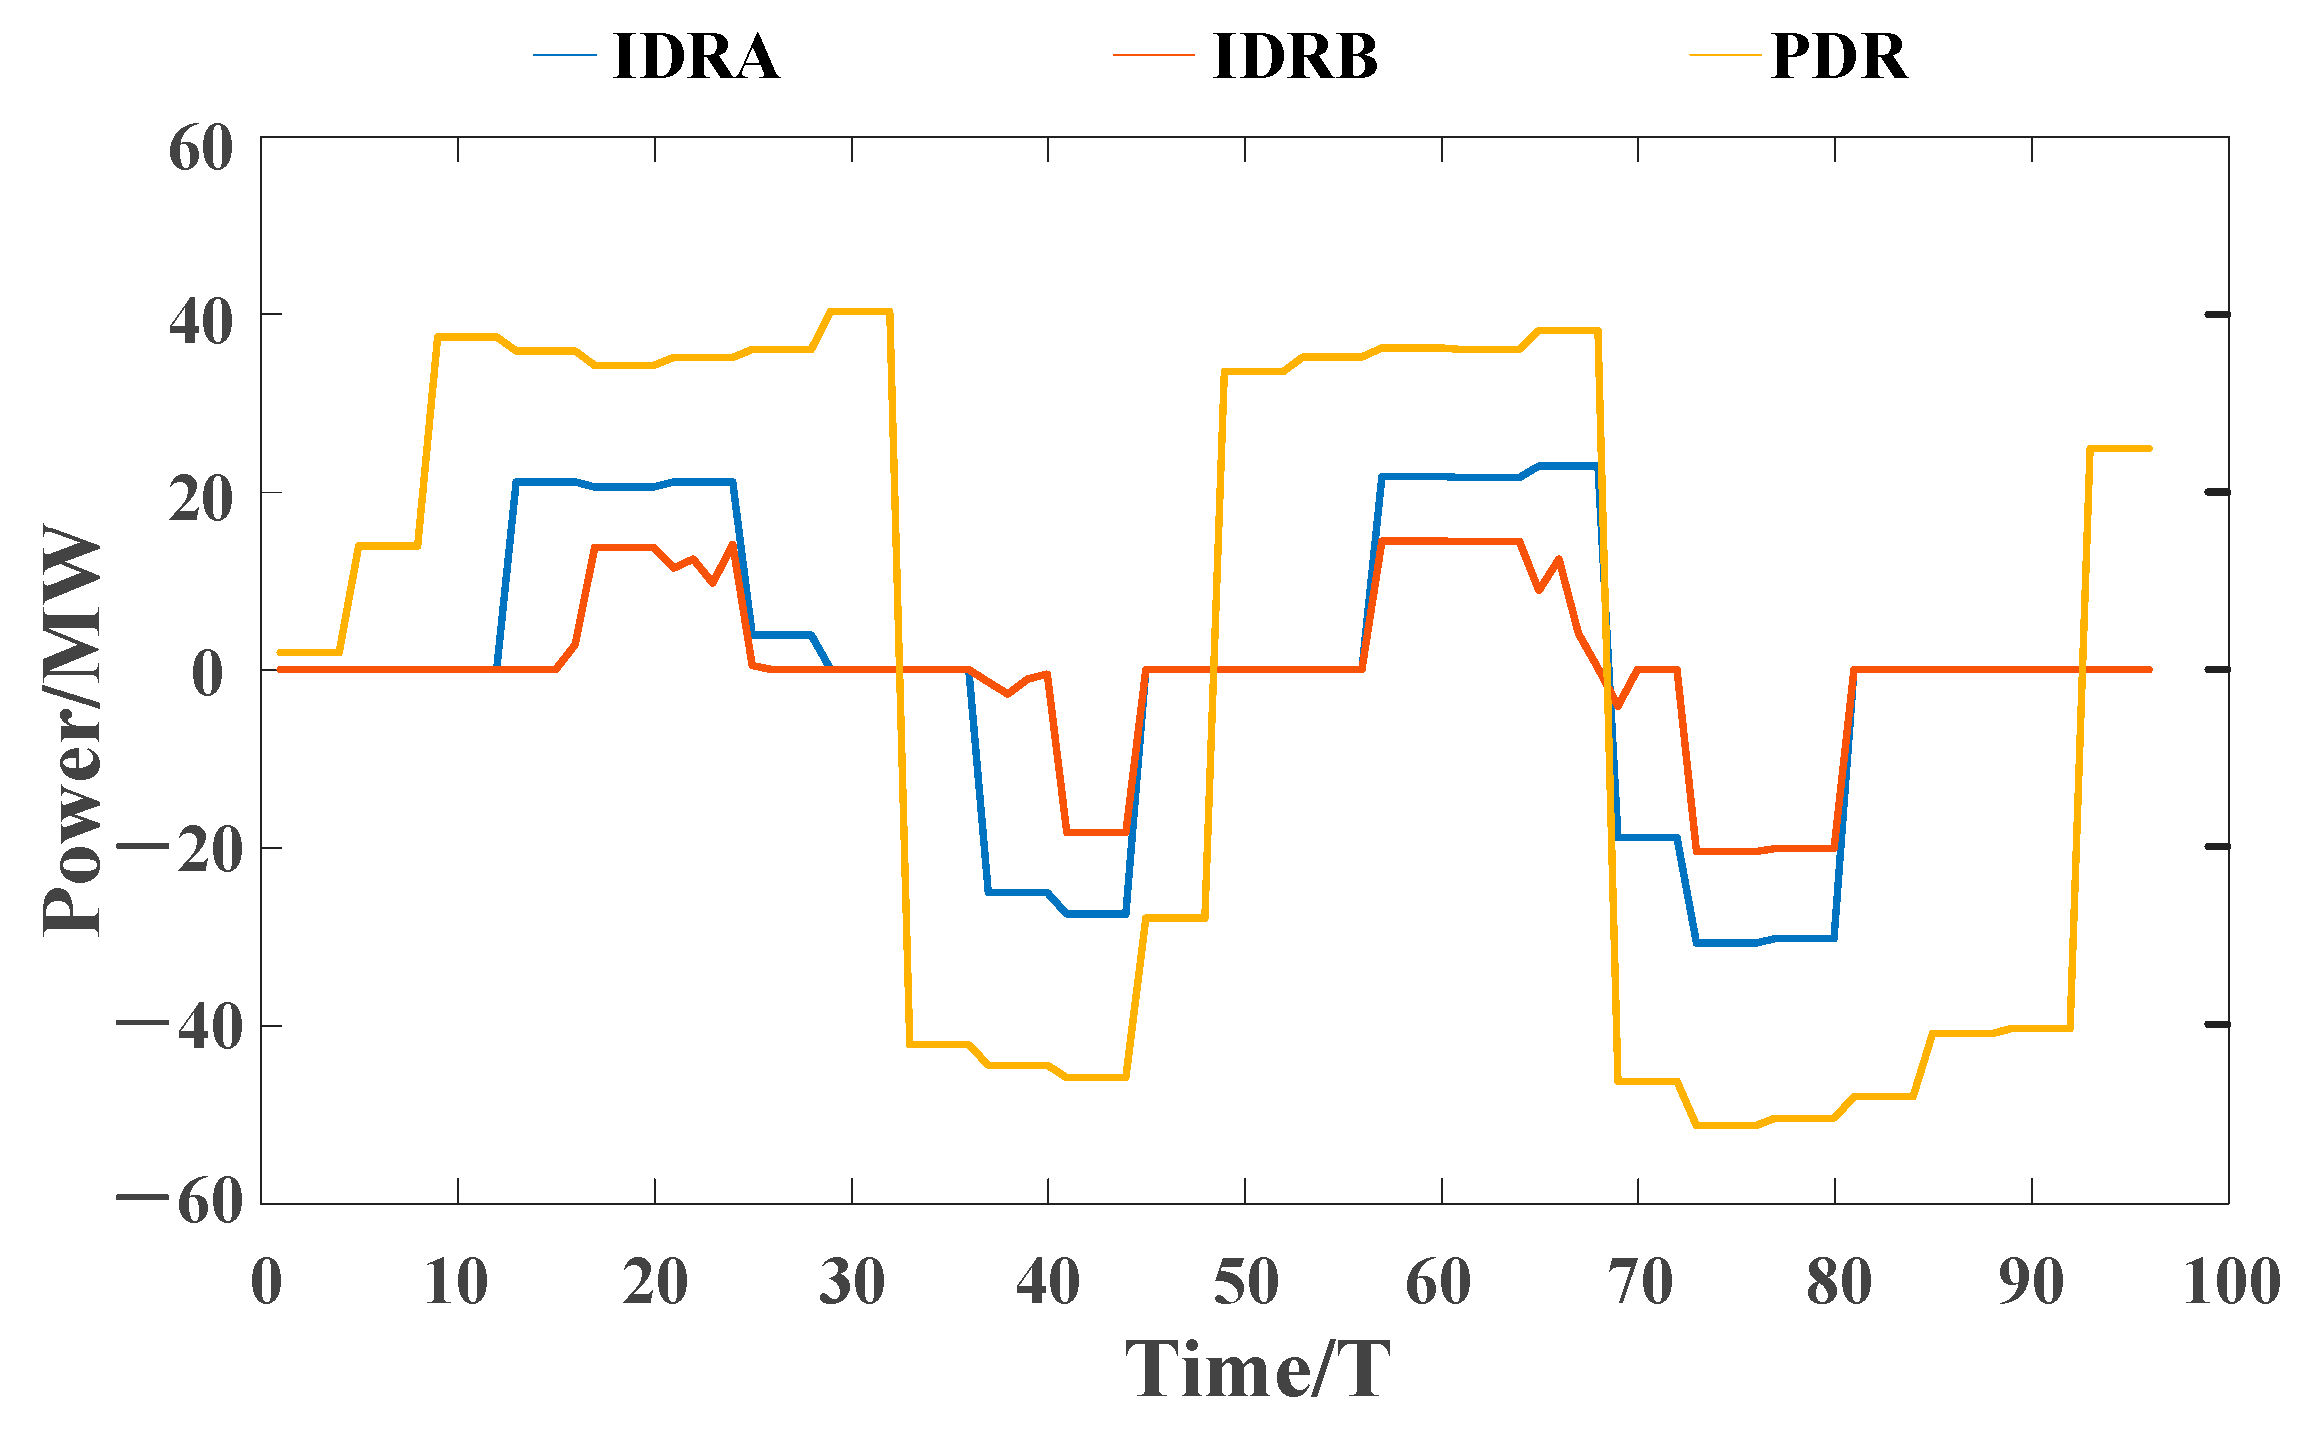
Figure 14.
Energy storage call diagram for wind power forward and reverse peaking scenarios.

Table 1.
Some operating parameters of thermal power units.
| Thermal Power Units | Power/MW | Price/(CNY/MW2·h) | |||
|---|---|---|---|---|---|
| Pmax | Pmin | a | b | c | |
| G1 | 405 | 259 | 0.00048 | 16.19 | 1000 |
| G2 | 165 | 94 | 0.00398 | 19.7 | 450 |
| G3 | 160 | 94 | 0.00411 | 21.5 | 316.5 |
| G4 | 182 | 68 | 0.00334 | 32.5 | 329.2 |
| G5 | 65 | 35 | 0.0025 | 30 | 276.4 |
| G6 | 60 | 27 | 0.0025 | 30 | 232.2 |
Table 2.
IDR resource categories.
| Type | Response Speed | Scheduling Timescale |
|---|---|---|
| Class A IDR | >1 h | 1 h |
| Class B IDR | 15 min~4 h | 15 min |
Table 3.
Comparison of system operating costs under different scheduling schemes.
| Scheduling Plan | Thermal Power Costs/CNY | Cost of IDR/CNY | Wind Curtailment Costs/CNY | Total Cost/CNY |
|---|---|---|---|---|
| Option 1 | 487,718 | 0 | 159,430 | 647,216 |
| Option 2 | 427,240 | 12,514 | 50,797 | 490,632 |
| Option 3 | 410,393 | 19,411 | 16,345 | 446,281 |
Disclaimer/Publisher’s Note: The statements, opinions and data contained in all publications are solely those of the individual author(s) and contributor(s) and not of MDPI and/or the editor(s). MDPI and/or the editor(s) disclaim responsibility for any injury to people or property resulting from any ideas, methods, instructions or products referred to in the content. |
© 2024 by the authors. Licensee MDPI, Basel, Switzerland. This article is an open access article distributed under the terms and conditions of the Creative Commons Attribution (CC BY) license (https://creativecommons.org/licenses/by/4.0/).
Share and Cite
MDPI and ACS Style
Yu, H.; Wang, Y.; Liu, C.; Wang, S.; Hao, C.; Xiong, J. Optimization and Scheduling Method for Power Systems Considering Wind Power Forward/Reverse Peaking Scenarios. Energies 2024, 17, 1257. https://doi.org/10.3390/en17051257
AMA Style
Yu H, Wang Y, Liu C, Wang S, Hao C, Xiong J. Optimization and Scheduling Method for Power Systems Considering Wind Power Forward/Reverse Peaking Scenarios. Energies. 2024; 17(5):1257. https://doi.org/10.3390/en17051257
Chicago/Turabian StyleYu, Hao, Yibo Wang, Chuang Liu, Shunjiang Wang, Chunyang Hao, and Jian Xiong. 2024. "Optimization and Scheduling Method for Power Systems Considering Wind Power Forward/Reverse Peaking Scenarios" Energies 17, no. 5: 1257. https://doi.org/10.3390/en17051257
Note that from the first issue of 2016, this journal uses article numbers instead of page numbers. See further details here.