

Machine Learning Assisted Microchannel Geometric Optimization—A Case Study of Channel Designs


1
Institute of Wenzhou, Zhejiang University, Wenzhou 310027, China
2
Institute of Process Equipment, College of Energy Engineering, Zhejiang University, Hangzhou 310027, China
3
School of Intelligent Manufacturing Ecosystem, Xi’an Jiaotong-Liverpool University, 111 Taicang Avenue, Taicang, Suzhou 215488, China
*
Author to whom correspondence should be addressed.
Energies 2024, 17(1), 44; https://doi.org/10.3390/en17010044 (registering DOI)
Submission received: 6 November 2023
/
Revised: 5 December 2023
/
Accepted: 9 December 2023
/
Published: 21 December 2023
(This article belongs to the Special Issue Modeling and Optimization of Heat Exchangers, Refrigeration and Heat Pump Systems)
Abstract
:At present, microchannel heat exchangers are widely applied in the fields of air-conditioning and heat pumping applications given their high heat transfer performance, compact size, and low material cost. However, designing and optimizing the channel geometries remain challenging, as they require balancing multiple competing objectives to achieve the optimal performance. This study investigates various parameters, including the channel count, wetted perimeter, cross-sectional area, and mass flow rate for each channel, to achieve the optimal efficiency. The optimization objectives include maximizing the heat transfer rate, minimizing the refrigerant convective thermal resistance, maximizing the refrigerant heat transfer coefficient, and minimizing the pressure drop. A multi-objective genetic optimization algorithm, in conjunction with artificial neural network (ANN)-based machine learning models, was used to predict the heat transfer rate to speed up the calculation process during the optimization. We identified that a gradient reduction in the wetted perimeter from the air inlet along the airflow direction could enhance the heat transfer rate. Additionally, the results indicate that an increase in the number of channels leads to an enhanced heat transfer efficiency rate. However, with the increase in the number of channels, the cross-sectional area of each channel is correspondingly reduced to maintain a consistent overall cross-sectional area. This reduction increases the fluid resistance, leading to an increased pressure drop across the system. This observation is critical for a microchannel design optimization, highlighting the importance of attaining a balance between achieving a higher heat transfer efficiency and maintaining a favorable fluid dynamic performance.
1. Introduction
Microchannel heat exchangers (MCHXs) have been extensively applied in electronic device cooling systems, automotive air conditioning systems, refrigeration systems and heat pumps. The key characteristic of this class of heat exchangers is the small dimensions of its channels, often featuring a hydraulic diameter smaller than 1 mm. This design affords an exceptionally high surface-area-to-volume ratio, thereby substantially boosting the heat transfer efficiency. The studies on sub-millimeter-scale engineering and heat transfer principles have presented exciting new prospects in the field of fluid mechanics and heat transfer science [1]. In most heat exchanger designs, the paramount objective is to achieve a high heat transfer rate while maintaining a balance between the material cost and pumping power. The heat transfer rate is collectively determined by the heat transfer coefficient, the surface area of the microchannel, and the temperature difference during the fluid flow process. These factors work in concert to optimize the thermal energy exchange, representing a sophisticated balance of thermodynamics, fluid mechanics, and design strategy [2]. As the world is facing an urgent energy crisis, there is an immediate need to conserve energy and improve the efficiency of energy utilization [3]. In addressing this challenge, other primary design goals include reducing pressure losses for working fluids and 2achieving cost-efficiency outcomes without compromising their performance [4,5].
Various modeling and optimization methods have been applied in previous heat exchanger optimization studies. Knight et al. [6,7] and T. Bello-Ochende et al. [8] used the finite element modeling (FEM) method to determine the optimal aspect ratio and channel shape. Husain [9] employed the response surface approximation method to optimize the design of microchannel heat exchangers, considering the microchannel width, depth, and fin width, aiming to minimize thermal resistance. Furthermore, Garcia [10] conducted a multi-objective optimization of plate microchannel heat exchanger structures to decrease the volume and fan power requirements of fan coils at fixed capacities, focusing on variables, such as the tube height, width, length, fin height, and spacing. Li et al. [11] optimized the number of channels, along with their widths and heights, to minimize the overall thermal resistance. Furthermore, Huang et al. [12] applied a multi-objective genetic algorithm to create a variable geometric optimization design, aiming to reduce material mass and maximize the heat exchange capacity.
The selection of geometric parameters as variables in the optimization problem plays a major role that affects the optimized solutions. Among the different geometric parameters, many studies have explored the effect of microchannel cross-sectional shapes on heat exchanger performance. Gunnasegaran et al. [13], Wang et al. [14], and Chen et al. [15] studied the effects of microchannel cross-sectional shape on the fluid flow and heat transfer performance of rectangular, triangular, and trapezoidal microchannels through numerical methods. The conclusion was that the cross-sectional areas with small hydraulic diameters presented low thermal resistance and pressure drop results. Gunnasegaran et al. [13] and Wang et al. [14] discovered the optimal performance of rectangular-shaped microchannels over the others. Chen et al. [15] found that triangular microchannels had high thermal efficiency behavior because they required less pump power. Huang et al. [16] designed a grooved microchannel layout for heat sinks and conducted numerical studies on the flow and heat transfer characteristics of three different types of grooved microchannel radiators. These three types were a rectangular parallel slot, rectangular staggered slot, and trapezoidal staggered slot. The results showed that the size of the rectangular slot and the degree of the trapezoidal bottom angle considerably influenced the flow and heat transfer characteristics. The specific microchannel geometries considered in previous research were all regular shapes. Based on a wide range of operating conditions and size constraints, the hydraulic and thermal performances of differently shaped microchannels should be studied, prior to generating a variety of irregular shapes. Further exploring the optimal structure of the microchannel in the design of microchannel heat exchangers is of great significance.
This study uses the number of channels, wetted perimeter, and cross-sectional area as variables, and a multi-objective optimization is performed on the premise of the uniform distribution of refrigerant in each channel. The optimization objectives include maximizing the heat transfer rate, maximizing the refrigerant heat transfer coefficient, minimizing the refrigerant convective thermal resistance, and minimizing the pressure drop. To reduce the computational cost, an artificial neural networks (ANNs) model is used to assist in accelerating the computation speed. The generated parameters following optimization are used for the shape optimization to construct the channel shape. The purpose of this study is to develop a feasible approach to optimizing the performance and efficiency of microchannel heat exchangers’ channel geometry through the implementation of ANN models as part of the optimization process.
2. Heat Exchanger Modeling
2.1. An Introduction to the Modeling of Heat Exchangers
A microchannel heat exchanger is a highly efficient, compact heat exchange component. The design of a microchannel heat exchanger optimizes its performance, mainly due to its large surface area-to-volume ratio. The heat exchanger model for the microchannel heat exchanger, shown in Figure 1a,b, illustrates the calculation unit optimized in this study, which is also the baseline of the optimization process. According to Du et al. [17,18], models that calculate the heat transfer rate in heat exchangers can be broadly grouped into three categories: lumped, numerical, and zone models. Lumped models use representative parameters to determine heat transfer efficiency, but they might miss specific mass transfer details, such as moist areas on fins. Numerical models offer a detailed perspective of heat and mass transfer by dissecting the heat exchanger and utilizing aggregate parameters for each section. While these models are precise, they require significant computational resources, making rapid predictions a challenge. Zone models offer a balance between precision and the computational cost, bridging the gap between lumped and numerical methods. These models divide the heat exchanger into several sections based on the wetting conditions and employ lumped approaches for calculations. This technique provides greater accuracy than solely using lumped models and is quicker than relying entirely on numerical methods. In this study, considering the issues of computational accuracy and methodology, we chose to use the results generated from numerical models to establish a database for training the ANN models.
2.2. Heat Exchanger Modeling
On the refrigerant side, we applied the empirical correlation formula by Shah [19]. On the airside, this study employed a 2D numerical solution model [17,20] of the microchannel heat exchanger to build a database, which was then utilized to apply the machine learning method. As for the calculation of the pressure drop, we utilized the homogeneous [21] pressure drop correlation. The detailed calculations are explained below.
2.2.1. Heat Transfer Rate
For the numerical model we used, the semi-explicit method for wall temperature linked equations (SEWTLE) [18,22] was implemented. The purpose of this method was to offer a comprehensive numerical approach for heat exchangers with an intricate geometry. The method solves heat transfer occurring during the fluid cell phase (air cells or refrigerant cells) and wall cell phase (either fin cells or tube wall cells). The governing equations are as follows [22]:
The variable n stands for the count of wall cells enveloping the fluid cells. Heat conduction along the wall cells is represented by the two-dimension Laplace equation [22]:
In accordance with the numerical models, fluid temperatures can be determined by Equation (1) using the temperatures of the surrounding wall cells. Equation (2) represents the heat conduction along the wall cells by the two-dimensional Laplace equation, which can generate wall cell temperatures based on the temperatures of nearby wall and fluid cells. In this study, the heat transfer rate can be solved according to 2D numerical models.
The numerical scheme and the cell discretization diagram are depicted in Figure 2a,b. Figure 2a demonstrates that the air layers are divided into an equal number of elements as those on the fin. To maintain a two-dimensional simulation, the tube wall is segmented into only three cells. The tube cells on either side facilitate heat and mass exchange with the air layers, while the central tube cell conducts heat transfer with the fin cells. The number of refrigerant cells is aligned with that of the tube cells for simplicity.
The discretized points, such as wall cells, which include tube and fin cells, are represented by a central point, shown as a gray point in Figure 2c. Conversely, fluid cells, which encompass air and refrigerant cells, are depicted by two points along their flow directions, as indicated by the red points in Figure 2c.
The boundary conditions were specified at the point where the fluid entered the system, with known temperature and velocity profiles [17]. Furthermore, when the heat loss through the heat exchanger’s walls was minimal enough to disregard, it was necessary to apply a condition such that the temperature gradient at the boundaries of the heat exchanger, in a direction normal for these boundaries, was zero. This led to the establishment of a Dirichlet condition for the temperature of the incoming fluid, while a Neumann condition was applied to the exterior edges concerning the wall temperature. In addition, the outer walls at the termini of the heat exchanger were typically insulated to a degree that made the heat loss to the external environment trivial, thus allowing us to treat the walls as if they were adiabatic [17]. The main calculation process for the heat transfer rate is presented below [17].
The temperature of the wall can be calculated through the numerical scheme, which is expressed as:
represents the wall temperature, represents heat fluxes, is the cross-section area between two cells, and is the distance from the central point of one wall cell to another. is the thermal conductivity of the material. n1 is the number of adjacent wall cells. Taking the example of the central tube cell in Figure 2b, n1 is five and n2 is one, indicating there is only one refrigerant cell that is surrounded, which is indicated in Figure 2c.
Refrigerant and air cells are both categorized as fluid cells, and therefore, their temperature values are calculated using Equation (1). ol represents the outlet and i represents the inlet.
where
This study considers the heat transfer rate under dry conditions; therefore, the heat transfer rate between the air and wall cells can be expressed as:
α is the heat transfer coefficient, ins represents the inside, and r represents the refrigerant cell.
2.2.2. Pressure Drop
For microchannel heat exchangers, factors that predominantly affect their performance include the internal friction resistance, the physical properties of the fluid (such as density and viscosity), the flow rate of the fluid, the flow state (whether laminar or turbulent), and the geometric shape and surface condition of the channel.
In this study, the pressure drop of the microchannel heat exchanger were calculated based on the homogeneous model [21]. The Reynolds number (Re) is a dimensionless quantity in fluid dynamics that characterizes the nature of fluid flow, particularly distinguishing between laminar and turbulent flows. The formula for calculating the Reynolds number is typically given as:
The hydraulic diameter (hyd) is represented as:
where is the fluid density. is the mean velocity of the fluid. L is the characteristic length. is the dynamic viscosity of the fluid. A is the cross-sectional area of the channel. WP is the wetted perimeter of the shape.
According to the homogeneous model, when the Reynolds number (Re) is less than 2300, it is indicative of a laminar flow condition. In such a case, the formula for calculating the pressure drop is [21]:
When the Re is equal to or above 2300, it indicates a turbulent flow condition. Under such circumstances, the formula for calculating the pressure drop is [21]:
2.2.3. Refrigerant Side Calculation
The refrigerant heat transfer coefficient of horizontal tubes is addressed when calculating the parameters. According to Shah [19], there are three regime correlations. Figure 3 indicates the boundaries of the three heat transfer regimes. The mist, annular, and intermittent flow patterns consistently align with regime I, based on the current correlation’s prediction. The association with the stratified wavy and stratified flow patterns, however, is less distinct. While most data in the stratified wavy pattern fall under the projected heat transfer of regime II, numerous others are categorized under regime III, and a handful in regime I. Data points within the stratified flow pattern can be found in both regimes II and III [19].
Regime I:
Regime II:
Regime III:
Regime I occurs when:
Otherwise, regime III occurs when:
Otherwise, regime II occurs.
In this study, the shape of the refrigerant channel was an irregular polygon, but the wetted perimeter was different; the contact area between the refrigerant and the wall inside the channel was different for each channel. The refrigerant convective thermal resistance considers both the heat transfer coefficient of the refrigerant and the contact area between the refrigerant and the exchanger channel, both of which affect the heat exchange performance.
2.3. Calculation of the Flow Maldistribution
The methodology used to quantify the flow rate distribution within a microchannel heat exchanger primarily depends on the following assumptions:
- (1)
- Uniform airflow distribution: the airflow is taken to be uniform in terms of the velocity and temperature in the model. However, this assumption can be modified in future iterations of the model by incorporating velocity and temperature distributions.
- (2)
- Uniform pressure drop across different flow paths: according to the research conducted by Tuo and Hrnjak [23], this assumption is rooted in their demonstration of how the header pressure drop influences the distribution across various flow paths. In the context of their study, a ‘path’ is defined as a specific segment starting from the inlet header, passing through a microchannel tube, and ending at the outlet header. The pressure drop across this path includes the cumulative loss induced by friction, acceleration, gravity, and the contractions and expansions at the interaction points between the header and microchannel tube. As a result, for a microchannel heat exchanger, each flow path within the evaporator experiences a uniform pressure drop from the inlet to the outlet.
Based on the assumptions, the pressure drop is the same across each microchannel within the flat tubes. Therefore, this study proposed a pre-allocation of the refrigerant distribution across each channel when generating the variables for the multi-objective optimization (assuming the same inlet pressure initially). As shown in Figure 4, by minimizing the sum of the pressure differences between each pair of adjacent channels, the pressure at the outlet of each channel was made uniform, thereby enhancing the heat exchange efficiency of the heat exchanger.
3. ANN-Based Machine-Learning-Assisted Optimization Model
Due to the time-consuming nature of calculating the heat transfer rate of microchannel heat exchangers using numerical methods, we employed ANN models to speed up the computation. We surveyed a spectrum of the design of experiment (DOE) techniques, spanning from random and Latin hypercube sampling methods [24] to the full factorial design [25]. For the objectives of this research, we applied the random sampling paradigm, where the channel’s structure experienced stochastic variations within the specified parameters.
The methodology for machine-learning-assisted modeling based on ANNs comprised four stages in this study. The entire procedure is presented in Figure 5. Firstly, the initial phase involved identifying the design domain for the HX simulation. This domain represents all the possible channel structures of the microchannel heat exchangers, considering the design constraints. In the subsequent step, the database of the models was constructed with a random distribution of this identified domain. For the third step, the heat transfer rate was calculated using the numerical method introduced in the previous section. Lastly, the output from the numerical calculation was used to create machine-learning-assisted models employing ANNs.
This innovative approach markedly expedited the computation process, offering advancements that traditional numerical models simply could not compete with. The input layer includes certain variables, three for each microchannel, each symbolizing an essential parameter: the hydraulic diameter, cross-sectional area, and refrigerant mass flow rate. As a result, with N representing the number of channels, the total input features amount to 30 × N. The model consisted of one hidden layer with 20 neurons, with each neuron adept at receiving information from its previous-layer counterparts, processing the data, and forwarding the results to the subsequent layer. The configuration, especially the number of neurons in the hidden layer, was determined through experimental adjustments to achieve a balance between the learning capacity and the risk of overfitting. According to Figure 6, we chose 20 neurons in the hidden layer as this offered an optimal balance between the high predictive accuracy and manageable computational time, effectively mitigating the risk of overfitting. A single hidden layer sufficed, given the model’s uncomplicated input–output mapping, negating the need for additional complexity. Increasing the number of hidden layers in an artificial neural network (ANN) typically results in a polynomial growth in the time complexity. Mathematically, if L represents the number of layers and N represents the number of neurons per layer, the computational complexity can be approximated as O (N2·L) for fully connected layers. As L and N increase, both contribute to a rise in the computational demand of neural networks. We utilized a single hidden layer and 20 neurons in the hidden layer because, in this model, one single hidden layer was sufficient to provide a high prediction accuracy.
We selected tansig (hyperbolic tangent sigmoid function) as the activation function for the hidden layer, suitable for forward-feed neural networks, while the output layer employed purelin (linear function). We adopted the Levenberg–Marquardt algorithm for training due to its proven efficiency for rapid convergence and increased accuracy, particularly within the scope of small- to medium-sized networks [26]. Through extensive testing with various structures, we ascertained that the current architecture provided an optimal balance of performance for our dataset, offering high predictive accuracy results while avoiding overfitting.
This intricate network culminated in a singular neuron at the output layer, responsible for calculating the predicted heat transfer rate based on the cumulative information it received. Model training was pursued by minimizing the discrepancy between predicted and actual values, an approach that resulted in impressive model accuracy and stability results [27]. Consequently, our ANN model was not only adept at swiftly predicting heat transfer rates, but also ensured that these predictions were highly accurate, showcasing the transformative potential of machine learning in such optimization contexts.
In the error testing set, there were five groups of data (8, 9, 10, 11, and 12 channels), each consisting of 1000 data points. We selected 5% of the data in the dataset for validation. The x-axis test sample index referred to the case used in the error analysis for machine learning, which indicated the total number of cases that were involved in the validation of the ANN model. As demonstrated in Figure 7, the graph depicts both the predicted and actual values, and it provides a 5% error bar. In addition, we computed the mean squared error (MSE) and mean absolute error (MAE). The model’s validation process results corroborate the ANN’s capability for high-precision predictions.
Figure 8 presents the comparison of the predicted and actual values of the heat transfer rate for the Pareto optimal solutions in the results post-optimization. The outcomes indicate that the prediction accuracy exceeds 97%. This high level of accuracy further validates the effectiveness of the machine-learning-assisted optimization based on machine learning in this context, providing robust results with minor discrepancies between the predicted and actual values.
4. Optimization Methodology and Problem Statement
4.1. Methodology
The overall optimization flow is shown in Figure 9. This study aimed to improve the performance of microchannel heat exchangers by strategically selecting diverse objective functions, which led to the generation of a series of Pareto optimal solutions. These solutions represent the most efficient geometric configurations of the channels, optimized under varying operational conditions. The employed optimization model facilitated the selection of an amalgam of objectives that collectively defined the target function for optimization, culminating in the derivation of a Pareto optimal curve. This curve epitomizes the optimal trade-offs among the chosen objectives, reflecting the best possible balance in the microchannel’s performance under the specified constraints.
4.2. Baseline Case
The method addresses the condensation scenario of a microchannel heat exchanger, as depicted in Figure 10a, with 10 channels. A single-fin microchannel unit was selected as the baseline for the comparison. This baseline microchannel heat exchanger has 10 channels, the parameters involved in the computational unit are shown in Figure 10b, and the specific details of the parameters are presented in Table 1. In the optimization process, the database was generated based on the numerical solutions, which were discussed in Section 2.2.1.
The baseline case was modeled numerically and the heat transfer rate for each channel in the air flow direction is shown in Figure 11. According to the results, it can be observed that the heat transfer rate delivered by each channel from the air side shows a decreasing trend along the air inlet, with a total heat transfer capacity of 0.5593 W. Through the abovementioned iterative approach used to distribute the refrigerant flow rate, the resulting pressure drops were also identical, each being 360.52 Pa. The outlet temperature of the air was 346 K, while the refrigerant maintained a constant temperature of 350 K. Due to the high heat transfer coefficient of the refrigerant and the substantial thermal conductivity of the wall, the wall’s temperature was 349 K, closely mirroring the refrigerant’s temperature. By examining the heat exchanger’s outlet, a remaining heat transfer potential of 3 K could be explored further. The opportunity to increase the heat transfer rate lies in reducing the temperature difference between the wall and the air, thereby enabling the heat exchanger to exchange more heat with the air.
4.3. Problem Statement
In this study, the parameters studied included the hydraulic diameter, cross-sectional area, and number of channels. Each channel was subjected to geometric constraints for different numbers of channels, as shown in Table 2. The number of channels (8, 9, 10, 11, and 12) indicates the variable; in addition, the total mass flow rate for each case is equal to the baseline case: 1.0 × 10⁻³ kg/s. Moreover, for a simple polygon, given a certain wetted perimeter or circumference, the area of the polygon is always larger than or equal to the area of a circle with the same hydraulic diameter as that polygon. This is because, among all planar closed shapes, a circle has the smallest perimeter-to-area ratio; as a result, the following formula needs to be satisfied for its hydraulic diameter and wetted perimeter as indicated in Equation (22). For each case, considering the constraint of each channel, the hydraulic diameter and cross-sectional area are different because of the same design domain, as shown in Figure 10a.
The objective functions include the refrigerant heat transfer coefficient, heat transfer rate, refrigerant convective thermal resistance, and pressure drop. The multi-objective optimization conducts three distinct multi-objective optimization experiments. These experiments aim to satisfy two conflicting objectives simultaneously. Table 3 presents detailed explanations for three scenarios: maximize the heat transfer rate and minimize the pressure drop; maximize the refrigerant heat transfer coefficient and minimize the pressure drop; and minimize the refrigerant convective thermal resistance and minimize the pressure drop. Finally, to minimize the refrigerant convective thermal resistance, in this study, we used the maximization of the inverse of the refrigerant convective thermal resistance as the optimization objective.
5. Results and Discussion
In this section, we first discuss the results generated from the three optimization scenarios. We focus on analyzing one of the optimal solutions as an example from the perspective of maximizing the heat transfer rate and minimizing the pressure drop. Then, we discuss the computational cost and the ANN model application. We elaborate on how integrating machine learning models during predictions accelerates the computation process. Furthermore, we explore the single case of the Pareto front curve in scenario A at the end of the discussion.
5.1. Scenario A
Based on the objective functions presented in Section 4, there are three optimization cases. Figure 12 presents the Pareto optimal solutions for scenario A. The x-axis represents the heat transfer rate, while the y-axis corresponds to the pressure drop. The red points illustrate the Pareto optimal solutions for eight channels, green for nine channels, and so on, up to twelve channels, cumulating in a final Pareto optimal curve. Each point signifies a specific channel configuration and refrigerant flow rate. For instance, if there are eight channels, there would be a total of 24 parameters, with three data points for each channel: the wetted perimeter, area, and refrigerant flow rate. The heat transfer rate advanced by roughly 5% compared to the initial structure after achieving the optimal solutions and multi-objective optimization. The heat transfer rate for 12 channels was successively higher than that of 11 and 10 channels because a higher number of channels led to a larger heat transfer area, which simultaneously resulted in an increased pressure drop. Concurrently, we observed that the jumps between points on the Pareto front in Figure 12 indicated that the multi-objective genetic algorithm converged on the local optimality, creating the non-smoothness of the Pareto front.
5.2. Scenarios B and C
Figure 13a exhibits the relationship between the refrigerant heat transfer coefficient and pressure drop, while Figure 13b demonstrates the connection between the inverse of refrigerant convective thermal resistance and pressure drop. The Pareto optimal solutions for 8, 9, 10, 11, and 12 channels were superimposed, resulting in a final aggregate Pareto curve. The endpoints of the Pareto curve were constituted by the 8- and 12-channel solutions. The results indicate that the 8-channel configuration yields a lower pressure drop, while the 12-channel structure achieves a higher refrigerant heat transfer coefficient. Regarding the inverse of the refrigerant convective thermal resistance, channels 8, 11, and 12 are on the Pareto frontier. As the number of channels increases, the inverse of the refrigerant convective thermal resistance also increases, accompanied by a corresponding increase in the pressure drop. Therefore, the optimization process requires an understanding of these trade-offs, aiming for an ideal balance suitable for the specific application.
5.3. Computational Cost and ANN Model Application
Incorporating the machine learning model into the optimization process, we tested it with a dataset of 1000 cases, based on the provided data comparing the calculation times for 1000 cases between a numerical model and machine learning model. The machine learning model demonstrated a significantly faster calculation time compared to the 2D numerical model. As shown in Table 4, this table presents a comparison of the calculation times between a numerical model and an artificial neural network (ANN) model. On average, the numerical model requires 25.92 s to perform the necessary computations, while the ANN model demonstrates a significantly faster average computation time of 0.41 s. This stark contrast in the calculation efficiency highlights the potential time-saving advantages of employing ANN models for computational tasks. Specifically, the machine learning model is approximately 63 times faster on average.
5.4. Optimized Case Analysis
We selected a representative case from the set of optimal cases on the Pareto curve shown in Figure 12. To ensure experimental fidelity, we picked a point from one of the 12 channels and input it into the numerical model. This provided the following authentic heat transfer model data, with the heat transfer rate for each channel along with the air inlet displayed in Figure 11. The “channel index” indicates the sequential numbering of channels in accordance with the direction of the incoming airflow. The first channel that encountered the entering air was designated as channel 1, and subsequent channels were numbered incrementally, following the path of the airflow.
Based on the numerical results in Figure 14, the total heat transfer rate reaches 0.571 W, with a pressure drop at 226 Pa. In addition, the temperature difference between the refrigerant and air outlets compared to the baseline decreased, leading to an overall enhancement of the total heat transfer rate. It can be observed that the heat transfer rate in channel 1 is greater, compared to the baseline case, as illustrated in Figure 15a. A larger wetted perimeter corresponds to an increased flow for each channel. The heat transfer area between the refrigerant and the channels was also larger. Along the airflow direction, the wetted perimeter generally showed a decreasing trend. In addition, as illustrated in Figure 15b, the mass flow rate of the refrigerant in the first channel is also higher. The refrigerant mass flow rate decreased along the air flow direction across different channels.
We found that, at the initial stage of the microchannel heat exchanger, there was a significant temperature difference between the air and the refrigerant. This large temperature gradient at the beginning provided a strong driving force for heat transfer. As the air progressed through the heat exchanger, this temperature difference gradually diminished, reducing the heat transfer potential. Therefore, having a larger wetted perimeter (which implies a greater contact area between the refrigerant and the walls) in the initial section effectively utilized the higher temperature gradient, leading to enhanced heat exchange efficiency. This design approach maximized heat transfer potential, significantly improving the overall performance of the heat exchanger.
6. Conclusions
In this study, we innovatively proposed and executed an optimization technique for microchannel heat exchangers, leveraging both multi-objective optimization and machine learning techniques. The optimization objectives included minimizing the pressure drop while maximizing the heat transfer rate, the refrigerant heat transfer coefficient, or minimizing the refrigerant convective thermal resistance. Notably, for the optimized case, the heat transfer rate improved by 5% and the pressure drop decreased by 37% compared to the initial structure, respectively. In addition, the wetted perimeter of the channel displayed a consistently decreasing trajectory along the air flow direction, signaling an enhancement potential for the heat transfer rate of the microchannel heat exchanger. We employed a machine-learning-driven ANN model, underscoring its pronounced efficacy in forecasting the heat transfer rate. This approach markedly reduced the associated computational costs. The machine learning model’s prediction speed outpaced traditional numerical models by a staggering 63 times, with a high prediction accuracy.
However, in our research, we concentrated on scenarios characterized by a uniform airflow through the system. While this focus streamlined our analysis, it also introduced certain limitations. We recognize that the assumption of a uniform airflow does not fully capture the diverse and dynamic range of conditions encountered in more complex, real-world applications, where airflow characteristics can vary substantially. Moreover, our study did not incorporate the graphical visualization of the final channel structures as derived from our computational models. The absence of such visualizations limited our ability to provide a concrete, illustrative demonstration of our theoretical results and computational predictions. A further limitation lay in the lack of experimental validation for the structures modeled in our study. Without empirical testing, there remains a disconnect between our theoretical projections and their practical applicability. The significance of experimental validation cannot be overstated, as it is essential for verifying the real-world feasibility and reliability of our modeled structures.
In summary, this study introduced a machine-learning-assisted microchannel geometric optimization for calculating the changes in the geometry of channels. The results show that the variable channel structure design is superior to the baseline design. For the final optimization results, based on the optimization output wetted perimeter and cross-sectional area of each channel, further evaluations can be conducted using the computational fluid dynamics analysis and experimental testing to finalize the channel structure design.
Author Contributions
Conceptualization, L.H., B.L. and Z.J.; methodology, L.H. and B.L.; formal analysis, L.H. and J.Z.; investigation, J.Z.; data curation, L.H. and J.Z.; writing—original draft preparation, L.H. and J.Z.; writing—review and editing, Z.J., B.L. and J.Q.; supervision, Z.J. and B.L.; project administration, L.H.; funding acquisition, L.H. and J.Q. All authors have read and agreed to the published version of the manuscript.
Funding
This work was funded by the National Natural Science Foundation of China (Grant No. 52306026), Wenzhou Municipal Science and Technology Research Program (Grant No. G20220012), Special Innovation Project Fund of the Institute of Wenzhou, Zhejiang University (XMGL-KJZX-202205), and State Key Laboratory of Air-Conditioning Equipment and System Energy Conservation Open Project (Project No. ACSKL2021KT01). The APC was funded by Special Innovation Project Fund of the Institute of Wenzhou, Zhejiang University (XMGL-KJZX-202205).
Data Availability Statement
The data presented in this study are available on request from the corresponding author.
Conflicts of Interest
The authors declare no conflict of interest.
Nomenclature
| A | Area ) |
| AHTC | Air-Side heat transfer coefficient |
| RHTC | Refrigerant-Side heat transfer coefficient |
| ANNs | Artificial neural networks |
| Specific heat capacity (KJ/kg/K) | |
| G | Total mass flux (liquid + vapor) |
| g | Acceleration due to gravity |
| h | Heat transfer coefficient |
| Heat transfer coefficient expressed by Equation (10) | |
| Heat transfer coefficient expressed by Equation (11), the Nusselt equation | |
| hyd | Hydraulic diameter |
| ins | Inside |
| Dimensionless vapor velocity defined by Equation (13) | |
| k | Thermal conductivity (KW/m·K) |
| Mass flow rate of air (Kg/s) | |
| L | Tube length |
| ∆P | Pressure drop |
| Reduced pressure | |
| Pr | Prandtl number |
| Heat transfer rate (KJ/Kg) | |
| R | Heat transfer resistance (K/W) |
| Re | Reynolds number |
| Reynolds number assuming liquid phase flowing alone | |
| Temperature (K) | |
| t | Fin thickness (m) |
| Velocity (m/s) | |
| Wall | |
| WP | Wetted perimeter |
| x | Vapor quality |
| Z | Shah’s correlating parameter defined by Equation (14) |
| Greek symbols | |
| μ | Dynamic viscosity |
| ρ | Density |
| π | Ratio of a circle’s circumference |
| Thickness | |
| Subscripts | |
| At this cell | |
| flu | Fluid |
| g | Vapor |
| i | Inlet |
| ins | Inside |
| At the local position | |
| ol | Outlet |
| TP | Two phase |
References
- Harpole, G.; Eninger, J. Micro-channel heat exchanger optimization. In Proceedings of the 7th IEEE SEMI-THERM Symposium, Phoenix, AZ, USA, 12–14 February 1991; pp. 59–63. [Google Scholar]
- Thulukkanam, K. Heat Exchanger Design Handbook; CRC Press: Boca Raton, FL, USA, 2013. [Google Scholar]
- bin Abu Bakar, W.; Yek, P.N.Y.; Cheong, K.Y.; Affam, A.C.; Wong, C.C.; Liew, R.K.; Tan, Y.H.; Lam, S.S. Utilization of microwave steam pyrolysis to produce biochar for thermal energy storage. Waste Dispos. Sustain. Energy 2022, 4, 335–341. [Google Scholar] [CrossRef]
- Wang, H.; Xu, W.; Sharif, M.; Cheng, G.; Zhang, Z. Resource utilization of solid waste carbide slag: A brief review of application technologies in various scenes. Waste Dispos. Sustain. Energy 2022, 4, 1–16. [Google Scholar] [CrossRef]
- Moreira, B.R.d.A.; Cruz, V.H.; Cunha, M.L.O.; Lopes, N.P.; Magalhães, A.C.; Miasaki, C.T.; Caraschi, J.C.; Viana, R.d.S. Valorization of semi-solid by-product from distillation of cellulosic ethanol into blends for heating and power. Waste Dispos. Sustain. Energy 2021, 3, 49–61. [Google Scholar] [CrossRef]
- Knight, R.W.; Goodling, J.S.; Hall, D.J. Optimal thermal design of forced convection heat sinks-analytical. J. Electron. Packag. 1991, 113, 313–321. [Google Scholar] [CrossRef]
- Knight, R.; Hall, D.; Goodling, J.; Jaeger, R. Heat sink optimization with application to microchannels. IEEE Trans. Compon. Hybrids Manuf. Technol. 1992, 15, 832–842. [Google Scholar] [CrossRef]
- Bello-Ochende, T.; Liebenberg, L.; Meyer, J. Constructal cooling channels for micro-channel heat sinks. Int. J. Heat Mass Transf. 2007, 50, 4141–4150. [Google Scholar] [CrossRef]
- Husain, A.; Kim, K.-Y. Thermal optimization of a microchannel heat sink with trapezoidal cross section. J. Electron. Packag. 2009, 131, 021005. [Google Scholar] [CrossRef]
- Garcia, J.C.S.; Tanaka, H.; Giannetti, N.; Sei, Y.; Saito, K.; Houfuku, M.; Takafuji, R. Multiobjective geometry optimization of microchannel heat exchanger using real-coded genetic algorithm. Appl. Therm. Eng. 2022, 202, 117821. [Google Scholar] [CrossRef]
- Li, F.; Zhu, W.; He, H. Numerical optimization on microchannel flow and heat transfer performance based on field synergy principle. Int. J. Heat Mass Transf. 2019, 130, 375–385. [Google Scholar] [CrossRef]
- Huang, L.; Aute, V.; Radermacher, R. Air flow distribution and design optimization of variable geometry microchannel heat exchangers. Sci. Technol. Built Environ. 2015, 21, 693–702. [Google Scholar] [CrossRef]
- Gunnasegaran, P.; Mohammed, H.; Shuaib, N.; Saidur, R. The effect of geometrical parameters on heat transfer characteristics of microchannels heat sink with different shapes. Int. Commun. Heat Mass Transf. 2010, 37, 1078–1086. [Google Scholar] [CrossRef]
- Wang, H.; Chen, Z.; Gao, J. Influence of geometric parameters on flow and heat transfer performance of micro-channel heat sinks. Appl. Therm. Eng. 2016, 107, 870–879. [Google Scholar] [CrossRef]
- Chen, Y.; Zhang, C.; Shi, M.; Wu, J. Three-dimensional numerical simulation of heat and fluid flow in noncircular microchannel heat sinks. Int. Commun. Heat Mass Transf. 2009, 36, 917–920. [Google Scholar] [CrossRef]
- Huang, S.; Zhao, J.; Gong, L.; Duan, X. Thermal performance and structure optimization for slotted microchannel heat sink. Appl. Therm. Eng. 2017, 115, 1266–1276. [Google Scholar] [CrossRef]
- Du, R.; Zou, J.; An, J.; Huang, L. A regression-based approach for the explicit modeling of simultaneous heat and mass transfer of air-to-refrigerant microchannel heat exchangers. Appl. Therm. Eng. 2023, 235, 121366. [Google Scholar] [CrossRef]
- Du, R.; An, J.; Huang, L. A Modified Effectiveness-Based Approach in Performance Prediction of Simultaneous Heat and Mass Transfer of Microchannel Heat Exchanger in Heat Pump Operating Conditions. In Proceedings of the 14th IEA Heat Pump Conference, Chicago, IL, USA, 15–18 May 2023. [Google Scholar]
- Shah, M.M. General Correlation For Heat Transfer During Condensation in Plain Tubes: Further Development and Verifica-tion. ASHRAE Trans. 2013, 119, 3–11. [Google Scholar]
- Hassan, A.H.; Martínez-Ballester, S.; Gonzálvez-Maciá, J. Two-dimensional numerical modeling for the air-side of minichannel evaporators accounting for partial dehumidification scenarios and tube-to-tube heat conduction. Int. J. Refrig. 2016, 67, 90–101. [Google Scholar] [CrossRef]
- Thome, J.R. Engineering Data Book III; Wolverine Tube, Inc.: Huntsville, AL, USA, 2006. [Google Scholar]
- Corberán, J.M.; de Córdoba, P.F.; Gonzálvez, J.; Alias, F. Semiexplicit method for wall temperature linked equations (SEWTLE): A general finite-volume technique for the calculation of complex heat exchangers. Numer. Heat Transf. Part B Fundam. 2001, 40, 37–59. [Google Scholar] [CrossRef]
- Tuo, H.; Hrnjak, P. Effect of the header pressure drop induced flow maldistribution on the microchannel evaporator performance. Int. J. Refrig. 2013, 36, 2176–2186. [Google Scholar] [CrossRef]
- McKay, M.D. Latin hypercube sampling as a tool in uncertainty analysis of computer models. In Proceedings of the 24th Conference on Winter Simulation, Arlington, VA, USA, 13–16 December 1992; pp. 557–564. Available online: https://dl.acm.org/doi/pdf/10.1145/167293.167637 (accessed on 5 December 2023).
- Box, G.E.; Meyer, R.D. Dispersion effects from fractional designs. Technometrics 1986, 28, 19–27. [Google Scholar] [CrossRef]
- Ranganathan, A. The levenberg-marquardt algorithm. Tutoral LM Algorithm 2004, 11, 101–110. [Google Scholar]
- Agatonovic-Kustrin, S.; Beresford, R. Basic concepts of artificial neural network (ANN) modeling and its application in pharmaceutical research. J. Pharm. Biomed. Anal. 2000, 22, 717–727. [Google Scholar] [CrossRef] [PubMed]
Figure 1.
(a) The microchannel heat exchanger; (b) segment calculation unit of this model (one fin) [17].
Figure 1.
(a) The microchannel heat exchanger; (b) segment calculation unit of this model (one fin) [17].

Figure 2.
(a) Calculation domain of this model [17]; (b) numerical illustration of cell discretization [17]; (c) illustration of discretized points that represent different cells [17].

Figure 3.
Regimes of heat transfer as defined by Shah [19].
Figure 3.
Regimes of heat transfer as defined by Shah [19].

Figure 4.
Uniform pressure drop distribution in the microchannel heat exchanger.

Figure 5.
Diagram illustrating the method of modeling with the help of machine learning techniques.
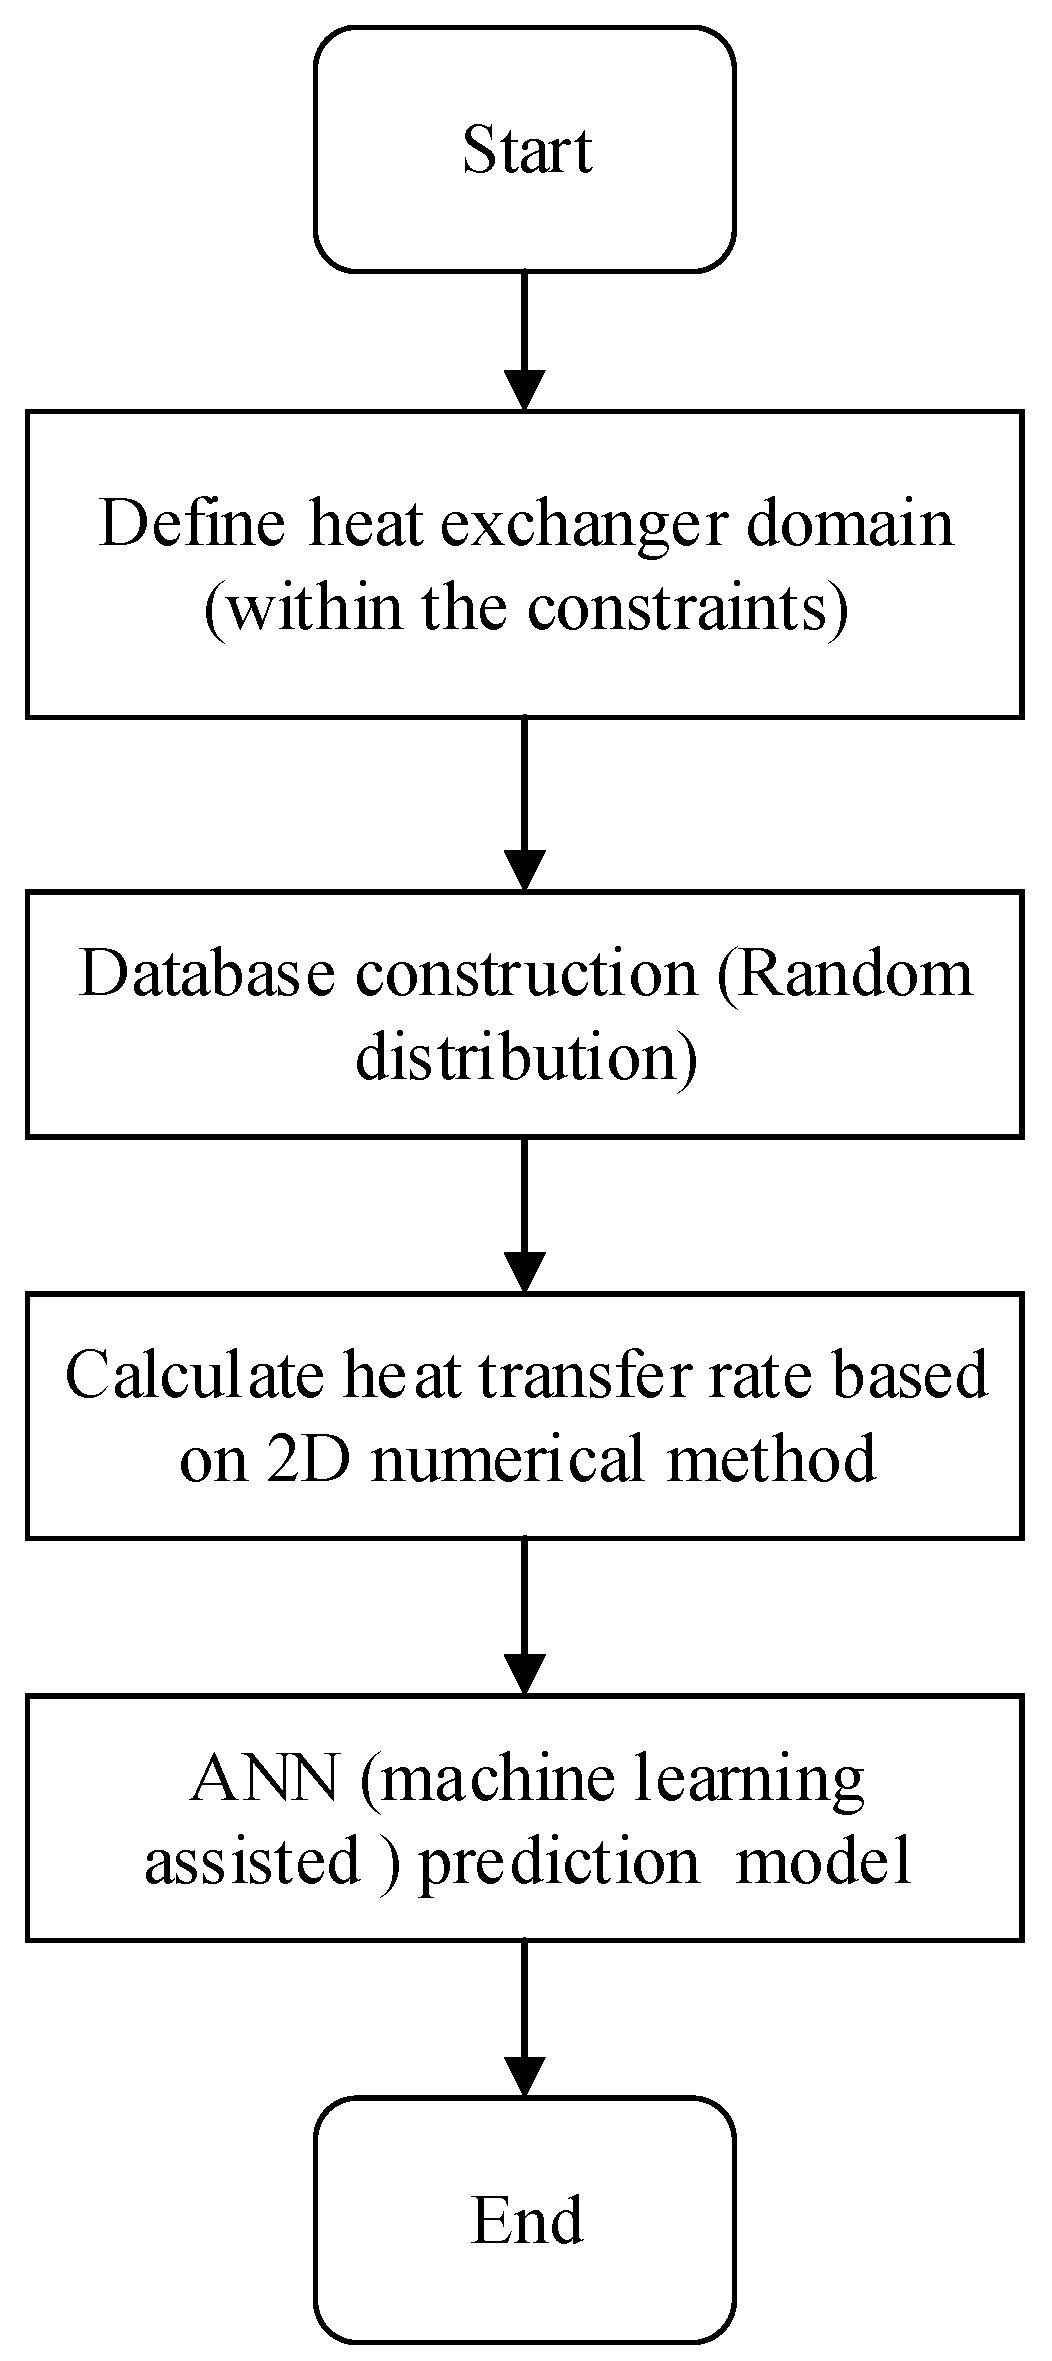
Figure 6.
Impact of layers on the computational efficiency and predictive accuracy of the ANN.
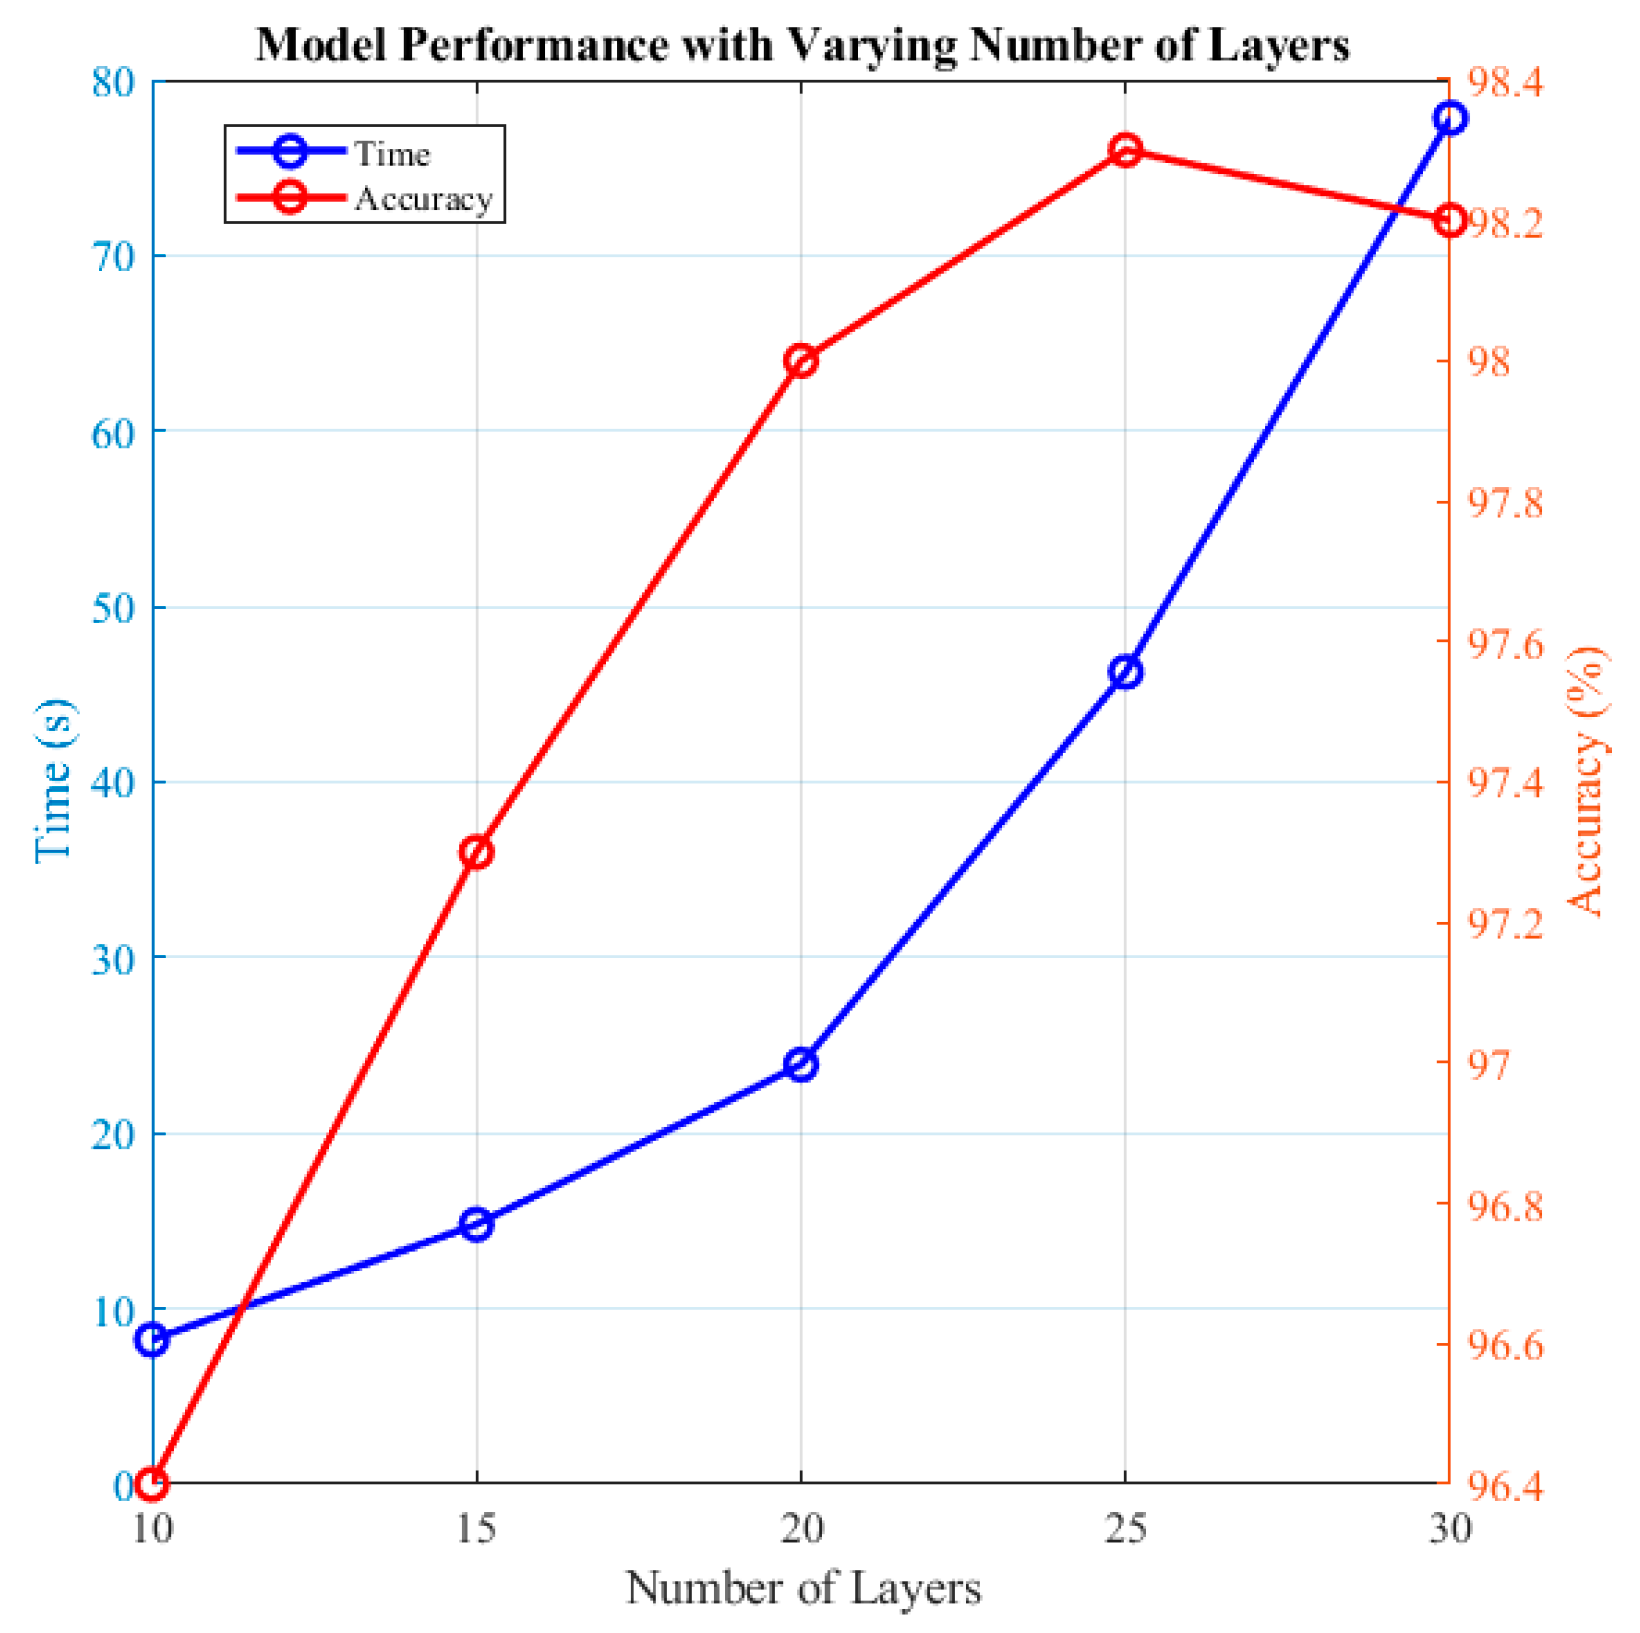
Figure 7.
Machine learning model’s predicted and actual values with a 5% error bar.
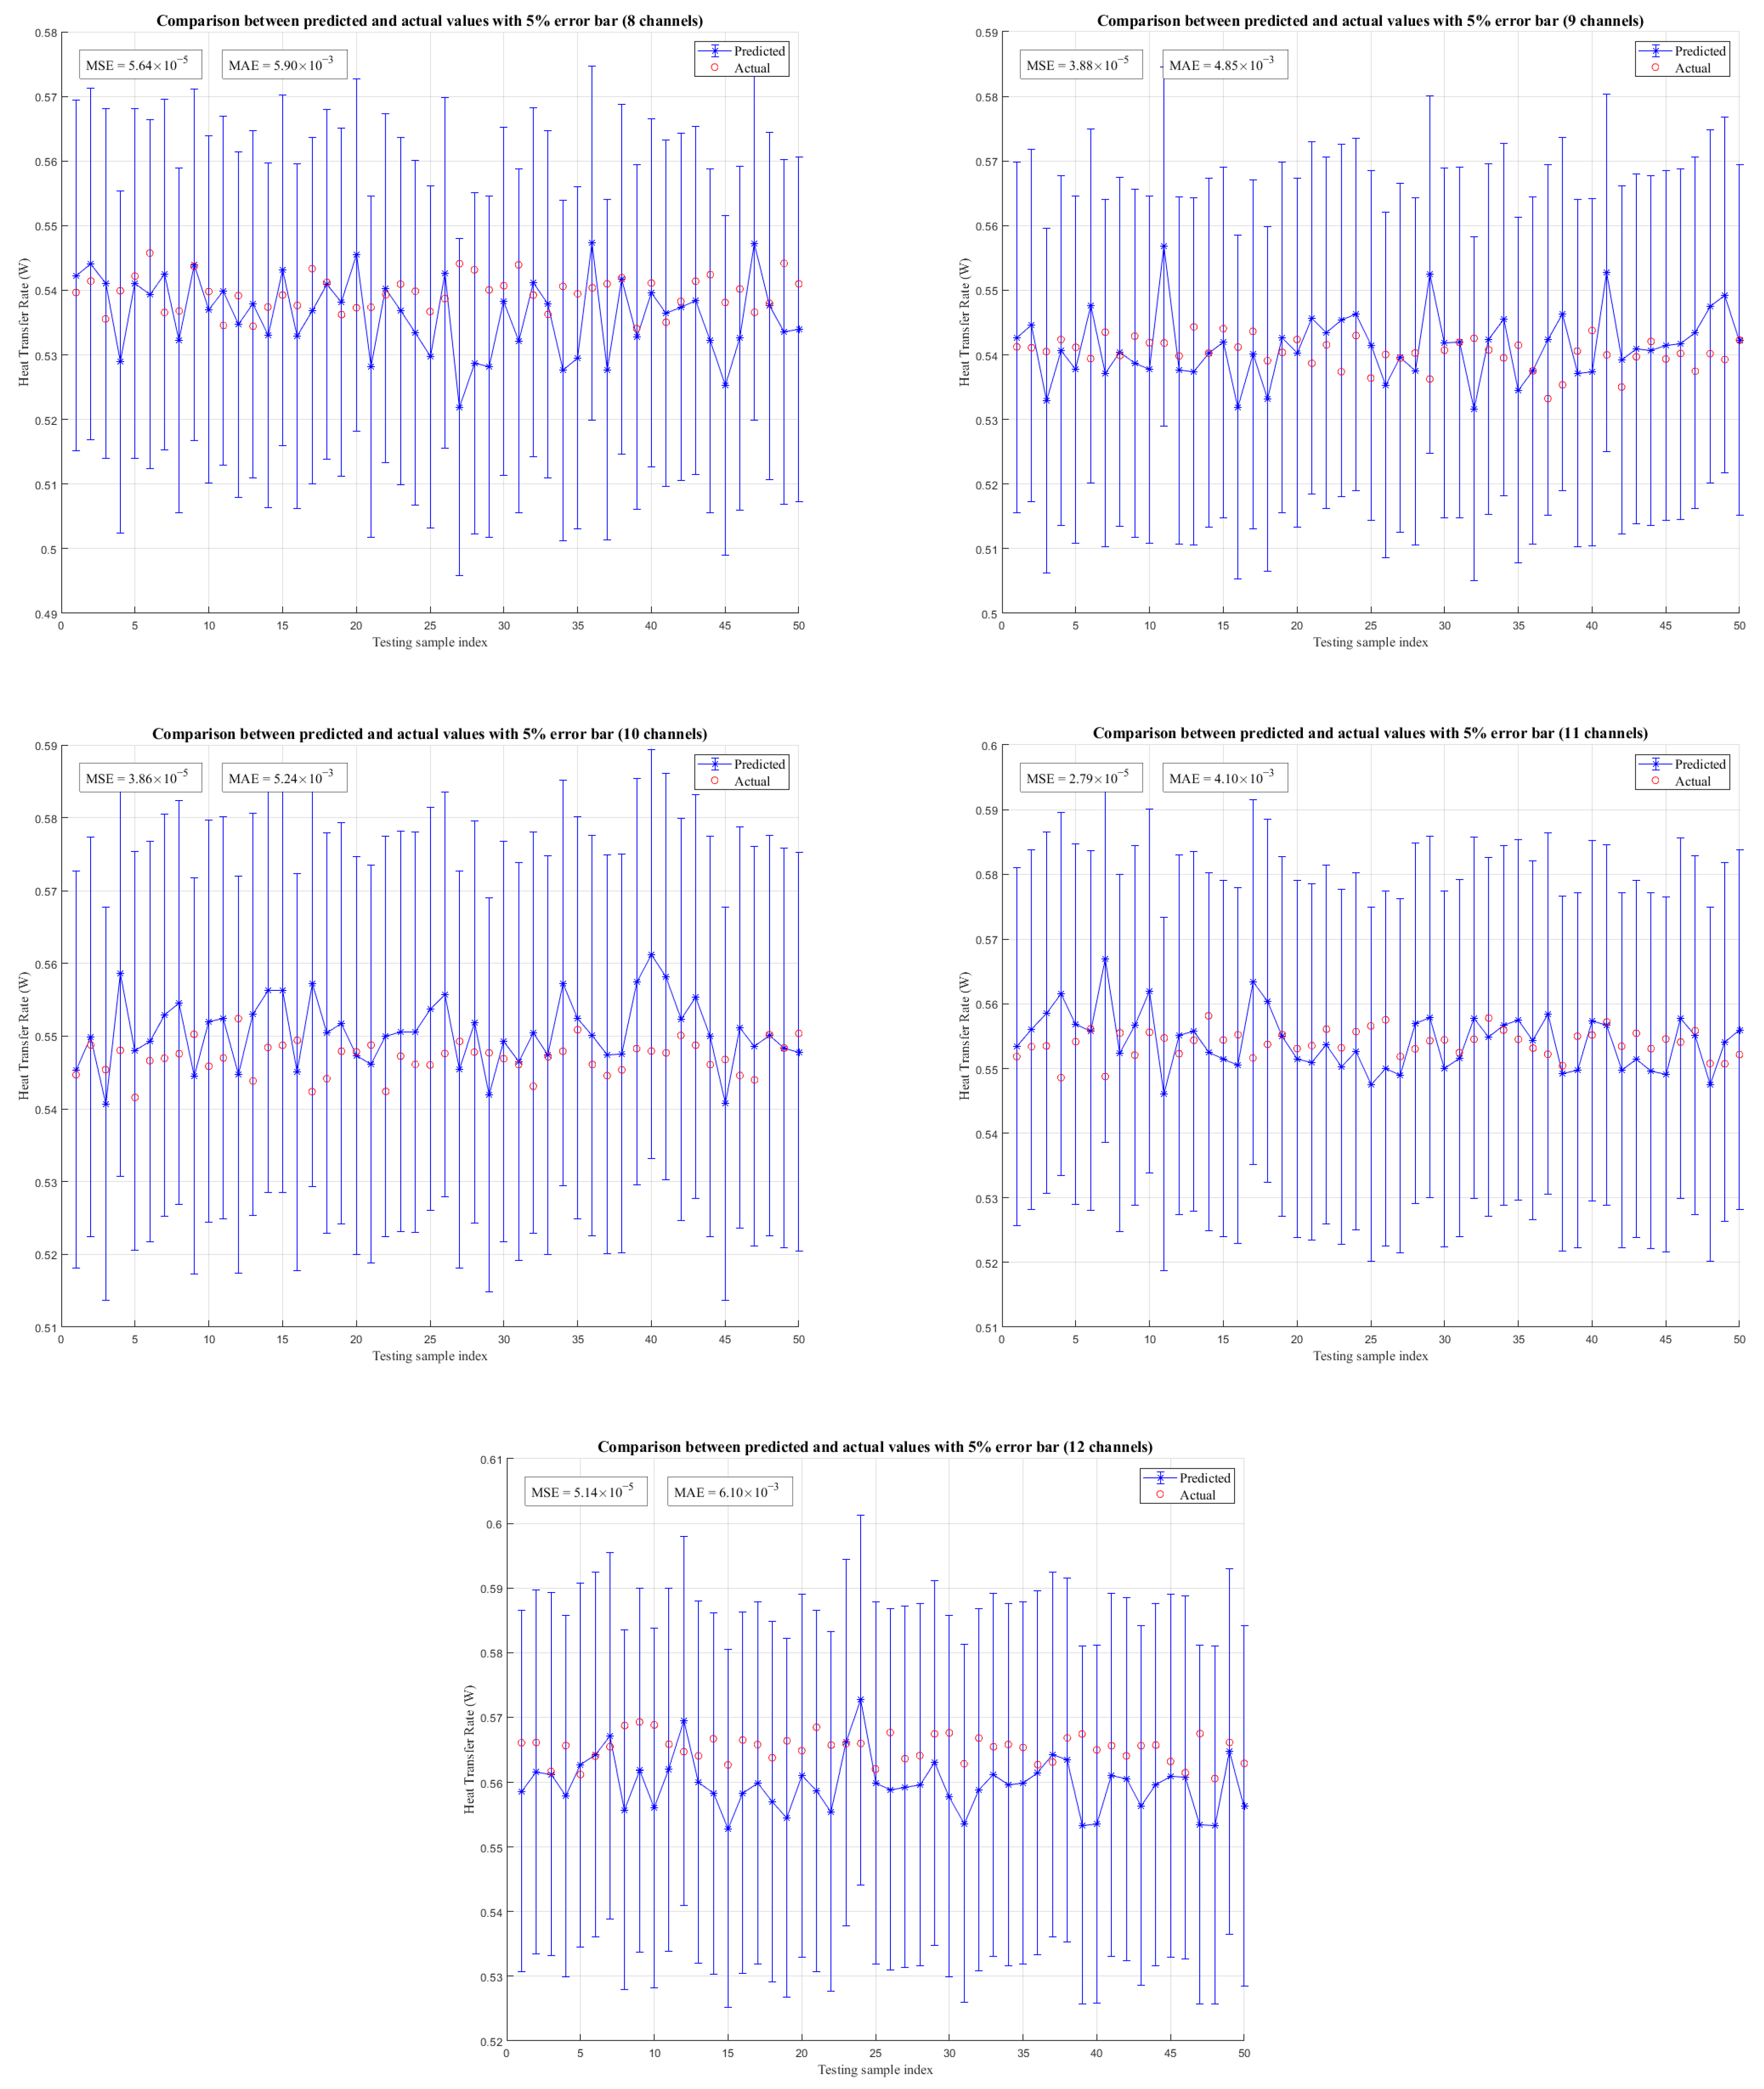
Figure 8.
The comparison of the Pareto results for the predicted and actual values.

Figure 9.
Multi-objective optimization process.

Figure 10.
(a) The channel-side baseline of the microchannel heat exchanger; (b) calculation unit parameters employed in the optimization process [17].
Figure 10.
(a) The channel-side baseline of the microchannel heat exchanger; (b) calculation unit parameters employed in the optimization process [17].
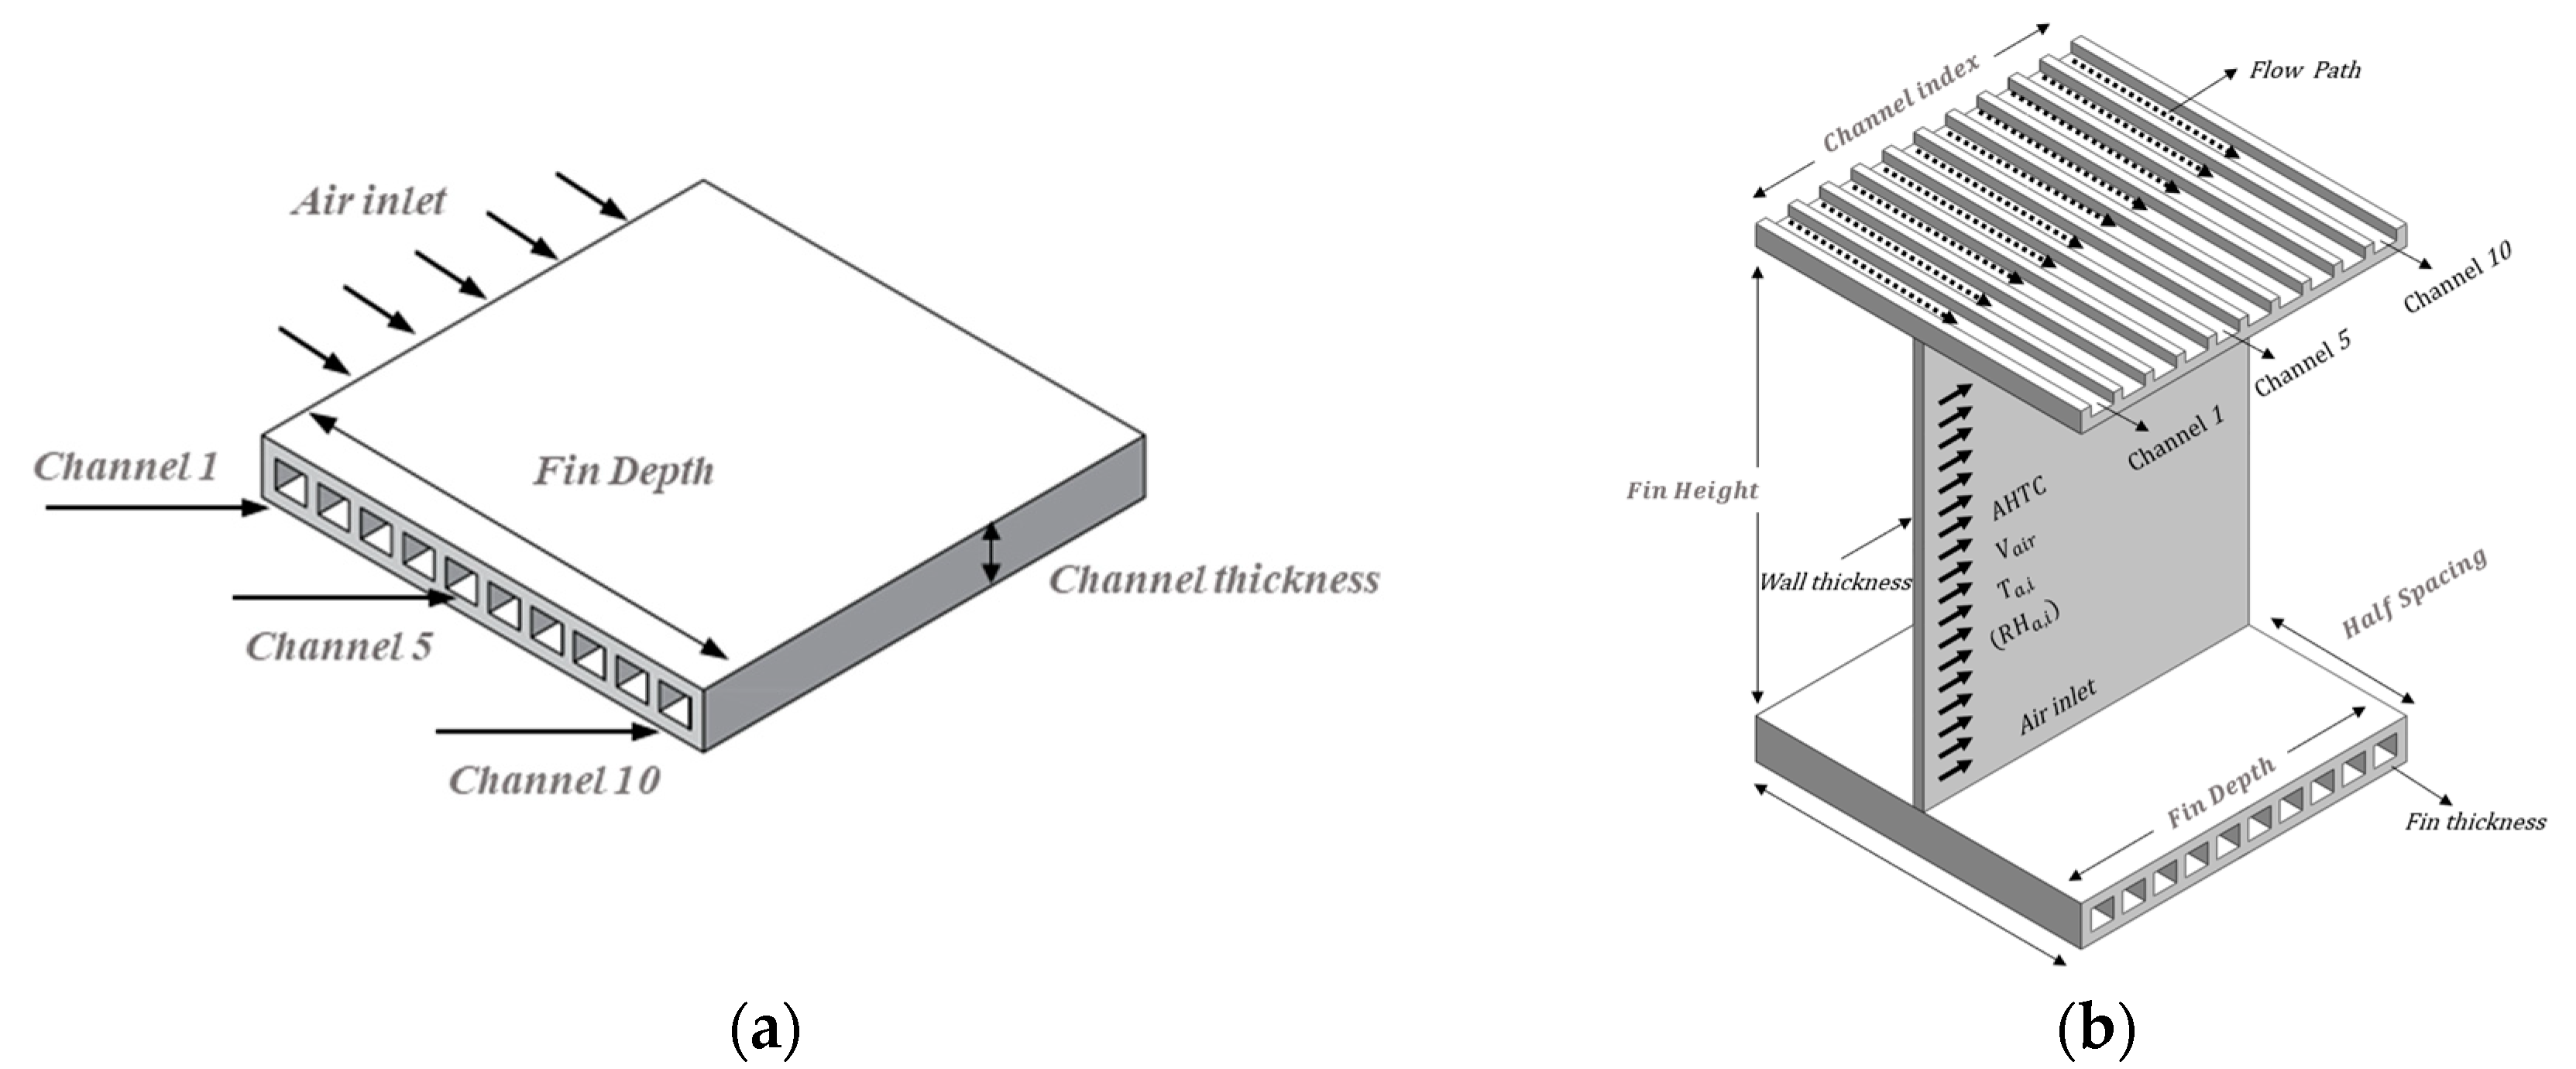
Figure 11.
The heat transfer rate and pressure drop along with the air inlet of each channel of the baseline.
Figure 11.
The heat transfer rate and pressure drop along with the air inlet of each channel of the baseline.

Figure 12.
The Pareto front of the heat transfer rate and pressure drop.

Figure 13.
(a) The Pareto front of the refrigerant heat transfer coefficient and pressure drop; (b) Pareto front of the inverse of the refrigerant convective thermal resistance and pressure drop.
Figure 13.
(a) The Pareto front of the refrigerant heat transfer coefficient and pressure drop; (b) Pareto front of the inverse of the refrigerant convective thermal resistance and pressure drop.

Figure 14.
The optimized case comparison analysis of the heat transfer rate along with the air inlet of each channel (baseline case and optimized result).
Figure 14.
The optimized case comparison analysis of the heat transfer rate along with the air inlet of each channel (baseline case and optimized result).
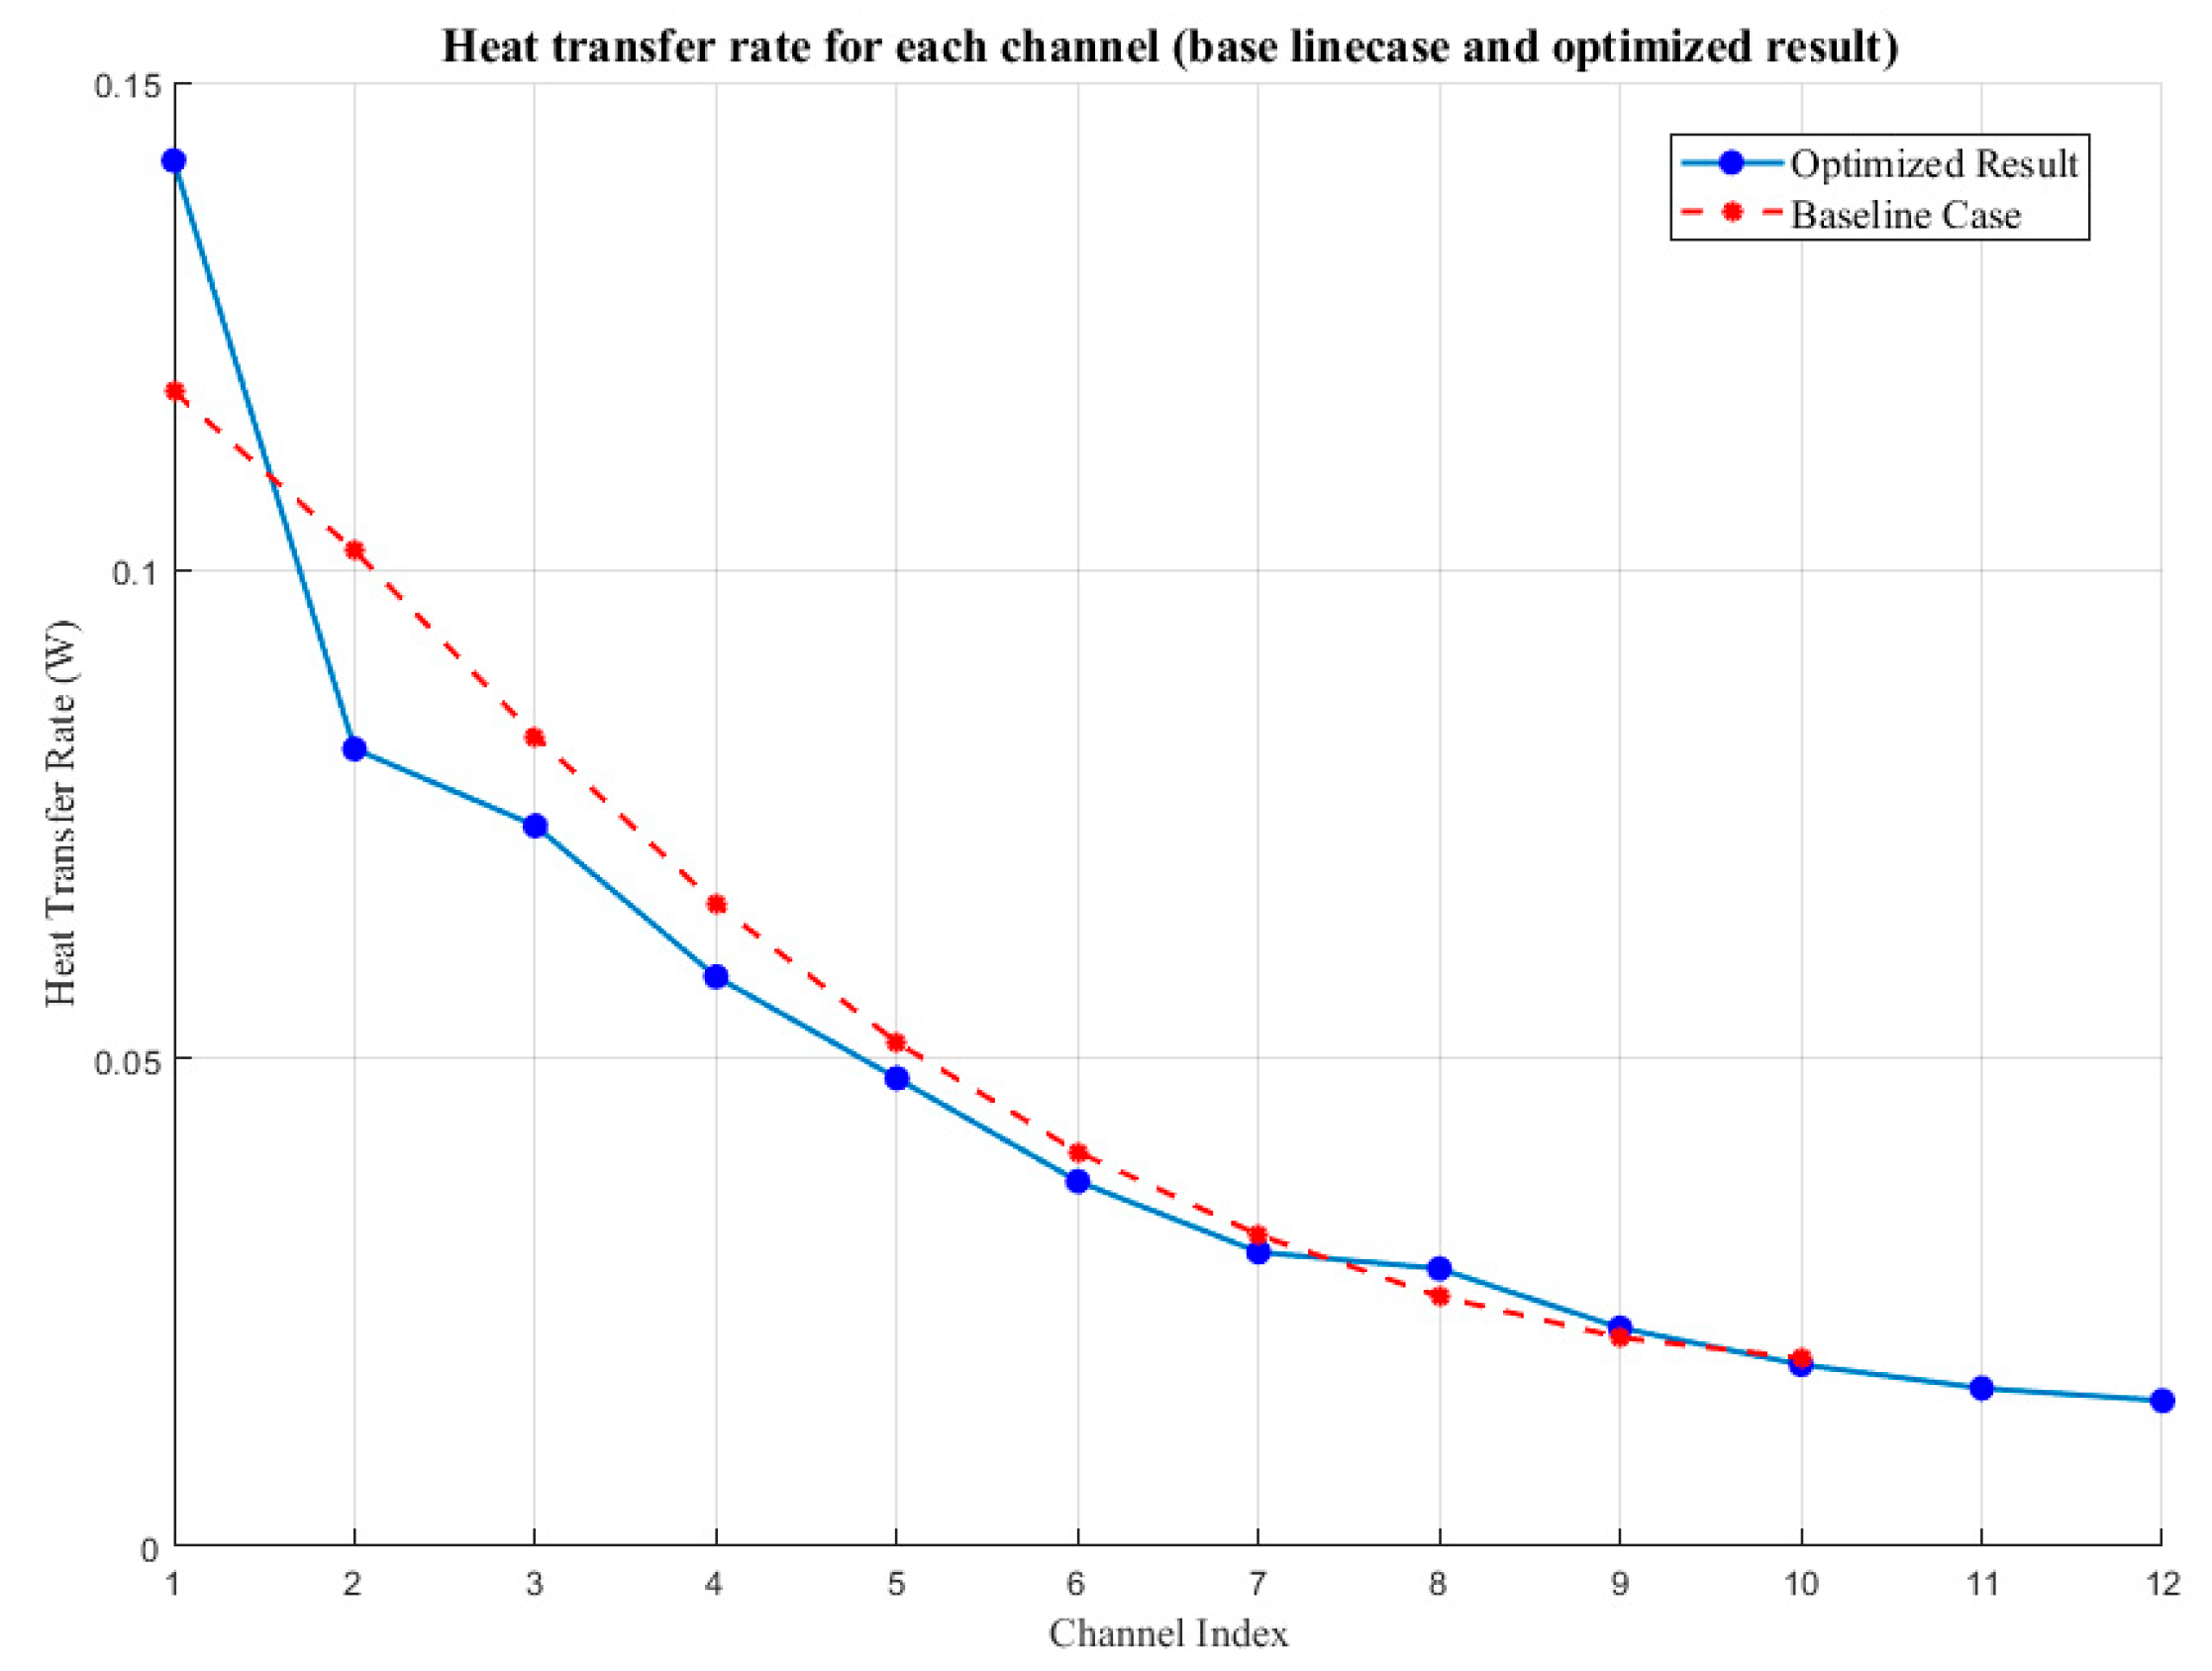
Figure 15.
(a) The relationship between the wetted perimeter and heat transfer rate; (b) relationship between the mass flow rate and heat transfer rate.
Figure 15.
(a) The relationship between the wetted perimeter and heat transfer rate; (b) relationship between the mass flow rate and heat transfer rate.


Table 1.
Baseline microchannel heat exchanger unit (10 channels).
| Metric | Unit | Value |
|---|---|---|
| Fin height | m | 0.01 |
| AHTC | KW/m2 K | 0.06104 |
| m/s | 1.5 | |
| K | 300 | |
| Fin depth | m | 0.02 |
| Kg/s | 1.0 × 10⁻⁴ (total) | |
| K | 350 | |
| RHTC | KW/m2 K | 8.6521 |
| Half spacing | m | 2.955 × 10⁻⁴ |
| Refrigerant vapor quality | - | 0.5 |
| Fin thickness | m | 0.0001 |
| Wall thickness | m | 0.0005 |
| Material (aluminum) | - | - |
Table 2.
Geometric constraints on the number of different channels.
| 8 | 9 | 10 | 11 | 12 | |
|---|---|---|---|---|---|
| Hydraulic diameter (hyd) (mm) | 0.1–1.7 | 0.1–1.6 | 0.1–1.4 | 0.1–1.3 | 0.1–1.2 |
| Cross-sectional area (A) (mm2) | 0.4–2.4 | 0.4–2.2 | 0.4–2.0 | 0.4–1.8 | 0.4–1.6 |
Table 3.
Three multi-objectives’ optimization scenarios.
| Scenario No. | Objective 1 | Objective 2 |
|---|---|---|
| A | Maximize heat transfer rate | Minimize pressure drop |
| B | Maximize refrigerant heat transfer coefficient | Minimize pressure drop |
| C | Minimize heat transfer resistance | Minimize pressure drop |
Table 4.
Comparison of the computational times between the machine learning and numerical models.
| Calculation Time | |
|---|---|
| Numerical model | 25.92 s (average) |
| ANN model | 0.41 s (average) |
Disclaimer/Publisher’s Note: The statements, opinions and data contained in all publications are solely those of the individual author(s) and contributor(s) and not of MDPI and/or the editor(s). MDPI and/or the editor(s) disclaim responsibility for any injury to people or property resulting from any ideas, methods, instructions or products referred to in the content. |
© 2023 by the authors. Licensee MDPI, Basel, Switzerland. This article is an open access article distributed under the terms and conditions of the Creative Commons Attribution (CC BY) license (https://creativecommons.org/licenses/by/4.0/).
Share and Cite
MDPI and ACS Style
Huang, L.; Zou, J.; Liu, B.; Jin, Z.; Qian, J. Machine Learning Assisted Microchannel Geometric Optimization—A Case Study of Channel Designs. Energies 2024, 17, 44. https://doi.org/10.3390/en17010044
AMA Style
Huang L, Zou J, Liu B, Jin Z, Qian J. Machine Learning Assisted Microchannel Geometric Optimization—A Case Study of Channel Designs. Energies. 2024; 17(1):44. https://doi.org/10.3390/en17010044
Chicago/Turabian StyleHuang, Long, Junjia Zou, Baoqing Liu, Zhijiang Jin, and Jinyuan Qian. 2024. "Machine Learning Assisted Microchannel Geometric Optimization—A Case Study of Channel Designs" Energies 17, no. 1: 44. https://doi.org/10.3390/en17010044
Note that from the first issue of 2016, this journal uses article numbers instead of page numbers. See further details here.