1. Introduction
Poor air quality in Poland and other countries of the European Union is largely attributed to high concentrations of volatile dust, including monitored PM
2.5 and PM
10. In the year 2020, as much as 96% of the urban populace encountered levels of fine particulate matter (PM
2.5) exceeding the World Health Organization’s recommended threshold of 5 µg/m
3 [
1,
2]. Dust emissions are particularly high in winter, when solid fuel boilers become the main source of emissions.
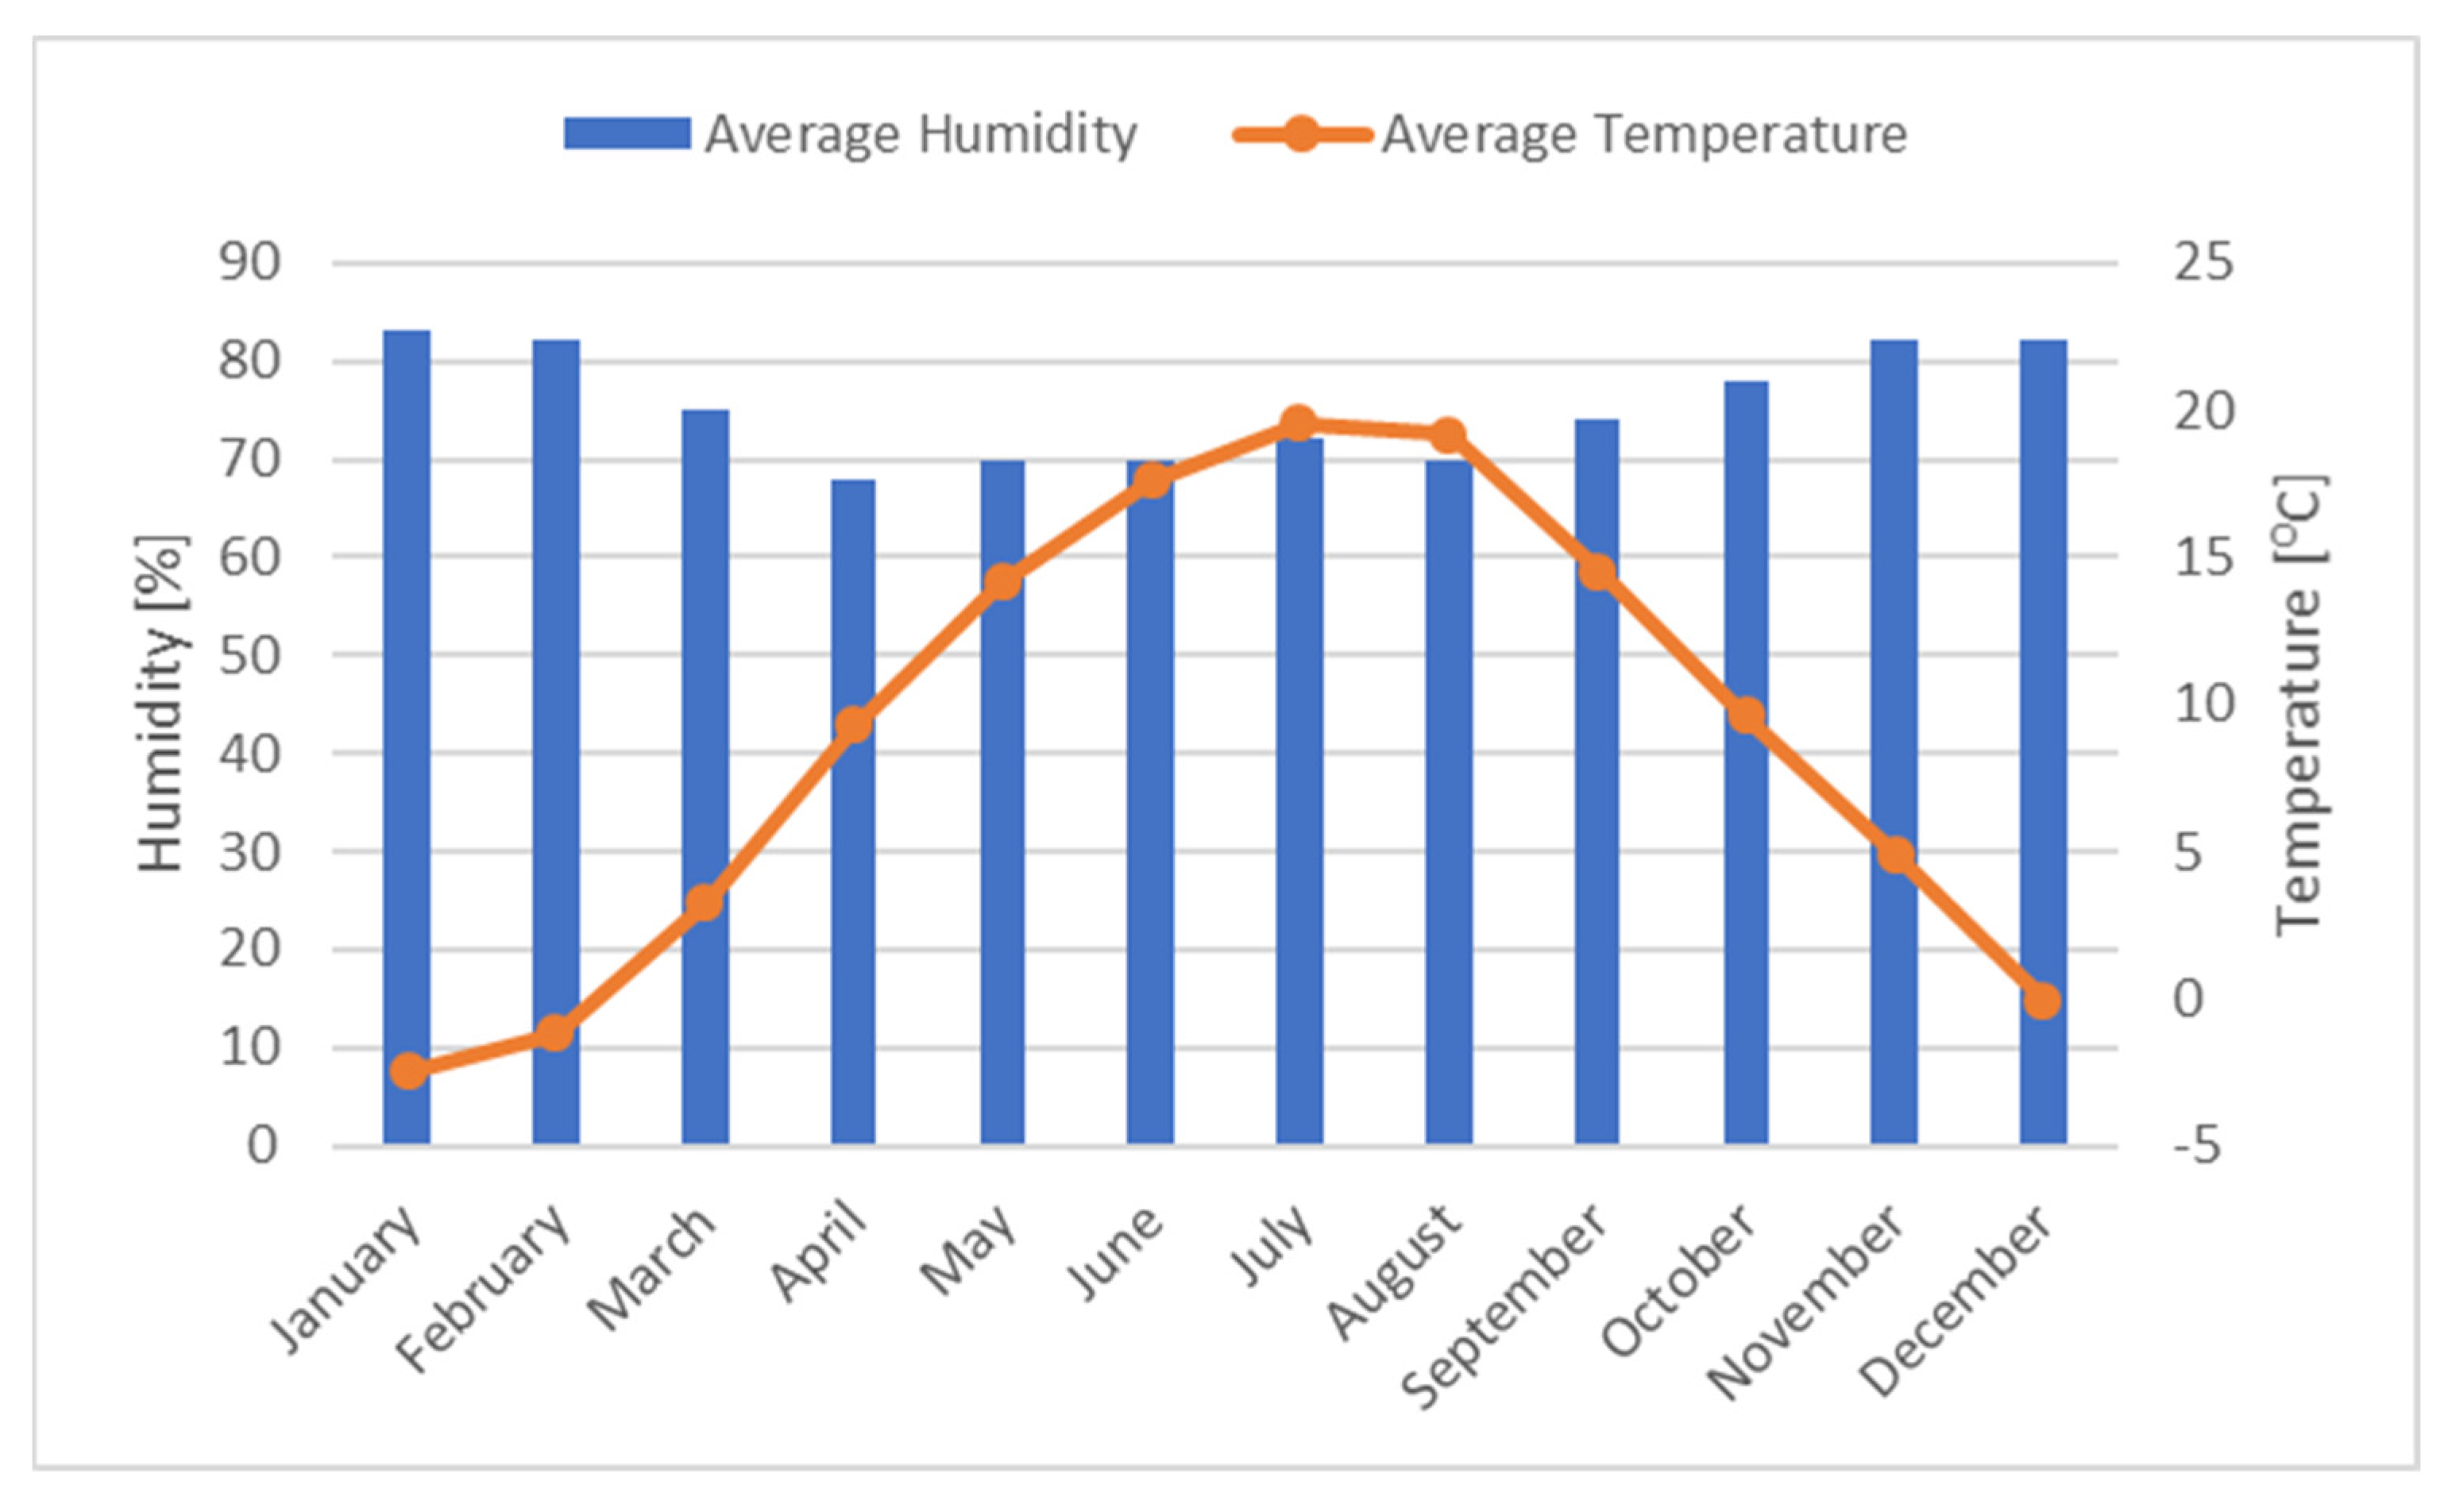
Figure 1 graphically shows the average values of dust in the ambient air at the air quality monitoring station in Rzeszow [
3]. As can be seen, the problem of high concentrations of particulate matter is related to the winter season. However, this does not mean that the problem is exclusive to the winter season. Sources of particulate emissions also include vehicles, especially vehicles with diesel engines [
4,
5], which, in addition to releasing dust from the abrasion of the tires, the road surface, clutch friction materials, or brakes, emit significant amounts of particulate matter in the engine exhaust [
6,
7]. In addition, internal combustion engines are a major source of NO
X emissions in urban areas [
2,
7]. The dependencies of changes in air pollutant concentrations are proportional to traffic intensity [
8]. The problem of engine exhaust emissions depends on many factors, including those related to road resistance and driving cycle [
9,
10]. It is important to introduce solutions in urban transportation to improve the energy efficiency of the transportation system. [
11]. The issue of particulate emissions from vehicular sources is addressed by the proposed Euro 7 vehicle emission standard [
12]. As predicted by previous projections [
13], the Euro 7 standards are poised to become the pioneering global emissions regulations, surpassing the scope of merely controlling exhaust emissions. These standards will introduce further constraints on particulate emissions originating from brakes, along with guidelines for addressing microplastic emissions originating from tires. The rules will apply to all vehicles, including electric vehicles. The solutions being introduced to improve the operation of transport in urban areas in terms of environmental impact [
14] are also related to reducing the emissions of other pollutants, including greenhouse gases [
15], which is particularly important in view of the problem of global warming and observed climate change [
16]. In addition, reductions in nitrogen oxide emissions are important due to their harmfulness to the environment and efforts to reduce the risk of photochemical smog [
17].
At the same time, air pollution has become an important criterion affecting human health. It also has a significant impact on the health of the exposed population. It is becoming important to ensure clean air, which is increasingly affecting inequalities in health, both locally and globally. Unsatisfactory air quality involves significant social and economic deficits but can be avoided by coordinated action [
18].
It should be noted that a person inhales, in relation to their level of activity, about 10–20 m
3 of air per day of life, and with the air, various types of pollutants also enter the body. The body’s reaction to toxic factors can vary in nature [
19]:
Strong, caused by a single introduction of a large dose of toxins into the body;
Chronic, caused by the long-term introduction of small doses of toxins into the body;
Imperceptible; the effects of introducing toxins into the body can manifest themselves only after a certain period of time.
When analyzing the individual effects of PM
10 dust on human health, it should be noted that it directly affects the development and exacerbation of respiratory diseases associated with pulmonary and bronchial obstruction. Exposure to PM
10 can cause inflammation in the lower respiratory tract, leading to symptoms analogous to asthma and chronic obstructive pulmonary disease (COPD) [
18]. A study carried out in several European cities indicated that an increase in PM
10 concentration leads to an increase in asthma incidence of 1.2% for the age group 0–14 years and 1.1% in the 15–64 age group. In the case of the incidence of COPD in people 65 years and older, it increases by 1.0% [
20].
There is also no doubt that PM
2.5 and PM
10 particulate matters also have a carcinogenic effect [
21,
22]. Exposure to PM
10 is associated with an increased risk of relative lung cancer development of 1.22 per 10 μg/m
3 increase in its concentration in the air [
23]. PM
10 also has a negative impact on the circulatory system, but this impact is smaller than that of PM
2.5 [
24]. As research shows, an increase in PM
10 concentration by 21 μg/m
3 results in a risk of developing atherosclerosis increasing by approximately 4%, because PM10 dust always contains smaller particles (including PM
2.5), according to WHO data. PM
10 dust also has the ability to penetrate the bloodstream, and its increased concentration in the air can cause a higher number of deaths from cardiovascular causes [
25,
26].
Nitrogen oxides enter the human body through inhalation and are adsorbed through the tissue of the respiratory system into the circulatory system. In recent years, the negative health effects of short- and long-term exposure to elevated NO
2 concentrations have been confirmed. The relevant studies clearly indicated a relationship between short-term exposure to NO
2 and respiratory symptoms. The most common symptoms were pneumonia, worsening of symptoms in patients with asthma, and worsening of allergic reactions in the airways [
27]. In the case of prolonged exposure to NO
2 in children, there was a high probability of developing asthma [
28].
In conclusion of the health aspect, it should be noted that scientific research shows that a reduction in particulate matter by 10 μg/m
3 after 10 years results in a 27% reduction in the number of deaths from cardiovascular diseases [
29]. Furthermore, it has been proven that reducing the average annual concentration of PM
2.5 to 15 μg/m
3 could extend useful life by 1 month to 2 years [
30]. Therefore, reducing the emission of harmful dust is also important from the perspective of the health of the society living in a given area.
One of the EU initiatives includes a project executed in Rzeszow, titled “Development of a Low-Emission Economy and improvement of the mobility of residents by improving sustainable public transportation in the ROF.” This undertaking aims to replace the aging bus fleet with new buses that adhere to low-emission standards. The project encompasses the Rzeszow Functional Area and involves nine municipalities. The endeavor encompassed various components, such as the procurement of 54 novel low-emission passenger buses, and the revitalization of 233.3 km of public transportation routes (achieved by constructing new road connections and bridges, as well as refurbishing road infrastructure). It also involved the establishment of bus stops, bus bays, sidewalks, and bus shelters, along with the accompanying infrastructure. Furthermore, the initiative included the creation of 11 park-and-ride parking facilities, offering a total of 481 parking spaces, including 31 designated for individuals with disabilities. The renovation of bus and train stations, along with the establishment of an interchange center to facilitate seamless transfers, was also part of the plan. Additionally, the project encompassed the construction of bicycle paths spanning a total length of 12.45 km, accompanied by 13 “Bike & Ride” parking facilities. The scope also extended to the establishment of technical facilities like workshop buildings, bus washing facilities, and supporting infrastructure.
The purpose and novelty of this article is to present the benefits of reducing the emissions of particulate matter and nitrogen oxides, associated with the replacement of the old-type city bus fleet with new low-emission buses of the EURO 6 emission class. Furthermore, the reduction in the emissions of the pollutants analyzed, associated with the construction of parking lots of the P&R system, was taken into account, because drivers leave their personal cars in places outside of Rzeszów and use public transport while traveling to work in Rzeszów. In addition, a comparison of vehicle emissions results with emissions from solid-fuel central heating and hot water boilers used in single-family homes is presented.
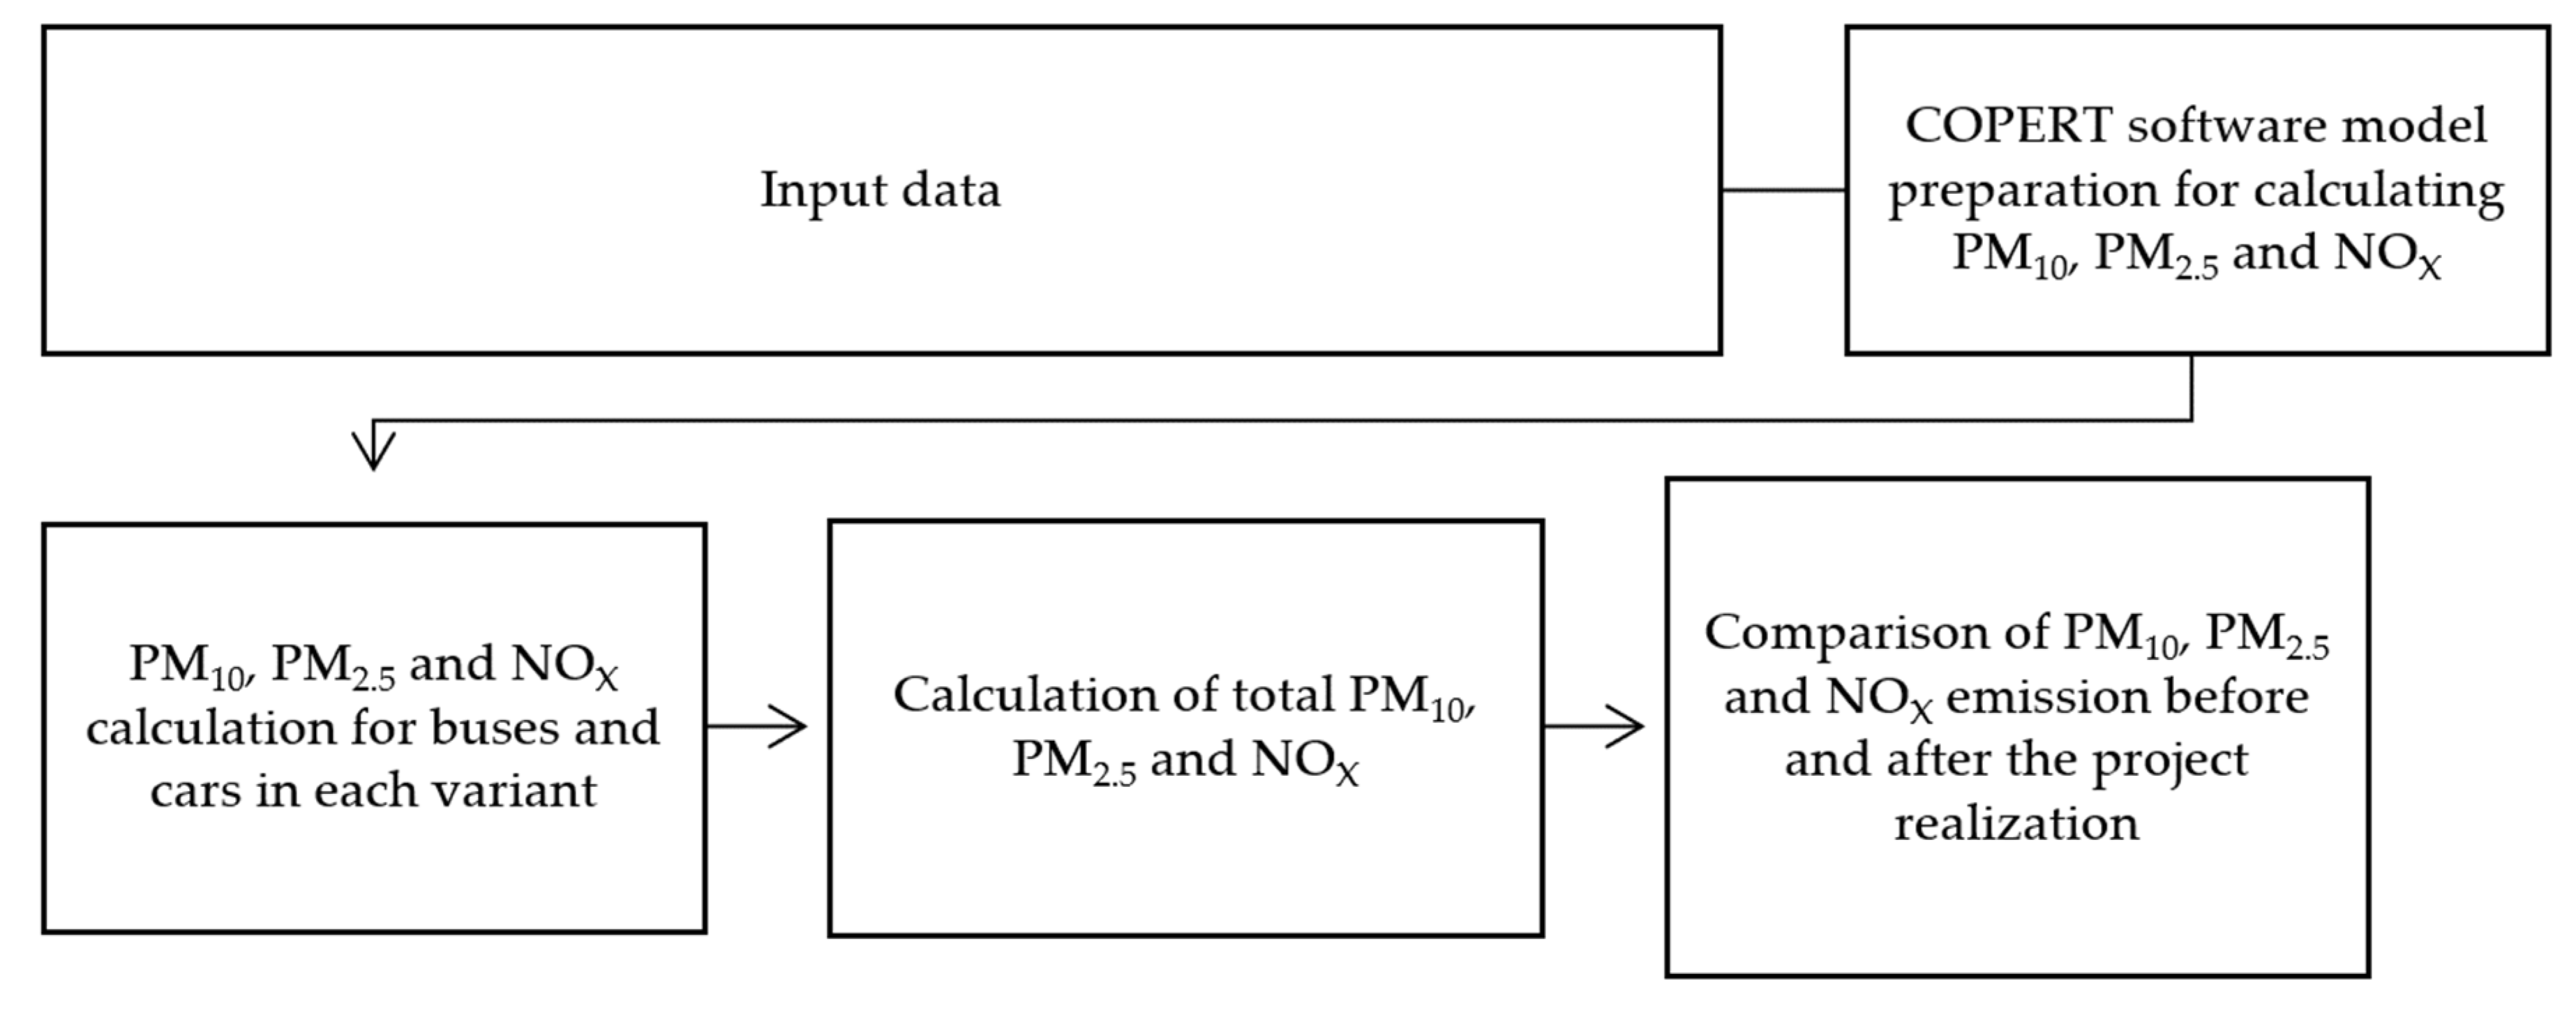
This research employed actual data for all bus traffic calculations, and emissions assessments were conducted using the COPERT Version 5.6.5 software suite. The study introduces a novel approach for assessing the repercussions of transitioning from an aging bus fleet to a modern counterpart, a method that can readily find application in analogous scenarios within other European urban contexts. An overview of the study’s framework is depicted in
Figure 2.
2. Research Background
The use of modern propulsion systems in urban buses is crucial in the context of the implementation of European Union projects and policies, in particular, the European Green Deal [
31]. The use of low-emission, renewable-based city buses is also crucial to achieving sustainable public transport goals [
32]. A study of this type, which compared the use of, e.g., electric buses as a replacement for older generation propulsion, is described in the paper [
33]. Buses of this type are an effective means of reducing emissions of, e.g., PM and NOx. The use of modern bus designs and propulsion systems also contributes to the reduction in noise in congested areas [
34]. As an example of the issues described above, there is also a paper, [
35], in which the authors describe different strategies for the development of urban transport with a view to its electrification in the city of Szczecin, Poland. In this paper, three hypotheses are tested which describe the introduction of zero-emission buses into urban transport for different scopes of implementation. Another article dealing with the decomposition of public transport in Poland over the years is [
36], in which the authors describe the development of different public transport strategies in Poland over the years 1990–2020, highlighting socioeconomic, environmental, and technological aspects.
A key issue in the modernization of existing transport systems in modern cities is the integration of different means of public transport to reduce energy consumption and vehicle emissions. Currently, a lot of research and work is being conducted on efficient interchange plans that enable a seamless combination of different modes of transport. This is essential to encourage people to use public transport, among other things. According to a study by Transport for London (2018), the introduction of integrated ticketing and payment systems has significantly increased public transport and reduced CO
2 emissions by 180,000 t per year [
37]. A Chinese study shows that the integration of different modes of public transport has also contributed to a 3.5% annual increase in employment in the transport sector [
38].
The decomposition of the bus fleet structure in urban agglomerations is currently being carried out around the world. These studies provide a wealth of information on the differences in emissions from different fuel types and vehicle propulsion systems. In general, buses powered by petrol or diesel engines emit a higher amount of, e.g., particulates and nitrogen oxides compared to hydrogen [
39]. However, the use of modern solutions for these buses and the use of other alternative fuels, e.g., CNG, helps to reduce the emissions of toxic compounds, in order to reduce their impact on the health of city dwellers as much as possible. An example of a paper that addresses the implementation of CNG-powered buses is [
40], where the authors show how the introduction of CNG has reduced the impact of bus emissions on air pollution in Delhi, India.
It is also important to use different emission forecasting models to predict the potential of different bus fleet decomposition strategies as an effective tool to reduce air pollution. Through such analyses, multiple scenarios can be tested to determine the optimum strategy for sustainable public transport, thus contributing to emission reduction targets in line with transport policies in different parts of the world. An example of such work is, e.g., [
41], where the authors analyze the introduction of HEVs and BEVs and their impact on emission reductions for CO, NOx, and PM using the calculation method of the HBEFA model.
The topic addressed is very important in the context of the current literature review and can be an important contribution to the further development of different bus fleet decomposition strategies. Studies by the WHO (World Health Organisation) and other health organizations provide important epidemiological data to estimate the reduction in morbidity and mortality as a result of improved air quality. For example, a WHO (2018) report showed that a reduction in PM
2.5 concentrations by 10 μg/m
3 could reduce deaths from respiratory diseases by approximately 15% in cities [
42].
3. Research Methodology
The existing emission models are categorized into two distinct types:
Models that utilize traffic parameters such as acceleration, braking, continuous driving, and idling, functioning at the microscale and mesoscale levels.
Models founded on the average speed of a vehicle, primarily employed at the macro level.
Macro-scale models primarily rely on the average speed parameter of the specific road section(s) under analysis [
43]. These models are instrumental in approximating both fuel consumption and the ecological footprint of road transportation. They enable the assessment of the overall energy consumption attributed to road infrastructure development initiatives and strategies, as well as the evaluation of the ecological ramifications pertaining to greenhouse gas emissions within the study region. The environmental effects can span local, regional, or even global domains, encompassing both short- and long-term implications. Macro-scale emission models facilitate the quantification of the extensive impact of transportation, whether on a regional scale or within a designated transportation corridor.
For the purpose of calculating emissions, the most commonly used method for project evaluation is the use of COPERT software [
44,
45]. COPERT is a model for macro-scale emissions calculations based on European data using the distance traveled, vehicle type, emission class, driving speed, load, humidity, and air temperature [
46].
The mass of pollutants emitted in the COPERT model is calculated according to Equation (1):
where:
Ei—emissions of the exhaust component i (g);
FCj,m—fuel consumption of vehicle of category j, for fuel m (kg);
EFi,j,m—emission factor of component i for vehicle category j and fuel m (g/kg).
This model encompasses a range of fuels, including diesel, gasoline, CNG, and LPG. The current methodology employed in macro-scale emission models for assessing the quantity of detrimental exhaust constituents is characterized by two fundamental calculations. The initial step involves the selection of a set of emission factors that dictate emissions based on specific traffic conditions, while the subsequent stage entails the evaluation of vehicular activity within the designated study area. Emission levels are derived by multiplying the outcomes of these two stages.
Consequently, the COPERT emissions calculator was employed to evaluate the implications of replacing the aging bus fleet with a newer one, focusing on the municipality of Rzeszow. The project also encompasses the establishment of park-and-ride (P&R) facilities situated in suburban regions.
Within the study, two distinct scenarios, denoted as variants, were examined:
V0: This serves as a counterfactual scenario, considering emissions from the old bus fleet (accounting for no P&R service and additional passenger car trips).
V1: Represents the existing scenario, encompassing emissions from the novel low-emission bus fleet (excluding any additional passenger car trips due to the presence of the current P&R service).
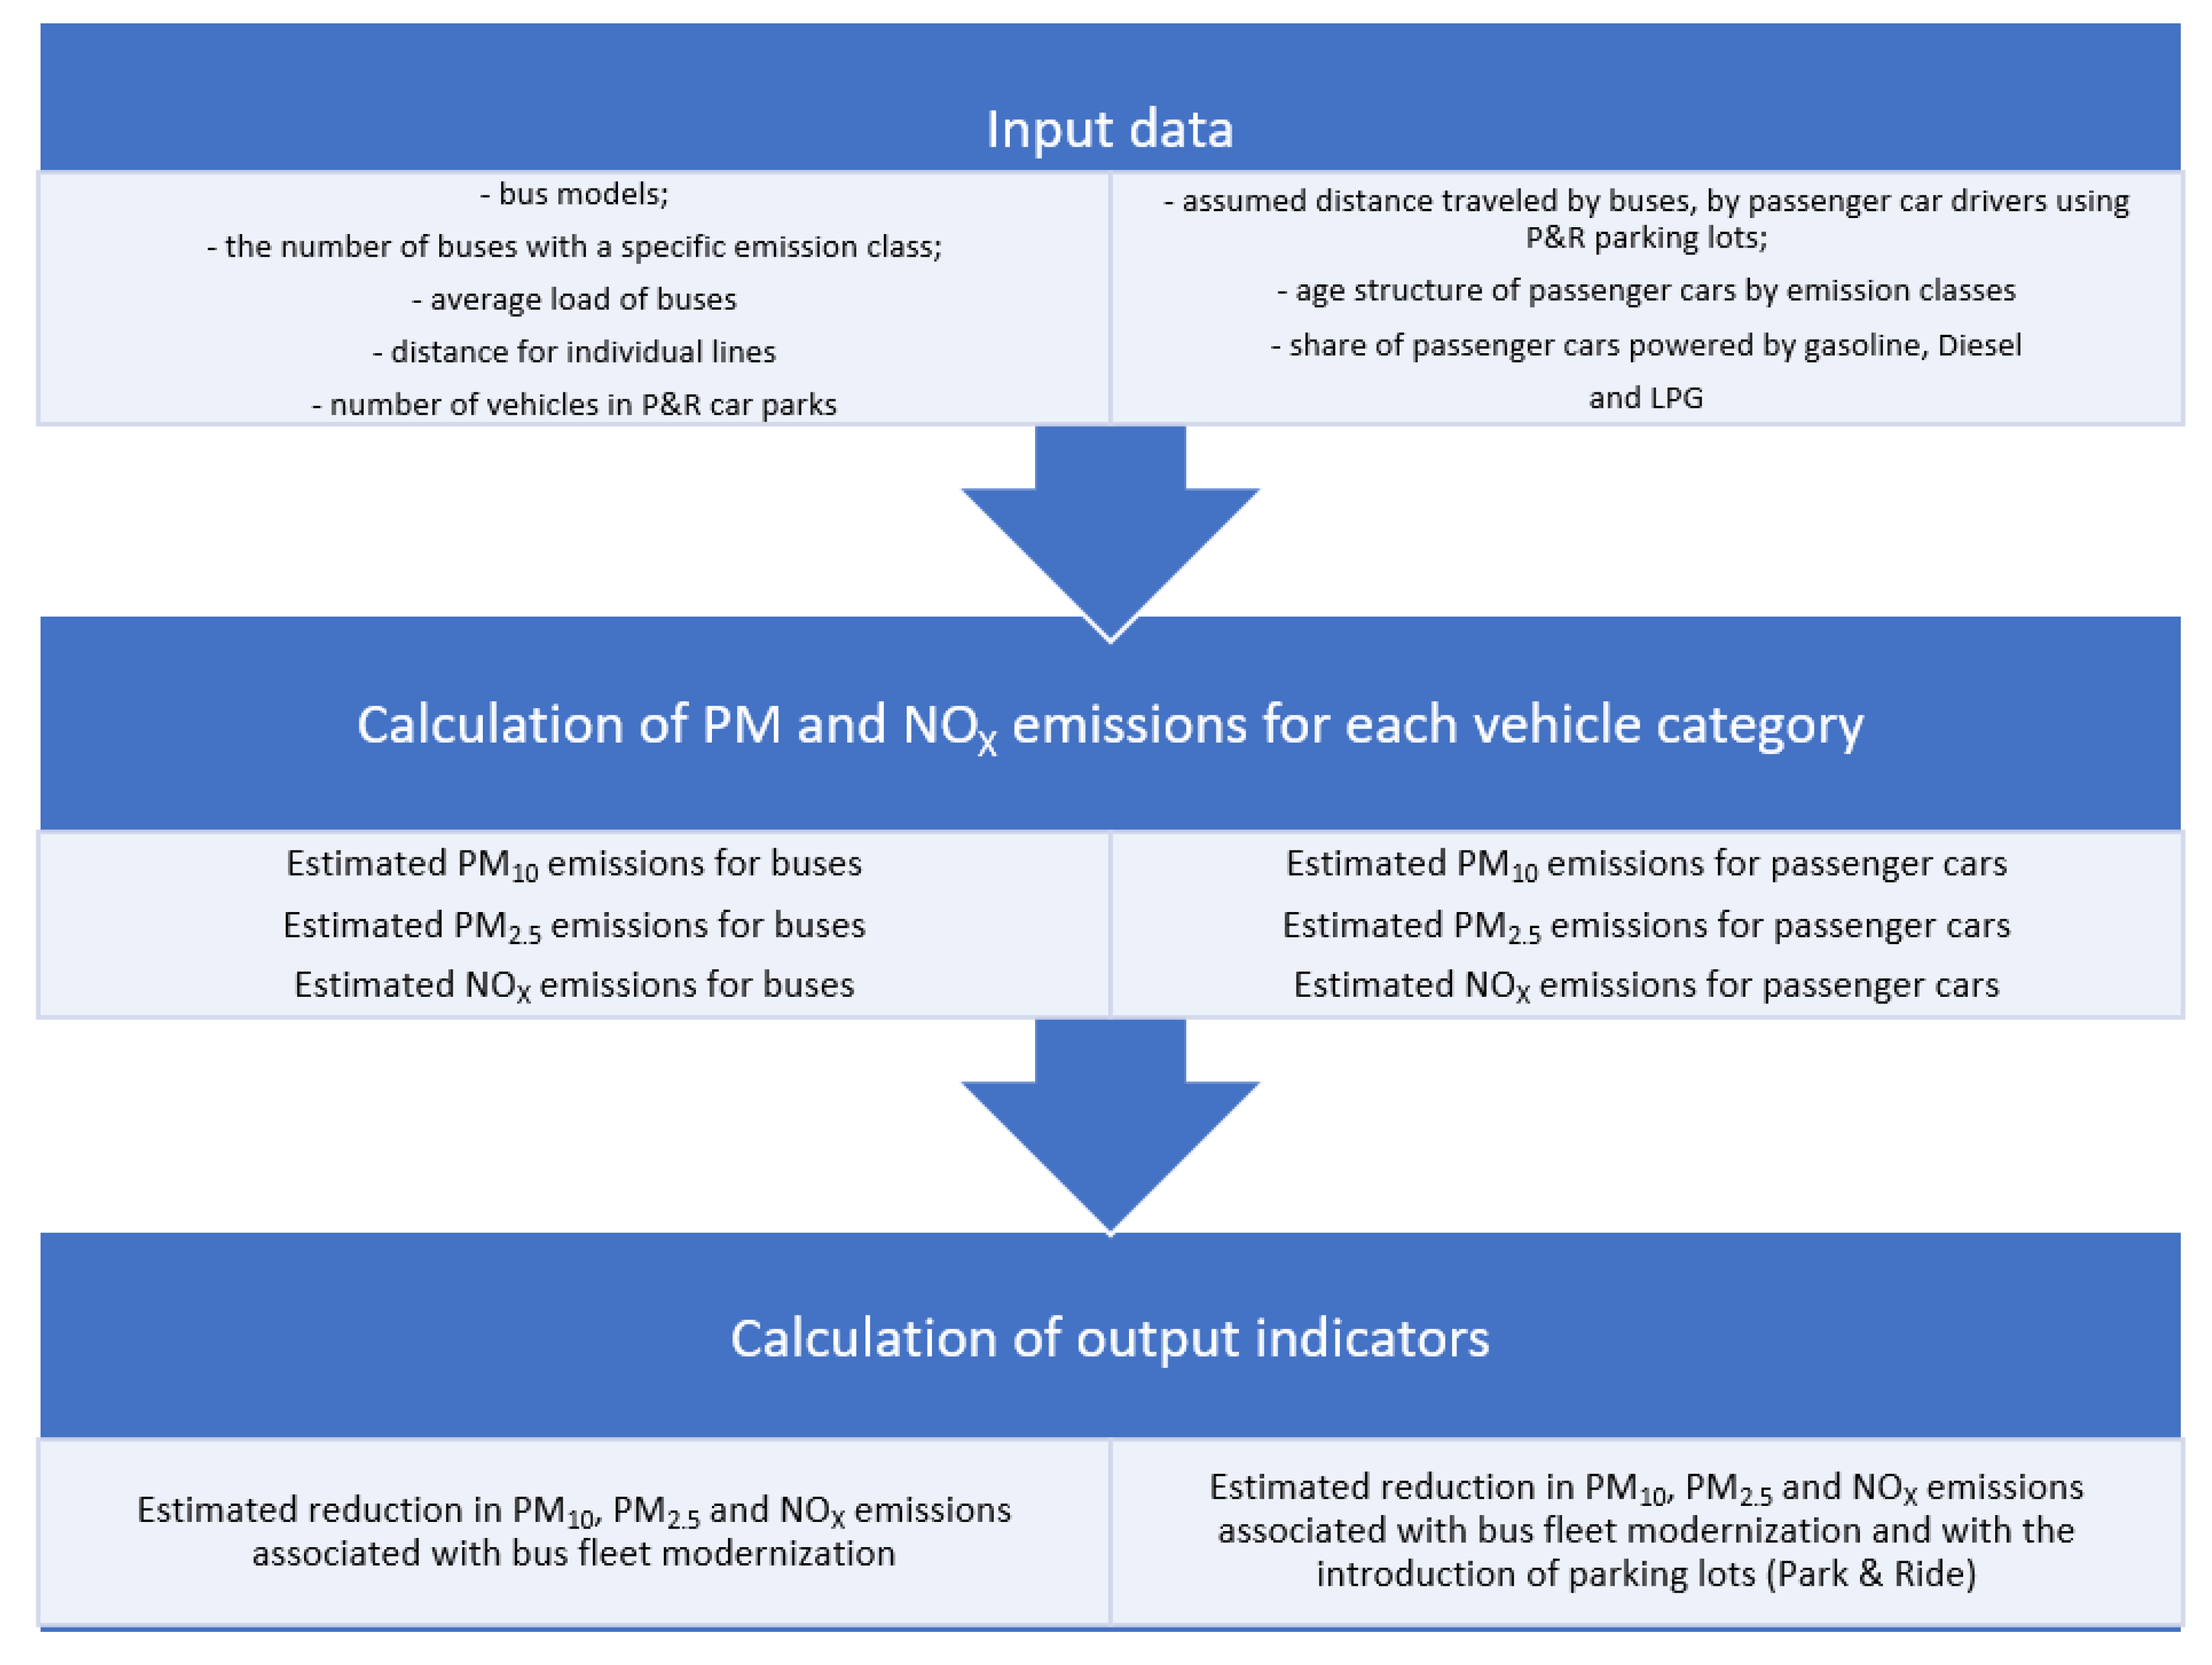
For the V0 scenario (a scenario assuming no investment), emissions from buses prior to replacement were computed, along with emissions projections for passenger cars that would have been utilized in the absence of the project and its associated P&R parking. The analysis spanned the period from 3 January 2021 to 2 January 2023. The data used for these calculations were sourced from the Association of Rzeszow Municipalities. Emission calculations were conducted in accordance with the EMEP/EEA methodology [
46], integrated into COPERT 5.6.5. A comprehensive overview of the study’s framework is depicted in
Figure 3.
3.1. Description of the Area of the Implemented Project
The project was executed within the confines of Rzeszow, which is situated in Poland. Rzeszow holds the status of being the capital of the Subcarpathian Voivodeship and stands as the central hub of the Rzeszow agglomeration, boasting a populace of approximately 200,000 individuals [
47]. This city accommodates six universities, and its vicinity is graced by an international airport positioned near Jasionka.
In order to facilitate the COPERT emission calculations, pertinent meteorological data concerning the analyzed region are required, encompassing variables like annual temperature and humidity. The weather conditions characteristic of the Rzeszow agglomeration are depicted in
Figure 4.
The urban transportation network within the Rzeszow agglomeration encompasses a total of 63 bus lines. In 2015, a comprehensive system was introduced, aiming to seamlessly integrate public transportation services not only within Rzeszow itself but also across the adjoining areas. This overarching system incorporates multiple enhancements, including the implementation of traffic light control mechanisms designed to prioritize public transport vehicles. Furthermore, the system encompasses an online vehicle tracking system, an information dissemination system, the adoption of electronic ticketing, and the establishment of stationary ticket vending machines. To support the realization of these enhancements, Rzeszow secured supplementary funding from European Union resources.
As part of these developments, a diverse fleet of buses has been procured, spanning modern diesel and CNG, along with hybrid and electric models. The city also enjoys the convenience of a well-connected rail transportation network, facilitating travel between suburban locales and the city center, and further extending to encompass rural and international rail connections. In recent years, the establishment of park-and-ride (P&R) facilities in suburban regions has contributed to the overall transportation landscape.
Figure 5 provides an overview of the study area, encompassing the city of Rzeszow and its affiliated municipalities, alongside an approximate depiction of the P&R spaces.
3.2. Description of the Vehicle Fleet under Study
The bus fleet involved in this study encompassed a total of 52 vehicles operating across 13 distinct lines. Following the project’s implementation, the outdated bus fleet underwent a comprehensive overhaul, with the entire roster being replaced by modern vehicles procured for this purpose. The original bus fleet comprised 29 buses without assigned emission classes, while the remaining 23 adhered to EURO II standards. This fleet underwent replacement with EURO VI-compliant buses, the majority of which were manufactured post-2019. For a comprehensive overview of the bus fleet composition, please refer to
Table 1. Furthermore, an in-depth breakdown of the bus fleet data, serving as input for COPERT calculations, is furnished in
Table S1 in the Supplementary Materials.
Input data crucial for the COPERT emissions calculator encompassed average mileage per vehicle, which was sourced from the transportation operator. These mileage figures underwent individual adjustments for each bus line. Alongside this, other essential parameters consisted of average speed and load for each of the examined bus lines. The average speed and load metrics for the buses were derived from factual data made available by the transportation operator. These aforementioned parameters, pivotal for subsequent emission calculations, are outlined in
Table 2 and
Table 3. Subsequently, PM emissions were computed utilizing these input parameters. The calculations for PM emissions were carried out for each line independently, and the ensuing averages were calculated for each of the analyzed variants.
Emission assessments also encompass passenger car emissions. Given the project’s scope, which involves the substitution of the old bus fleet with new buses and the establishment of fresh park-and-ride (P&R) facilities, the analyses account for a specific quantity of passenger cars operating on the road in the scenario without P&R facilities. The research encompasses four P&R locations, serving as parking points for over 150,000 vehicles throughout the examined two-year period. The data pertaining to the volume of vehicles utilizing these P&R parking zones were sourced from road management authorities at the respective locations.
In the V0 scenario, characterized by the absence of P&R parking lots, the study postulated that passenger cars would travel an approximately equivalent distance to buses, originating from the existing P&R parking lots. The average distances for each driver were multiplied by the overall count of vehicles utilizing the P&R facilities. Specifics regarding the number of vehicles within the P&R zones are shown in
Table 4.
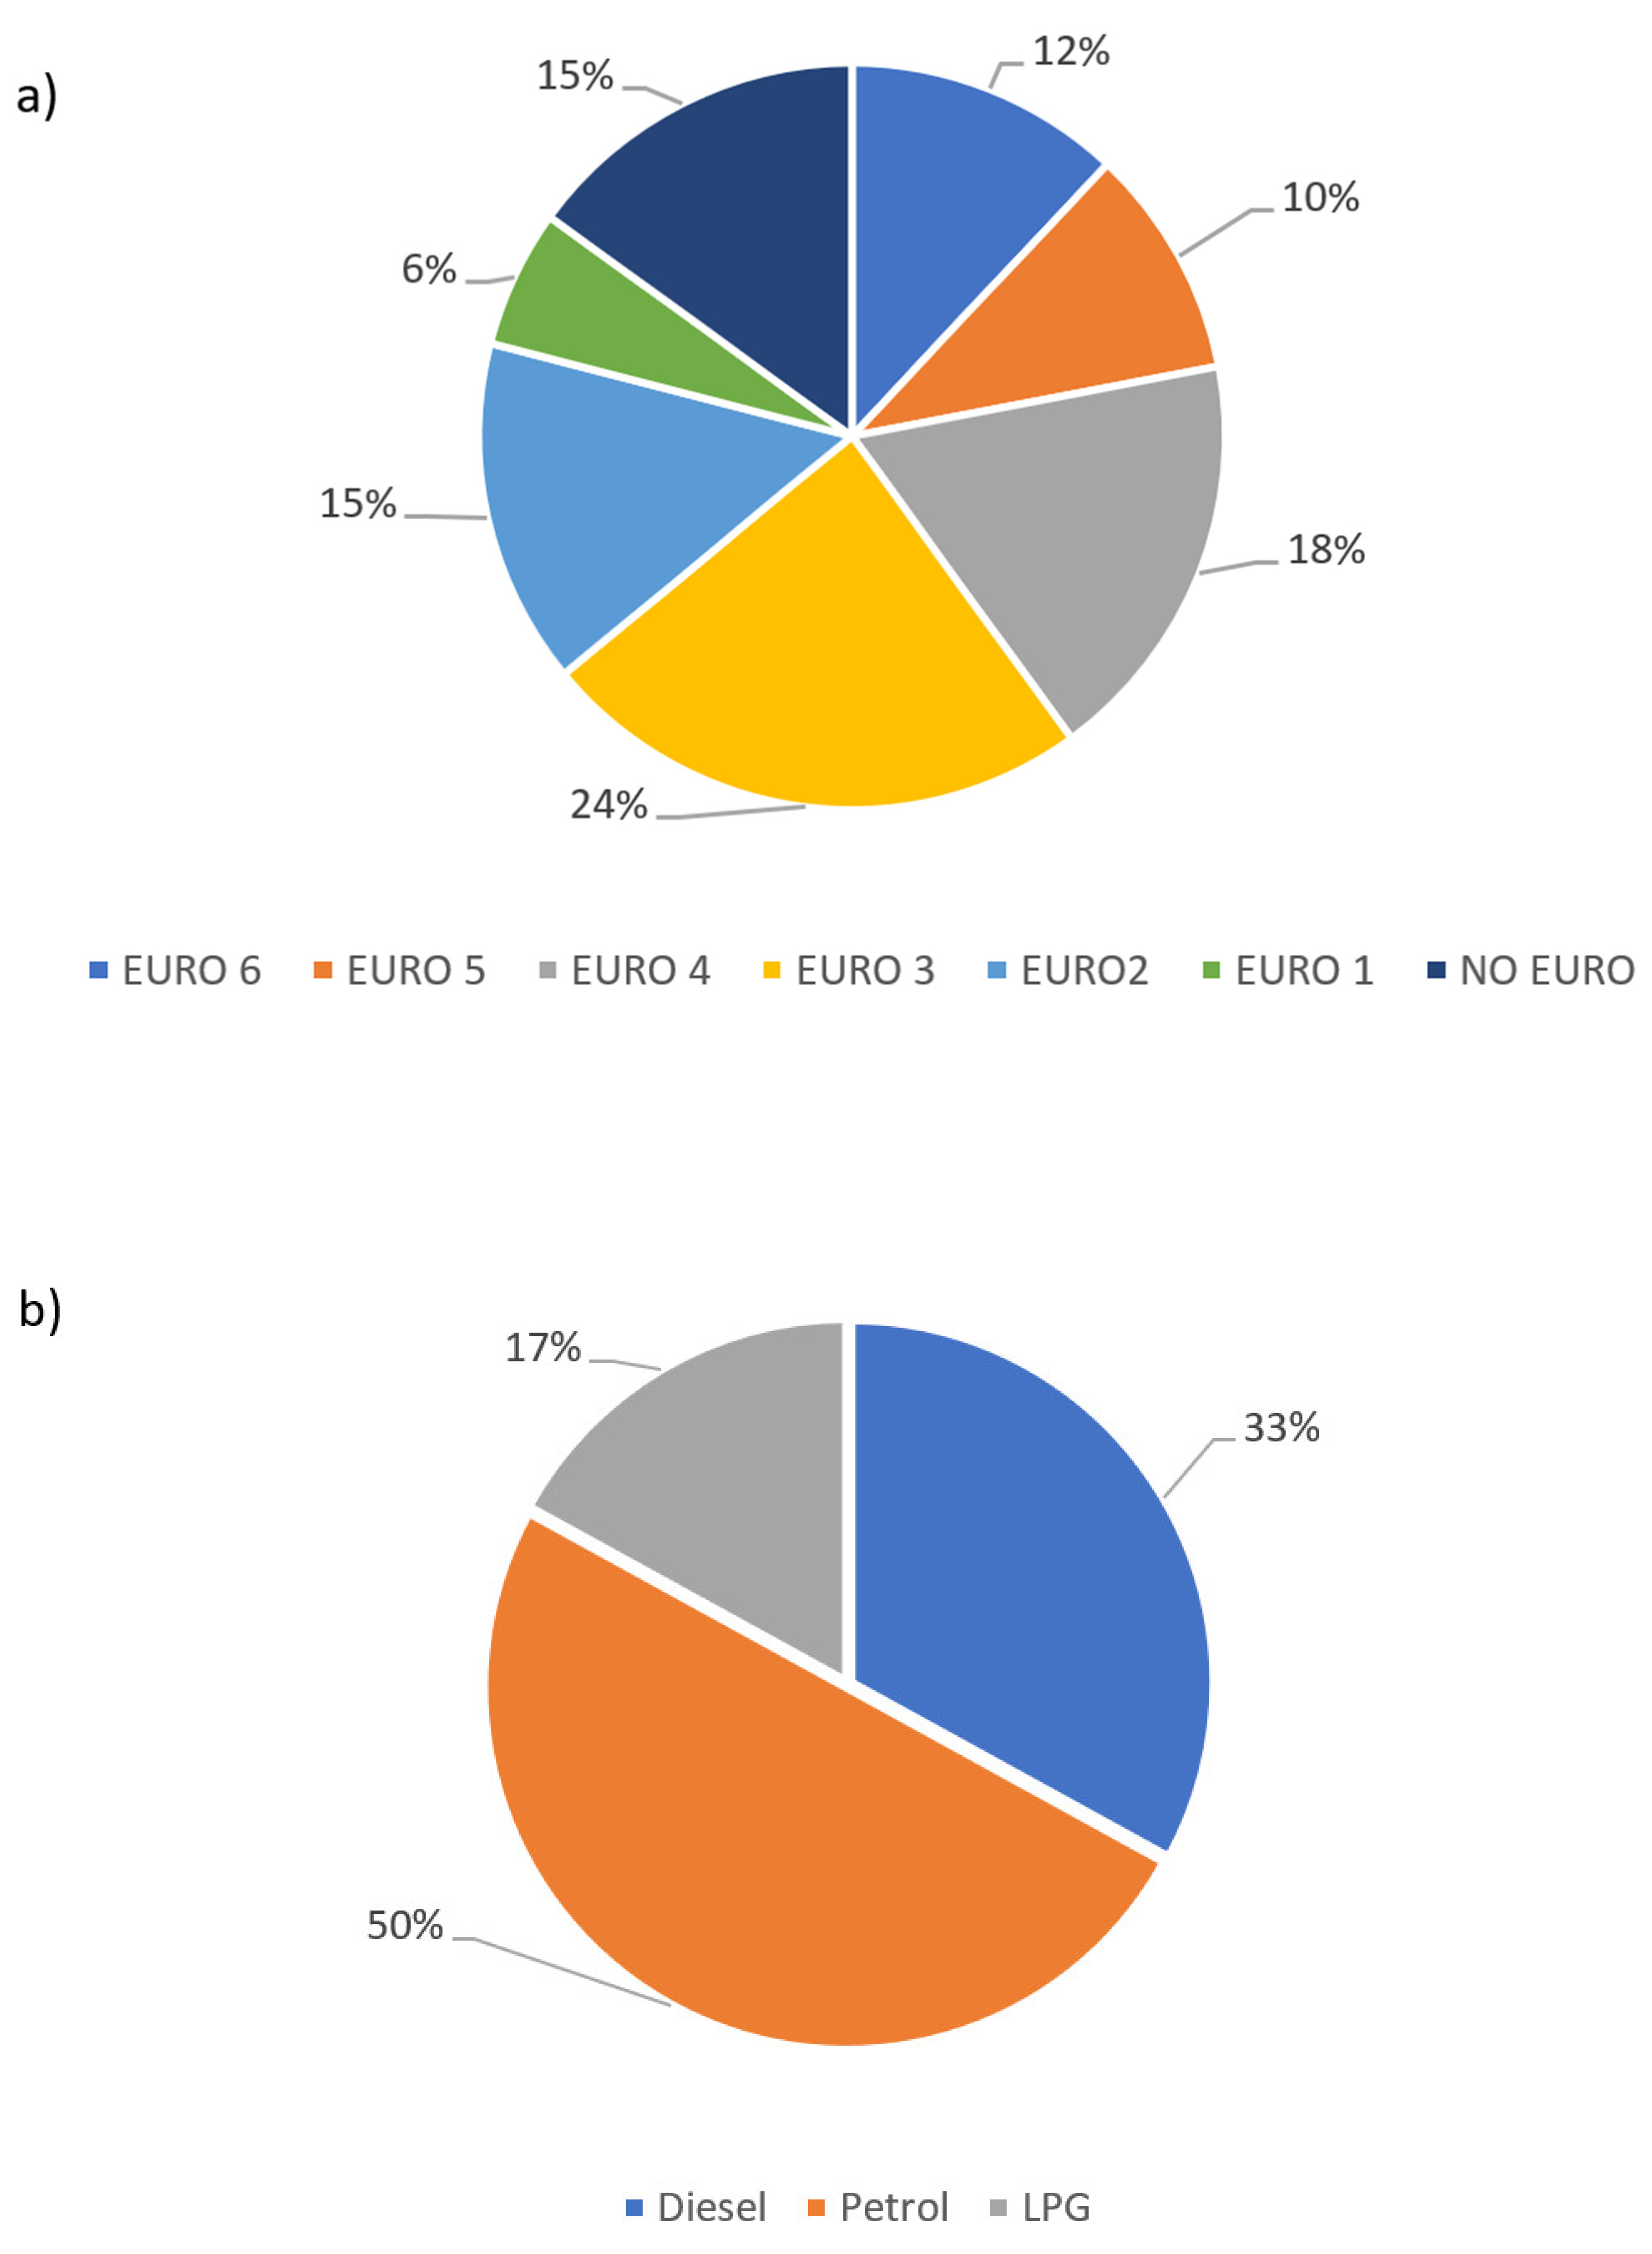
Figure 6 shows the percentages of passenger cars, taking into account the emission standards and fuels used, adopted for calculations in the COPERT model. These data were adopted based on information contained in the statistical data for Rzeszow County.
Emissions originating from passenger cars within the V0 scenario were computed using data encompassing the number of cars within each park-and-ride (P&R) parking facility, coupled with an estimated average travel distance derived from the buses utilized by the car drivers who parked in the P&R lots (as detailed in
Table 4). The study’s assumption posited that the distance covered by car drivers utilizing the parking facilities equates to half the distance covered by the buses of each line, originating from the stops situated close to the parking facilities and culminating at the final stops. To facilitate these calculations, data pertaining to the number of cars were employed, segregated by both fuel type and emission class [
47]. These specific details are presented in
Table 5.
4. Results and Discussion
The proposed methodology and its practical implementation are exemplified through a comparative analysis of two bus fleet variants, focusing on PM and NOx emissions. As previously outlined, variant V0 encompasses the original bus fleet and supplementary car trips resulting from the absence of park-and-ride (P&R) facilities. Conversely, variant V1 involves a modern low-emission bus fleet and the establishment of new P&R spaces in suburban regions.
Emission calculations were conducted using authentic data spanning a two-year interval from the beginning of 2021 to the start of 2023. These calculations were grounded in actual information sourced from bus journeys and road infrastructure.
The quantifiable reduction in emissions was evaluated utilizing the following Formula (2) [
15]:
where:
ΔE—reduction in pollutant (PM2.5, PM10, and NOX) emissions;
Eo—non-investment scenario emissions (variant V0);
E1—emissions related to the implementation of the project (variant V1).
The outcomes of PM emission calculations pertaining to the V0 variant (i.e., the former vehicle fleet with the absence of park-and-ride parking lots) for each of the examined bus lines are consolidated and presented in
Table 6.
The computed PM and NO
X emissions for the V0 variant from passenger cars for the analyzed two-year period (2021–2022) are shown in
Table 7.
Table 8 shows the computed values of PM and NO
X emissions for new buses in the V1 variant for each bus line.
For the analyzed two-year period, the estimated average annual decrease in PM and NO
X emissions associated with the project is shown in
Table 9.
Thanks to the implementation of the project, i.e., the replacement of 52 old buses with new buses of the Euro VI emission class and the construction of new P&R spaces, the total average annual reduction in emissions amounted to approximately 703.6 kg of PM10, approximately 692.7 kg of PM2.5, and a reduction of approximately 10.4 tons of NOX. With the introduction of P&R zones, the average annual reduction in particulate emissions was about 120 kg. In terms of NOx emission reductions, the replacement of the bus fleet reduced NOx emissions by about 9867 kg, while the average annual reduction in emissions due to the use of P&R parking lots was about 500 kg.
An additional significant aspect concerns the reduction in greenhouse gas emissions, which was thoroughly examined in the referenced article [
15]. Consequently, the execution of such projects assumes a pivotal role in addressing the escalating challenges related to particulate and gaseous emissions, inclusive of greenhouse gases, as well as the resultant concern over global warming. Leveraging the methodology presented in this study, the substitution of a fleet comprising 52 buses and the establishment of park-and-ride (P&R) zones yielded remarkable outcomes: PM
2.5 emissions were curtailed by over 690 tons, PM
10 emissions by more than 700.0 kg, and NOx emissions by more than 10.3 tons within a single year. Considering emissions from buses only (
Figure 7), it can be concluded that after the fleet was replaced with a new one, the relative emissions of PM
10, PM
2.5, and NO
X were about 15.6%, 8.8%, and 6.1%, respectively.
It is also worth highlighting the problem of data sensitivity analysis. This work is based on a data set provided by the transport operator and based on statistical data from a local data bank. An analysis of a certain range of data would give a possibly more complete picture of a certain effect, e.g., a quantitative change in the fleet of vehicles meeting certain EURO standards, as the vehicle fleet is subject to continuous modification due to aging and the registration of new vehicles. An example of a paper that addresses this problem is [
48], where the authors analyze the sensitivity of the input data to the output data of the COPERT model. The uncertainty analysis of the emission results shows differences ranging from −58% to 76%.
As is well known, during the winter season, emissions of dust and gaseous pollutants also come from individual heat sources used by residents. Taking into account the pollutants analyzed, the average annual dust emissions from a single solid-fuel boiler in a single-family home, according to [
49], can range from about 17.5 kg/year of PM
10 (using a biomass boiler) to approximately 20.5 kg/year of PM
10 (for a coal-fired boiler). For the average annual NOx emissions, these values are about 6.6 kg/year for a biomass boiler and about 7.20 kg/year for a coal boiler, respectively. If a condensing gas boiler is used, these emissions can average about 0.67 kg/year for PM
10 and about 3.61 kg/year for NO
X.
Therefore, it can be seen that the estimated annual reduction in pollutant emissions analyzed by replacing the bus fleet and introducing P&R zones is equivalent to the annual emissions of about 35 coal-fired boilers used in a single-family home with a heating demand of about 8000 kWh/year. Thus, in order to achieve improvements in air quality during the winter season, it is very important to replace solid-fuel heat sources with other low-emission heat sources, such as condensing gas boilers or heat pumps.
On the other hand, with NOX emissions in mind, it can be said that it is very important to modernize the bus fleet and expand P&R zones. The value of the average estimated reduction in NOX emissions after project implementation, at about 10,370 kg/year, corresponds to the annual emissions of about 1500 coal-fired boilers.
When comparing the methodology and results used to other works, many differences can be observed in the conduct of this study. For example, the work [
50] describes a similar problem but with a different approach. This paper introduces a remaining life additional benefit–cost (RLABC) analysis approach, aiming to maximize net benefits by either the early retirement of buses or retrofitting buses within their lifespans. By assessing net benefits for different bus types, optimal fleet management schemes are identified for both operators and governments. This approach enables the creation of government subsidy plans for win-win solutions, enhancing efficiency and flexibility in fleet management. Using a case study of Hong Kong’s largest bus company, the study demonstrates the considerable benefits of this approach over fixed retirement plans. Another example is the work presented in [
44]. This study investigates the emission status and future trends of heavy-duty diesel passenger buses in Hainan Province. It employs statistical analysis to assess the technical distribution, activity patterns, and operational conditions of these buses. Emissions of CO, CO
2, NO
X, and PM in 2017 are calculated using the COPERT model, with additional refinement through calibration using Portable Emission Measurement System data. Three emission scenarios are considered: baseline, emission reduction standard, and emission reduction standard combined with the replacement of diesel buses by electric vehicles. Utilizing a gray model, the study predicts the number of heavy-duty diesel passenger buses in each scenario and combines this with calibrated emission factors to project emission trends. The results indicate that the emission reduction standard alone will lead to significant reductions in CO, CO
2, NO
X, and PM emissions by 2025, with even more substantial reductions achieved when combined with electric vehicle adoption, highlighting the potential for significant environmental improvements.
The introduction of the above-described retrofitting of the fleet and public transport apparently brings some benefits in terms of ambient air quality. However, taking into account all urban and non-urban emissions, this improvement in air quality represents a margin and may be symbolic overall. However, every step to improve air quality, even a local one, should be taken, because with small steps one can achieve a certain satisfactory long-term effect.
Building upon the developed methodology, a comparative assessment was undertaken, gauging PM and NOx emissions. The evaluation encompassed two distinct scenarios: firstly, the condition preceding the replacement of the existing bus fleet with a novel one, and secondly, an envisaged situation featuring the new bus fleet, coupled with the establishment of park-and-ride (P&R) parking facilities. In Central and Eastern European countries, old bus fleets are common [
51,
52]. Calculations of particulate matter and nitrogen oxide emissions, based on replacing bus fleets with new ones, show significant reductions in the emissions of these pollutants.
Achieving a significant reduction in air pollutant dust emissions is crucial to improving the quality of life and health of society.


 ,
, 


