
Wind and Solar Energy for Sustainable Energy Production for Family Farms in Coastal Agricultural Regions of Libya Using Measured and Multiple Satellite Datasets

Abstract
:1. Introduction
1.1. Electrical Energy Situation in Libya
1.2. Renewable Energy Situation in Libya
- Most of the scientific researchers have focused on addressing the current and future situation of renewable energy in the country.
- Most scientific researchers have analyzed the characteristics of wind speed at a specific region based on the NASA dataset or actual data measured before 2012.
- Several studies have investigated the economic viability of a grid-connected PV/wind/hybrid renewable system.
- Regarding the literature review, it is found that Libya has high wind and solar energy potential. Nevertheless, Libya’s renewable energy potential is hampered by challenges such as legal, political, economic, and financial barriers.
1.3. Scope of Present Work
- For evaluating the wind energy potential:
- ○
- The wind speed characteristics in Az-Zāwiyah were analyzed using measured wind speed data for January 2022–December 2022. The data were measured with an Ambient Weather WS-2902 Home WiFi Weather Station. It should be noted that the device was placed in a treeless, unshaded area to ensure unobstructed exposure to the full range of ambient weather conditions. This unobstructed positioning ensures accurate measurements and a reliable collection of weather data.
- ○
- The analysis of wind speed distribution plays a crucial role in assessing the wind energy potential in a particular area. However, evaluating wind energy potential can be challenging in areas without sufficient measurements. Therefore, utilizing data coming from satellite measurements and reanalysis datasets becomes essential in investigating wind resource assessment. The study’s objective is to assess the accuracy and reliability of five satellite-based wind products by comparing them against observed data obtained from the Az-Zāwiyah region.
- ○
- Utilizing the most reliable satellite-based wind product, the assessment of wind resources in five agricultural coastal regions was conducted by analyzing the average monthly data for a long period.
- For evaluating the solar energy potential:
- ○
- The solar radiation data in Az-Zāwiyah were analyzed using measured wind speed data for January 2022–December 2022. The data were measured using an Ambient Weather WS-2902 Home WiFi Weather Station.
- ○
- Solar radiation is an essential factor for assessing the potential and estimating the power output of solar PV applications. Satellite data can be used as an alternative for solar resource assessment in areas where measured data are unavailable. Thus, it is essential to evaluate the performance of these alternative data sources to ensure their accuracy and reliability. The study aims to evaluate the accuracy and reliability of five satellite-based wind products by comparing them with the observed data obtained from the Az-Zāwiyah region.
- ○
- Utilizing the most reliable satellite-based solar products, the assessment of solar resources in five agricultural coastal regions was conducted by analyzing the average monthly long-period dataset.
2. Materials and Methods
2.1. Study Area
2.2. Data on Agricultural Farms through the Survey
2.2.1. Case 1: Farm 1
- Section 1: It occupies a total area of 5 hectares. The main crop grown on the farm is orange trees. The well used for irrigation has a depth of 190 m. The Total Dissolved Solids (TDSs) in the water is 1800, indicating the mineral content. The pH level of the water is 8, indicating its acidity/alkalinity balance. Additionally, the farm employs a submersible well pump with a capacity of 12 horsepower (12 hp). This pump is responsible for drawing water from the well and supplying it to the irrigation system. It operates for an average of 15 h per day. It also has a diesel electricity generator with a capacity of 500 kilovolt-amperes (kVA). This generator is used to generate electricity for various farm operations. On average, it operates for a range of 5 to 6 h per day. The generator requires approximately 120 L of diesel per day.
- Section 2: This section occupies an area of 5 hectares. It cultivates a variety of crops. The well in this section has a depth of 185 m with a pH level of 7.5 and a TDS value of 1700. The farm uses a pump with a capacity of 7.5 hp to extract water from the well for irrigation purposes. The pump operates for an average of 10 to 15 h per day, indicating the duration for which it is active in supplying water to the crops. The farm has a diesel electricity generator with a capacity of 60 kVA. This generator provides electrical power for various farm operations. The generator operates for an average of 5 to 6 h per day, indicating the duration for which it is in use. The farm requires approximately 20 L of diesel per day to fuel the generator.
- Section 3: The farm spans a 2-hectare area and is primarily dedicated to cultivating clover. It utilizes a well with a depth of 210 m, containing water with a TDS value of 1950 and a pH level of 8.5. To facilitate irrigation, a pump with a capacity of 8.5 hp is employed to extract water from the well. This pump operates for an average of 15 to 20 h per day, ensuring a consistent water supply for the clover crop. In addition, the farm is equipped with a diesel electricity generator boasting a capacity of 78 kVA. This generator serves as a power source for various farm operations. It operates for an average of 5 to 6 h per day. To sustain its operation, the generator consumes approximately 30 L of diesel fuel daily.
- Section 4: The farm encompasses a 1-hectare area and is primarily dedicated to cultivating olive trees. It relies on a well with a depth of 225 m, containing water with a TDS value of 2100 and a pH level of 8.5. To facilitate irrigation, a pump with a capacity of 5.5 hp is utilized to extract water from the well. The pump operates for an average of 5 h per day, providing water to the olive trees during this period. Moreover, the farm is equipped with a diesel electricity generator boasting a capacity of 40 kVA. This generator serves as a power source for various farm operations. It operates for an average of 5 to 6 h per day. To sustain its operation, the generator consumes approximately 5 L of diesel fuel daily.
- Section 5: It occupies an area of 1 hectare and consists of sheds designed to house chickens, poultry, cows, and sheep. These sheds are equipped with a total of 21 mechanical ventilation fans, each with a capacity of 3.5 horsepower, enabling efficient air circulation. It should be noted that these fans operate for 24 h in summer and an average of 4 to 5 h per day in the winter. Additionally, the sheds are fitted with 20 lights, each having a capacity of 100 Watts, to provide illumination. The farm is equipped with two diesel electricity generators, serving as a backup or alternative power source, with a capacity of 615 kVA to supply electricity. Operating the generator requires approximately 150 L/d of diesel fuel.
- Section 6: Four houses are located on a 1-hectare plot of land. Each house has a specific area measurement: house #1 covers 250 m2, house #2 covers 180 m2, house #3 covers 300 m2, and house #4 covers 150 m2. The daily electric consumption for each house falls within the range of 15–25 kWh. Specifically, house #1 consumes 25 kWh/d, house #2 consumes 20 kWh/d, house #3 consumes 30 kWh/d, and house #4 consumes 15 kWh/d
2.2.2. Case 2: Farm 2
- There are 30 greenhouses, each spanning an area of 400 m2. The farm features a diverse range of 2000 trees, including pomegranate trees, grapevines, and peach trees. These trees collectively occupy an area of 7000 m2.
- It has 10 LED searchlights with a capacity of 1000 W.
- The farm has accommodation for workers (5 rooms). The area of the rooms is approximately 90 m2.
- Regarding the education variable, the majority of farmers have completed middle school, while only a few of them have not received formal education. The income of the farmers ranges from USD 105 to USD 315, which depends on the size of the farm, crop type, and so on.
- The total volume of freshwater needed for irrigation, drinking purposes, and domestic use is within the range of 20,000–24,000 L per week, with an associated cost of around USD 24–30. It is important to note that groundwater is not suitable for all types of crops, which necessitates the need to obtain fresh water by purchasing it from water tankers.
2.3. Weather Data
2.3.1. Measured Data
2.3.2. Reanalysis and Analysis of Datasets
2.3.3. Statistical Indices
2.4. Assessment of Wind Energy Potential
2.4.1. Extrapolation of Wind Speed Data
2.4.2. Modeling the Distribution of Wind Frequencies
2.4.3. Wind Power Density
2.4.4. Output Energy of Wind Turbines
2.4.5. Techno-Economic Analysis of Wind Turbines
- (a)
- The total investment cost iswhere is the cost of the wind turbine in USD, is 2% of , the civil work and installation cost in USD (8% of ), is the engineering cost in USD (5% of ), is the transport cost (2% of ), is the electrical connection cost in USD (7% of ), is the miscellaneous cost (1% of ), is the specific cost of the wind turbine in USD/kW, and is rated power of the turbine in kW.
- (b)
- The net present value (NPV)where is the project life, is the after-tax cash flow in year n, and is the discount rate.
- (c)
- The present value of costs (PVC) method estimates the cost of production. As part of this method, the annual operating cost of the wind turbine is calculated using Equation (19).where is the operation and maintenance (O&M) cost, is the interest rate, is the inflation rate, and n is machine life as designed by the manufacturer.
- (d)
- Cost of electricity generated by a wind turbine in USD/kWh
- (e)
- Annual greenhouse gas (GHG) savings in CO2/Year
- (f)
- Simple payback period (SPP) in yearswhere is the installed capital cost of the wind turbine plus the costs of civil works and is the price of electricity (USD/kWh).
2.5. Assessment of Solar Energy Potential
2.5.1. Classification of Solar Potential
2.5.2. Estimating Solar PV Energy Output
2.5.3. Technical Indices
- (a)
- Final Energy Output (): This parameter represents the total amount of energy produced by the solar PV system over a given period, typically measured in kWh. It provides an overall measure of the system’s energy generation capability.where is the monthly energy output at the time () and is the number of days in a month.
- (b)
- Final Energy Yield (): It is calculated by dividing the final energy output by the installed capacity of the solar PV system. It represents the average energy production per unit of installed capacity and helps assess the system’s efficiency in converting sunlight into usable electricity.
- (c)
- Performance Ratio (): The performance ratio is determined by dividing the actual energy yield by the theoretical energy yield. The theoretical energy yield is calculated based on the available solar resource and is an estimation of the maximum energy the system could produce under ideal conditions. The performance ratio reflects the efficiency of the system in converting available sunlight into electricity, taking into account losses due to factors such as shading, temperature, and system degradation.where is the reference irradiance.
- (d)
- Capacity Factor (): It is the ratio of the actual energy output of the solar PV system to the maximum possible energy output if the system operated at its maximum capacity for a given period. It indicates the extent to which the system is utilized and provides insight into its operational efficiency. A higher capacity factor indicates better utilization of the installed capacity.where is the total expected number of hours of operation in a given period.
2.5.4. Economic Viability
- (a)
- The NPV is expressed as:where is the investment cost, is the project economic life, and is the annual net cash flow (which is annual revenue minus annual expenses (such as operation cost, maintenance, and replacement)) for a year. From a monetary benefit viewpoint, the NPV of a project needs to have a positive value ().
- (b)
- The internal rate of return is the value of the discount rate () that would result in an NPV of zero, and it can be determined from Equation (30):
- (c)
- The levelized cost of energy () is a metric used to assess the economic viability of a solar PV installation. It represents the average cost of generating each unit of electricity over the lifetime of the project. The takes into account the total costs associated with building, operating, and maintaining the solar PV system, divided by the total energy output generated by the system throughout its lifetime. Mathematically, the LCOE can be expressed as follows:where , , and are the investment cost (such as replacement cost), operation and maintenance cost, and electricity generated each year, respectively.
- (d)
- The payback period is a financial metric used to evaluate the time required to recover the initial investment costs through revenue generated by an investment. It represents the length of time it takes for the investment to reach a break-even point. The simple payback period provides a straightforward measure of the time required to recover an investment. Mathematically, the SPP period can be calculated using Equation (32).where is the annual saving.
3. Results
3.1. Assessment of Wind and Solar Energy Potential for Az-Zāwiyah
Wind Speed Characteristics and Wind Power Density Using Daily and Monthly Data
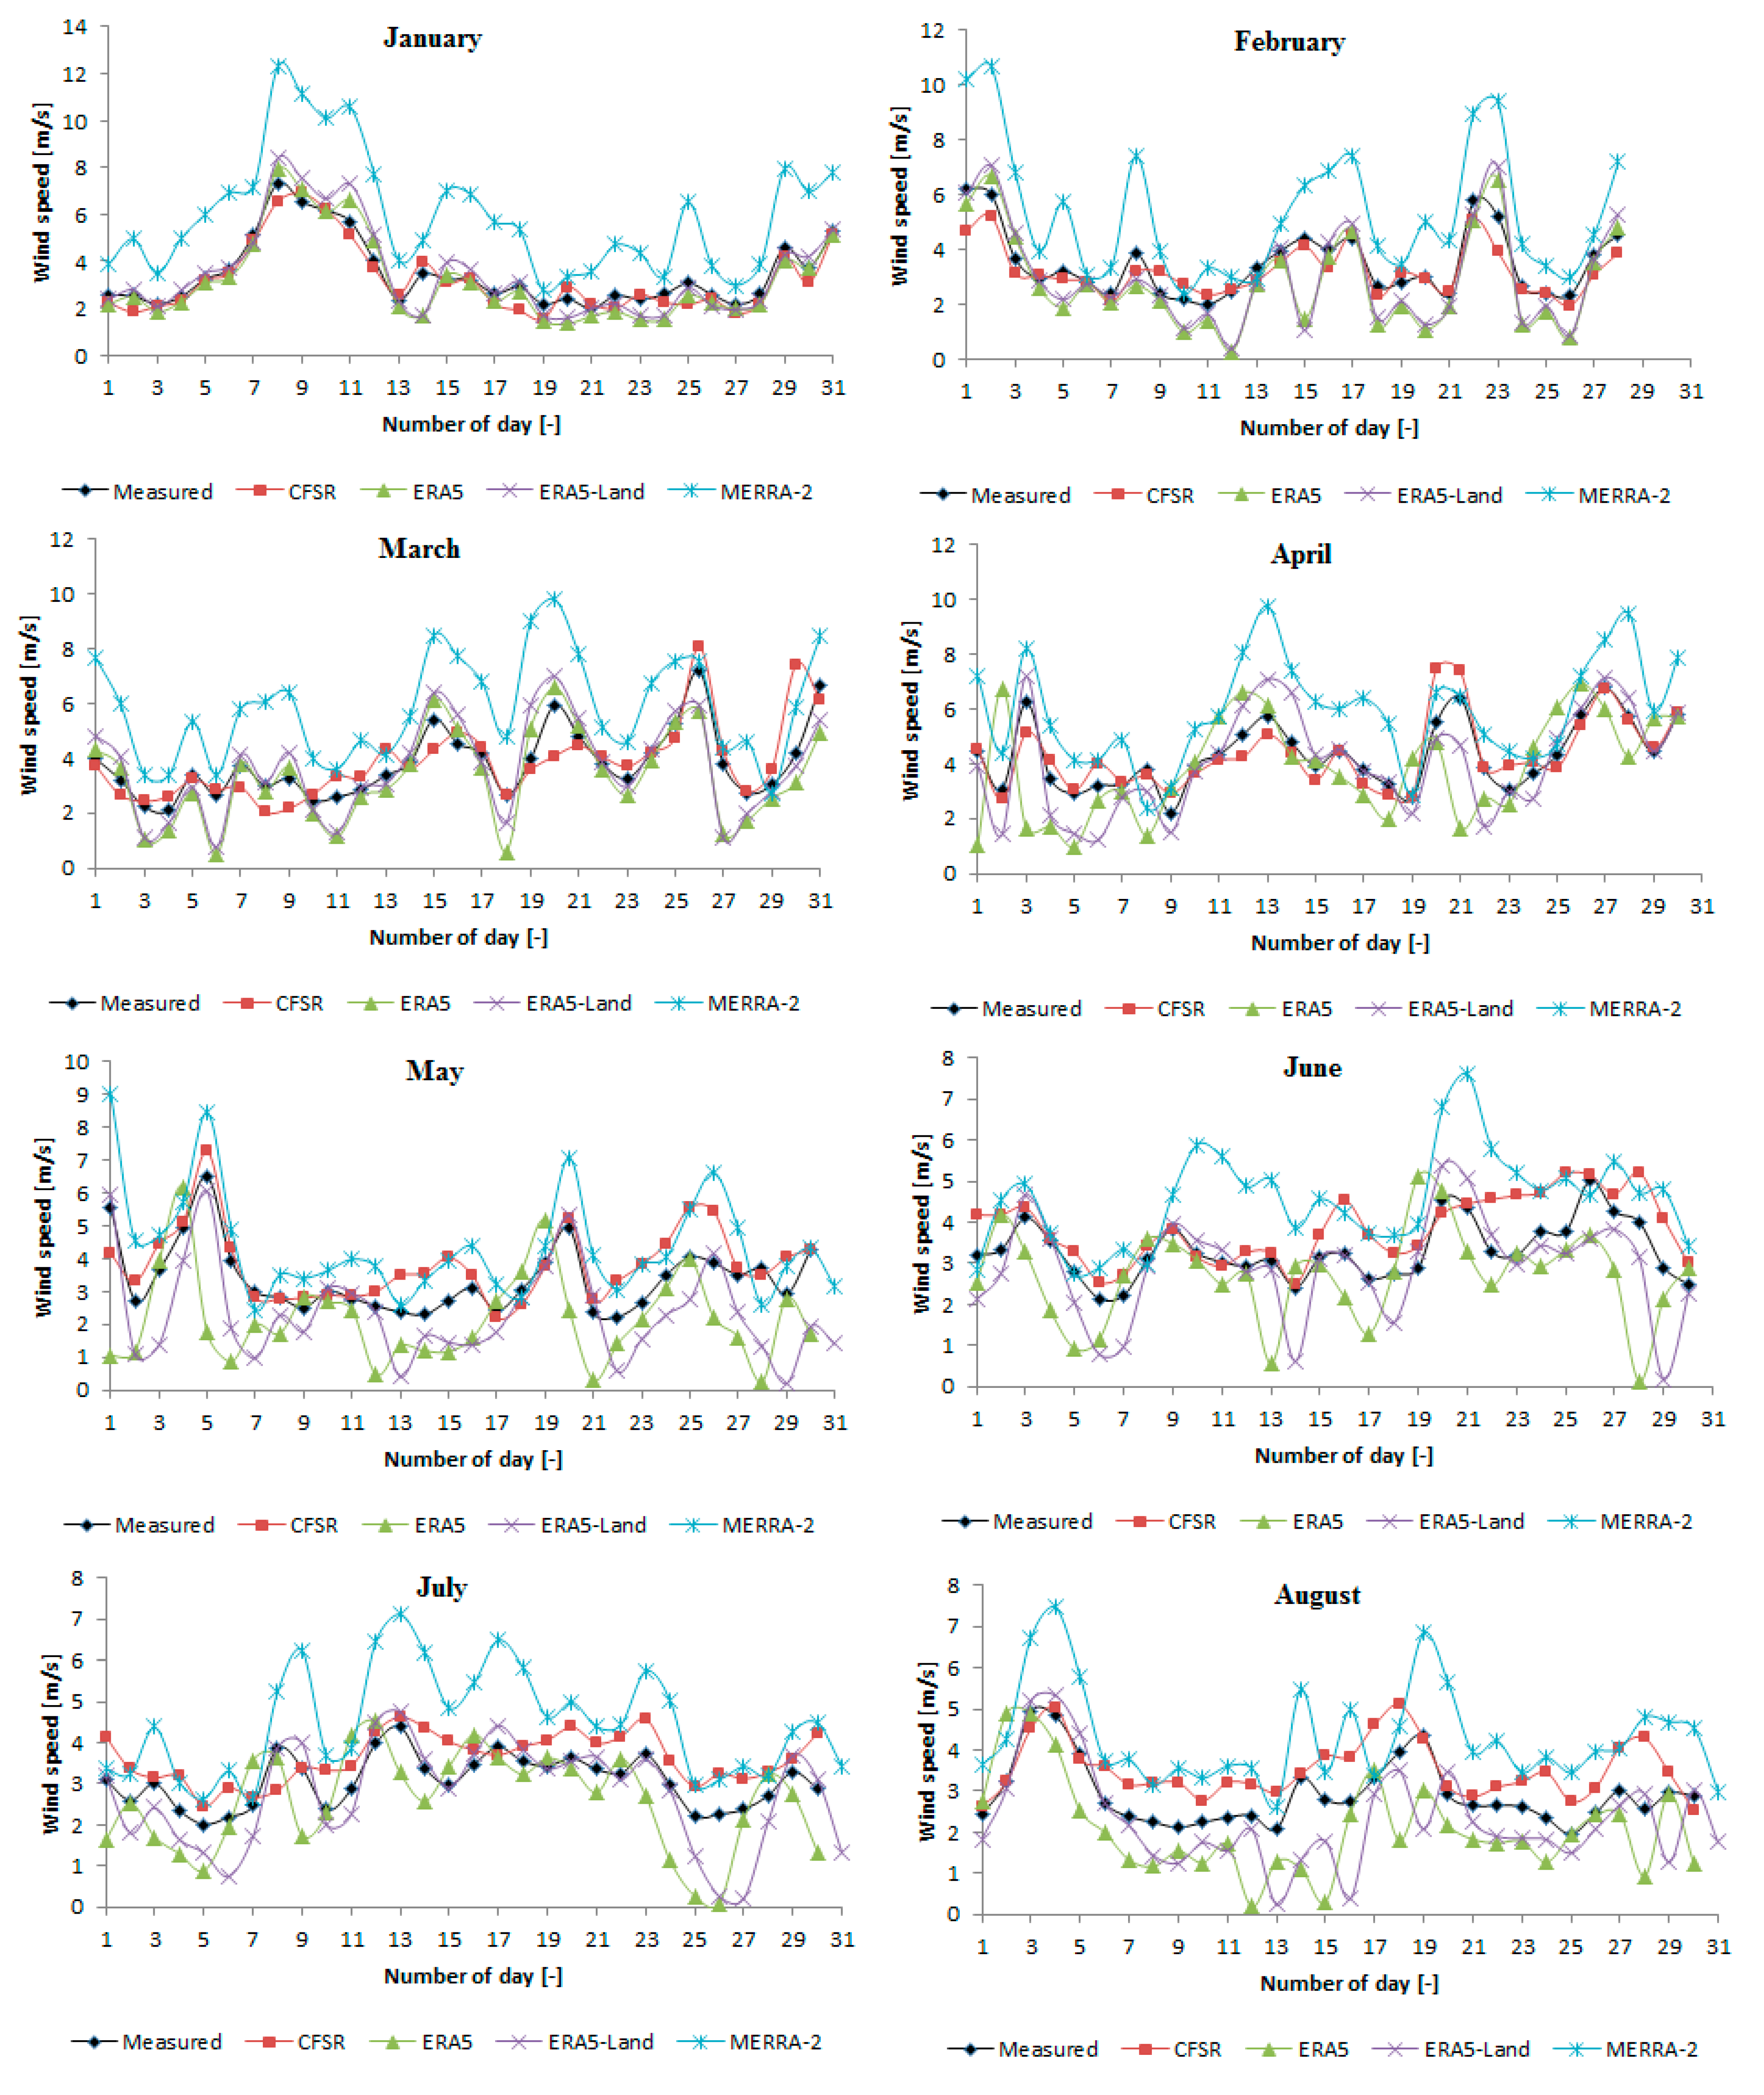
- The mean wind speed is within the range of 2.86–4.34 m/s for CFSR, 1.58–3.90 m/s for ERA5, 1.87–4.09 m/s for ERA5-Land, and 3.79–6.01 m/s for MERRA-2. Additionally, the highest and lowest values of mean and SD were obtained from MERRA-2 and ERA5.
- ERA5 exhibits the highest CV value (CV = 64.31%), while CFSR yields the lowest value (CV = 14.44%).
- The minimum wind speed occurred in January (1.53 m/s) for CFSR, July (0.08 m/s) for ERA5, June (0.18 m/s) for ERA5-Land, and October (1.73 m/s) for MERRA-2.
- The maximum wind speeds are observed in different months: November (8.96 m/s) for CFSR, January (7.92 m/s) for ERA5, January (8.39 m/s) for ERA5-Land, and November (14.50 m/s) for MERRA-2.
- The skewness values for most months are positive, indicating that all distributions are right-skewed.
- Based on the R-squared value, the best dataset varies from month to month. It is important to note that higher R-squared values do not necessarily indicate that one dataset is superior to another. The coefficient of determination, R-squared, only represents the strength of the linear relationship between the observed and modeled values. Therefore, RMSE, MAE, and RRMSE were employed to find the best dataset.
- Among the available datasets, CFSR consistently demonstrates the best performance across all months, as indicated by the lower values of RMSE and MAE when compared to the other datasets.
- For all months, the RRMSE value for the CFSR model ranges from 20% to 30%, suggesting a good performance rate. This finding is supported by the results presented in Table S2 in the Supplementary Materials.
- For a whole year, it is noticed that ERA5-Land and MERRA-2 produced the highest value of R-squared compared to CFSR and ERA5. Based on the value of RMSE and MAE, CFSR gives the best performance compared to other datasets. In addition, the performance of the utilized dataset was assessed using RRMSE. The RRMSE value for CFSR falls within the range of 20% to 30%, indicating a good performance rate for the CFSR model, as demonstrated in Table S2 in the Supplementary Materials. Moreover, the performance rate for ERA5-Land can be considered fair based on Table S2 in the Supplementary Materials. However, the performance rates for ERA5 and MERRA-2 are deemed poor (Table S2 in the Supplementary Materials).
- Fair (WPD < 100 W/m2)
- Fairly good (100 W/m2 < W PD < 300 W/m2)
- Good (300 W/m2 < WPD < 700 W/m2)
- Very good (WPD > 700 W/m2)
3.2. Assessment of Solar Energy Potential for Az-Zāwiyah
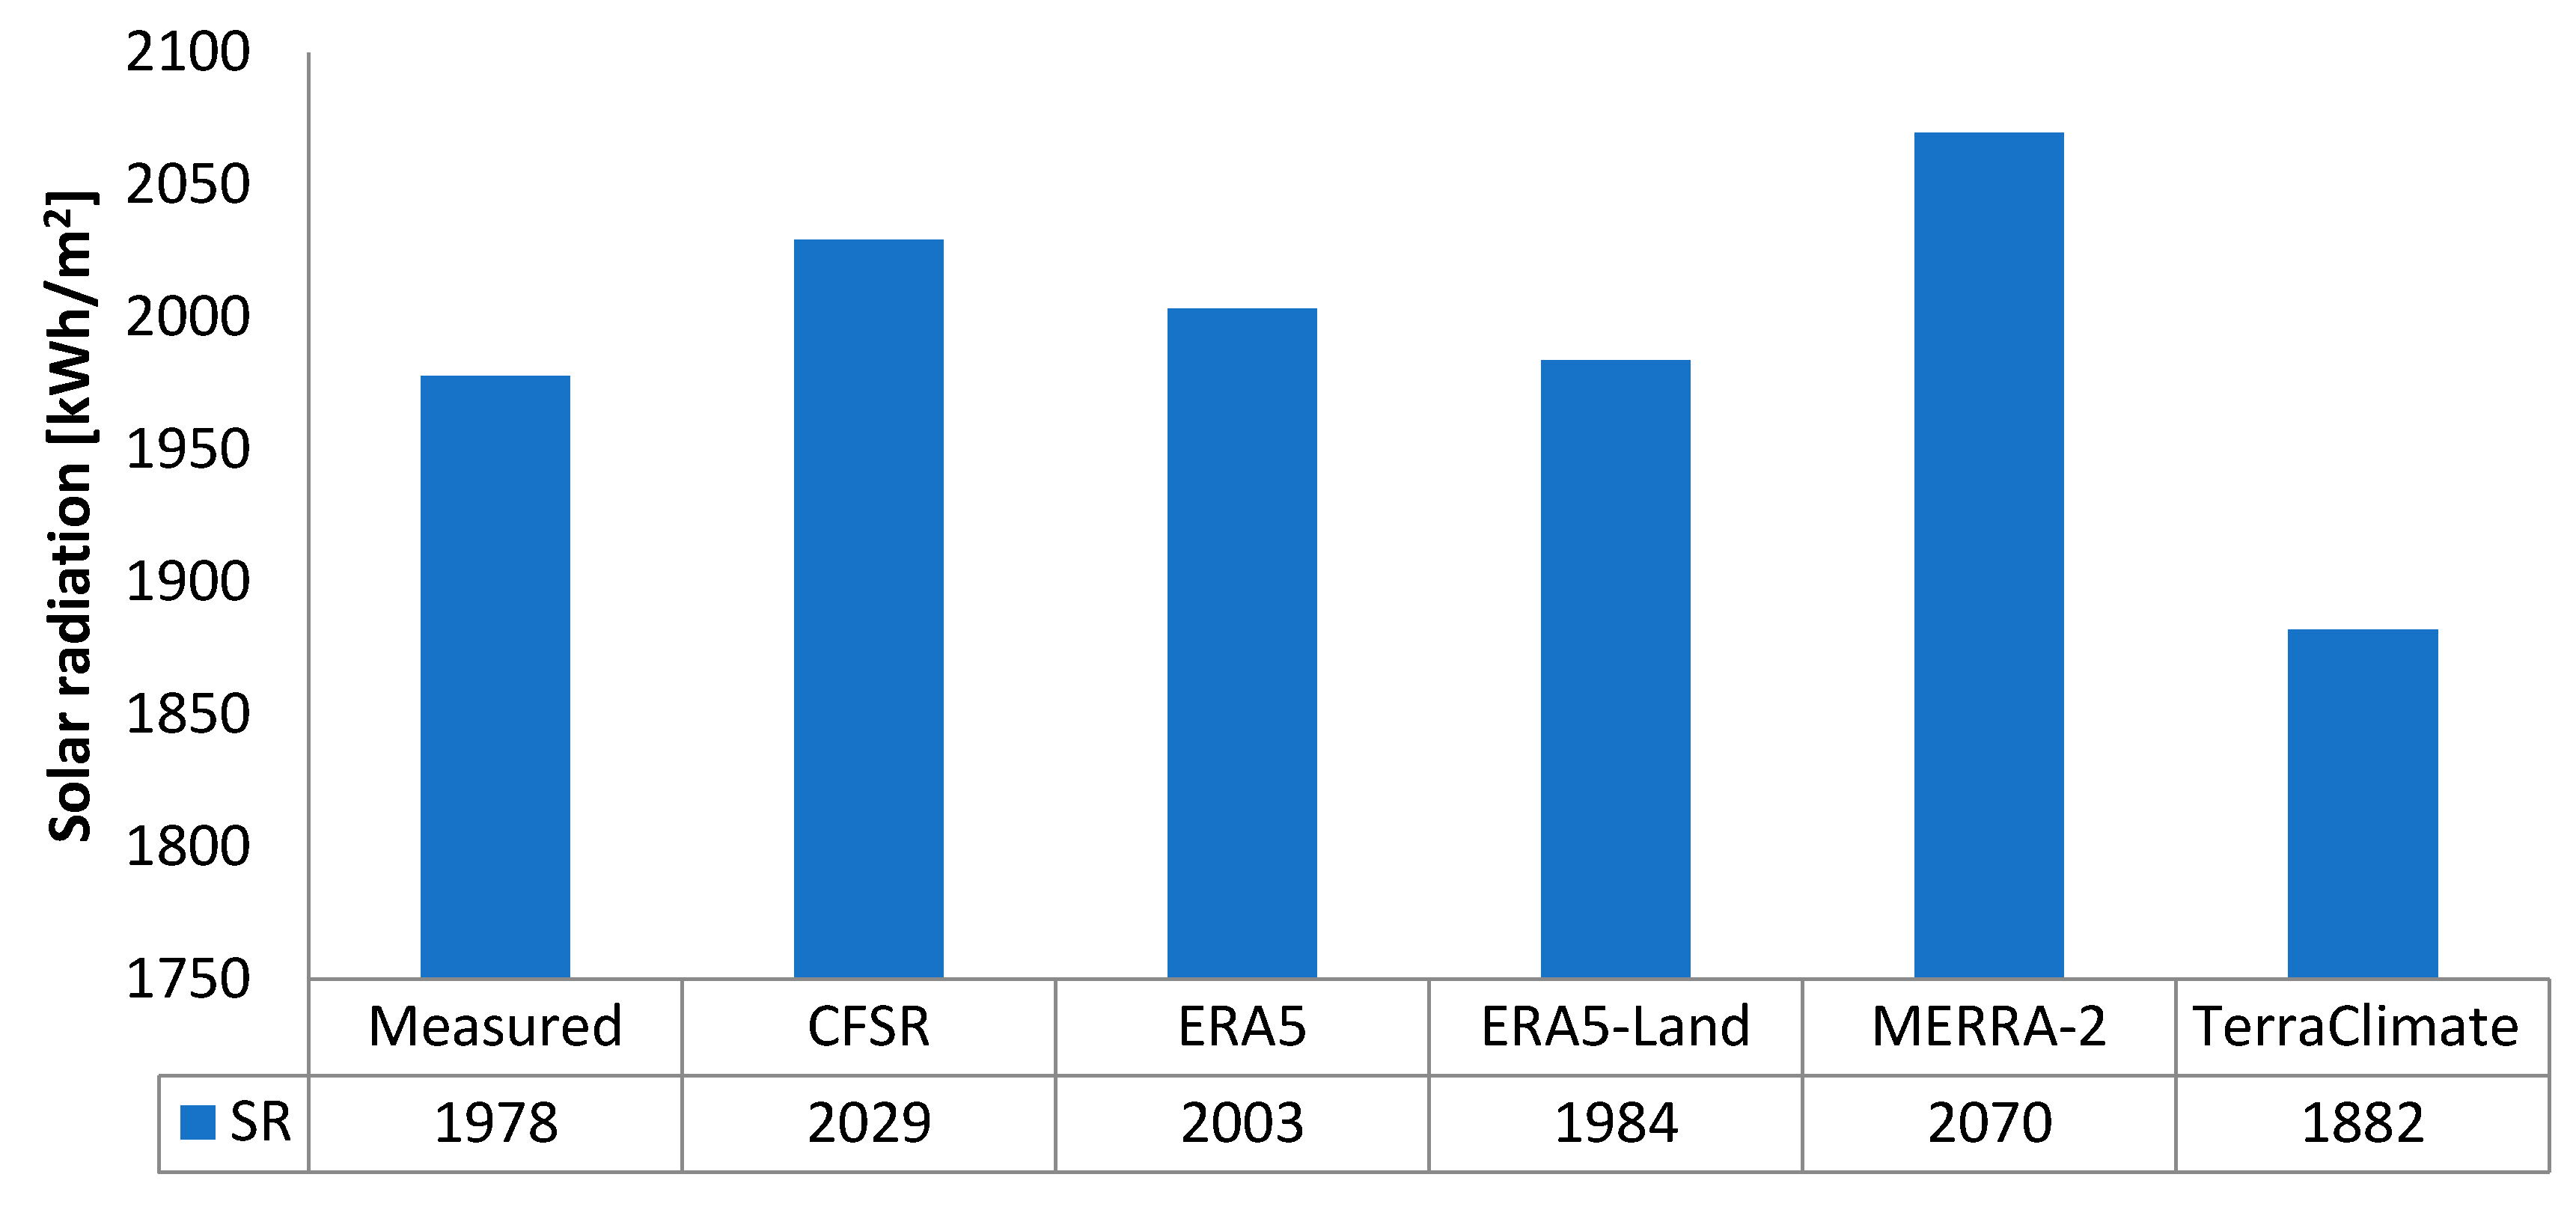
- By considering the measured data, the mean values for all months are within the range of 118.86–327.83 W/m2. The minimum value of 38.37 W/m2 and maximum value of 343.39 W/m2 were recorded in March and June, respectively.
- Based on the CFSR dataset, the mean values fall within the range of 124.16–329.77 W/m2. April had the lowest recorded value of 16.00 W/m2, while August had the highest recorded value of 378.0 W/m2.
- By analyzing the ERA5 dataset, it is found that the mean values for all months varied from 121.51 W/m2 to 328.80 W/m2. Moreover, it is noticed that the lowest value of 38.30 W/m2 was observed in March, while the highest value of 342.2 W/m2 was recorded in June.
- By considering the ERA5-Land dataset, it is observed that the mean value ranged from 118.58 W/m2 to 325.95 W/m2. Moreover, the maximum and minimum solar radiation values were recorded in March and June with values of 39.10 W/m2 and 341.90 W/m2, respectively.
- Based on the MERRA-2 dataset, the WPD values varied from 130.98 to 339.85 W/m2. March had the lowest recorded value of 59.20 W/m2, while June had the highest recorded value of 360.90 W/m2.
- The selection of the best dataset varies for each month based on the R-squared value. However, it is crucial to note that higher R-squared values do not automatically indicate the superiority of one dataset over another. R-squared merely reflects the strength of the linear relationship between the observed and modeled values. Therefore, to determine the best dataset, the analysis also considered RMSE, MAE, and RRMSE, as these metrics provide additional insights beyond the R-squared value.
- Among the available datasets, ERA5-Land consistently demonstrated the best performance when the data for the whole year were used, as indicated by the lower values of RMSE and MAE when compared to the other datasets.
- For the whole year, the RRMSE values for all datasets ranged from 20% to 30%, suggesting a good performance rate. This finding is supported by the results presented in Table S2 in the Supplementary Materials.
3.3. Assessment of Wind and Solar Energy Potential Based on the Long Period of 2000–2022
3.3.1. Wind Speed Characteristics and Wind Power Density at a Height of 10 m
3.3.2. Solar Radiation Characteristics
3.4. Economic Analysis of Wind and Solar Project in Az-Zāwiyah during 2022
- The lifetime of the turbine and PV is assumed to be 20 years and 25 years, respectively.
- The interest rate and inflation rate were taken as 7% and 8%, respectively.
- The engineering cost, civil work cost, installation cost, cost of transport, cost of the electrical connection, and miscellaneous costs were assumed to be 2%, 5%, 8%, 2%, 7%, and 1%, respectively, of the cost of the wind turbine.
- The scrap value was assumed to be 10% of the turbine price and civil work cost.
- The price of the electricity was taken as USD 0.10 to ensure the economic viability and feasibility of the project.
- The capacity of the RO plant is 200 L/h and it costs about USD 2000 based on the available literature. Calculations consider that the plant is under operation 17 h/day.
3.4.1. Economic Analysis of Wind Turbines for the Period of January 2022–December 2022
3.4.2. Economic Analysis of PV System for the Period of January 2022–December 2022
- The annual energy production (AEP) for Farm 1 falls within the range of 154,055 to 169,422 kWh, while for Farm 2, it ranges from 49,086 to 53,982 kWh.
- Both farms exhibit similar ranges for annual capacity factor (ACF), performance ratio (PR), and system efficiency, which are approximately 17.2% to 18.9%, 79.88% to 79.92%, and 69.35% to 69.38%, respectively.
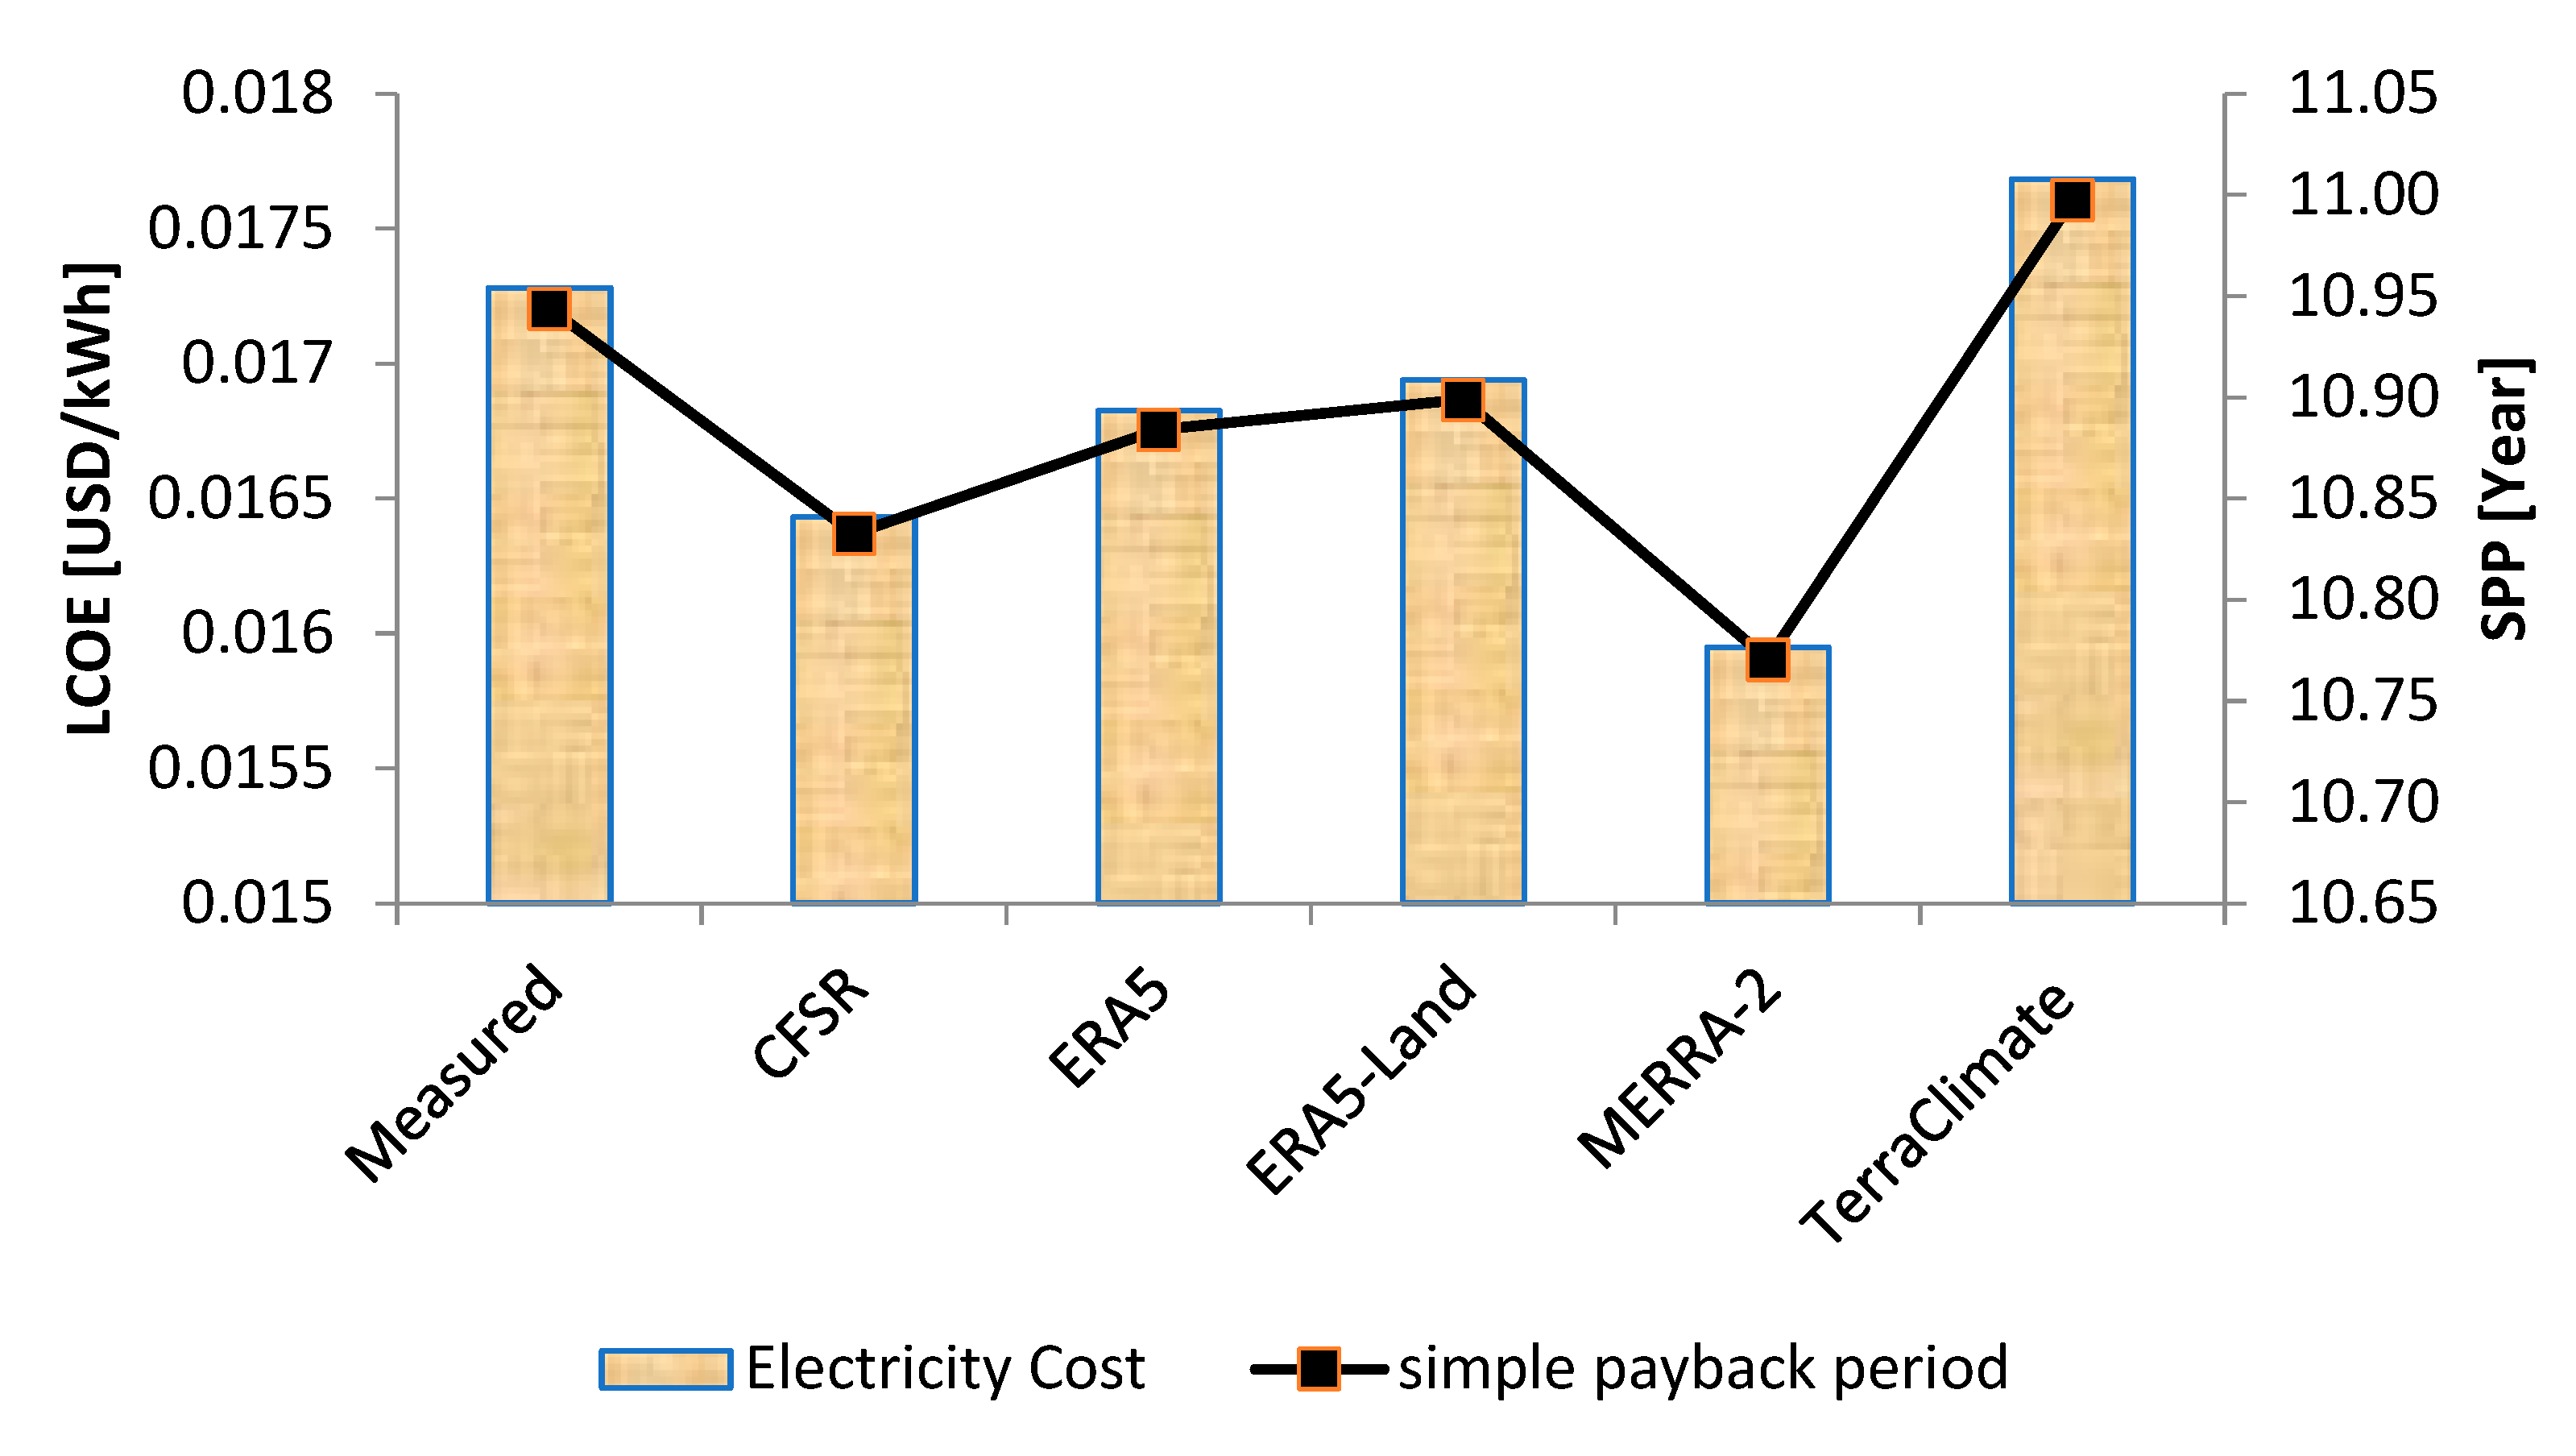
- The electricity generation cost (LCOE) for Farm 1 varies from 0.0161 to 0.0178 USD/kWh, whereas for Farm 2, it ranges between 0.0200 and 0.0222 USD/kWh.
- The simple payback period (SPP) for Farm 1 is estimated to be between 10.89 and 11.12 years, while for Farm 2, it falls within the range of 14.20 to 14.60 years.
- These findings provide insights into the economic viability and performance of the PV systems at Farm 1 and Farm 2 across the considered datasets.
- The analysis suggests that the solar potential is relatively consistent across different datasets, as the values obtained are similar or closely aligned with the measured data. This indicates that the solar energy generation potential remains relatively uniform regardless of the specific dataset used for evaluation.
3.5. Economic Analysis of Wind and Solar Projects in All Selected Locations during the Period of 2000–2022
4. Discussion
5. Conclusions
6. Future Work
Supplementary Materials
Author Contributions
Funding
Data Availability Statement
Acknowledgments
Conflicts of Interest
References
- Kavari, G.; Tahani, M.; Mirhosseini, M. Wind shear effect on aerodynamic performance and energy production of horizontal axis wind turbines with developing blade element momentum theory. J. Clean. Prod. 2019, 219, 368–376. [Google Scholar] [CrossRef]
- Irfan, M.; Elavarasan, R.M.; Hao, Y.; Feng, M.; Sailan, D. An assessment of consumers’ willingness to utilize solar energy in China: End-users’ perspective. J. Clean. Prod. 2021, 292, 126008. [Google Scholar] [CrossRef]
- Hossain, M.R.; Singh, S.; Sharma, G.D.; Apostu, S.A.; Bansal, P. Overcoming the shock of energy depletion for energy policy? Tracing the missing link between energy depletion, renewable energy development and decarbonization in the USA. Energy Policy 2023, 174, 113469. [Google Scholar] [CrossRef]
- Olabi, A.G.; Abdelkareem, M.A. Renewable energy and climate change. Renew. Sustain. Energy Rev. 2022, 158, 112111. [Google Scholar] [CrossRef]
- Potić, I.; Joksimović, T.; Milinčić, U.; Kićović, D.; Milinčić, M. Wind energy potential for the electricity production-Knjaževac Municipality case study (Serbia). Energy Strategy Rev. 2021, 33, 100589. [Google Scholar] [CrossRef]
- Mohamadi, H.; Saeedi, A.; Firoozi, Z.; Zangabadi, S.S.; Veisi, S. Assessment of wind energy potential and economic evaluation of four wind turbine models for the east of Iran. Heliyon 2021, 7, e7234. [Google Scholar] [CrossRef] [PubMed]
- Dehghani-Sanij, A.R.; Al-Haq, A.; Bastian, J.; Luehr, G.; Nathwani, J.; Dusseault, M.B.; Leonenko, Y. Assessment of current developments and future prospects of wind energy in Canada. Sustain. Energy Technol. Assess. 2022, 50, 101819. [Google Scholar] [CrossRef]
- Kassem, Y.; Gökçekuş, H.; Güvensoy, A. Techno-economic feasibility of grid-connected solar PV system at Near East University hospital, Northern Cyprus. Energies 2021, 14, 7627. [Google Scholar] [CrossRef]
- Maammeur, H.; Hamidat, A.; Loukarfi, L.; Missoum, M.; Abdeladim, K.; Nacer, T. Performance investigation of grid-connected PV systems for family farms: Case study of North-West of Algeria. Renew. Sustain. Energy Rev. 2017, 78, 1208–1220. [Google Scholar] [CrossRef]
- Ayadi, O.; Al-Assad, R.; Al Asfar, J. Techno-economic assessment of a grid connected photovoltaic system for the University of Jordan. Sustain. Cities Soc. 2018, 39, 93–98. [Google Scholar] [CrossRef]
- Al-Najideen, M.I.; Alrwashdeh, S.S. Design of a solar photovoltaic system to cover the electricity demand for the faculty of Engineering-Mu’tah University in Jordan. Resour. Effic. Technol. 2017, 3, 440–445. [Google Scholar] [CrossRef]
- Elnaggar, M.; Edwan, E.; Ritter, M. Wind energy potential of Gaza using small wind turbines: A feasibility study. Energies 2017, 10, 1229. [Google Scholar] [CrossRef]
- Alsuessi, W. General electricity company of Libya (GECOL). Eur. Int. J. Sci. Technol 2015, 4, 61–69. [Google Scholar]
- Rohouma, W.; Zubi, H.; Sannuga, S. Adoption of Smart Grid in Libya challenges and opportunities. In Proceedings of the 3rd International Conference on Automation, Control, Engineering and Computer Science, Hammamet, Tunisia, 20–22 March 2016. [Google Scholar]
- Sorensen, B. Renewable Energy: Physics, Engineering, Environmental Impacts, Economics and Planning; Academic Press: Cambridge, MA, USA, 2017. [Google Scholar]
- Alasali, F.; Saidi, A.S.; El-Naily, N.; Alsmadi, O.; Khaleel, M.; Ghirani, I. Assessment of the impact of a 10-MW grid-tied solar system on the Libyan grid in terms of the power-protection system stability. Clean Energy 2023, 7, 389–407. [Google Scholar] [CrossRef]
- U.S. Energy Information Administration. Country Analysis Executive Summary: Libya. 2022. Available online: https://www.eia.gov/international/analysis/country/LBY (accessed on 10 April 2023).
- Dagroum, A.; Assnousi, M.; Elhsaeshi, A. Integration of Renewable Energy into Libyan Electrical Grid, General Electricity Company of Libya (GECOL); United Nations: New York, NY, USA, 2014. [Google Scholar]
- Lochner, S.; Dieckhöner, C. Civil unrest in North Africa—Risks for natural gas supply? Energy Policy 2012, 45, 167–175. [Google Scholar] [CrossRef]
- African Development Bank Group. Libya Renewable Energy. Available online: https://www.afdb.org/en/countries/north-africa/libya/libya-renewable-energy (accessed on 26 April 2023).
- Al Jazeera. Libya Eyes Clean Energy with New Wind Farm. Available online: https://www.aljazeera.com/economy/2018/11/13/libya-eyes-clean-energy-with-new-wind-farm (accessed on 13 November 2022).
- National Renewable Energy Authority. Study on Solar Energy Potential in Libya; Renewable Energy and Energy Efficiency Authority (REEEA): Golden, CO, USA, 2006. [Google Scholar]
- Moner-Girona, M.; Szabo, S.; Caldés, N.; Bódis, K. Assessment of the Rooftop Solar Potential in the Mediterranean Region; European Commission, Joint Research Centre, Institute for Energy and Transport: Petten, The Netherlands, 2011. [Google Scholar]
- IRENA. Renewable Energy Prospects for North Africa: Summary for Policy Makers; International Renewable Energy Agency: Abu Dhabi, United Arab Emirates, 2016; Available online: https://www.irena.org/publications/2016/Sep/Renewable-Energy-Prospects-for-North-Africa (accessed on 15 May 2023).
- Solar Energy Solutions. Solar Energy Solutions Plans to Build Libya’s First 50 MW Solar Power Plant. PV Magazine. 5 August 2019. Available online: https://www.pv-magazine.com/2019/08/05/solar-energy-solutions-plans-to-build-libyas-first-50-mw-solar-power-plant/ (accessed on 12 April 2023).
- PV Magazine. LEC Plans 500 MW Sebha Solar Power Plant. PV Magazine. 22 October 2020. Available online: https://www.pv-magazine.com/2020/10/22/lec-plans-500-mw-sebha-solar-power-plant/ (accessed on 20 April 2023).
- El-Osta, W.; Belhag, M.; Klat, M.; Fallah, I.; Kalifa, Y. Wind farm pilot project in Libya. Renew. Energy 1995, 6, 639–642. [Google Scholar] [CrossRef]
- Kershman, S.A.; Rheinländer, J.; Gabler, H. Seawater reverse osmosis powered from renewable energy sources-hybrid wind/photovoltaic/grid power supply for small-scale desalination in Libya. Desalination 2003, 153, 17–23. [Google Scholar] [CrossRef]
- El-Osta, W.; Kalifa, Y. Prospects of wind power plants in Libya: A case study. Renew. Energy 2003, 28, 363–371. [Google Scholar] [CrossRef]
- Ibrahim, S. Prospects of Renewable Energy in Libya. Ph.D. Thesis, Al-Fateh University, Tripoli, Libya, 2006. [Google Scholar]
- Abohedma, M.B.; Alshebani, M.M. Wind load characteristics in Libya. Int. J. Civ. Environ. Eng. 2010, 4, 88–91. [Google Scholar]
- Abulqasem, K.; Alghoul, M.A.; Mohammed, M.N.; Mustafa, A.; Glaisa, K.; Amin, N.; Zaharim, A.; Sopian, K. Optimization of renewable power system for small scale seawater reverse osmosis desalination unit in Mrair-Gabis village, Libya. Recent Res. Appl. Math. Simul. Model. 2011, 2011, 155–160. [Google Scholar]
- Mustafa, A.; Alghoul, M.A.; Asim, N.; Glaisa, K.H.; Abulqasem, K.H.; Mohammed, M.N. Potential of renewable system powering a mosque in libya. Models Methods Appl. Sci. 2012, 2012, 139–144. [Google Scholar]
- Ali, N.; Ramakumar, R. Impact of the penetration of wind power on the Libyan power system. In Proceedings of the 2012 IEEE Power and Energy Society General Meeting, IEEE, San Diego, CA, USA, 22–26 July 2012; pp. 1–8. [Google Scholar]
- Mohamed, A.M.; Al-Habaibeh, A.; Abdo, H. An investigation into the current utilisation and prospective of renewable energy resources and technologies in Libya. Renew. Energy 2013, 50, 732–740. [Google Scholar] [CrossRef]
- Ahwide, F.; Spena, A.; El-Kafrawy, A. Estimation of electricity generation in libya using processing technology of wind available data: The case study in derna. APCBEE Procedia 2013, 5, 451–467. [Google Scholar] [CrossRef]
- Asheibe, A.; Khalil, A. The renewable energy in Libya: Present difficulties and remedies. In Proceedings of the 35th IAHR World Congress, Chengdu, China, 8–13 September 2013; pp. 34–44. [Google Scholar]
- Glaisa, K.A.; Elayeb, M.E.; Shetwan, M.A. Potential of hybrid system powering school in Libya. Energy Procedia 2014, 57, 1411–1420. [Google Scholar] [CrossRef]
- Elmabruk, A.M.; Aleej, F.A.; Badii, M.M. Estimation of wind energy in Libya. In Proceedings of the 2014 5th International Renewable Energy Congress (IREC), Hammamet, Tunisia, 25–27 March 2014; pp. 1–6. [Google Scholar]
- Salem Elmnefi, M.; Bofares, A.M. An Analysis of Wind Speed Distribution at Benina, Benghazi, Libya. Appl. Mech. Mater. 2014, 492, 550–555. [Google Scholar] [CrossRef]
- Al-Behadili, S.H.; El-Osta, W.B. Life cycle assessment of Dernah (Libya) wind farm. Renew. Energy 2015, 83, 1227–1233. [Google Scholar] [CrossRef]
- Khalil, A.; Asheibe, A. The chances and challenges for renewable energy in Libya. In Proceedings of the 4th International Conference on Renewable Energy Research and Applications, Palermo, Italy, 22–25 November 2015; pp. 1–6. [Google Scholar]
- Mohamed, A.M.; Al-Habaibeh, A.; Abdo, H. Future prospects of the renewable energy sector in Libya. In Proceedings of the SBE16, Dubai, United Arab Emirates, 17–19 January 2016; pp. 1–8. [Google Scholar]
- Ahwide, F.; Ismail, A. Wind Energy Resources Estimation and Assessment for AL-Maqrun Town-Libya. Sol. Energy Sustain. Dev. J. 2016, 5, 22–41. [Google Scholar] [CrossRef]
- Gawedar, A.; Ramakumar, R. Impact of wind energy system integration on the Al-Zawiya refinery electric grid in Libya. J. Power Energy Eng. 2016, 4, 11. [Google Scholar] [CrossRef]
- Mohamed, A.M.A. Investigation into the Feasibility of the Utilisation of Renewable Energy Resources in Libya. Ph.D. Thesis, Nottingham Trent University, Nottingham, UK, 2016. [Google Scholar]
- Tjahjana, D.D.D.P.; Salem, A.A.; Himawanto, D.A. Wind energy potential analysis in Al-Fattaih-Darnah. In Sustainable Energy and Advanced Materials: Proceeding of the 4th International Conference and Exhibition on Sustainable Energy and Advanced Materials 2015 (ICE-SEAM 2015), Solo, Indonesia, 11–12 November 2015; AIP Publishing: Long Island, NY, USA, 2016; Volume 1717. [Google Scholar]
- Ahwide, F.; Aldali, Y. Wind Characteristics and Wind Energy Potential in Libya: The case study in Derna. Al-Mukhtar J. Eng. Res. 2017, 9, 1–13. [Google Scholar]
- Rajab, Z.; Zuhier, M.; Khalil, A.; El-Faitouri, A.S. Techno-economic feasibility study of Solar Water Heating system in Libya. In Proceedings of the 2017 8th International Renewable Energy Congress (IREC), Amman, Jordan, 21–23 March 2017; pp. 1–6. [Google Scholar]
- Belgasim, B.; Aldali, Y.; Abdunnabi, M.J.; Hashem, G.; Hossin, K. The potential of concentrating solar power (CSP) for electricity generation in Libya. Renew. Sustain. Energy Rev. 2018, 90, 1–15. [Google Scholar] [CrossRef]
- Mohamed, O.A.; Masood, S.H. A brief overview of solar and wind energy in Libya: Current trends and the future development. IOP Conf. Ser. Mater. Sci. Eng. 2018, 377, 012136. [Google Scholar] [CrossRef]
- Jenkins, P.; Elmnifi, M.; Younis, A.; Emhamed, A. Hybrid power generation by using solar and wind energy: Case study. World J. Mech. 2019, 9, 81–93. [Google Scholar] [CrossRef]
- Teyabeen, A.; Akkari, F.; Jwaid, A.; Zaghwan, A.; Abodelah, R. Assessment of Wind Energy Potential in Zwara, Libya. Sol. Energy Sustain. Dev. J. 2019, 8, 34–49. [Google Scholar] [CrossRef]
- Shreif, H.; El-Osta, W.; Yagub, A. Wind Resource Assessment for southern part of Libya: Case Study of Hun. Sol. Energy Sustain. Dev. J. 2019, 8, 12–33. [Google Scholar] [CrossRef]
- Kassem, Y.; Çamur, H.; AbuGharara, M.A. Assessment of wind energy potential for selecting small-scale wind turbines in low wind locations in Libya: A comparative study. Int. J. Eng. Res. Technol. 2019, 12, 820–836. [Google Scholar]
- Yahya, W.; Nassar, A.; Mansur, F.A.; Al-Nehari, M.; Alnakhlani, M.M. Future study of renewable energy in Libya. Int. J. Adv. Eng. Res. Sci. 2020, 7, 2561. [Google Scholar] [CrossRef]
- Moria, H.; Elmnifi, M. Feasibility study into possibility potentials and challenges of renewable energy in Libya. Int. J. Adv. Sci. Technol. 2020, 29, 12546–12560. [Google Scholar]
- Elshabli, A.; Hashem, G.; Hossin, K. Assessment of the potential for hydrogen production from renewable resources in Libya. In Proceedings of the 2020 Advances in Science and Engineering Technology International Conferences (ASET), Dubai, United Arab Emirates, 4 February–9 April 2020; pp. 1–9. [Google Scholar]
- Asharaa, A. An Assessment of Renewable Energy Sources (RES) Potential in Libya: An Overview. In Proceedings of the 1st International Multi-Disciplinary Conference Theme: Sustainable Development and Smart Planning (IMDC-SDSP 2020), Online, 28–30 June 2020. [Google Scholar]
- Kassem, Y.; Çamur, H.; Aateg, R.A.F. Exploring solar and wind energy as a power generation source for solving the electricity crisis in Libya. Energies 2020, 13, 3708. [Google Scholar] [CrossRef]
- Kassem, Y.; Camur, H.; Abughinda, O.A. Solar energy potential and feasibility study of a 10MW grid-connected solar plant in Libya. Eng. Technol. Appl. Sci. Res. 2020, 10, 5358–5366. [Google Scholar] [CrossRef]
- Almaktar, M.; Elbreki, A.M.; Shaaban, M. Revitalizing operational reliability of the electrical energy system in Libya: Feasibility analysis of solar generation in local communities. J. Clean. Prod. 2021, 279, 123647. [Google Scholar] [CrossRef]
- Almaktar, M.; Shaaban, M. Prospects of renewable energy as a non-rivalry energy alternative in Libya. Renew. Sustain. Energy Rev. 2021, 143, 110852. [Google Scholar] [CrossRef]
- Maka, A.O.; Salem, S.; Mehmood, M. Solar photovoltaic (PV) applications in Libya: Challenges, potential, opportunities and future perspectives. Clean. Eng. Technol. 2021, 5, 100267. [Google Scholar] [CrossRef]
- Selimli, S.; Shtewi, F.A.; Fahed, A.K.A.; Koymatcik, Ç.Y.; Özkaymak, M. Investigation of Wind Energy Potential of Four Different Sites of Libya by Using Weibull Distribution. Konya J. Eng. Sci. 2021, 9, 766–786. [Google Scholar] [CrossRef]
- Elmariami, A.; Elosta, W.; Elfleet, M.; Khalifa, Y. Assessment of Energy and Environment Footprint of a Proposed Wind Farm in Western Coast of Libya Using LCA. Preprints, 2021.
- Jary, A.M.; Elmnifi, M.; Said, Z.; Habeeb, L.J.; Moria, H. Potential wind energy in the cities of the Libyan coast, a feasibility study. J. Mech. Eng. Res. Dev. 2021, 44, 236–252. [Google Scholar]
- Mrehel, O.G.; Salama, A.G. Energy generation potential from wind power in the Southern Libyan Regions. In Proceedings of the 2021 IEEE 1st International Maghreb Meeting of the Conference on Sciences and Techniques of Automatic Control and Computer Engineering (MI-STA), Tripoli, Libya, 25–27 May 2021; pp. 548–553. [Google Scholar]
- Salim, E.; Amar, A.A. Potential of Renewable Energy Resources in Aljofra-Libya. Int. J. Eng. Res. Technol. 2021, 10, 292–299. [Google Scholar]
- Makken, S.; Shoai, N.; Abdall, A.B. A Comprehensive Economic Analysis of Solar and Wind Power and its Suitability to Libya. In Proceedings of the International Conference on Renewable and Sustainable Energy, Elbieda, Libya, 10–13 October 2021; pp. 1–8. [Google Scholar]
- Badi, I.; Pamučar, D.; Stević, Ž.; Muhammad, L.J. Wind farm site selection using BWM-AHP-MARCOS method: A case study of Libya. Sci. Afr. 2023, 19, e01511. [Google Scholar] [CrossRef]
- Badi, I.; Abdulshahed, A.; Alghazel, E. Using Grey-TOPSIS approach for solar farm location selection in Libya. Rep. Mech. Eng. 2023, 4, 80–89. [Google Scholar] [CrossRef]
- Khan, Z.A.; Imran, M.; Altamimi, A.; Diemuodeke, O.E.; Abdelatif, A.O. Assessment of wind and solar hybrid energy for agricultural applications in Sudan. Energies 2021, 15, 5. [Google Scholar] [CrossRef]
- Xydis, G. A wind energy integration analysis using wind resource assessment as a decision tool for promoting sustainable energy utilization in agriculture. J. Clean. Prod. 2015, 96, 476–485. [Google Scholar] [CrossRef]
- Kumar, C.M.S.; Singh, S.; Gupta, M.K.; Nimdeo, Y.M.; Raushan, R.; Deorankar, A.V.; Kumar, T.A.; Rout, P.K.; Chanotiya, C.; Pakhale, V.D.; et al. Solar energy: A promising renewable source for meeting energy demand in Indian agriculture applications. Sustain. Energy Technol. Assess. 2023, 55, 102905. [Google Scholar] [CrossRef]
- Kanwal, A.; Tahir, Z.U.R.; Asim, M.; Hayat, N.; Farooq, M.; Abdullah, M.; Azhar, M. Evaluation of reanalysis and analysis datasets against measured wind data for wind resource assessment. Energy Environ. 2022, 4, 1258–1284. [Google Scholar] [CrossRef]
- Ben, U.C.; Akpan, A.E.; Mbonu, C.C.; Ufuafuonye, C.H. Integrated technical analysis of wind speed data for wind energy potential assessment in parts of southern and central Nigeria. Clean. Eng. Technol. 2021, 2, 100049. [Google Scholar] [CrossRef]
- Sanz Rodrigo, J.; Buchlin, J.M.; van Beeck, J.; Lenaerts, J.; van den Broeke, M.R. Evaluation of the antarctic surface wind climate from ERA reanalyses and RACMO2/ANT simulations based on automatic weather stations. Clim. Dyn. 2013, 40, 353–376. [Google Scholar] [CrossRef]
- Carvalho, D.; Rocha, A.; Gómez-Gesteira, M.; Santos, C.S. Offshore wind energy resource simulation forced by different reanalyses: Comparison with observed data in the Iberian Peninsula. Appl. Energy 2014, 134, 57–64. [Google Scholar] [CrossRef]
- McKenna, R.V.; Hollnaicher, S.; van der Leye, P.O.; Fichtner, W. Cost-potentials for large onshore wind turbines in Europe. Energy 2015, 83, 217–229. [Google Scholar] [CrossRef]
- Mentis, D.; Hermann, S.; Howells, M.; Welsch, M.; Siyal, S.H. Assessing the technical wind energy potential in Africa a GIS-based approach. Renew. Energy 2015, 83, 110–125. [Google Scholar] [CrossRef]
- Mentis, D.; Siyal, S.H.; Korkovelos, A.; Howells, M. A geospatial assessment of the techno-economic wind power potential in India using geographical restrictions. Renew. Energy 2016, 97, 77–88. [Google Scholar] [CrossRef]
- Arreyndip, N.A.; Joseph, E. Small 500 kW onshore wind farm project in Kribi, Cameroon: Sizing and checkers layout optimization model. Energy Rep. 2018, 4, 528–535. [Google Scholar] [CrossRef]
- Onea, F.; Rusu, E. Sustainability of the reanalysis databases in predicting the wind and wave power along the european coasts. Sustainability 2018, 10, 193. [Google Scholar] [CrossRef]
- Olauson, J. ERA5: The new champion of wind power modelling? Renew. Energy 2018, 126, 322–331. [Google Scholar] [CrossRef]
- Carvalho, D.; Rocha, A.; Gómez-Gesteira, M.; Santos, C.S. WRF wind simulation and wind energy production estimates forced by different reanalyses: Comparison with observed data for Portugal. Appl. Energy 2014, 117, 116–126. [Google Scholar] [CrossRef]
- Dabar, O.A.; Awaleh, M.O.; Kirk-Davidoff, D.; Olauson, J.; Söder, L.; Awaleh, S.I. Wind resource assessment and economic analysis for electricity generation in three locations of the Republic of Djibouti. Energy 2019, 185, 884–894. [Google Scholar] [CrossRef]
- Boudia, S.M.; Santos, J.A. Assessment of large-scale wind resource features in Algeria. Energy 2019, 189, 116299. [Google Scholar] [CrossRef]
- Gudo, A.J.A.; Deng, J.; Belete, M.; Abubakar, G.A. Estimation of Small Onshore Wind Power Development for Poverty Reduction in Jubek State, South Sudan, Africa. Sustainability 2020, 12, 1483. [Google Scholar] [CrossRef]
- Arreyndip, N.A.; Joseph, E.; David, A. Wind energy potential assessment of Cameroon’s coastal regions for the installation of an onshore wind farm. Heliyon 2016, 2, 1–19. [Google Scholar] [CrossRef]
- Miao, H.; Dong, D.; Huang, G.; Hu, K.; Tian, Q.; Gong, Y. Evaluation of Northern Hemisphere surface wind speed and wind power density in multiple reanalysis datasets. Energy 2020, 200, 117382. [Google Scholar] [CrossRef]
- Ruiz, S.A.G.; Barriga, J.E.C.; Martínez, J.A. Wind power assessment in the Caribbean region of Colombia, using ten-minute wind observations and ERA5 data. Renew. Energy 2021, 172, 158–176. [Google Scholar] [CrossRef]
- Gualtieri, G. Reliability of ERA5 reanalysis data for wind resource assessment: A comparison against tall towers. Energies 2021, 14, 4169. [Google Scholar] [CrossRef]
- Hiçsönmez, B.; Kassem, Y.; Gökçekuş, H. Techno-Economic Assessment of Wind Potential at Five Locations In Northern Cyprus Using Open Source Wind Data. Int. J. Sci. Technol. Res. 2021, 10, 294–299. [Google Scholar]
- Jung, C.; Schindler, D. On the influence of wind speed model resolution on the global technical wind energy potential. Renew. Sustain. Energy Rev. 2022, 156, 112001. [Google Scholar] [CrossRef]
- Fekih, A.; Abdelouahab, M.; Marif, Y. Evaluation of wind resource and mapping during 2009–2018 based on ERA5 reanalysis data: A case study over Algeria. Int. J. Energy Environ. Eng. 2022, 14, 15–34. [Google Scholar] [CrossRef]
- Celik, A.N. A statistical analysis of wind power density based on the Weibull and Rayleigh models at the southern region of Turkey. Renew. Energy 2004, 29, 593–604. [Google Scholar] [CrossRef]
- Hussain, I.; Haider, A.; Ullah, Z.; Russo, M.; Casolino, G.M.; Azeem, B. Comparative Analysis of Eight Numerical Methods Using Weibull Distribution to Estimate Wind Power Density for Coastal Areas in Pakistan. Energies 2023, 16, 1515. [Google Scholar] [CrossRef]
- Serban, A.; Paraschiv, L.S.; Paraschiv, S. Assessment of wind energy potential based on Weibull and Rayleigh distribution models. Energy Rep. 2020, 6, 250–267. [Google Scholar] [CrossRef]
- Ali, S.; Lee, S.M.; Jang, C.M. Statistical analysis of wind characteristics using Weibull and Rayleigh distributions in Deokjeok-do Island–Incheon, South Korea. Renew. Energy 2018, 123, 652–663. [Google Scholar] [CrossRef]
- Ouarda, T.; Charron, C.; Shin, J.-Y.; Marpu, P.; Al-Mandoos, A.; Al-Tamimi, M.; Ghedira, H.; Al Hosary, T. Probability distributions of wind speed in the UAE. Energy Convers. Manag. 2015, 93, 414–434. [Google Scholar] [CrossRef]
- Alayat, M.M.; Kassem, Y.; Çamur, H. Assessment of wind energy potential as a power generation source: A case study of eight selected locations in Northern Cyprus. Energies 2018, 11, 2697. [Google Scholar] [CrossRef]
- Khan, M.A.; Çamur, H.; Kassem, Y. Modeling predictive assessment of wind energy potential as a power generation sources at some selected locations in Pakistan. Model. Earth Syst. Environ. 2019, 5, 555–569. [Google Scholar] [CrossRef]
- Alavi, O.; Mohammadi, K.; Mostafaeipour, A. Evaluating the suitability of wind speed probability distribution models: A case of study of east and southeast parts of Iran. Energy Convers. Manag. 2016, 119, 101–108. [Google Scholar] [CrossRef]
- Masseran, N. Evaluating wind power density models and their statistical properties. Energy 2015, 84, 533–541. [Google Scholar] [CrossRef]
- Kassem, Y.; Gökçekuş, H.; Iravanian, A.; Gökçekuş, R. Predictive suitability of renewable energy for desalination plants: The case of Güzelyurt region in northern Cyprus. Model. Earth Syst. Environ. 2021, 8, 3657–3677. [Google Scholar] [CrossRef]
- Natarajan, N.; Vasudevan, M.; Rehman, S. Evaluation of suitability of wind speed probability distribution models: A case study from Tamil Nadu, India. Environ. Sci. Pollut. Res. 2022, 29, 85855–85868. [Google Scholar] [CrossRef]
- Kassem, Y.; Abdalla, M.H.A. Modeling predictive suitability to identify the potential of wind and solar energy as a driver of sustainable development in the Red Sea State, Sudan. Environ. Sci. Pollut. Res. 2022, 29, 44233–44254. [Google Scholar] [CrossRef] [PubMed]
- Aries, N.; Boudia, S.M.; Ounis, H. Deep assessment of wind speed distribution models: A case study of four sites in Algeria. Energy Convers. Manag. 2018, 155, 78–90. [Google Scholar] [CrossRef]
- Wais, P. Two and three-parameter Weibull distribution in available wind power analysis. Renew. Energy 2017, 103, 15–29. [Google Scholar] [CrossRef]
- Filom, S.; Radfar, S.; Panahi, R.; Amini, E.; Neshat, M. Exploring wind energy potential as a driver of sustainable development in the southern coasts of Iran: The importance of wind speed statistical distribution model. Sustainability 2021, 13, 7702. [Google Scholar] [CrossRef]
- Kassem, Y.; Gökçekuş, H.; Zeitoun, M. Modeling of techno-economic assessment on wind energy potential at three selected coastal regions in Lebanon. Model. Earth Syst. Environ. 2019, 5, 1037–1049. [Google Scholar] [CrossRef]
- Gökçekuş, H.; Kassem, Y.; Al Hassan, M. Evaluation of wind potential at eight selected locations in Northern Lebanon using open source data. Int. J. Appl. Eng. Res. 2019, 14, 2789–2794. [Google Scholar]
- Khlaifat, N.; Altaee, A.; Zhou, J.; Huang, Y. Evaluation of wind resource potential using statistical analysis of probability density functions in New South Wales, Australia. Energy Sources Part A Recovery Util. Environ. Eff. 2020, 1–18. [Google Scholar] [CrossRef]
- Kassem, Y.; Gokcekus, H.; Essayah, A.M.S. Wind Power Potential Assessment at Different Locations in Lebanon: Best–Fit Probability Distribution Model and Techno-Economic Feasibility. Eng. Technol. Appl. Sci. Res. 2023, 13, 10578–10587. [Google Scholar] [CrossRef]
- Kassem, Y.; Çamur, H.; Alhuoti, S.M.A. Solar energy technology for Northern Cyprus: Assessment, statistical analysis, and feasibility study. Energies 2020, 13, 940. [Google Scholar] [CrossRef]
- Fazelpour, F.; Soltani, N.; Soltani, S.; Rosen, M.A. Assessment of wind energy potential and economics in the north-western Iranian cities of Tabriz and Ardabil. Renew. Sustain. Energy Rev. 2015, 45, 87–99. [Google Scholar] [CrossRef]
- Fazelpour, F.; Markarian, E.; Soltani, N. Wind energy potential and economic assessment of four locations in Sistan and Balouchestan province in Iran. Renew. Energy 2017, 109, 646–667. [Google Scholar] [CrossRef]
- Fornarelli, R.; Shahnia, F.; Anda, M.; Bahri, P.A.; Ho, G. Selecting an economically suitable and sustainable solution for a renewable energy-powered water desalination system: A rural Australian case study. Desalination 2018, 435, 128–139. [Google Scholar] [CrossRef]
- WATTUNEED. Multisolar 30 kW Hybrid Inverter. Available online: https://www.wattuneed.com/en/inverters-chargers/25737-multisolar-30kw-hybrid-inverter-0768563819032.html (accessed on 20 April 2023).
- WATTUNEED. Multisolar 10 kW Hybrid Inverter. Available online: https://www.wattuneed.com/en/inverters-chargers/1177-ups-hybrid-10kw-injection-network-storage-multisolar-0712971128019.html (accessed on 5 March 2023).
- Rafique, M.M.; Rehman, S.; Alam, M.M.; Alhems, L.M. Feasibility of a 100 MW installed capacity wind farm for different climatic conditions. Energies 2018, 11, 2147. [Google Scholar] [CrossRef]
- Adeyeye, K.A.; Ijumba, N.; Colton, J.S. A Techno-Economic Model for Wind Energy Costs Analysis for Low Wind Speed Areas. Processes 2021, 9, 1463. [Google Scholar] [CrossRef]
- Owolabi, A.B.; Nsafon, B.E.K.; Roh, J.W.; Suh, D.; Huh, J.S. Validating the techno-economic and environmental sustainability of solar PV technology in Nigeria using RETScreen Experts to assess its viability. Sustain. Energy Technol. Assess. 2019, 36, 100542. [Google Scholar] [CrossRef]
- Satyanarayana Gubbala, C.; Dodla, V.B.R.; Desamsetti, S. Assessment of wind energy potential over India using high-resolution global reanalysis data. J. Earth Syst. Sci. 2021, 130, 64. [Google Scholar] [CrossRef]
- Gualtieri, G. Analysing the uncertainties of reanalysis data used for wind resource assessment: A critical review. Renew. Sustain. Energy Rev. 2022, 167, 112741. [Google Scholar] [CrossRef]
- Yildirir, V.; Rusu, E.; Onea, F. Wind energy assessments in the northern Romanian coastal environment based on 20 years of data coming from different sources. Sustainability 2022, 14, 4249. [Google Scholar] [CrossRef]
- Piasecki, A.; Jurasz, J.; Kies, A. Measurements and reanalysis data on wind speed and solar irradiation from energy generation perspectives at several locations in Poland. SN Appl. Sci. 2019, 1, 865. [Google Scholar] [CrossRef]
- Khatibi, A.; Krauter, S. Validation and performance of satellite meteorological dataset MERRA-2 for solar and wind applications. Energies 2021, 14, 882. [Google Scholar] [CrossRef]
- Gairaa, K.; Bakelli, Y. Solar energy potential assessment in the Algerian south area: Case of Ghardaïa region. J. Renew. Energy 2013, 2013, 496348. [Google Scholar] [CrossRef]
- Belkilani, K.; Ben Othman, A.; Besbes, M. Assessment of global solar radiation to examine the best locations to install a PV system in Tunisia. Appl. Phys. A 2018, 124, 122. [Google Scholar] [CrossRef]
- Allouhi, A.; Zamzoum, O.; Islam, M.R.; Saidur, R.; Kousksou, T.; Jamil, A.; Derouich, A. Evaluation of wind energy potential in Morocco’s coastal regions. Renew. Sustain. Energy Rev. 2017, 72, 311–324. [Google Scholar] [CrossRef]
- Alsaad, M.A. Wind energy potential in selected areas in Jordan. Energy Convers. Manag. 2013, 65, 704–708. [Google Scholar] [CrossRef]
- Ucar, A.; Balo, F. Investigation of wind characteristics and assessment of wind-generation potentiality in Uludağ-Bursa, Turkey. Appl. Energy 2009, 86, 333–339. [Google Scholar] [CrossRef]
- Ammari, H.D.; Al-Rwashdeh, S.S.; Al-Najideen, M.I. Evaluation of wind energy potential and electricity generation at five locations in Jordan. Sustain. Cities Soc. 2015, 15, 135–143. [Google Scholar] [CrossRef]
- Bataineh, K.M.; Dalalah, D. Assessment of wind energy potential for selected areas in Jordan. Renew. Energy 2013, 59, 75–81. [Google Scholar] [CrossRef]
- Mohammadi, K.; Naderi, M.; Saghafifar, M. Economic feasibility of developing grid-connected photovoltaic plants in the southern coast of Iran. Energy 2018, 156, 17–31. [Google Scholar] [CrossRef]
- Imam, A.A.; Al-Turki, Y.A. Techno-economic feasibility assessment of grid-connected PV systems for residential buildings in Saudi Arabia—A Case Study. Sustainability 2020, 12, 262. [Google Scholar] [CrossRef]


| Reference | Year | Location | Description of the Study | Main Finding |
|---|---|---|---|---|
| [27] | 1995 | Zwara | Analyzing the wind speed characteristics using WASP software for wind farm installation | The mean wind speed and wind power density at the selected region are 6.9 m/s and 399 W/m2, respectively |
| [28] | 2003 | Libya’s coastal region | Design of seawater reverse osmosis desalination plants driven by wind and solar energy | The levelized water cost was estimated to be 1.8 EUR/m3 and 1.9 EUR/m3 for scenario 1 (Grid + Wind energy conversion) and scenario 2 (Grid + PV) |
| [29] | 2003 | Zwara | Evaluation of the preliminary feasibility study for the proposed pilot wind farm with a capacity of 6 MW | The project demonstrates economic viability and feasibility |
| [30] | 2006 | Libya | Highlighting the applications of renewable energy, the available resources, and prospects for the use of renewable energy resources in the country | Photovoltaic systems have great potential for diverse applications, especially for supplying electricity to remote areas, supported by economic and technical justifications |
| [31] | 2010 | Ghariat, Obari, Tazerbo, Derna, Sebha, Shahat, Ghat, Misurata, Jaghboub, Hon, Agedabia, Alkomes, Elkufra, Benina, Jalo, Zuara, Sirt, Tubrk, Ghadames, Tripoli, Airport, Nalut, Yefran | Analyzing statistically the wind speed data of 22 metrological stations using Type I extreme value probability distribution | The country can be divided into four zones with a 50-year return period |
| [32] | 2011 | Mrair-Gabis Village | Investigating the potential of utilizing the renewable power system with various configuration options for small-scale seawater reverse osmosis desalination units using HOMWER software | PV/diesel generators/batteries are the best options to generate electricity for small-scale seawater reverse osmosis desalination units |
| [33] | 2012 | Libya | Developing renewable hybrid energy systems as power sources for mosques using HOMER software | PV/diesel generators/batteries are the best options to generate electricity |
| [34] | 2012 | Dernah, Tolmetha, Al-maqrum, Sirt, and Misratah | Addressing the impact of the penetration of wind power on the Libyan power system. Additionally, investigating the wind energy potential using Weibull distribution functions during the period of 1979–1989. | The inclusion of wind generation has been proven to enhance the reliability of power systems |
| [35] | 2013 | Libya | Investigating the present and future utilization of renewable energy (wind and solar) in the country | The country has high wind and solar energy potential. Nevertheless, Libya’s renewable energy potential is hampered by challenges such as legal, political, economic, and financial barriers. |
| [36] | 2013 | Derna | Evaluating the wind speed characteristics using the Weibull distribution function from 2000 to 2009 | Using small-scale wind turbines with lower rated speeds will produce more power than higher-rated speeds at the same hub height |
| [37] | 2013 | Libya | Presenting analytical data on the current and future energy conditions and discussing the challenges and obstacles facing the renewable energy sector in Libya | Libya has huge potential to harness renewable energy through home grid-connected PV systems, large-scale grid-connected wind farms, and concentrated PV systems |
| [38] | 2014 | Misurata | Assessing the economic viability of a hybrid system (PV/diesel generator/battery) as a power source for the school using HOMER software | Excess power from the proposed system in spring, summer, and autumn can be used to reduce the cost of energy or can be sold to the grid |
| [39] | 2014 | Dernah, Musrata, Zuara, and Sebha | Assessing the wind energy potential using the Weibull distribution function | Dernah has the highest maximum energy production compared to other locations |
| [40] | 2014 | Benina-Benghazi | Analyzing the wind speed data statistically using the Weibull distribution function for the year 2008 | The energy density of wind is estimated at 415.82 W/m2 at a height of 10 m, which corresponds to wind energy class 4 |
| [41] | 2015 | Dernah | Evaluate the environmental impact of the wind farm in the selected region | Wind energy stands out for producing the lowest levels of carbon dioxide emissions when compared to fossil fuels and other renewable energy sources |
| [42] | 2015 | Libya | Providing analytical data for the current and future energy situation in the country as well as addressing the challenges and obstacles faced by the renewable energy sector | Solar resources offer immense potential in comparison to wind energy, particularly after considering oil and natural gas |
| [43] | 2016 | Libya | Investigating what is available to the energy sector regarding the use of renewable energy (wind and solar energy) as an alternative energy source | The renewable energy sector could help to cover the energy demand and reduce the amount of CO2 in the country |
| [44] | 2016 | AL-Maqrun Town | Investigating the wind energy potential and the performance of large-scale wind turbines based on year data (2002–2003) | Utilizing wind turbines with power rated higher than 1 MW could help reduce the energy demand and greenhouse gas emissions |
| [45] | 2016 | Al-Zawiya | Studying the impact of wind energy integration on the refinery’s energy system to meet the refinery’s demand | The integrated system would help to cover the energy demand, reduce CO2 emissions, and improve the economy |
| [46] | 2016 | Libya | Examining the existing utilization and prospects of renewable energy in Libya, alongside exploring the challenges and opportunities for investment in this sector | The availability of renewable energy complements peak loads and current energy demand, making wind and solar projects attractive for Libya |
| [47] | 2016 | Al-Fattaih-Darnah | Studying the wind energy potential using the Weibull distribution function during the year 2003 | The annual wind power density of the region is categorized as class 3 |
| [48] | 2017 | Tarhuna, Misalatha, Goterria, Assaba, Assaba, EL-Magrun, and Dernah | Analyzing statistically the wind speed data from seven locations using the Weibull distribution function from 2007 to 2008 and 2002 to 2004 | Misalatha and Asaaba are suitable regions for the installation of the wind farm based on the economic feasibility results |
| [49] | 2017 | Benina-Benghazi | Investigating the technical and economic feasibility of a solar water heating system using RETScreen software | Solar water heating systems are economically viable and can lead to fuel savings and a reduction in CO2 emissions |
| [50] | 2018 | Libya | Evaluating the potential implementation of concentrating solar power plants for electric production | The results are promising for implementing economically competitive concentrating solar power plants in the country |
| [51] | 2018 | Libya | Assessing the present state of energy resources and exploring the future potential of renewable energy sources, along with discussing upcoming projects aimed at harnessing these sustainable resources | Libya has great potential for renewable energy, especially in solar and wind energy resources |
| [52] | 2019 | University of Al-Marj | Design a wind–solar hybrid power generation system in Libya using HOMER software | The most feasible economical design to supply an average load connected to the grid was identified as the installation of ten wind turbines and solar PV with capacities of 100 kW and 150 kW, respectively |
| [53] | 2019 | Zwara | Estimating the monthly and annual wind power density for 2007 using the Weibull distribution function | Small-scale wind turbines can be considered suitable for generating electricity from wind energy |
| [54] | 2019 | Hun | Analyzing the wind energy resource potential using the Weibull distribution function and investigating the performance of wind turbines during the period of 2011–2012 | The selected region is suitable for developing wind farms using class III/B wind. |
| [55] | 2019 | Tripoli, Nault, and Esspeea | Analyzing the characteristics of wind speed using ten distribution functions based on monthly data for the period of 1981–2010 | Small-scale wind turbines can be utilized for producing electricity from wind energy |
| [56] | 2020 | Libya | Review the future of solar and wind energy as alternative sources in Libya | The country has high wind and solar energy potential. However, the implementation and development of renewable energy technologies in Libya face a range of challenges and barriers, including legal, political, economic, and financial obstacles. |
| [57] | 2020 | Libya | Providing the status of renewable energy and benefits from it and explaining strategies to enhance future applications and electricity generation to support the energy sector | Libya has a huge potential for solar and wind energy, but the use of renewable energy in consumption is almost non-existent |
| [58] | 2020 | Libya | Analyzing the potential of solar and wind energy for producing hydrogen | The northeastern and southern parts of the country are advised to exploit wind and solar energy, respectively, for hydrogen production |
| [59] | 2020 | Libya | Addressing the status of renewable energy and its benefits and explaining strategies to enhance its future applications | Solar energy can be considered as the best possible renewable energy source, but it is very difficult to develop and improve its use as a clean energy source in the country |
| [60] | 2020 | Tripoli, Nalut, Espiaa, Al bayda, Benghazi, Al-kufrah, Misratah, Sabha, Darnah | Evaluating the wind and solar energy at nine locations as well as the techno-economic feasibility of wind and solar projects based on the NASA dataset | Al Kufra is the best place for installing solar plants due to the high value of solar radiation. Benghazi and Dernah are suitable places for large-scale wind farm installations in the future. |
| [61] | 2020 | Al Butnan, Al Jabal al Akhdar, Al Jabal al Gharbi, Al Jifarah, Al Jufrah, Al Kufrah, Al Marj, Al Marqab, Al Wahat, An Nuqat al Khams, Az Zawiyah, Benghazi, Darnah, Ghat, Misratah, Murzuq, Nalut, Sabha, Surt, Tripoli, Wadi al Hayat, and Wadi ash Shati’ | Evaluating solar energy potential based on the NASA dataset and developing solar systems using RETScreen software | The southern part of Libya has high solar potential compared to other parts. Al Kufrah demonstrated the best option for the construction of a large-scale solar plant to generate electricity from solar energy compared to other regions. |
| [62] | 2021 | Benghazi | Evaluating the techno-economic feasibility of small-scale PV/storage/diesel distributed generation for reliable electric power supply in local communities using HOMER software | The most feasible economical design system was found to be the PV-battery system as compared to the diesel generator option |
| [63] | 2021 | Libya | Providing a broad review of the energy situation in Libya and evaluating the potential of available renewable energy (wind, solar, biomass, wave, and geothermal energy) | Wind and solar energy are major contributors to the displacement of fossil fuels for energy production |
| [64] | 2021 | Libya | Providing solar photovoltaic status, utilization, and proposed strategies to enhance future applications and electricity generation | The country has a high potential for solar energy and government strategy is crucial to support PV market growth |
| [65] | 2021 | Espiaa, Msallata, Alqatrun, and Adirsiyah | Evaluating the wind energy potential using Weibull distribution. Three approaches were used to estimate the Weibull parameters. | The highest and lowest values of wind power density were obtained at Msallata and Adirsiyah with a value of 418.502 W/m2 and 77.993 W/m2, respectively, at a height of 20 m |
| [66] | 2021 | Zawia | Developing a utility-scale wind farm with a total estimated power of 20 MW to reduce the GHG emissions associated with oil refinery facilities in the selected region | The wind farm could potentially avoid around 2 MtCO2 of CO2 emissions |
| [67] | 2021 | Tobruk, Dernah, Benghazi, Ajdabiya, Sirt, Misrata, and Tripoli | Assessing the wind potential at seven locations using the Weibull distribution function based on simulation data | The highest energy production and capacity factors are obtained from Derna, Tobruk, and Misrata |
| [68] | 2021 | Sabha, Obari, Alqtroun, and Hun | Evaluate the potential of wind energy as a power source using the Weibull distribution function | Sabha demonstrated the best option for generating electricity from wind compared to other regions |
| [69] | 2021 | Aljofra | Assessing the economic feasibility of solar energy using SAM software | PV and concentrated solar power systems can be considered the most promising technologies for generating electricity |
| [70] | 2021 | Libya | Addressing the necessity of replacing fossil fuels with renewables and providing a detailed analysis of the cost of solar and wind power, along with future trends | Wind and solar energy play a significant role in displacing fossil fuels for energy production |
| [71] | 2023 | Azzizia, Assabaa, Tarhuna, Msllata, Misurata, Sirte, Magrun, Tulmitha, Dernah, Ejdabia, Bennina, Surman, Zwara, and Triboli | Selecting the best site for the installation of a wind farm using a hybrid multi-criteria approach | Derna and Tarhuna were suitable regions for wind farm installation in the country |
| [72] | 2023 | Kufra, Benghazi, Tripoli, Tobruk, Sabha, and Mesrata | Finding the best location for installing solar plants in the country using the Grey-TOPSIS method | Mesrata is a suitable location for installing the solar plant |
| Location | Latitude (° N) | Longitude (° E) | Elevation (m) |
|---|---|---|---|
| Aljmail | 32.856 | 12.058 | 2 |
| Az-Zāwiyah | 32.763 | 12.736 | 20 |
| Castelverde | 32.750 | 13.717 | 40 |
| Msallatah | 32.582 | 14.151 | 166 |
| Sabratah | 32.781 | 12.450 | 4 |
| Products | Description/Full Name of the Dataset | Resolution | Period |
|---|---|---|---|
| TerraClimate | Global gridded dataset of meteorological and water balance for global terrestrial surfaces | 0.042° × 0.042° | 1958–present |
| ERA5 | Fifth-generation reanalysis product of the European Centre for Medium-Range Weather Forecasts | 0.05°/1 d | 1979–present |
| ERA5-Land | ERA5-Land has been produced by replaying the land component of the ECMWF ERA5 climate reanalysis | 0.125° × 0.125° | 11 July 1963–present |
| MERRA-2 | Second-generation Modern-ERA Retrospective Analysis for Research and Applications | 0.5° × 0.625° | 1981–present |
| CFSR | NCEP (NOAA NWS National Centers for Environmental Prediction) Climate Forecast System Reanalysis dataset | 1/5° | 1979–present |
| Distribution Function | Probability Density Function | Cumulative Distribution Function | ||||||
|---|---|---|---|---|---|---|---|---|
| Normal (N) | ||||||||
| Gamma (G) | ||||||||
| Generalized Extreme Value (GEV) | ||||||||
| Nakagami (Na) | ||||||||
| Inverse Gaussian (IG) | ||||||||
| Log-normal (LN) | ||||||||
| Log-Logistic (LL) | ||||||||
| Rayleigh (R) | ||||||||
| Weibull (W) | ||||||||
| Three-Parameter Weibull (W-3P) | ||||||||
| Kumaraswamy (K) | ||||||||
| Birnbaum-Saunders (BS) | ||||||||
| Logistic (L) | ||||||||
| N | Standard deviation | Na | Shape parameter | LL | Shape parameter | |||
| Mean parameter | Scale parameter | Scale parameter | ||||||
| G | Shape parameter | IG | Shape parameter | W | Shape parameter | |||
| Scale parameter | Mean parameter | Scale parameter | ||||||
| GEV | Location parameter | LN | Shape parameter | W-3P | Shape parameter | |||
| Scale parameter | Scale parameter | Scale parameter | ||||||
| Shape parameter | R | Scale parameter | Location parameter | |||||
| K | Shape parameter | BS | Location parameter | L | Location parameter | |||
| Shape parameter | Scale parameter | Scale parameter | ||||||
| Shape parameter | Shape parameter | |||||||
| Scale parameter | ||||||||
| Class | Annual GSR [kWh/m2] |
|---|---|
| 1 (poor) | <1191.8 |
| 2 (marginal) | 1191.8–1419.7 |
| 3 (fair) | 1419.7–1641.8 |
| 4 (good) | 1641.8–1843.8 |
| 5 (excellent) | 1843.8–2035.9 |
| 6 (outstanding) | 2035.9–2221.8 |
| 7 (superb) | >2221.8 |
| Month | Dataset | Mean | SD | CV | Min. | Max. | S | K | Month | Dataset | Mean | SD | CV | Min. | Max. | S | K |
|---|---|---|---|---|---|---|---|---|---|---|---|---|---|---|---|---|---|
| Jan | Measured | 3.47 | 1.44 | 41.54 | 1.99 | 7.34 | 1.31 | 0.76 | Jul | Measured | 3.03 | 0.64 | 21.11 | 1.95 | 4.39 | 0.06 | −0.83 |
| CFSR | 3.22 | 1.48 | 45.95 | 1.53 | 6.90 | 1.21 | 0.56 | CFSR | 3.60 | 0.59 | 16.47 | 2.46 | 4.63 | 0.00 | −1.02 | ||
| ERA5 | 3.20 | 1.79 | 56.02 | 1.35 | 7.92 | 1.26 | 0.70 | ERA5 | 2.55 | 1.16 | 45.67 | 0.08 | 4.52 | −0.37 | −0.66 | ||
| ERA5-Land | 3.50 | 1.89 | 54.03 | 1.59 | 8.39 | 1.22 | 0.67 | ERA5-Land | 2.74 | 1.25 | 45.74 | 0.21 | 4.75 | −0.43 | −0.76 | ||
| MERRA-2 | 5.97 | 2.52 | 42.23 | 2.75 | 12.31 | 0.92 | 0.24 | MERRA-2 | 4.46 | 1.27 | 28.56 | 2.64 | 7.12 | 0.40 | −0.92 | ||
| Feb | Measured | 3.49 | 1.22 | 34.82 | 2.00 | 6.23 | 0.92 | −0.07 | Aug | Measured | 2.88 | 0.79 | 27.50 | 1.76 | 4.94 | 1.26 | 1.19 |
| CFSR | 3.21 | 0.87 | 27.26 | 1.95 | 5.23 | 0.90 | 0.14 | CFSR | 3.51 | 0.68 | 19.32 | 2.53 | 5.12 | 0.90 | 0.15 | ||
| ERA5 | 2.84 | 1.78 | 62.48 | 0.28 | 6.69 | 0.75 | −0.37 | ERA5 | 2.05 | 1.15 | 56.03 | 0.19 | 4.91 | 0.99 | 0.98 | ||
| ERA5-Land | 3.04 | 1.88 | 61.76 | 0.37 | 7.04 | 0.74 | −0.40 | ERA5-Land | 2.31 | 1.18 | 51.24 | 0.24 | 5.33 | 0.95 | 1.15 | ||
| MERRA−2 | 5.35 | 2.39 | 44.74 | 2.38 | 10.69 | 0.85 | −0.33 | MERRA-2 | 4.31 | 1.18 | 27.41 | 2.62 | 7.46 | 1.20 | 0.93 | ||
| Mar | Measured | 3.82 | 1.25 | 32.82 | 2.09 | 7.20 | 1.09 | 0.94 | Sep | Measured | 3.01 | 0.53 | 17.45 | 2.13 | 4.27 | 0.72 | 0.59 |
| CFSR | 3.85 | 1.39 | 35.95 | 2.04 | 8.09 | 1.51 | 2.75 | CFSR | 3.61 | 0.52 | 14.44 | 2.92 | 4.65 | 0.34 | −0.98 | ||
| ERA5 | 3.34 | 1.66 | 49.72 | 0.51 | 6.59 | 0.07 | −0.79 | ERA5 | 2.27 | 1.06 | 46.58 | 0.47 | 4.85 | 0.39 | 0.02 | ||
| ERA5-Land | 3.68 | 1.72 | 46.83 | 0.78 | 7.00 | 0.06 | −0.92 | ERA5-Land | 2.43 | 1.08 | 44.57 | 0.65 | 5.08 | 0.43 | 0.05 | ||
| MERRA-2 | 5.86 | 1.87 | 32.00 | 2.75 | 9.82 | 0.29 | −0.83 | MERRA-2 | 4.63 | 0.96 | 20.73 | 3.34 | 7.23 | 1.05 | 0.89 | ||
| Apr | Measured | 4.33 | 1.21 | 28.00 | 2.22 | 6.77 | 0.39 | −0.83 | Oct | Measured | 2.50 | 0.62 | 24.64 | 1.80 | 4.06 | 0.89 | −0.04 |
| CFSR | 4.34 | 1.28 | 29.44 | 2.70 | 7.48 | 1.04 | 0.70 | CFSR | 2.86 | 0.54 | 18.89 | 1.79 | 4.42 | 1.13 | 2.06 | ||
| ERA5 | 3.90 | 1.84 | 47.29 | 1.00 | 6.95 | 0.07 | −1.23 | ERA5 | 1.58 | 1.01 | 64.03 | 0.41 | 3.84 | 0.98 | −0.22 | ||
| ERA5-Land | 4.09 | 1.87 | 45.79 | 1.24 | 7.19 | 0.15 | −1.09 | ERA5-Land | 1.87 | 1.20 | 64.31 | 0.38 | 4.28 | 0.81 | −0.68 | ||
| MERRA-2 | 5.92 | 1.88 | 31.65 | 2.36 | 9.77 | 0.19 | −0.44 | MERRA-2 | 3.79 | 1.46 | 38.42 | 1.73 | 7.47 | 0.99 | 0.52 | ||
| May | Measured | 3.39 | 1.02 | 30.13 | 2.24 | 6.52 | 1.37 | 1.84 | Nov | Measured | 3.55 | 1.44 | 40.45 | 1.76 | 7.14 | 0.80 | −0.08 |
| CFSR | 3.83 | 1.07 | 27.97 | 2.21 | 7.27 | 1.22 | 2.21 | CFSR | 4.00 | 1.51 | 37.65 | 2.41 | 8.96 | 1.44 | 2.62 | ||
| ERA5 | 2.19 | 1.35 | 61.59 | 0.27 | 6.18 | 1.14 | 1.62 | ERA5 | 3.13 | 1.75 | 55.91 | 0.64 | 7.19 | 0.52 | −0.34 | ||
| ERA5-Land | 2.38 | 1.49 | 62.57 | 0.21 | 6.04 | 1.05 | 0.79 | ERA5-Land | 3.39 | 1.87 | 55.15 | 0.91 | 7.77 | 0.56 | −0.43 | ||
| MERRA-2 | 4.38 | 1.60 | 36.45 | 2.45 | 9.03 | 1.50 | 2.17 | MERRA-2 | 6.01 | 3.15 | 52.48 | 1.84 | 14.50 | 0.55 | 0.00 | ||
| Jun | Measured | 3.31 | 0.70 | 21.07 | 2.15 | 5.03 | 0.57 | 0.02 | Dec | Measured | 3.33 | 1.08 | 32.35 | 1.60 | 6.31 | 0.37 | 0.40 |
| CFSR | 3.86 | 0.79 | 20.52 | 2.49 | 5.21 | 0.05 | −1.00 | CFSR | 3.26 | 1.28 | 39.21 | 1.62 | 5.83 | 0.56 | −1.01 | ||
| ERA5 | 2.72 | 1.13 | 41.38 | 0.13 | 5.13 | −0.33 | 0.55 | ERA5 | 2.52 | 1.43 | 56.65 | 0.46 | 6.13 | 0.36 | −0.47 | ||
| ERA5-Land | 2.92 | 1.22 | 41.91 | 0.18 | 5.40 | −0.40 | 0.33 | ERA5-Land | 2.84 | 1.58 | 55.55 | 0.24 | 6.24 | 0.06 | −0.98 | ||
| MERRA-2 | 4.55 | 1.15 | 25.22 | 2.73 | 7.61 | 0.56 | 0.58 | MERRA-2 | 5.05 | 1.93 | 38.18 | 1.74 | 9.64 | 0.29 | −0.53 |
| Month | Variable | Dataset | Month | Variable | Dataset | ||||||
|---|---|---|---|---|---|---|---|---|---|---|---|
| CFSR | ERA5 | ERA5-Land | MERRA-2 | CFSR | ERA5 | ERA5-Land | MERRA-2 | ||||
| Jan | R-squared | 0.93 | 0.93 | 0.91 | 0.89 | Jul | R-squared | 0.53 | 0.41 | 0.87 | 0.79 |
| RMSE | 0.46 | 0.60 | 0.65 | 2.79 | RMSE | 0.73 | 1.01 | 0.74 | 1.61 | ||
| MAE | 0.39 | 0.47 | 0.49 | 2.50 | MAE | 0.65 | 0.82 | 0.54 | 1.42 | ||
| RRMSE | 12.99 | 16.41 | 16.49 | 43.12 | RRMSE | 19.93 | 36.20 | 24.80 | 34.73 | ||
| Feb | R-squared | 0.86 | 0.77 | 0.74 | 0.88 | Aug | R-squared | 0.54 | 0.45 | 0.57 | 0.75 |
| RMSE | 0.58 | 1.11 | 1.11 | 2.27 | RMSE | 0.83 | 1.18 | 0.96 | 1.56 | ||
| MAE | 0.46 | 0.88 | 0.83 | 1.88 | MAE | 0.70 | 0.96 | 0.72 | 1.43 | ||
| RRMSE | 17.55 | 33.36 | 31.30 | 38.80 | RRMSE | 23.25 | 50.16 | 36.96 | 34.98 | ||
| Mar | R-squared | 0.62 | 0.71 | 0.68 | 0.65 | Sep | R-squared | 0.03 | 0.05 | 0.45 | 0.57 |
| RMSE | 0.86 | 1.01 | 0.98 | 2.33 | RMSE | 0.99 | 1.28 | 1.00 | 1.75 | ||
| MAE | 0.60 | 0.78 | 0.78 | 2.06 | MAE | 0.86 | 1.06 | 0.78 | 1.62 | ||
| RRMSE | 21.08 | 27.09 | 24.19 | 37.92 | RRMSE | 27.26 | 51.49 | 37.74 | 36.97 | ||
| Apr | R-squared | 0.77 | 0.11 | 0.79 | 0.69 | Oct | R-squared | 0.59 | 0.40 | 0.51 | 0.71 |
| RMSE | 0.61 | 1.86 | 0.99 | 1.92 | RMSE | 0.53 | 1.20 | 1.07 | 1.62 | ||
| MAE | 0.45 | 1.42 | 0.76 | 1.69 | MAE | 0.45 | 1.07 | 0.87 | 1.31 | ||
| RRMSE | 13.57 | 43.34 | 22.05 | 31.01 | RRMSE | 18.30 | 64.13 | 48.22 | 39.90 | ||
| May | R-squared | 0.65 | 0.06 | 0.61 | 0.72 | Nov | R-squared | 0.88 | 0.28 | 0.92 | 0.93 |
| RMSE | 0.78 | 1.89 | 1.37 | 1.33 | RMSE | 0.68 | 1.60 | 0.64 | 3.03 | ||
| MAE | 0.62 | 1.46 | 1.13 | 1.11 | MAE | 0.55 | 1.36 | 0.53 | 2.49 | ||
| RRMSE | 19.70 | 73.61 | 48.96 | 28.64 | RRMSE | 15.85 | 44.76 | 16.59 | 44.80 | ||
| Jun | R-squared | 0.60 | 0.10 | 0.62 | 0.38 | Dec | R-squared | 0.57 | 0.15 | 0.56 | 0.56 |
| RMSE | 0.74 | 1.25 | 0.88 | 1.52 | RMSE | 0.83 | 1.61 | 1.14 | 2.16 | ||
| MAE | 0.59 | 0.94 | 0.64 | 1.30 | MAE | 0.60 | 1.29 | 0.75 | 1.95 | ||
| RRMSE | 18.87 | 42.76 | 27.75 | 32.51 | RRMSE | 23.84 | 55.95 | 35.31 | 40.11 | ||
| Whole year | R-squared | 0.66 | 0.43 | 0.74 | 0.74 | ||||||
| RMSE | 0.74 | 1.35 | 0.98 | 2.05 | |||||||
| MAE | 0.58 | 1.04 | 0.73 | 1.73 | |||||||
| RRMSE | 19.53 | 43.47 | 29.24 | 38.01 | |||||||
| Actual | CFSR | ERA5-Land | |||||||
|---|---|---|---|---|---|---|---|---|---|
| Model | Statistic | Rank | Model | Statistic | Rank | Model | Statistic | Rank | |
| January | W-3P | 0.112 | 1 | BS | 0.100 | 1 | W-3P | 0.081 | 1 |
| BS | 0.134 | 2 | W-3P | 0.101 | 2 | GEV | 0.093 | 2 | |
| K | 0.135 | 3 | GEV | 0.114 | 3 | BS | 0.098 | 3 | |
| GEV | 0.158 | 4 | IG | 0.127 | 4 | IG | 0.102 | 4 | |
| IG | 0.169 | 5 | LL | 0.128 | 5 | LL | 0.107 | 5 | |
| February | K | 0.083 | 1 | GEV | 0.105 | 1 | BS | 0.087 | 1 |
| W-3P | 0.084 | 2 | BS | 0.108 | 2 | W | 0.088 | 2 | |
| GEV | 0.095 | 3 | LL | 0.112 | 3 | LN | 0.089 | 3 | |
| LL | 0.101 | 4 | W-3P | 0.122 | 4 | GEV | 0.091 | 4 | |
| BS | 0.105 | 5 | IG | 0.142 | 5 | G | 0.091 | 5 | |
| March | GEV | 0.083 | 1 | LL | 0.090 | 1 | GEV | 0.084 | 1 |
| LL | 0.083 | 2 | GEV | 0.092 | 2 | N | 0.097 | 2 | |
| BS | 0.084 | 3 | BS | 0.093 | 3 | W-3P | 0.098 | 3 | |
| W-3P | 0.091 | 4 | W | 0.095 | 4 | BS | 0.101 | 4 | |
| LN | 0.093 | 5 | LN | 0.102 | 5 | R | 0.109 | 5 | |
| April | GEV | 0.101 | 1 | LL | 0.076 | 1 | GEV | 0.082 | 1 |
| G | 0.106 | 2 | GEV | 0.082 | 2 | R | 0.088 | 2 | |
| Na | 0.108 | 3 | BS | 0.099 | 3 | W | 0.091 | 3 | |
| W-3P | 0.109 | 4 | LN | 0.107 | 4 | N | 0.093 | 4 | |
| BS | 0.109 | 5 | IG | 0.111 | 5 | BS | 0.098 | 5 | |
| May | W | 0.071 | 1 | LL | 0.080 | 1 | IG | 0.089 | 1 |
| IG | 0.081 | 2 | BS | 0.080 | 2 | BS | 0.099 | 2 | |
| G | 0.091 | 3 | GEV | 0.083 | 3 | GEV | 0.101 | 3 | |
| K | 0.093 | 4 | IG | 0.085 | 4 | G | 0.108 | 4 | |
| Na | 0.094 | 5 | W-3P | 0.085 | 5 | R | 0.109 | 5 | |
| June | LL | 0.089 | 1 | GEV | 0.092 | 1 | W-3P | 0.125 | 1 |
| GEV | 0.102 | 2 | W | 0.095 | 2 | GEV | 0.126 | 2 | |
| BS | 0.105 | 3 | K | 0.103 | 3 | L | 0.139 | 3 | |
| LN | 0.114 | 4 | BS | 0.106 | 4 | Na | 0.144 | 4 | |
| W-3P | 0.114 | 5 | N | 0.107 | 5 | BS | 0.146 | 5 | |
| July | GEV | 0.092 | 1 | GEV | 0.089 | 1 | GEV | 0.092 | 1 |
| W | 0.097 | 2 | K | 0.091 | 2 | W-3P | 0.117 | 2 | |
| N | 0.103 | 3 | N | 0.099 | 3 | N | 0.134 | 3 | |
| K | 0.106 | 4 | W | 0.099 | 4 | K | 0.134 | 4 | |
| BS | 0.107 | 5 | W-3P | 0.101 | 5 | BS | 0.135 | 5 | |
| August | GEV | 0.072 | 1 | GEV | 0.111 | 1 | GEV | 0.108 | 1 |
| LL | 0.081 | 2 | BS | 0.113 | 2 | BS | 0.118 | 2 | |
| BS | 0.085 | 3 | W-3P | 0.115 | 3 | G | 0.119 | 3 | |
| W-3P | 0.105 | 4 | LL | 0.137 | 4 | IG | 0.119 | 4 | |
| LN | 0.116 | 5 | Na | 0.155 | 5 | W-3P | 0.135 | 5 | |
| September | LN | 0.081 | 1 | W | 0.123 | 1 | L | 0.113 | 1 |
| BS | 0.087 | 2 | Na | 0.134 | 2 | GEV | 0.129 | 2 | |
| GEV | 0.093 | 3 | G | 0.137 | 3 | Na | 0.135 | 3 | |
| G | 0.095 | 4 | N | 0.140 | 4 | N | 0.135 | 4 | |
| LL | 0.097 | 5 | LN | 0.143 | 5 | BS | 0.146 | 5 | |
| October | K | 0.112 | 1 | GEV | 0.105 | 1 | Na | 0.113 | 1 |
| W-3P | 0.122 | 2 | BS | 0.121 | 2 | W-3P | 0.113 | 2 | |
| LN | 0.127 | 3 | LN | 0.125 | 3 | G | 0.116 | 3 | |
| GEV | 0.131 | 4 | LL | 0.130 | 4 | BS | 0.116 | 4 | |
| LL | 0.134 | 5 | W | 0.133 | 5 | LL | 0.118 | 5 | |
| November | K | 0.096 | 1 | W-3P | 0.106 | 1 | GEV | 0.118 | 1 |
| W-3P | 0.111 | 2 | GEV | 0.117 | 2 | R | 0.127 | 2 | |
| Na | 0.121 | 3 | IG | 0.126 | 3 | Na | 0.128 | 3 | |
| LL | 0.126 | 4 | LL | 0.128 | 4 | W | 0.131 | 4 | |
| GEV | 0.132 | 5 | BS | 0.129 | 5 | G | 0.134 | 5 | |
| December | GEV | 0.100 | 1 | GEV | 0.107 | 1 | GEV | 0.127 | 1 |
| N | 0.101 | 2 | W-3P | 0.109 | 2 | K | 0.129 | 2 | |
| Na | 0.113 | 3 | IG | 0.112 | 3 | N | 0.132 | 3 | |
| BS | 0.121 | 4 | LN | 0.112 | 4 | BS | 0.145 | 4 | |
| W-3P | 0.122 | 5 | LL | 0.116 | 5 | L | 0.146 | 5 | |
| Whole year | BS | 0.025 | 1 | GEV | 0.033 | 1 | K | 0.034 | 1 |
| GEV | 0.030 | 2 | BS | 0.035 | 2 | W | 0.036 | 2 | |
| LL | 0.050 | 3 | IG | 0.038 | 3 | Na | 0.037 | 3 | |
| IG | 0.054 | 4 | LN | 0.044 | 4 | W-3p | 0.038 | 4 | |
| W-3p | 0.056 | 5 | W-3p | 0.047 | 5 | GEV | 0.043 | 5 | |
| Monthly | L | 0.139 | 1 | GEV | 0.117 | 1 | GEV | 0.098 | 1 |
| Na | 0.152 | 2 | N | 0.133 | 2 | G | 0.109 | 2 | |
| BS | 0.155 | 3 | W-P3 | 0.139 | 3 | Na | 0.110 | 3 | |
| GEV | 0.157 | 4 | Na | 0.140 | 4 | W-P3 | 0.111 | 4 | |
| G | 0.157 | 5 | IG | 0.141 | 5 | N | 0.116 | 5 | |
| Actual | CFSR | ERA5-Land | |||||||
|---|---|---|---|---|---|---|---|---|---|
| Model | Mean | WPD | Model | Mean | WPD | Model | Mean | WPD | |
| January | Actual | 3.47 | 25.72 | Actual | 3.47 | 25.72 | Actual | 3.47 | 25.72 |
| W-3P | 3.57 | 27.99 | BS | 3.2171 | 20.51 | W-3P | 3.4988 | 26.38 | |
| BS | 3.47 | 25.74 | W-3P | 3.2161 | 20.49 | GEV | 3.498 | 26.37 | |
| K | 3.55 | 27.58 | GEV | 3.2168 | 20.50 | BS | 3.474 | 25.83 | |
| GEV | 3.47 | 25.72 | IG | 3.2168 | 20.50 | IG | 3.498 | 26.37 | |
| IV | 3.47 | 25.72 | LL | 3.1821 | 19.85 | LL | 3.4771 | 25.90 | |
| February | Actual | 3.49 | 26.19 | Actual | 3.49 | 26.19 | Actual | 3.49 | 26.19 |
| K | 3.49 | 26.08 | GEV | 3.2057 | 20.29 | BS | 3.0429 | 17.36 | |
| W-3P | 3.49 | 26.10 | BS | 3.2056 | 20.29 | W | 2.954 | 15.88 | |
| GEV | 3.49 | 26.19 | LL | 3.1651 | 19.53 | LN | 3.1321 | 18.93 | |
| LL | 3.45 | 25.40 | W-3P | 3.2041 | 20.26 | GEV | 3.0436 | 17.37 | |
| BS | 3.49 | 26.14 | IG | 3.2057 | 20.29 | G | 3.0436 | 17.37 | |
| March | Actual | 3.82 | 34.26 | Actual | 3.82 | 34.26 | Actual | 3.82 | 34.26 |
| GEV | 3.82 | 34.27 | LL | 3.7693 | 32.99 | GEV | 3.6782 | 30.65 | |
| LL | 3.76 | 32.66 | GEV | 3.8535 | 35.25 | N | 3.6782 | 30.65 | |
| BS | 3.82 | 34.26 | BS | 3.8535 | 35.25 | W-3P | 3.681 | 30.72 | |
| W-3P | 3.81 | 34.19 | W | 3.7104 | 31.47 | BS | 3.6782 | 30.65 | |
| LN | 3.81 | 34.11 | LN | 3.8431 | 34.96 | R | 3.6782 | 30.65 | |
| April | Actual | 4.33 | 50.08 | Actual | 4.33 | 50.08 | Actual | 4.33 | 50.08 |
| GEV | 4.33 | 50.08 | LL | 4.2838 | 48.42 | GEV | 4.0858 | 42.02 | |
| G | 4.33 | 50.08 | GEV | 4.342 | 50.43 | R | 4.0858 | 42.02 | |
| Na | 4.33 | 49.88 | BS | 4.3412 | 50.40 | W | 4.0253 | 40.18 | |
| W-3P | 4.33 | 50.12 | LN | 4.3364 | 50.23 | N | 4.0858 | 42.02 | |
| BS | 4.33 | 50.08 | IG | 4.342 | 50.43 | BS | 4.0858 | 42.02 | |
| May | Actual | 3.39 | 24.02 | Actual | 3.39 | 24.02 | Actual | 3.39 | 24.02 |
| W | 3.29 | 21.90 | LL | 3.7544 | 32.60 | IG | 2.3815 | 8.32 | |
| IG | 3.39 | 24.03 | BS | 3.8313 | 34.64 | BS | 2.3815 | 8.32 | |
| G | 3.39 | 24.03 | GEV | 3.8313 | 34.64 | GEV | 2.3815 | 8.32 | |
| K | 3.64 | 29.66 | IG | 3.8313 | 34.64 | G | 2.3815 | 8.32 | |
| Na | 3.35 | 23.08 | W-3P | 3.8309 | 34.63 | R | 2.3815 | 8.32 | |
| June | Actual | 3.31 | 22.32 | Actual | 3.31 | 22.32 | Actual | 3.31 | 22.32 |
| LL | 3.27 | 21.59 | GEV | 3.8607 | 35.45 | W-3P | 2.9195 | 15.33 | |
| GEV | 3.31 | 22.32 | W | 3.8071 | 33.99 | GEV | 2.9205 | 15.34 | |
| BS | 3.31 | 22.32 | K | 3.9165 | 37.01 | L | 2.9205 | 15.34 | |
| L | 3.31 | 22.31 | BS | 3.8607 | 35.45 | Na | 2.977 | 16.25 | |
| W-3P | 3.31 | 22.28 | N | 3.8607 | 35.45 | BS | 2.9227 | 15.38 | |
| July | Actual | 3.03 | 17.19 | Actual | 3.03 | 17.19 | Actual | 3.03 | 17.19 |
| GEV | 3.03 | 17.18 | GEV | 3.6035 | 28.82 | GEV | 2.7356 | 12.61 | |
| W | 2.98 | 16.35 | K | 3.6001 | 28.74 | W-3P | 2.7494 | 12.80 | |
| N | 3.03 | 17.18 | N | 3.6035 | 28.82 | N | 2.7356 | 12.61 | |
| K | 3.03 | 17.15 | W | 3.5615 | 27.83 | K | 2.553 | 10.25 | |
| BS | 3.03 | 17.18 | W-3P | 3.6069 | 28.91 | BS | 2.7388 | 12.65 | |
| August | Actual | 2.88 | 14.65 | Actual | 2.88 | 14.65 | Actual | 2.88 | 14.65 |
| GEV | 2.88 | 14.65 | GEV | 3.5129 | 26.70 | GEV | 2.3074 | 7.57 | |
| LL | 2.83 | 14.00 | BS | 3.5128 | 26.70 | BS | 2.3074 | 7.57 | |
| BS | 2.88 | 14.65 | W-3P | 3.5117 | 26.68 | G | 2.3074 | 7.57 | |
| W-3P | 2.88 | 14.67 | LL | 3.4779 | 25.91 | IG | 2.3074 | 7.57 | |
| LN | 2.87 | 14.58 | Na | 3.5033 | 26.49 | W-3P | 2.3034 | 7.53 | |
| September | Actual | 3.01 | 16.80 | Actual | 3.01 | 16.80 | Actual | 3.01 | 16.80 |
| LN | 3.01 | 16.79 | W | 3.5707 | 28.04 | L | 2.4296 | 8.83 | |
| BS | 3.01 | 16.80 | Na | 3.61 | 28.98 | GEV | 2.4296 | 8.83 | |
| GEV | 3.01 | 16.80 | G | 3.612 | 29.03 | Na | 2.4316 | 8.86 | |
| G | 3.01 | 16.80 | N | 3.612 | 29.03 | N | 2.4296 | 8.83 | |
| LL | 2.98 | 16.30 | LN | 3.6118 | 29.02 | BS | 2.4296 | 8.83 | |
| October | Actual | 2.50 | 9.63 | Actual | 2.50 | 9.63 | Actual | 2.50 | 9.63 |
| K | 2.52 | 9.84 | GEV | 2.8597 | 14.41 | Na | 1.8844 | 4.12 | |
| W-3P | 2.51 | 9.72 | BS | 2.8597 | 14.41 | W-3P | 1.8675 | 4.01 | |
| LN | 2.50 | 9.60 | LN | 2.8586 | 14.39 | G | 1.8702 | 4.03 | |
| GEV | 2.50 | 9.62 | LL | 2.8225 | 13.85 | BS | 1.8685 | 4.02 | |
| LL | 2.47 | 9.31 | W | 2.8039 | 13.58 | LL | 1.9805 | 4.79 | |
| November | Actual | 3.55 | 27.65 | Actual | 3.55 | 27.65 | Actual | 3.55 | 27.65 |
| K | 3.54 | 27.35 | W-3P | 4.0756 | 41.70 | GEV | 3.3942 | 24.09 | |
| W-3P | 3.55 | 27.51 | GEV | 3.9967 | 39.33 | R | 3.3942 | 24.09 | |
| Na | 3.52 | 26.93 | IG | 3.9967 | 39.33 | Na | 3.4171 | 24.58 | |
| LL | 3.53 | 27.19 | LL | 3.8996 | 36.53 | W | 3.2903 | 21.94 | |
| GEV | 3.55 | 27.65 | BS | 3.9853 | 38.99 | G | 3.3942 | 24.09 | |
| December | Actual | 3.33 | 22.64 | Actual | 3.33 | 22.64 | Actual | 3.33 | 22.64 |
| GEV | 3.33 | 22.65 | GEV | 3.2542 | 21.23 | GEV | 2.8371 | 14.07 | |
| N | 3.33 | 22.65 | W-3P | 3.2466 | 21.08 | K | 2.85 | 14.26 | |
| Na | 3.32 | 22.53 | IG | 3.2542 | 21.23 | N | 2.8371 | 14.07 | |
| BS | 3.33 | 22.65 | LN | 3.2538 | 21.22 | BS | 2.8371 | 14.07 | |
| W-3P | 3.32 | 22.56 | LL | 3.265 | 21.44 | L | 2.8371 | 14.07 | |
| Whole year | Actual | 3.34 | 25.72 | Actual | 3.34 | 26.12 | Actual | 3.34 | 26.18 |
| BS | 3.34 | 26.38 | GEV | 3.60 | 26.13 | K | 2.93 | 26.19 | |
| GEV | 3.34 | 26.37 | BS | 3.60 | 26.14 | W | 2.92 | 26.19 | |
| LL | 3.34 | 25.83 | IG | 3.60 | 26.15 | Na | 2.93 | 26.20 | |
| IG | 3.34 | 26.37 | LN | 3.59 | 26.16 | W-3p | 2.93 | 26.21 | |
| W-3p | 3.34 | 25.90 | W-3p | 3.60 | 26.17 | GEV | 2.93 | 26.22 | |
| Monthly | Actual | 3.34 | 25.72 | Actual | 3.34 | 26.12 | Actual | 3.34 | 26.18 |
| L | 3.34 | 26.38 | GEV | 3.60 | 26.13 | GEV | 2.93 | 26.19 | |
| Na | 3.34 | 26.37 | N | 3.60 | 26.14 | G | 2.93 | 26.19 | |
| BS | 3.34 | 25.83 | W-P3 | 3.60 | 26.15 | Na | 2.93 | 26.20 | |
| GEV | 3.34 | 26.37 | Na | 3.59 | 26.16 | W-P3 | 2.93 | 26.21 | |
| G | 3.34 | 25.90 | IG | 3.60 | 26.17 | N | 2.93 | 26.22 | |
| Month | Variable | Dataset | Month | Variable | Dataset | ||||||
|---|---|---|---|---|---|---|---|---|---|---|---|
| CFSR | ERA5 | ERA5-Land | MERRA-2 | CFSR | ERA5 | ERA5-Land | MERRA-2 | ||||
| January | R-squared | 0.38 | 0.76 | 0.97 | 0.86 | July | R-squared | 0.09 | 0.88 | 0.99 | 0.03 |
| RMSE | 30.82 | 15.41 | 5.08 | 21.50 | RMSE | 10.81 | 5.40 | 3.56 | 17.26 | ||
| MAE | 22.68 | 11.34 | 3.67 | 18.40 | MAE | 5.36 | 2.68 | 3.30 | 12.99 | ||
| RRMSE | 23.76 | 12.30 | 4.14 | 15.35 | RRMSE | 3.32 | 1.66 | 1.11 | 5.14 | ||
| February | R-squared | 0.43 | 0.74 | 0.98 | 0.58 | August | R-squared | 0.06 | 0.46 | 0.99 | 0.16 |
| RMSE | 41.02 | 20.51 | 4.72 | 27.80 | RMSE | 20.88 | 10.44 | 3.32 | 19.09 | ||
| MAE | 30.24 | 15.12 | 3.68 | 23.72 | MAE | 11.34 | 5.67 | 3.04 | 16.96 | ||
| RRMSE | 23.84 | 12.33 | 2.87 | 15.54 | RRMSE | 6.97 | 3.55 | 1.16 | 6.29 | ||
| March | R-squared | 0.62 | 0.88 | 0.99 | 0.39 | September | R-squared | 0.74 | 0.94 | 0.99 | 0.72 |
| RMSE | 33.88 | 16.94 | 4.10 | 42.62 | RMSE | 13.61 | 6.80 | 2.45 | 14.70 | ||
| MAE | 21.16 | 10.58 | 3.15 | 32.33 | MAE | 7.81 | 3.90 | 1.94 | 10.88 | ||
| RRMSE | 14.77 | 7.41 | 1.78 | 19.18 | RRMSE | 5.40 | 2.72 | 0.99 | 5.80 | ||
| April | R-squared | 0.08 | 0.39 | 0.99 | 0.56 | October | R-squared | 0.44 | 0.87 | 0.99 | 0.56 |
| RMSE | 57.74 | 28.87 | 3.87 | 37.04 | RMSE | 22.22 | 11.11 | 2.16 | 24.52 | ||
| MAE | 23.30 | 11.65 | 2.46 | 26.09 | MAE | 17.80 | 8.90 | 1.56 | 20.71 | ||
| RRMSE | 21.14 | 10.48 | 1.38 | 13.86 | RRMSE | 10.92 | 5.69 | 1.16 | 11.80 | ||
| May | R-squared | 0.67 | 0.86 | 0.99 | 0.56 | November | R-squared | 0.40 | 0.84 | 0.99 | 0.76 |
| RMSE | 32.23 | 16.12 | 3.50 | 29.24 | RMSE | 23.72 | 11.86 | 3.25 | 20.51 | ||
| MAE | 20.24 | 10.12 | 2.91 | 24.56 | MAE | 13.71 | 6.86 | 2.37 | 16.44 | ||
| RRMSE | 10.28 | 5.24 | 1.16 | 9.27 | RRMSE | 15.18 | 7.83 | 2.21 | 12.61 | ||
| June | R-squared | 0.53 | 0.85 | 0.97 | 0.30 | December | R-squared | 0.60 | 0.90 | 0.85 | 0.49 |
| RMSE | 8.40 | 4.20 | 2.63 | 17.75 | RMSE | 12.80 | 6.40 | 6.88 | 13.84 | ||
| MAE | 4.61 | 2.30 | 2.32 | 14.88 | MAE | 9.78 | 4.89 | 4.10 | 10.33 | ||
| RRMSE | 2.55 | 1.28 | 0.80 | 5.22 | RRMSE | 9.59 | 4.97 | 5.39 | 10.49 | ||
| Whole year | R-squared | 0.88 | 0.97 | 0.99 | 0.91 | ||||||
| RMSE | 28.98 | 14.49 | 4.00 | 25.30 | |||||||
| MAE | 15.59 | 7.79 | 2.87 | 19.01 | |||||||
| RRMSE | 11.78 | 5.96 | 1.67 | 10.15 | |||||||
| Dataset | Location | Mean | SD | CV | Min | Max | S | K |
|---|---|---|---|---|---|---|---|---|
| ERA5-Land | Aljmail | 4.75 | 1.63 | 34.29 | 2.37 | 7.58 | 0.14 | −0.88 |
| Az-Zāwiyah | 5.19 | 1.64 | 31.55 | 2.72 | 7.95 | 0.00 | −0.94 | |
| Castelverde | 4.86 | 1.62 | 33.26 | 2.58 | 7.86 | 0.36 | −0.64 | |
| Msallatah | 5.19 | 1.60 | 30.72 | 3.09 | 8.40 | 0.62 | −0.22 | |
| Sabratah | 4.85 | 1.63 | 33.66 | 2.46 | 7.67 | 0.11 | −0.91 | |
| CFSR | Aljmail | 4.84 | 1.24 | 25.52 | 2.71 | 6.78 | −0.28 | −0.69 |
| Az-Zāwiyah | 4.85 | 1.25 | 25.81 | 2.80 | 6.81 | −0.16 | −0.91 | |
| Castelverde | 4.98 | 1.19 | 23.85 | 3.12 | 7.05 | 0.13 | −0.65 | |
| Msallatah | 5.49 | 1.14 | 20.68 | 3.89 | 7.69 | 0.57 | −0.29 | |
| Sabratah | 5.25 | 1.18 | 22.52 | 3.37 | 7.27 | 0.08 | −0.71 |
| Location | ERA5-Land | CFSR | Location | ERA5-Land | CFSR | ||||||||
|---|---|---|---|---|---|---|---|---|---|---|---|---|---|
| Model | Mean | WPD | Model | Mean | WPD | Model | Mean | WPD | Model | Mean | WPD | ||
| Aljmail | Observed | 4.75 | 65.81 | Observed | 4.84 | 69.76 | Az-Zāwiyah | Observed | 5.19 | 86.07 | Observed | 4.85 | 70.10 |
| GEV | 4.74 | 65.74 | GEV | 4.84 | 69.73 | GEV | 5.19 | 86.08 | GEV | 4.85 | 70.13 | ||
| N | 4.74 | 65.74 | W-3P | 4.85 | 70.25 | N | 5.19 | 86.08 | N | 4.85 | 70.13 | ||
| G | 4.74 | 65.74 | N | 4.84 | 69.73 | BS | 5.19 | 86.09 | BS | 4.84 | 70.02 | ||
| W-3P | 4.74 | 65.41 | BS | 4.84 | 69.74 | G | 5.19 | 86.08 | W-3P | 4.86 | 70.58 | ||
| Na | 4.75 | 65.83 | L | 4.84 | 69.73 | W-3P | 5.19 | 86.15 | Na | 4.85 | 70.27 | ||
| Castelverde | Observed | 4.86 | 70.62 | Observed | 4.98 | 76.08 | Msallatah | Observed | 5.19 | 86.32 | Observed | 5.49 | 101.87 |
| GEV | 4.86 | 70.60 | Na | 4.97 | 75.82 | GEV | 5.19 | 86.28 | W-3P | 5.48 | 101.56 | ||
| K | 4.80 | 68.12 | G | 4.98 | 76.12 | Na | 5.16 | 84.80 | BS | 5.49 | 101.92 | ||
| Na | 4.84 | 70.01 | BS | 4.98 | 76.12 | G | 5.19 | 86.28 | GEV | 5.49 | 101.93 | ||
| N | 4.86 | 70.60 | W-3P | 4.98 | 76.14 | W-3P | 5.18 | 85.55 | LL | 5.35 | 94.49 | ||
| G | 4.86 | 70.60 | GEV | 4.98 | 76.12 | IG | 5.19 | 86.28 | W | 5.27 | 90.10 | ||
| Sabratah | Observed | 4.85 | 70.06 | Observed | 5.25 | 88.93 | |||||||
| GEV | 4.85 | 70.13 | GEV | 5.25 | 88.88 | ||||||||
| N | 4.85 | 70.13 | N | 5.25 | 88.88 | ||||||||
| K | 4.76 | 66.53 | Na | 5.24 | 88.60 | ||||||||
| G | 4.85 | 70.13 | BS | 5.25 | 88.88 | ||||||||
| W-3P | 4.84 | 69.82 | W-3P | 5.25 | 88.98 | ||||||||
| Model | Parameter | Aljmail | Az-Zāwiyah | Castelverde | Msallatah | Sabratah |
|---|---|---|---|---|---|---|
| VAWT | EP [kWh] | 136,984.92 | 136,181.38 | 140,164.78 | 143,662.34 | 141,862.04 |
| CF [%] | 31.28 | 31.09 | 32.00 | 32.80 | 32.39 | |
| SPP [Year] | 10.5851 | 10.6476 | 10.3450 | 10.0931 | 10.2212 | |
| LCOE [USD/kWh] | 0.1033 | 0.1039 | 0.1009 | 0.0953 | 0.0965 | |
| HAWT | EP [kWh] | 169,853.0 | 168,913.6 | 175,044.7 | 176,174.2 | 174,374.2 |
| CF [%] | 38.78 | 38.56 | 39.50 | 40.22 | 39.92 | |
| SPP [Year] | 6.48 | 6.51 | 6.92 | 6.24 | 6.28 | |
| LCOE [USD/kWh] | 0.0632 | 0.0635 | 0.0653 | 0.0593 | 0.0609 |
| Family Farm | Parameter | Aljmail | Az-Zāwiyah | Castelverde | Msallatah | Sabratah |
|---|---|---|---|---|---|---|
| Farm 1 | EP [kWh] | 167,772.11 | 162,943.23 | 165,333.53 | 165,510.84 | 165,813.83 |
| CF [%] | 18.51 | 17.97 | 18.24 | 18.26 | 18.29 | |
| PR [%} | 79.94 | 79.93 | 79.93 | 79.94 | 79.93 | |
| System efficiency [%] | 69.40 | 69.39 | 69.39 | 69.40 | 69.40 | |
| LCOE [USD/kWh] | 0.0164 | 0.0170 | 0.0167 | 0.0167 | 0.0166 | |
| SPP [Year] | 10.83 | 10.91 | 10.87 | 10.86 | 10.86 | |
| Farm 2 | EP [kWh] | 55,020.58 | 53,436.96 | 54,220.85 | 54,279.00 | 54,378.36 |
| CF [%] | 18.51 | 17.97 | 18.24 | 18.26 | 18.29 | |
| PR [%} | 79.94 | 79.93 | 79.93 | 79.94 | 79.93 | |
| System efficiency [%] | 69.40 | 69.39 | 69.39 | 69.40 | 69.40 | |
| LCOE [USD/kWh] | 0.0199 | 0.0206 | 0.0203 | 0.0202 | 0.0202 | |
| SPP [Year] | 13.71 | 13.84 | 13.78 | 13.77 | 13.77 |
Disclaimer/Publisher’s Note: The statements, opinions and data contained in all publications are solely those of the individual author(s) and contributor(s) and not of MDPI and/or the editor(s). MDPI and/or the editor(s) disclaim responsibility for any injury to people or property resulting from any ideas, methods, instructions or products referred to in the content. |
© 2023 by the authors. Licensee MDPI, Basel, Switzerland. This article is an open access article distributed under the terms and conditions of the Creative Commons Attribution (CC BY) license (https://creativecommons.org/licenses/by/4.0/).
Share and Cite
Lagili, H.S.A.; Kiraz, A.; Kassem, Y.; Gökçekuş, H. Wind and Solar Energy for Sustainable Energy Production for Family Farms in Coastal Agricultural Regions of Libya Using Measured and Multiple Satellite Datasets. Energies 2023, 16, 6725. https://doi.org/10.3390/en16186725
Lagili HSA, Kiraz A, Kassem Y, Gökçekuş H. Wind and Solar Energy for Sustainable Energy Production for Family Farms in Coastal Agricultural Regions of Libya Using Measured and Multiple Satellite Datasets. Energies. 2023; 16(18):6725. https://doi.org/10.3390/en16186725
Chicago/Turabian StyleLagili, Hamza S. Abdalla, Aşkın Kiraz, Youssef Kassem, and Hüseyin Gökçekuş. 2023. "Wind and Solar Energy for Sustainable Energy Production for Family Farms in Coastal Agricultural Regions of Libya Using Measured and Multiple Satellite Datasets" Energies 16, no. 18: 6725. https://doi.org/10.3390/en16186725