

An Overview of Supervised Machine Learning Approaches for Applications in Active Distribution Networks


Electrical and Computer Engineering Department, Montana State University, Bozeman, MT 59717, USA
*
Author to whom correspondence should be addressed.
Energies 2023, 16(16), 5972; https://doi.org/10.3390/en16165972
Submission received: 11 July 2023
/
Revised: 4 August 2023
/
Accepted: 8 August 2023
/
Published: 14 August 2023
(This article belongs to the Special Issue Machine Learning and Data Mining Applications in Power and Multi-Energy Systems)
Abstract
:Distribution grids must be regularly updated to meet the global electricity demand. Some of these updates result in fundamental changes to the structure of the grid network. Some recent changes include two-way communication infrastructure, the rapid development of distributed generations (DGs) in different forms, and the installation of smart measurement tools. In addition to other changes, these lead to distribution grid modifications, allowing more advanced features. Even though these advanced technologies enhance distribution grid performance, the operation, management, and control of active distribution networks (ADNs) have become more complicated. For example, distribution system state estimation (DSSE) calculations have been introduced as a tool to estimate the performance of distribution grids. These DSSE computations are highly dependent on data obtained from measurement devices in distribution grids. However, sufficient measurement devices are not available in ADNs due to economic constraints and various configurations of distribution grids. Thus, the modeling of pseudo-measurements using conventional and machine learning techniques from historical information in distribution grids is applied to address the lack of real measurements in ADNs. Different types of measurements (real, pseudo, and virtual measurements), alongside network parameters, are fed into model-based or data-based DSSE approaches to estimate the state variables of the distribution grid. The results obtained through DSSE should be sufficiently accurate for the appropriate management and overall performance evaluation of a distribution grid in a control center. However, distribution grids are prone to different cyberattacks, which can endanger their safe operation. One particular type of cyberattack is known as a false data injection attack (FDIA) on measurement data. Attackers try to inject false data into the measurements of nodes to falsify DSSE results. The FDIA can sometimes bypass poor traditional data-detection processes. If FDIAs cannot be identified successfully, the distribution grid’s performance is degraded significantly. Currently, different machine learning applications are applied widely to model pseudo-measurements, calculate DSSE variables, and identify FDIAs on measurement data to achieve the desired distribution grid operation and performance. In this study, we present a comprehensive review investigating the use of supervised machine learning (SML) in distribution grids to enhance and improve the operation and performance of advanced distribution grids according to three perspectives: (1) pseudo-measurement generation (via short-term load forecasting); (2) DSSE calculation; and (3) FDIA detection on measurement data. This review demonstrates the importance of SML in the management of ADN operation.
1. Introduction
A power grid consists of three main sections: generation, transmission, and distribution [1]. The electric power output at the generation side is transmitted over long distances over high-voltage transmission lines [2]. The voltage level is stepped down at the distribution side of the grid, allowing the adoption and use of electricity by customers. A typical distribution grid consists of a high-to-medium-voltage (HV/MV) transformer and a medium-to-low-voltage (MV/LV) transformer [3]. Industrial consumers are connected to MV grids, while residential and commercial customers are typically connected to LV grids, feeding from MV/LV transformers [4]. Low-voltage distribution grid density has become more crowded over time because of the rapidly growing electricity demand [5,6]. Power networks are evolving from passive distribution networks with unidirectional communication paths to active distribution networks with bi-directional communication. Distribution grids without DGs are known as passive, since the power is supplied from the main grid. In contrast, active distribution networks (ADNs) are supplied by DGs in addition to a main grid. Moreover, the inclusion of other new features—including the penetration of different types of DG, electric vehicles (EVs), variable loads, the installation of smart meters and sensors, etc. [7,8]—converts traditional distribution grids into smart grids.
In Figure 1, the structure of an advanced smart grid is represented. The control center, transmission grids, and distribution grids are shown in the center. These are required to transmit power from the source (left) to the consumer (right). As shown in the figure, there is bidirectional communication between the transmission and distribution infrastructure (center column) and the power generation sources (left column). Likewise, there is bidirectional communication between the transmission and distribution infrastructure and the power consumption sources (right column) [9,10]. Smart power grids introduce several benefits to traditional grids in different respects. These benefits may include the promotion of renewable and green energy as alternative sources, the development of infrastructure for power storage and electric vehicles to use the economic and environmental advantages of these technologies, stimulating the development of smart cities to reduce energy costs and peak demand, and improving the quality and reliability of power grids. The requirement of an observability assessment and the need for distribution system operators (DSOs) to monitor and control ADNs are intensified by the emergence of these technologies [11].
The data from measurement instruments are among the main requirements for the monitoring and control of ADNs using distribution system state estimation (DSSE) calculations. Unfortunately, measurement devices are not found at all buses in ADNs to collect sufficient measurements and send them to a control center for obtaining state variables. To address the lack of measurements in ADNs, techniques for generating pseudo-measurements from historical load and generation data have been developed. In addition to the availability of sufficient measurements for DSSE calculations, measurement validity is also critical for obtaining accurate DSSE results. However, the measurement accuracy is influenced and degraded by FDIAs on measurements, and FDIA-detection methods have emerged to analyze measurement data and to enhance ADN performance.
1.1. Literature Review
The integration of these new technologies has paved the path towards grid modernization, but the management and control strategy for distribution grids have become more challenging and complicated [12,13]. For example, DSSE algorithms have been developed to include more advanced features to monitor and detect modifications in ADNs [14,15].
Transmission system state estimation (TSSE) methodologies have also been developed and implemented in transmission grids [16,17]. Unfortunately, these methods cannot be applied directly in distribution grids [18,19], as distribution grids have different characteristics than transmission networks. Some differences include a high resistance-reactance ratio (r/x), a lack of sufficient measurement devices, radial or weakly meshed structure, and three-phase imbalanced operation [20]. Thus, new algorithms should be developed in response to distribution grid constraints and needs [21,22,23].
DSSE calculations are strongly dependent on real measurements collected by various instruments installed on distribution grids [24,25]. However, measurement device placement is limited and challenging on the LV side: LV substations consist of several LV transmission lines, and installing measurement devices on each line is prohibitively expensive [26,27]. To address the lack of measurements and improve the quality of DSSE calculations in distribution grids, it is possible to use pseudo-measurements (corresponding to off-line load estimation) from historical data and load forecasting techniques [28,29]. Load forecasting is crucial in dealing with the load demand variation in distribution grids [30,31]. Electrical load forecasting is a computational method that estimates future load demand values based on past and present load demand [32,33]. However, load forecasting techniques are challenging since distribution grid operators may experience a rapid load demand variation due to the wide installation and growing desire to use DGs in smart distribution grids [34,35,36]. Electrical load forecasting techniques are divided into three types, depending on the forecasting time horizon [37,38]:
- ➢
- Short-term load forecasting (STLF), ranging from one hour to one week.
- ➢
- Medium-term load forecasting (MTLF), ranging from one week to one month.
- ➢
- Long-term load forecasting (LTLF), ranging from one month to one year.
Solar energy sources and wind turbine systems are common sources of renewable energy. Unfortunately, uncertainties and variations associated with these energy sources have led to new challenges for STLF in advanced distribution grids [39,40]. Data analysis using machine learning approaches can be implemented to perform computational STLF analysis to satisfy the consumers’ electricity demand in distribution grids [41,42].
DSSE results depend on both the availability and accuracy of real measurements obtained from measurement devices [43,44]. However, adding new measurement technologies to distribution grids increases the possibility for attackers to manipulate information obtained from these devices [45,46]. The accuracy of DSSE results can be diminished significantly when false data injection attacks (FDIAs) affect collected measurement data [47,48]. This can negatively affect many power grid operations because DSSE results are sent to the control center to perform many procedures: contingency analysis, power flow studies, distribution grid stability and reliability, distribution energy management, etc. [49,50]. Thus, it is important that DSSE results be accurate enough to assess the operation and management of the distribution grids [51,52]. Different techniques, relying on model-based and data-based approaches, have been developed to identify and eliminate FDIAs in measurement data in order to improve DSSE performance [53,54].
Many of the data-based techniques rely on machine learning (ML). ML approaches have been applied widely in distribution grids to extract valuable data from measurement devices and to improve performance [55,56]. ML is an evolving branch of computational algorithms and statistical models allowing computers to learn and act in an independent manner without human intervention [57]. Recent advances in ML have resulted in its solving various complicated problems [58]. Additionally, the performance and prediction capabilities of ML algorithms improve over time as new data are collected and analyzed [59]. As will be described in more detail later, ML approaches are classified into four main categories: supervised, unsupervised, semi-supervised, and reinforcement learning [60].
1.2. Motivation
There are many studies that focus on the implementation of different ML methods in distribution grids [61,62]. In [63], the authors proposed a new method based on ML approaches which can solve various learning tasks including classification, regression, count data regression, and ordinal regression. In [64], a machine learning method is applied for proper energy management in a distribution grid. In [65], a flexible machine learning method is used for cybersecurity detection in a distribution grid considering spatiotemporal patterns. In [66], the potential of ML methods is studied at the distribution grid level to perform forecasting while maintaining reliability and observability. In [67], a comprehensive review of different machine learning approaches for renewable energy prediction in a power grid is presented. In [68], a comprehensive review of the literature on distributed resources and loads, real-time operation and planning, and protection of distribution grids using different ML approaches is performed. In [53], ML and deep neural network (DNN) applications for distribution grid security issues and energy forecasting are reported. In [69,70], different ML applications for electricity price forecasting are introduced. In [71,72], a wide range of ML architectures for building energy systems, building energy forecasting, and building load prediction are surveyed. In [73], different ML approaches are studied for enhancing power system security and stability. In [26,74], various data-based methods for big data management from smart meters are discussed. In [75], model-based and data-based techniques are discussed, focusing on their advantages and disadvantages for DSSE computations. In [76], some ML-based methods are reviewed to perform distribution system static-state estimation. In [77], the applications of artificial intelligence in the domains of microgrid load forecasting and energy management, control and protection are discussed. In [78], ML applications on cyber-physical distribution systems are discussed, and specific opportunities relevant to the COVID-19 period are identified. Challenges and possible research directions using ML approaches on cyber-physical distribution systems (focusing on smart buildings and transportation systems) are studied by the authors. In [79], a comprehensive review of smart grid solutions, blockchain technology, and ML approaches is performed. The authors also analyze the benefits and challenges related to these topics. In [80], machine learning applications for enhancing smart grid performance are reviewed.
As discussed in the previous paragraph, various review papers have already analyzed ML methodology and its application for different objectives at the distribution level. Some of these applications include energy forecasting, load forecasting, reliability, security, observability, protection maintenance, DSSE, and FDIA detection. However, the reviews generally focus on one particular problem associated with distribution grids, and then analyze the potential solutions using different ML methods. For example, while there are separate reviews of how ML is used for DSSE, FDIA detection, and pseudo-measurement generation, there is no single review that discusses the interactions between these three areas.
There are many applications of supervised machine learning (SML) in distribution grids, including fault detection, energy management system, distribution grid protection, demand response, and topology identification. However, in this study, we emphasize the operation and maintenance strategies of distribution grids resulting from using SML methods to (1) generate pseudo-measurements, (2) perform DSSE calculations, and (3) detect FDIAs. Understanding the relationship between these three topics is required to meet the demands of grid modernization development. The main contributions of this paper are summarized as follows:
- We review different SML strategies that are particularly applicable in the operation and monitoring of distribution grids.
- We concisely review DSSE concepts that cover the topics of generating pseudo-measurements (based on STLF calculations) from limited available measurements, performing DSSE calculations, and detecting FDIAs to ensure distribution grid data integrity.
- We provide a comprehensive summary of SML research performed on distribution grid operation and control technology.
This overview paper can be used as a comprehensive reference for researchers who are interested about ML-based distribution system management.
2. Machine Learning Algorithms
A significant amount of data are being produced as part of modern power equipment and grid modernization procedures [81]. This data can come from various locations in the power grid, from generation sources to customer loads [82]. Both the data and the advanced power grid facilities can improve power system performance and analysis [83]. ML techniques have been widely used and developed in power grids to extract information obtained from different power system sections and components to properly manage and control a power grid [84,85]. In addition, forecasting analysis can be performed using model-based and/or ML-based methods [86,87]. Using ML approaches rather than using model-based methods results in several benefits [88,89]. Some benefits are as follows: (1) more accurate results, (2) fast decision making, (3) the ability to deal with massive data volumes at high sample rates, (4) simultaneous performance of multiple tasks with different levels of uncertainty, and (5) the ability to predict future system conditions and states.
ML methods are advanced mathematical techniques that attempt to mimic human decision making by using a data-based learning procedure [90]. ML techniques are commonly divided into four categories: supervised learning, unsupervised learning, semi-supervised learning, and reinforcement learning. These methods are illustrated in Figure 2.
In supervised learning, a corresponding output (Y) is available for each input data (X). The relationship between X and Y is represented as Y = F(X). Supervised learning algorithms estimate the function F which can be used to predict class labels or make decisions for examples not present in the training dataset [91]. In unsupervised learning, the input dataset is not labeled (i.e., the corresponding output is not available), and a function tries to find patterns in the training dataset [92]. In semi-supervised learning, some of the given data are unlabeled, but the training process can take advantage of the points that do have labels [93]. Reinforcement learning is a computational approach where the algorithm (agent) learns to achieve a goal in an uncertain, potentially complex environment [94]. Reinforcement learning does not need labeled data for a training procedure, but there needs to be a way for the agent to receive positive or negative feedback after making a decision [95].
In this paper, we aim to review SML applications in distribution grid operation and performance. In the remainder of this section, some SML methods will be discussed.
2.1. Supervised Machine Learning Methods
Regression and classification are two common subcategories of SML [96]. Regression and classification methods can be carried out using various techniques, some of which are shown in Figure 3.
2.1.1. Regression
The main objective of a regression method is to discover a relationship between input variables (features) and target values [97]. This type of algorithm is trained on historical data and used to predict or estimate unseen future data. There are several types of regression algorithms, including linear regression [98], polynomial regression [99], support vector regression [100], decision tree regression [100], and artificial neural network (including deep neural network) regression [101].
2.1.2. Classification
A classification model attempts to predict the category or class label of a given input based on its features [101]. The output of a classification model is a discrete class label or a probability distribution of many class labels. Classification problems with two classes are known as binary classification problems; problems with more than two classes are known as multi-class classification problems [102]. In ML classification, a model is learned using the values and labels of a set of training data, which is used to predict unseen future data [103]. There are several types of classification algorithms: logistic regression [104], support vector classifier [105], decision tree classifier [106], artificial neural network (including deep neural network) classification [107], and more.
- Linear Regression (LR)
LR is used to predict a dependent variable (y) based on one or more independent variables (x) [108]. The simple form of linear regression can be represented as the following equation:
where y is the target value, w0 is the y-intercept, w1, w2,⋯, wn are weights associated with each input variable, and x1, x2,⋯, xn are the input variables (features). In LR, the main purpose is to estimate the coefficients w0, w1,⋯, wn that minimize the error (e) between the predicted values ( and actual values (y). This is typically performed using the least squares approach defined as minimizing:
- b.
- Polynomial Regression
Polynomial regression is an extension of linear regression where the relationship between the independent variable (x) and dependent variable (y) is represented by a polynomial function of x [109]:
where y and x are dependent and independent variables, respectively. The weights (w0, w11,⋯, wmn) are coefficients that determine the shape of the polynomial curve. The degree of the polynomial is n, which represents the maximum complexity of the curve. Polynomial regression can be useful when the relationship between the variables shows a curved pattern, and it allows the non-linear relationship between the features to be captured [110].
A simple example of linear and polynomial regression models is shown in Figure 4.
- c.
- Logistic Regression
Logistic regression is a common classification approach that is applied to predict both binary and multi-class outcomes [111]. The relationship between a dependent variable (target) and one or more independent variables (features) is modeled using class probability estimations. As shown in Figure 5, a logistic regression model uses a logistic or sigmoid function to ensure the output is a value between 0 and 1, with most points having a value very close to either 0 or 1.
Simplicity, the interpretation of model coefficients, and accurate and efficient training are some advantages of logistic regression algorithm [112].
- d.
- Support Vector Machine
A support vector machine (SVM) is an SML technique which can be applied for classification and regression tasks [113]. Support vector regression (SVR) is utilized for regression tasks where the target variable is continuous, while support vector classification (SVC) is applied for classification tasks where the target is categorical. The main objective in SVR is to find a hyperplane that best fits the training data while minimizing the maximum distance (margin) between the hyperplane and the closest training data [114]. This is illustrated in Figure 6a. The hyperplane reflects the regression function that can be used to predict unforeseen future data. Those data points that lie closest to they learned hyperplane are called support vectors. The support vectors uniquely determine the position of the hyperplane. Defining a tolerance region around the regression line as allows some degree of flexibility in the placement of the learned hyperplane. The SVR can be kernelized to estimate a nonlinear regression curve [115].
SVC is a popular approach based on binary classification [116]. Multi-class SVCs can be built using many binary SVCs. Additionally, SVCs can be implemented for both linear and non-linear (using kernels) classification by finding an optimal hyperplane that maximizes the margin between the class boundaries [117]. As shown in Figure 6b, data points which are close to the hyperplane are called support vectors. As with SVR, the position and orientation of the hyperplane are determined by the support vectors. Unfortunately, SVC is not always suitable for large-scale datasets due to the computational complexity in learning the decision boundary [118].
- e.
- Decision Tree
The decision tree is a popular and intuitive ML model that can be used for both classification and regression analysis [119,120]. Figure 7 illustrates a simple decision tree model that consists of connected decision nodes and leaf nodes. At each decision node, a decision is made based on a single feature; at each leaf node, an output is predicted. A decision tree regression (DTR) model has a broad range of applications, especially when the relationships between independent and dependent variables are nonlinear or when model interpretability is important [121]. However, the nature of the decision tree results in highly quantized regression values as the output. A decision tree classification (DTC) algorithm can be applied to both binary and multi-class classification problems [122]. However, decision trees are susceptible to overfitting if the tree is allowed to grow deeply or the data are noisy [123].
- f.
- Deep Neural Network
As shown in Figure 8a, a single-layer perceptron includes one input layer with one or many input units and an output layer with one or many output units [124]. In contrast, a multilayer perceptron has a number of hidden layers as well. Single-layer perceptrons and multi-layer perceptrons are both types of artificial neural networks (ANNs), which are algorithms that are loosely inspired by the human brain. A DNN is a multi-layer perceptron with 2 or more hidden layers [125,126]. In feed-forward DNN models, the information flows in only one single direction: from the input layer, through the hidden layers, to the output layer.
Figure 8b shows a DNN model consisting of an input layer, activation functions, hidden layers, weights, neurons, and an output layer. The input data are received by neurons in the input layer and transferred to the different layers in the network. The hidden layers are located between the input and output layers; the number of hidden layers and the number of neurons are determined by means of empirical testing or trial and error [127]. In order to predict an accurate output based on the original input, the weights of the DNN are constantly updated during training. In classification or regression problems, a DNN model is applied to predict a class label or a numerical value, respectively [128]. The weight on the connection shows the magnitude between the two connected nodes and falls within the range of 0 to 1. The sum of the weighted inputs is determined by the neurons and normalized by the activation function. The activation function is applied within the hidden and output layers and can be either linear or nonlinear. Sigmoid, tanh, and Rectified Linear Unit (ReLU) are three common forms of nonlinear activation functions.
Different versions of DNNs can be used for application-specific tasks in power grids [129]. Convolutional neural networks (CNNs) are one common type of DNN approach. Originally developed for image classification [130], CNNs are also effective for power load prediction [131]. CNNs can be applied to 1-D, 2-D, and 3-D data [132]. Long short-term memory (LSTM) networks are another type of DNN capable of forecasting time-series data [133]. CNNs and LSTMs have similar network architectures and training procedures as traditional feed-forward DNNs [134].
2.2. Assessment of Regression and Classification Methods
Different criteria are applied to evaluate the performance of regression and classification SML methods [135]. These criteria are analyzed to determine the most effective method for a specific task.
- Evaluation Metrics in Classification
Many metrics can be used to evaluate classification performance [136]; some common evaluation metrics for classification methods are reviewed. Note that the definitions provided below apply to binary classification problems but can also be extended for multiclass problems [137].
- Accuracy: This is the most common evaluation metric in classification problems. Accuracy is defined as the ratio of the number of correct predictions over the total number of predictions.
- TP stands for true positive, where both predicted and actual outputs are positive. TN stands for true negative, where both predicted and actual outputs are negative. FP stands for false positive, where predicted outputs are positive, but actual outputs are negative. FN stands for false negative, where predicted outputs are negative, but actual outputs are positive.
- Precision: This is defined as the proportion of correctly predicted positive outputs to the total number of predicted positive outputs.
- Recall: This is defined as the proportion of correctly predicted positive outputs to the total number of actual positive outputs.
- F1 Score: Precision and recall are combined into a single metric in the F1 score, which conveys the balance between the precision and recall. The F1 score is particularly useful when there is an imbalance between classes in the dataset.
- b.
- Evaluation Metrics in Regression
Different evaluation metrics can be implemented to analyze the performance of regression models [138]. Some common evaluation metrics for regression methods are explained below.
- Mean Square Error (MSE): The MSE is calculated as the mean or average of the squared differences between predicted and estimated output values of a dataset; it is defined as:
- Root Mean Square Error (RMSE): The RMSE is the square root of MSE. One benefit of using RMSE is that its unit is the same as the original unit of the target value.
- Mean Absolute Error (MAE): The MAE is simply the average of the absolute error values. Like RMSE, the unit of the MAE is the same as the original unit of the measurements.
For Equations (8)–(10), y and are the actual and predicted values in the dataset, respectively, and N is the sample size.
3. Supervised Machine Learning Approaches for Short-Term Load Forecasting
Load forecasting, or predicting the status of future loads based on information about recent loads, is critical for ensuring stable and reliable power grid operation [139]. Load forecasting strategies have recently received attention since they can greatly affect power grid performance. For example, load forecasting can affect demand-side management, fault detection diagnostics, distributed and renewable energy management, and power system control optimization [140].
Load forecasting strategies are generally classified into three main groups based on their time horizons: (1) short-term load forecasting (STLF), (2) medium-term load forecasting (MTLF), and (3) long-term load forecasting (LTLF). As shown in Figure 9, the STLF time horizon is from one hour to one week, the MTLF time horizon is from one week to one year, and the LTLF time horizon is one year or longer. Load forecasting problems can be influenced by several factors including customer behavior, economic constraints, distributed generations, and weather conditions [141].
Among the three major load forecasting groups, STLF plays the most significant role in ensuring the secure and efficient operation of power systems [142]. Maintenance scheduling, cost optimization, and continuous electricity supply are highly dependent on STLF techniques [143]. Moreover, STLF predictions ranging from one hour to one day ahead can be treated as pseudo-measurements, which are required to perform DSSE calculations [144]. Because of the lack of measurement devices in distribution grids, actual measurement data are commonly combined with temporal and meteorological information to generate STLF models [145,146].
Various conventional methods have been analyzed to develop the most accurate results for STLF studies [147]. The increased development of advanced technologies and greater nonlinearity in the patterns of customer behavior associated with modern distribution grids have rendered many of these traditional methodologies obsolete [148]. Increasing data accessibility in the power sector offers an opportunity to apply ML algorithms in STLF applications to enhance forecasting precision and stability [149]. ML methods are capable of dealing with linear and nonlinear power usage patterns, have an efficient computational procedure, and apply data management techniques for STLF applications [150]. Several studies where SML is used in STLF modeling are briefly discussed below.
In [151], a one-dimensional (1-D) CNN based on Video Pixel Networks (VPNs) [152] is applied for STLF from 1 h ahead to 24 h ahead. The method is compared with the LSTM and Gated Recurrent Unit (GRU) [153] methods using the mean absolute percentage error (MAPE) criteria. Their method indicates much better results for 24 h ahead predictions compared to the LSTM and GRU methods.
In [154], a hybrid method based on a CNN and a bilateral long short-term memory [155] (BiLSTM) network is applied to solve STLF for one-day-, two-days-, and one-week-ahead forecasting. A Grey Wolf optimization (GWO) [156] technique is implemented to obtain the optimal set of CNN and BiLSTM hyperparameters. The method has a better performance in MAE, MAPE, and RMSE measures than CNN-LSTM, as well as conventional LSTM and BiLSTM methods.
In [157], cross-validation based on a transfer learning approach [158] using an LSTM-DNN is implemented for an STLF procedure. Only monthly energy consumption with a resolution of 15 min and calendar data are used in order to decrease the dependency on processing parameters. This is in contrast to other studies which also used weather data for the STLF procedure [159,160].
In [161], auto regressive integrated moving average (ARIMA) [162] and ANN methods based on statistical and ML approaches are used to perform STLF for individual households over 18 months. Their results indicate that ANN has a better performance than ARIMA when considering the time-varying nature of weather and seasonal conditions.
In [163], SVR, random forest (RF) regression [164] and LSTM methods are utilized to perform STLF analysis, and some advantages and disadvantages of each approach are discussed. A fusion forecasting method, which includes a data preprocessing step and multi-step forecasting, is utilized to combine the SVM, RF, and LSTM methods to take advantage of all methods’ benefits simultaneously. It indicates that combining the three methods results in a higher STLF accuracy level than each individual method.
In [165], LR, DTR, and SVR are implemented to perform STLF in residential loads. The RMSE value for SVR is approximately 28% and 50% less than DTR and LR, respectively. Moreover, SVR requires less execution time compared to the DTR and LR methods.
In [166], an enhanced support vector machine (ESVM) and an enhanced convolutional neural network (ECNN) are studied for STLF. A random search (RS) technique [167] is used to set the hyperparameters of both methods. Temporal, meteorological, congestion data, etc., from January 2011 to December 2018 are used to predict loads one week ahead. ESVM and ECNN are compared with conventional SVM and CNN methods in MSE, MAE, mean percentage error (MPE), and RMSE values to show that the ESVM and ECNN have a better performance compared with their respective conventional approaches.
In [168], the exponential smoothing method [169] and other ML methods, including SVR, CNN, ANN, LSTM, and CNN-LSTM, are analyzed and compared using R-squared [170], MAE, and RMSE criteria for the STLF task. The CNN-LSTM hybrid method has a better performance than the other methods since the MAE and RMSE values are minimized, and the R-squared value is maximized. Temperature, solar radiation, wind speed, wind direction, humidity, and historical load data are used as inputs for six-hours-ahead forecasting.
In [171], a new method based on a deep residual neural network (DRNN) [172] is applied for one-hour-ahead and day-ahead forecasting of household electricity. Weather, calendar features, and four-year historical load data are used for STLF. They compared their proposed method with SVR, DTR, LR, and RF approaches in RMSE, MAE, and R-squared values to reveal the effectiveness of the DRNN method. A comparison shows that their method provides more accurate results compared to other SML methods.
In [173], a hybrid model based on time series image encoding [174] and a CNN method is implemented for 15-min forecasting of a single residential load. The performance of the method is compared with SVR, ANN, and 1-D CNN methods in MAPE, MAE, and RMSE values. It is shown that their method is more accurate in predicting individual loads than the SVR, ANN, and 1-D CNN approaches.
In [175], a DNN model is designed for individual and regional consumption household STLF for day-ahead load profiles. A pre-trained restricted Boltzmann machine [176], and a Rectified Linear Unit (ReLU) without pre-training [177] are implemented for DNN training. Their method is evaluated by comparing MAPE and PRMSE values with other methods such as shallow neural network (SNN), ARIMA, and the double seasonal Holt–Winter (DSHW) model [178]. It is shown that MAPE values decrease by 17% and 9% compared to the SNN and DSHW methods, respectively.
In [179], the DeepEnergy configuration based on a DNN model is implemented to make predictions three days ahead of load profiles. Some common SML methods on load forecasting, including SVR, RF, DTR, MLP, and LSTM, are compared with the DeepEnergy method in MAPE and cumulative variation in the root mean square error (CV-RMSE) [180]. It is shown that the DeepEnergy model has a better performance, with 9.77% and 11.65% values for MAPE and CV-RMSE, respectively, which is lower than other SML methods.
In [181], an SVR approach is implemented for minutes-ahead and hours-ahead load prediction. A two-step hybrid parameter optimization method is applied to optimize the SVR parameters. First, a grid traverse algorithm (GTA) [182] approach is used to transfer the parameters from a global to a local space. Then, the best parameters of SVR are determined based on the GTA results using particle swarm optimization [183] in the local space.
In [184], an ANN with one hidden layer is designed to perform one-hour-ahead load forecasting. Various activation functions—including binary step, sigmoid, hyperbolic tangent, Gaussian, soft plus, identity, and ReLU—are tested to obtain more accurate results. MAPE, minimum error, maximum error, average error, and standard deviation values are used to compare the results for each ANN model with different activation functions. Average error, MAPE, minimum error, maximum error, and standard deviation of 9.4%, 2.08, 0.4051%, 18.93%, and 0.0795, respectively, are calculated for the sigmoid activation function in the hidden and output layers. The work reveals that the sigmoid function has a better performance than the other activation functions.
In [185], the multi-variable linear regression (MLR) and multi-core parallel processing [186] methods are implemented to manage big data for hourly and one-week-ahead load forecasting. Temperature, humidity, day of the week, hour of the day, and historical load data are used as independent variables. The MAPE values are calculated, and the research shows that both MLR and multi-core parallel processing are effective for load prediction.
Table 1 gives a summary of the methods and datasets used in the papers discussed above.
Distribution grid monitoring is possible using DSSE calculations, and DSSE computations are highly dependent on measurement data. However, the lack of measurement devices in distribution grids requires generating pseudo-measurements based on STLF from historical data and other available information. Various pseudo-measurement generation techniques have been developed to enhance DSSE results. Different SML approaches have been established to perform STLF calculations to improve the accuracy of results.
4. Supervised Machine Learning Approaches for Distribution System State Estimation
State estimation (SE) calculations have been introduced to monitor the performance and security of power grids [189]. The SE process is used to estimate the states of a power system based on available measurements and network parameters. SE computation is considered the core of a grid’s energy management system (EMS) since SE results are applied to control and improve the operation performance of a power grid [14]. Contingency analysis, security assessment, economic dispatch, and other functions are possible using SE results [190]. TSSE has been successfully developed and applied to transmission networks for several years. Transmission grids are mainly designed using a mesh configuration. In addition, they are typically over-determined and fully observable systems since the number of available measurements exceeds the number of state variables in a TSSE calculation [191]. In contrast, distribution networks are configured with either a radial or weakly meshed structure and have a fairly large number of nodes. This makes it impossible to place measurement devices at all nodes and leads to a lack of measurements for DSSE calculations [192]. The differences between transmission and distribution grids mean that TSSE methods are not directly applicable in distribution grids; new methods and approaches should be designed to address the requirements of distribution grids [193].
Distribution grids are generally responsible for supplying high-quality end-customer service and can be used for operational and management planning. These are critical tasks, which can be accomplished using appropriate DSSE calculations [194]. DSSE computations are highly dependent on data which are obtained from measurement tools. However, distribution grids do not generate enough real measurements to perform an accurate DSSE calculation [195]. Therefore, generating pseudo-measurements from an available measurement and historical data is widely applied to address the lack of measurements in order to execute DSSE computations precisely [196].
The state vector for a distribution system can be defined as the voltage magnitude and phase angle at each bus or the branch current magnitude and angle of each branch in a distribution grid [197].
If there is a measurement device at a slack bus (only traditional measurements), the voltage magnitude and the phase angle of that bus are 1 p.u. and zero (, respectively [198], and a state vector can be represented in polar form as [199]. In this vector, and are the voltage phase angle and magnitude for three phases , respectively, and N is the number of buses. In contrast, if there is a measuring device at the slack bus, the phase angle and the voltage magnitude are not zero, and the state vector is defined as [200]. State variables for nodal voltage analysis can also be represented in rectangular form as when only traditional measurements are available in a distribution grid or when a phasor measurement unit (PMU) is placed in the slack bus [201]. and are the real and imaginary components of the node voltage on each phase (), respectively. In the branch current state estimation calculation, the state vector can be expressed in rectangular form as , where , are the real and imaginary parts of the branch currents of each phase (), respectively, and N is the number of branches [201]. The state vector can also be represented in polar form as , where and are the current magnitude and angle, respectively, in every branch of each phase (, and N is the number of branches [202].
Model-based DSSE techniques based on measurement information and network parameters have been established to acquire state vectors. Some traditional model-based DSSE techniques and their advantages and disadvantages include the following [203]:
- Weighted least squares (WLS) is applicable in both transmission and distribution grids; it is a fast and straightforward method, but it is sensitive to bad data.
- Least median of squares (LMS) is robust against bad data. However, it requires high computational complexity and measurement redundancy.
- Least trimmed squares (LTS) is robust against bad data, but both computational complexity and memory utilization are high.
- Least absolute value (LAV) is robust against bad data and line impedance uncertainty, but in contrast, it is sensitive to measurement uncertainty and leverage points.
DSSE calculation has received much attention due to the new features of advanced distribution grids including DGs, electric vehicles (EVs), two-way communication, smart buildings, energy storage systems, and smart meters [204]. These advanced features have increased the complexity of distribution grids, and new DSSE techniques are required to improve SE results in terms of accuracy and speed [205]. Thus, DSSE approaches based on ML techniques have been widely developed to enhance SE results since these algorithms are mainly established on available data, unlike model-based methods, which rely on system information [206]. With the development of sensor and smart meter technologies in distribution grids, the direction for further research on DSSE techniques using ML methods has become important among the research community [207]. Several DSSE studies using SML techniques are briefly reviewed.
In [208], two DNNs are used to detect network topology and perform DSSE calculations. Switch status is identified by a DNN model using only sparse measurement data. Another DNN is trained to perform DSSE calculations for an imbalanced three-phase distribution network. Voltage magnitudes and phase angles are defined as the state vector. The authors tested and verified their proposed method for both radial and meshed networks with photovoltaic panels (PVs). Moreover, the authors introduce non-Gaussian noise to smart meter measurements to show the robustness of the method.
In [209], an ANN-based model is used to perform DSSE calculations using a limited number of measurements in the presence of two types of distributed generations (PVs and wind turbines). Voltage magnitudes and branch currents are defined as state variables. The method is tested and verified on a benchmark distribution grid and a real distribution grid considering high penetration of DGs. They compared the accuracy of the method with the WLS approach using the same measurement data (and pseudo-measurements) and showed that the method works well with high accuracy and fast execution time.
In [210], a new DNN-based method named pruned physics-aware neural network (P2N2) is used to improve voltage magnitude estimation. The connections between hidden layers are determined based on the physical topology of the distribution grid. They utilized one year of load data to generate different scenarios using power flow calculations. These data, along with PMU measurements, are utilized to train and test their method under different observability conditions. They compared the method with the WLS approach and reported that the P2N2 method has better performance in terms of estimation accuracy in a low-observability condition.
In [211], the computational complexity of linear and nonlinear WLS methods and ANN models are compared in floating point operations (FLOPs). This technique is a machine independent measure to calculate the runtime of each method [212]. It is shown that the ANN method has a faster running time than the WLS methods. The paper compared FLOP values with elapsed time [213] and showed that elapsed time may not work well in a small distribution network, whereas the FLOP criteria is applicable in distribution networks of various sizes.
In [214], a data-driven approach based on an ANN model is used to perform distributed state estimation using limited PMU measurements. Voltage magnitudes and phase angles are defined as the state vector. A distribution grid is divided into several areas, and an ANN method is applied to obtain SE values for each area for each phase () [215]. SE results from each area are then sent to a control center for further processing, and a global DSSE calculation is performed using an ANN model to obtain the final results [216]. Multi-area data-driven and model-based approaches based on the WLS method are compared in terms of accuracy and execution time, and it is shown that state estimation variables from a data-driven approach follow a real value from a power flow calculation with higher accuracy and at a higher speed than the WLS method.
In [217], a distribution grid is divided into several independent sub-areas, and a certain ANN is designed for each area based on the available measurements in each area. A method is tested and verified at two distribution systems: one LV and one MV.
As mentioned previously, data-driven approaches do not depend on system information, whereas model-based methods do. However, data-driven methods require a certain amount of data to effectively perform DSSE calculations. So, some studies propose hybrid methods based on both data-driven and model-based approaches in order to take advantage of the strengths of each method [218].
In [219], in order to utilize different measurement data at different time scales, a hybrid method based on DNN and weighted least absolute value (WLAV) is implemented. When only supervisory control and data acquisition (SCADA) measurements are available, a DNN model is used to perform DSSE calculations; when SCADA and advanced metering infrastructure (AMI) measurements are available, the WLAV method is applied to obtain SE results.
In [220], distribution learning and regression methods are applied to generate power injection in a distribution grid, and a DNN model based on the Bayesian DSSE approach is used to obtain SE results. Voltage magnitudes and phase angles are defined as the state vector. Their method is tested and verified in both a radial and meshed network, showing that their model outperforms other DNN models.
In [221], a shallow ANN model is used to calculate an initial value using historical load and generation data, pseudo-measurements, PMU measurements, and current magnitude measurements. The initial values are used to perform SE calculations using Gauss–Newton iterative estimation [222]. The method shows acceptable performance in terms of accuracy and execution time.
In [223], historical data from distribution phasor measurement unit (DPMU) measurements (voltage and current magnitude and phase angle) and limited smart measurement data are utilized to train a feed-forward neural network to estimate the voltage magnitudes and phase angles of a distribution grid.
In [224], a novel ANN model is developed to calculate distribution grid state variables with high accuracy under different scenarios including topology changes, load variation, and bad data. Their method is also applicable to predicting measurements such as power flows and power injections. The proposed method is tested in different distribution grids with and without DGs to show its robustness.
Table 2 shows the methods used in each of the above case studies.
In summary, DSSE techniques based on data-driven and model-based approaches have been developed to meet the requirements of distribution grids while considering specific configurations and new features of modern distribution grids. DSSE can play a critical role in the ongoing energy transition towards a modernized grid. DSSE methods based on ML approaches might be an effective solution to predict state variables with higher accuracy and speed than model-based methods.
5. Supervised Machine Learning Approaches for Detecting False Data Injection Attacks in a Distribution Grid
Distribution system operators (DMOs) strongly depend on advanced distribution management systems (DMSs) to further develop smart distribution grids [226]. DSSE results are known as a fundamental tool for DMSs, since most DMS functions—including topology analysis, volt/VAR control, distribution load forecasting analysis, distribution congestion management, etc.—are completed using SE results [227]. Moreover, additional advanced features can be added to a distribution grid as part of grid modernization [228]. Therefore, accurate DSSE calculations play a crucial role in advanced distribution grid operation and performance. As mentioned in Section 3, the accuracy of SE results is directly affected by measurement data; increasing the quantity of smart measurement devices—such as PMUs, micro-PMUs (μPMUs), and AMIs—can significantly enhance the quality of DSSE results [229]. However, the possibility of false data injection attacks (FDIAs) on measurement data increases as the number of measurement devices in a distribution grid increases. Such attacks can degrade the precision of DSSE results [230].
FDIAs are a kind of cyber-attack aiming to falsify measurement data and disrupt the normal operation of a distribution grid [231]. The concept of FDIAs in power grids was first studied in 2009 [232]. FDIA detection has been established and developed in distribution grids to maintain the integrity and accuracy of DSSE results [233]. The purpose of bad data detection (BDD) is to identify faulty data in measurement information [234]. In a conventional BDD method, the -norm of the residual measurements is computed based on estimated and real measurements after DSSE calculations to determine if a measurement contains bad data. If the residual value is greater than a pre-defined threshold, bad data are unlikely to exist [235]. However, since FDIAs can successfully bypass this traditional BDD method, FDIAs cannot be commonly identified using simple thresholds, and errors could be introduced into a DSEE result. Therefore, ML techniques have been implemented to detect FDIAs efficiently [236]. Various types of SML techniques have been analyzed for FDIA detection in a distribution grid.
In [237], a new method based on an SML approach is used to detect FDIAs in the control system of a distribution grid in the presence of DGs. First, historical voltage and branch current magnitudes, along with meteorological data (solar irradiance and temperature), are used as inputs in an RF regressor to estimate voltage magnitude variables. A logistic regression method is then applied to detect and locate FDIAs on a control system. The method is tested on both centralized and decentralized distribution grids. A real 240-bus distribution grid in the USA and a simulated IEEE 123-bus are used as case studies. They showed that FDIAs could be identified with up to 99% accuracy.
In [238], a new method using a muti-output DNN approach is applied to detect FDIAs on measurements (classification) and perform DSSE calculation (regression) simultaneously. Two types of FDIA vectors are defined to test a method against different kinds of attacks. Moreover, the method is compared to a model-based approach using traditional BDD for FDIA detection and WLS for DSSE calculation. IEEE 33-bus and IEEE 69-bus distribution grids, with and without DGs, are used to demonstrate the capability of the method.
In [239], a new DNN-based method is used to identify the type and location of FDIAs in an ADN. The method is designed based on a multi-output DNN classification methodology and named as fault and attack location and classification (FALCON). The method and case studies for several other papers are discussed, and it is shown that the FALCON method could detect the type and location of FDIAs on an IEEE 13-bus distribution grid with up to 98% accuracy.
In [240], a new DNN-based method is applied to detect FDIAs in a distribution grid. A network training function is updated based on Levenberg–Marquardt (LM) backpropagation [241]. Active and reactive power injection and voltage magnitude and phase angle are considered as measurements which are manipulated by FDIAs. An IEEE 33-bus distribution network is used to validate the proposed method. FDIAs could be identified with high accuracy using this method.
In [242], an SVM approach is applied to identify FDIAs on μPMU measurements. Different types of attacks are defined and tested on several kernels to find a robust SVM which is effective at identifying FDIAs. The authors showed that their method can detect the number of attacks on a data set.
In [243], errors at different levels, distributions, and biases are considered on PMU measurements to classify events using different SML methods including k-nearest neighbor (k-NN) [244], naive Bayes (NB) [245], decision tree (DT), ensemble (EN) [246], SVM, and ANN. An IEEE 123-bus distribution grid is considered to test and verify the presented methods. Their work shows that the ANN has the best performance because of its flexibility and robustness against noise and nonlinear behaviors.
Table 3 shows the method and criteria for each paper reviewed in this section.
Ensuring the security of a power grid requires the ability to detect and mitigate FDIAs on measurements using an appropriate method. If FDIAs cannot be identified in real time, they could lead to considerable negative impacts on electricity market operations. Various methods have been developed to detect FDIAs in a smart grid. FDIA detection methods based on data-driven and model-based approaches have been applied to transmission grids but are not directly applicable in distribution grids. Therefore, researchers should focus on developing ML methods with minimum possible drawbacks in a distribution grid since data-driven approaches outperform model-based methods in terms of accuracy and speed.
6. Conclusions
Unlike conventional grids, smart distribution grids rely on two-way communication and power flow systems. This causes traditional approaches to not be applicable for modeling them. Additionally, distribution grids are moving towards more modern schemes with the fast-paced development of advanced features. At the same time, monitoring distribution grids is becoming more important in order to make proper decisions during operation. DSSE calculations have been established to calculate state variables using model-based or data-driven approaches to help make decisions that can optimize distribution grid performance.
In this paper, some common model-based DSSE approaches are reviewed, and then some data-driven algorithms based on SML methods are studied and discussed. DSSE calculations and results are strongly dependent on both the number and accuracy of available measurements. Due to the lack of measurement devices in a distribution grid, the number of real measurements is not sufficient to perform DSSE calculations. Generating pseudo-measurements via STLF—using historical load and generation data and other available information—is one solution that addresses this lack of measurements. In this study, some papers which use SML techniques for STLF prediction are reviewed. Case studies for each paper are mentioned to provide a comprehensive document for researchers. Real measurement precision and distribution grid performance might be degraded by FDIAs. Traditional and data-driven approaches have been developed to identify and mitigate FDIAs on measurements in a power grid. However, conventional methods are not able to detect FDIAs on measurements from SE results since FDIAs can bypass conventional BDD algorithms. Therefore, ML approaches have been developed to accurately and quickly identify FDIAs in a power grid. Even though FDIA detection using ML techniques has been established in transmission grids, these techniques cannot be directly implemented in distribution grids. In this work, a limited number of studies which applied SML techniques to detect FDIAs on distribution system measurements are reviewed.
A smart distribution grid is an interconnected system with many new and advanced features including two-way communications, smart cities, microgrids, EVs, DGs, etc. However, there are some challenges—such as cybersecurity, high penetration of DGs, data management, and the reliability and stability operations of ADNs—that currently make it impossible to take full advantage of these technologies. ML approaches can provide possible solutions in the deployment and operation of ADNs. Moreover, because of the development and installation of new tools and high penetration of DGs in distribution grids, there are many opportunities for researchers to develop and enhance their studies in distribution grid operation and performance using different ML approaches. ML techniques are being widely used in ADNs for different purposes including load forecasting, energy management, demand response, cyber-security awareness, fault detection, etc. This study paves the way for researchers who are interested in distribution grid operation by presenting a comprehensive review of novel uses of SML for (1) generating pseudo-measurements, (2) performing DSSE calculations, and (3) maintaining the integrity of DSSE results through FDIA detection.
Author Contributions
Conceptualization, H.N. and B.M.W.; methodology, S.R. and B.M.W.; investigation, S.R.; resources, H.N.; data curation, S.R.; writing—original draft preparation, S.R.; writing—review and editing, B.M.W. and H.N.; visualization, S.R.; supervision, B.M.W.; project administration, H.N.; funding acquisition, H.N. All authors have read and agreed to the published version of the manuscript.
Funding
This work was partially supported by the US National Science Foundation under Award 1806184 and by Montana State University.
Data Availability Statement
Not applicable.
Conflicts of Interest
The authors declare no conflict of interest.
Abbreviations
| ADN | Active distribution network |
| AMI | Advanced metering infrastructure |
| ANN | Artificial neural network |
| BDD | Bad data detection |
| DG | Distributed generation |
| DNN | Deep neural network |
| DSSE | Distribution system state estimation |
| DT | Decision tree |
| EV | Electric vehicle |
| FDIA | False data injection attack |
| HV/MV | High to medium voltage |
| LAV | Least absolute value |
| LMS | Least median of squares |
| LSTM | Long short-term memory |
| LTS | Least trimmed squares |
| ML | Machine learning |
| MAE | Mean absolute error |
| MPE | Mean percentage error |
| MSE | Mean square error |
| PV | Photovoltaic panel |
| PMU | Phasor measurement unit |
| ReLU | Rectified linear unit |
| RF | Random forest |
| RMSE | Root mean square error |
| SCADA | Supervisory control and data acquisition |
| SML | Supervised machine learning |
| STLF | Short-term load forecasting |
| SVM | Support vector machine |
| SVR | Support vector regression |
References
- Glover, J.D.; Sarma, M.S.; Overbye, T. Power System Analysis and Design; Cengage Learning: Boston, MA, USA, 2012. [Google Scholar]
- Li, F.; Qiao, W.; Sun, H.; Wan, H.; Wang, J.; Xia, Y.; Xu, Z.; Zhang, P. Smart transmission grid: Vision and framework. IEEE Trans. Smart Grid 2010, 1, 168–177. [Google Scholar] [CrossRef]
- Deka, D.; Kekatos, V.; Cavraro, G. Learning Distribution Grid Topologies: A Tutorial. IEEE Trans. Smart Grid 2022. early access. [Google Scholar] [CrossRef]
- Gomes, L.; Coelho, A.; Vale, Z. Assessment of Energy Customer Perception, Willingness, and Acceptance to Participate in Smart Grids—A Portuguese Survey. Energies 2023, 16, 270. [Google Scholar] [CrossRef]
- Aghahosseini, A.; Solomon, A.A.; Breyer, C.; Pregger, T.; Simon, S.; Strachan, P.; Jäger-Waldau, A. Energy system transition pathways to meet the global electricity demand for ambitious climate targets and cost competitiveness. Appl. Energy 2023, 331, 120401. [Google Scholar] [CrossRef]
- Pham, Q.V.; Liyanage, M.; Deepa, N.; VVSS, M.; Reddy, S.; Maddikunta, P.K.R.; Khare, N.; Gadekallu, T.R.; Hwang, W.J. Deep Learning for Intelligent Demand Response and Smart Grids: A Comprehensive Survey. arXiv 2021, arXiv:2101.08013. [Google Scholar]
- Palanisamy, S.; Rahiman, Z.; Chenniappan, S. Introduction to Smart Power Systems. In Artificial Intelligence-Based Smart Power Systems; Wiley: Hoboken, NJ, USA, 2023; pp. 1–13. [Google Scholar]
- Khan, S.N.; Kazmi, S.A.A.; Altamimi, A.; Khan, Z.A.; Alghassab, M.A. Smart Distribution Mechanisms—Part I: From the Perspectives of Planning. Sustainability 2022, 14, 16308. [Google Scholar] [CrossRef]
- Dileep, G. A survey on smart grid technologies and applications. Renew. Energy 2020, 146, 2589–2625. [Google Scholar] [CrossRef]
- Fan, J.; Borlase, S. The evolution of distribution. IEEE Power Energy Mag. 2009, 7, 63–68. [Google Scholar] [CrossRef]
- Pokhrel, B.R.; Bak-Jensen, B.; Pillai, J.R. Integrated approach for network observability and state estimation in active distribution grid. Energies 2019, 12, 2230. [Google Scholar] [CrossRef] [Green Version]
- Kazmi, S.A.A.; Shahzad, M.K.; Khan, A.Z.; Shin, D.R. Smart Distribution Networks: A Review of Modern Distribution Concepts from a Planning Perspective. Energies 2017, 10, 501. [Google Scholar] [CrossRef]
- Muscas, C.; Pau, M.; Pegoraro, P.; Sulis, S. Smart electric energy measurements in power distribution grids. IEEE Instrum. Meas. Mag. 2015, 18, 17–21. [Google Scholar] [CrossRef]
- Ahmad, F.; Rasool, A.; Ozsoy, E.; Sekar, R.; Sabanovic, A.; Elitaş, M. Distribution system state estimation-A step towards smart grid. Renew. Sustain. Energy Rev. 2018, 81, 2659–2671. [Google Scholar] [CrossRef] [Green Version]
- Stephen, B. Machine Learning Applications in Power System Condition Monitoring. Energies 2022, 15, 1808. [Google Scholar] [CrossRef]
- Zhao, J.; Gómez-Expósito, A.; Netto, M.; Mili, L.; Abur, A.; Terzija, V.; Kamwa, I.; Pal, B.; Singh, A.K.; Qi, J.; et al. Power System Dynamic State Estimation: Motivations, Definitions, Methodologies, and Future Work. IEEE Trans. Power Syst. 2019, 34, 3188–3198. [Google Scholar] [CrossRef]
- Bose, A. Smart transmission grid applications and their supporting infrastructure. IEEE Trans. Smart Grid 2010, 1, 11–19. [Google Scholar] [CrossRef]
- Heydt, G.T. The next generation of power distribution systems. IEEE Trans. Smart Grid 2010, 1, 225–235. [Google Scholar] [CrossRef]
- Yilmaz, M.; Krein, P.T. Review of the impact of vehicle-to-grid technologies on distribution systems and utility interfaces. IEEE Trans. Power Electron. 2013, 28, 5673–5689. [Google Scholar] [CrossRef]
- Boroyevich, D.; Cvetković, I.; Dong, D.; Burgos, R.; Wang, F.; Lee, F. Future electronic power distribution systems—A contemplative view. In Proceedings of the 2010 12th International Conference on Optimization of Electrical and Electronic Equipment, Brasov, Romania, 20–22 May 2010; pp. 1369–1380. [Google Scholar] [CrossRef]
- Lin, W.M.; Teng, J.H.; Chen, S.J. A highly efficient algorithm in treating current measurements for the branch-current-based distribution state estimation. IEEE Trans. Power Deliv. 2001, 16, 433–439. [Google Scholar] [CrossRef]
- Niknam, T.; Firouzi, B.B. A practical algorithm for distribution state estimation including renewable energy sources. Renew. Energy 2009, 34, 2309–2316. [Google Scholar] [CrossRef]
- Thukaram, D.; Jerome, J.; Surapong, C. Robust three-phase state estimation algorithm for distribution networks. Electr. Power Syst. Res. 2000, 55, 191–200. [Google Scholar] [CrossRef]
- Della Giustina, D.; Pau, M.; Pegoraro, P.A.; Ponci, F.; Sulis, S. Electrical distribution system state estimation: Measurement issues and challenges. IEEE Instrum. Meas. Mag. 2014, 17, 36–42. [Google Scholar] [CrossRef]
- Saldaña-González, A.E.; Sumper, A.; Aragüés-Peñalba, M.; Smolnikar, M. Advanced distribution measurement technologies and data applications for smart grids: A review. Energies 2020, 13, 3730. [Google Scholar] [CrossRef]
- Wang, Y.; Chen, Q.; Hong, T.; Kang, C. Review of Smart Meter Data Analytics: Applications, Methodologies, and Challenges. IEEE Trans. Smart Grid 2019, 10, 3125–3148. [Google Scholar] [CrossRef] [Green Version]
- Zheng, J.; Gao, D.W.; Lin, L. Smart meters in smart grid: An overview. In Proceedings of the 2013 IEEE Green Technologies Conference (GreenTech), Denver, CO, USA, 4–5 April 2013; pp. 57–64. [Google Scholar] [CrossRef]
- Muscas, C.; Pau, M.; Pegoraro, P.A.; Sulis, S. Effects of measurements and pseudomeasurements correlation in distribution system state estimation. IEEE Trans. Instrum. Meas. 2014, 63, 2813–2823. [Google Scholar] [CrossRef]
- Angioni, A.; Schlösser, T.; Ponci, F.; Monti, A. Impact of pseudo-measurements from new power profiles on state estimation in low-voltage grids. IEEE Trans. Instrum. Meas. 2016, 65, 70–77. [Google Scholar] [CrossRef] [Green Version]
- Wang, H.; Schulz, N.N. A load modeling algorithm for distribution system state estimation. Proc. IEEE Power Eng. Soc. Transm. Distrib. Conf. 2001, 1, 102–106. [Google Scholar] [CrossRef]
- Massignan, J.A.D.; Fantin, C.A.; London, J.B.A.; Camillo, M.H.M. Real-time load estimation for distribution feeders. In Proceedings of the 2015 IEEE Eindhoven PowerTech, PowerTech 2015, Eindhoven, The Netherlands, 29 June–2 July 2015. [Google Scholar] [CrossRef]
- Dewangan, F.; Abdelaziz, A.Y.; Biswal, M. Load Forecasting Models in Smart Grid Using Smart Meter Information: A Review. Energies 2023, 16, 1404. [Google Scholar] [CrossRef]
- Motepe, S.; Hasan, A.N.; Stopforth, R. Improving Load Forecasting Process for a Power Distribution Network Using Hybrid AI and Deep Learning Algorithms. IEEE Access 2019, 7, 82584–82598. [Google Scholar] [CrossRef]
- Falces, A.; Capellan-Villacian, C.; Mendoza-Villena, M.; Zorzano-Santamaria, P.J.; Lara-Santillan, P.M.; Garcia-Garrido, E.; Fernandez-Jimenez, L.A.; Zorzano-Alba, E. Short-term net load forecast in distribution networks with PV penetration behind the meter. Energy Rep. 2023, 9, 115–122. [Google Scholar] [CrossRef]
- Pinheiro, M.G.; Madeira, S.C.; Francisco, A.P. Short-term electricity load forecasting—A systematic approach from system level to secondary substations. Appl. Energy 2023, 332, 120493. [Google Scholar] [CrossRef]
- Tomar, A. Prediction Techniques for Renewable Energy Generation and Load Demand Forecasting; Springer Nature: Berlin/Heidelberg, Germany, 2023. [Google Scholar]
- Habbak, H.; Mahmoud, M.; Metwally, K.; Fouda, M.M.; Ibrahem, M.I. Load Forecasting Techniques and Their Applications in Smart Grids. Energies 2023, 16, 1480. [Google Scholar] [CrossRef]
- Singh, A.K.; Ibraheem; Khatoon, S.; Muazzam, M.; Chaturvedi, D.K. Load forecasting techniques and methodologies: A review. In Proceedings of the ICPCES 2012—2012 2nd International Conference on Power, Control and Embedded Systems, Allahabad, India, 17–19 December 2012; 2012; pp. 1–10. [Google Scholar] [CrossRef]
- Su, P.; Tian, X.; Wang, Y.; Deng, S.; Zhao, J.; An, Q.; Wang, Y. Recent trends in load forecasting technology for the operation optimization of distributed energy system. Energies 2017, 10, 1303. [Google Scholar] [CrossRef] [Green Version]
- Jain, R.; Mahajan, V. Load forecasting and risk assessment for energy market with renewable based distributed generation. Renew. Energy Focus 2022, 42, 190–205. [Google Scholar] [CrossRef]
- Ahmad, N.; Ghadi, Y.; Adnan, M.; Ali, M. Load Forecasting Techniques for Power System: Research Challenges and Survey. IEEE Access 2022, 10, 71054–71090. [Google Scholar] [CrossRef]
- Feinberg, E.A.; Genethliou, D. Load Forecasting. In Applied Mathematics for Restructured Electric Power Systems. Power Electronics and Power Systems; Springer: New York, NY, USA, 2005. [Google Scholar]
- Nainar, K.; Iov, F. Smart meter measurement-based state estimation for monitoring of low-voltage distribution grids. Energies 2020, 13, 5367. [Google Scholar] [CrossRef]
- Kuhar, U.; Pantos, M.; Kosec, G.; Svigelj, A. The Impact of Model and Measurement Uncertainties on a State Estimation in Three-Phase Distribution Networks. IEEE Trans. Smart Grid 2019, 10, 3301–3310. [Google Scholar] [CrossRef]
- Husnoo, M.A.; Anwar, A.; Hosseinzadeh, N.; Islam, S.N.; Mahmood, A.N.; Doss, R. False data injection threats in active distribution systems: A comprehensive survey. Future Gener. Comput. Syst. 2022, 140, 344–364. [Google Scholar] [CrossRef]
- Kamal, M.; Farajollahi, M.; Nazaripouya, H.; Mohsenian-Rad, H. Cyberattacks against Event-Based Analysis in Micro-PMUs: Attack Models and Counter Measures. IEEE Trans. Smart Grid 2021, 12, 1577–1588. [Google Scholar] [CrossRef]
- Deng, R.; Zhuang, P.; Liang, H. False Data Injection Attacks Against State Estimation in Power Distribution Systems. IEEE Trans. Smart Grid 2019, 10, 2871–2881. [Google Scholar] [CrossRef]
- Zhuang, P.; Deng, R.; Liang, H. False Data Injection Attacks against State Estimation in Multiphase and Unbalanced Smart Distribution Systems. IEEE Trans. Smart Grid 2019, 10, 6000–6013. [Google Scholar] [CrossRef]
- Huang, Y.F.; Werner, S.; Huang, J.; Kashyap, N.; Gupta, V. State estimation in electric power grids: Meeting new challenges presented by the requirements of the future grid. IEEE Signal Process. Mag. 2012, 29, 33–43. [Google Scholar] [CrossRef] [Green Version]
- Angioni, A.; Shang, J.; Ponci, F.; Monti, A. Real-Time Monitoring of Distribution System Based on State Estimation. IEEE Trans. Instrum. Meas. 2016, 65, 2234–2243. [Google Scholar] [CrossRef]
- Pegoraro, P.A.; Sulis, S. Robustness-oriented meter placement for distribution system state estimation in presence of network parameter uncertainty. IEEE Trans. Instrum. Meas. 2013, 62, 954–962. [Google Scholar] [CrossRef]
- Singh, R.; Pal, B.C.; Jabr, R.A. Choice of estimator for distribution system state estimation. IET Gener. Transm. Distrib. 2009, 3, 666–678. [Google Scholar] [CrossRef] [Green Version]
- Neranjan Thilakarathne, N.; Mohan, K.K.; Surekha, L.; Hussain, A. Smart Grid: A Survey of Architectural Elements, Machine Learning and Deep Learning Applications and Future Directions. J. Intell. Syst. Internet Things 2021, 3, 32–42. [Google Scholar] [CrossRef]
- Yan, J.; Tang, B.; He, H. Detection of false data attacks in smart grid with supervised learning. In Proceedings of the 2016 International Joint Conference on Neural Networks (IJCNN), Vancouver, BC, Canada, 24–29 July 2016; pp. 1395–1402. [Google Scholar] [CrossRef]
- Miraftabzadeh, S.M.; Foiadelli, F.; Longo, M.; Pasetti, M. A Survey of Machine Learning Applications for Power System Analytics. In Proceedings of the 2019 IEEE International Conference on Environment and Electrical Engineering and 2019 IEEE Industrial and Commercial Power Systems Europe (EEEIC/I&CPS Europe), Genova, Italy, 11–14 June 2019. [Google Scholar] [CrossRef]
- Yang, H.; Liu, X.; Zhang, D.; Chen, T.; Li, C.; Huang, W. Machine learning for power system protection and control. Electr. J. 2021, 34, 106881. [Google Scholar] [CrossRef]
- Wang, H.; Ma, C.; Zhou, L. A brief review of machine learning and its application. In Proceedings of the 2009 International Conference on Information Engineering and Computer Science, Wuhan, China, 19–20 December 2009; pp. 1–4. [Google Scholar] [CrossRef]
- Alzubi, J.; Nayyar, A.; Kumar, A. Machine Learning from Theory to Algorithms: An Overview. J. Phys. Conf. Ser. 2018, 1142, 012012. [Google Scholar] [CrossRef]
- Batta, M. Machine Learning Algorithms—A Review. Int. J. Sci. Res. 2018, 18, 381–386. [Google Scholar] [CrossRef]
- Jordan, M.I.; Mitchell, T.M. Machine learning: Trends, perspectives, and prospects. Science 2015, 349, 255–260. [Google Scholar]
- Vaish, R.; Dwivedi, U.D.; Tewari, S.; Tripathi, S.M. Machine learning applications in power system fault diagnosis: Research advancements and perspectives. Eng. Appl. Artif. Intell. 2021, 106, 104504. [Google Scholar] [CrossRef]
- Xie, J.; Alvarez-Fernandez, I.; Sun, W. A review of machine learning applications in power system resilience. In Proceedings of the 2020 IEEE Power & Energy Society General Meeting (PESGM), Montreal, QC, Canada, 2–6 August 2020; pp. 1–5. [Google Scholar] [CrossRef]
- Jia, Y.; Kwong, S.; Wang, R. Applying Exponential Family Distribution to Generalized Extreme Learning Machine. IEEE Trans. Syst. Man Cybern. Syst. 2020, 50, 1794–1804. [Google Scholar] [CrossRef]
- Teng, F.; Zhang, Y.; Member, S.; Yang, T. Distributed Optimal Energy Management for We-Energy Considering Operation Security. IEEE Trans. Netw. Sci. Eng. 2023. early access. [Google Scholar] [CrossRef]
- Cui, M.; Member, S.; Wang, J.; Member, S.; Chen, B. Flexible Machine Learning-Based Cyberattack Detection Using Spatiotemporal Patterns for Distribution Systems. IEEE Trans. Smart Grid 2020, 11, 1805–1808. [Google Scholar] [CrossRef]
- Barja-Martinez, S.; Aragüés-Peñalba, M.; Munné-Collado, Í.; Lloret-Gallego, P.; Bullich-Massagué, E.; Villafafila-Robles, R. Artificial intelligence techniques for enabling Big Data services in distribution networks: A review. Renew. Sustain. Energy Rev. 2021, 150, 111459. [Google Scholar] [CrossRef]
- Kumbhar, A.; Dhawale, P.G.; Kumbhar, S.; Patil, U.; Magdum, P. A comprehensive review: Machine learning and its application in integrated power system. Energy Rep. 2021, 7, 5467–5474. [Google Scholar] [CrossRef]
- Matijašević, T.; Antić, T.; Capuder, T. A systematic review of machine learning applications in the operation of smart distribution systems. Energy Rep. 2022, 8, 12379–12407. [Google Scholar] [CrossRef]
- Mohammadi, S.; Hesamzadeh, M.R.; Vafamehr, A.; Ferdowsi, F. A Review of Machine Learning Applications in Electricity Market Studies. In Proceedings of the 2020 3rd International Colloquium on Intelligent Grid Metrology (SMAGRIMET), Cavtat-Dubrovnik, Croatia, 20–23 October 2020; pp. 15–22. [Google Scholar] [CrossRef]
- Foruzan, E.; Scott, S.D.; Lin, J. A comparative study of different machine learning methods for electricity prices forecasting of an electricity market. In Proceedings of the 2015 North American Power Symposium (NAPS), Charlotte, NC, USA, 4–6 October 2015; pp. 1–6. [Google Scholar] [CrossRef]
- Zhang, L.; Wen, J.; Li, Y.; Chen, J.; Ye, Y.; Fu, Y.; Livingood, W. A review of machine learning in building load prediction. Appl. Energy 2021, 285, 116452. [Google Scholar] [CrossRef]
- Ahmad, T.; Chen, H.; Guo, Y.; Wang, J. A comprehensive overview on the data driven and large scale based approaches for forecasting of building energy demand: A review. Energy Build. 2018, 165, 301–320. [Google Scholar] [CrossRef]
- Alimi, O.A.; Ouahada, K.; Abu-Mahfouz, A.M. A Review of Machine Learning Approaches to Power System Security and Stability. IEEE Access 2020, 8, 113512–113531. [Google Scholar] [CrossRef]
- Dhinu Lal, M.; Varadarajan, R. A Review of Machine Learning Approaches in Synchrophasor Technology. IEEE Access 2023, 11, 33520–33541. [Google Scholar] [CrossRef]
- Vijaychandra, J.; Prasad, B.R.V.; Darapureddi, V.K.; Rao, B.V.; Knypiński, Ł. A Review of Distribution System State Estimation Methods and Their Applications in Power Systems. Electronics 2023, 12, 603. [Google Scholar] [CrossRef]
- Xu, J.; Jin, Y.; Zheng, T.; Meng, G. On State Estimation Modeling of Smart Distribution Networks: A Technical Review. Energies 2023, 16, 1891. [Google Scholar] [CrossRef]
- Juneja, P.K.; Belwal, N.; Sunori, S.K.; Khan, F.; Sharma, A.; Pundir, G. A review on application of artificial intelligence techniques in control of industrial processes. Artif. Intell. Speech Technol. 2021, 3, 291–296. [Google Scholar] [CrossRef]
- Chung, S.; Zhang, Y. Artificial Intelligence Applications in Electric Distribution Systems: Post-Pandemic Progress and Prospect. Appl. Sci. 2023, 13, 6937. [Google Scholar] [CrossRef]
- Mololoth, V.K.; Saguna, S.; Åhlund, C. Blockchain and Machine Learning for Future Smart Grids: A Review. Energies 2023, 16, 528. [Google Scholar] [CrossRef]
- Pham, D.T.; Pham, P.T.N. Artificial intelligence in engineering. Int. J. Mach. Tools Manuf. 1999, 39, 937–949. [Google Scholar] [CrossRef]
- Tu, C.; He, X.; Shuai, Z.; Jiang, F. Big data issues in smart grid—A review. Renew. Sustain. Energy Rev. 2017, 79, 1099–1107. [Google Scholar] [CrossRef]
- Hossain, E.; Khan, I.; Un-Noor, F.; Sikander, S.S.; Sunny, M.S.H. Application of Big Data and Machine Learning in Smart Grid, and Associated Security Concerns: A Review. IEEE Access 2019, 7, 13960–13988. [Google Scholar] [CrossRef]
- Ponnusamy, V.K.; Kasinathan, P.; Elavarasan, R.M.; Ramanathan, V.; Anandan, R.K.; Subramaniam, U.; Ghosh, A.; Hossain, E. A comprehensive review on sustainable aspects of big data analytics for the smart grid. Sustainability 2021, 13, 13322. [Google Scholar] [CrossRef]
- Abu-Rub, O.H.; Fard, A.Y.; Umar, M.F.; Hosseinzadehtaher, M.; Shadmands, M.B. Towards intelligent power electronics-dominated grid via machine learning techniques. IEEE Power Electron. Mag. 2021, 8, 28–38. [Google Scholar] [CrossRef]
- Aminifar, F.; Abedini, M.; Amraee, T.; Jafarian, P.; Samimi, M.H.; Shahidehpour, M. A Review of Power System Protection and Asset Management with Machine Learning Techniques; Springer: Berlin/Heidelberg, Germany, 2022; Volume 13. [Google Scholar]
- Ahmed, A.; Khalid, M. A review on the selected applications of forecasting models in renewable power systems. Renew. Sustain. Energy Rev. 2019, 100, 9–21. [Google Scholar] [CrossRef]
- Hwang, J.; Suh, D.; Otto, M.O. Forecasting electricity consumption in commercial buildings using a machine learning approach. Energies 2020, 13, 5885. [Google Scholar] [CrossRef]
- Ray, S. A Quick Review of Machine Learning Algorithms. In Proceedings of the 2019 International Conference on Machine Learning, Big Data, Cloud and Parallel Computing (COMITCon), Faridabad, India, 14–16 February, 2019; pp. 35–39. [Google Scholar] [CrossRef]
- Raschka, S. Model Evaluation, Model Selection, and Algorithm Selection in Machine Learning. arXiv 2018, arXiv:1811.12808. [Google Scholar]
- Salehi, H.; Burgueño, R. Emerging artificial intelligence methods in structural engineering. Eng. Struct. 2018, 171, 170–189. [Google Scholar] [CrossRef]
- Nasteski, V. An overview of the supervised machine learning methods. Horizons B 2017, 4, 51–62. [Google Scholar] [CrossRef]
- Alloghani, M.; Al-Jumeily, D.; Mustafina, J.; Hussain, A.; Aljaaf, A.J. A Systematic Review on Supervised and Unsupervised Machine Learning Algorithms for Data Science; Springer: Berlin/Heidelberg, Germany, 2020. [Google Scholar]
- van Engelen, J.E.; Hoos, H.H. A survey on semi-supervised learning. Mach. Learn. 2020, 109, 373–440. [Google Scholar] [CrossRef] [Green Version]
- Botvinick, M.; Ritter, S.; Wang, J.X.; Kurth-Nelson, Z.; Blundell, C.; Hassabis, D. Reinforcement Learning, Fast and Slow. Trends Cogn. Sci. 2019, 23, 408–422. [Google Scholar] [CrossRef] [Green Version]
- Glorennec, P.Y. Reinforcement Learning: An Overview. In Proceedings of the ESIT 2000, Aachen, Germany, 14–15 September 2000; pp. 17–35. Available online: http://citeseerx.ist.psu.edu/viewdoc/download?doi=10.1.1.9.4135&rep=rep1&type=pdf (accessed on 29 July 2023).
- Salman, R.; Kecman, V. Regression as classification. In Proceedings of the 2012 Proceedings of IEEE Southeastcon, Orlando, FL, USA, 15–18 March 2012; pp. 1–6. [Google Scholar] [CrossRef]
- Su, X.; Yan, X.; Tsai, C.L. Linear regression. Wiley Interdiscip. Rev. Comput. Stat. 2012, 4, 275–294. [Google Scholar] [CrossRef]
- Bangdiwala, S.I. Regression: Simple linear. Int. J. Inj. Contr. Saf. Promot. 2018, 25, 113–115. [Google Scholar] [CrossRef] [PubMed]
- Alexopoulos, E.C. Introduction to Multivariate Regression Analysis. Hippokratia 2005, 14, 23–28. [Google Scholar]
- Smola, A.J.; Schölkopf, B. A tutorial on support vector regression. J. Neuroeng. Rehabil. 2002, 14, 199–222. [Google Scholar] [CrossRef]
- Specht, D.F. A General Regression Neural Network. IEEE Trans. Neural Netw. 1991, 2, 568–576. [Google Scholar] [CrossRef] [PubMed]
- Tax, D.M.J.; Duin, R.P.W. Using two-class classifiers for multiclass classification. In Proceedings of the 2002 International Conference on Pattern Recognition, Quebec City, QC, Canada, 11–15 August 2002; Volume 16, pp. 124–127. [Google Scholar] [CrossRef]
- Tsoumakas, G.; Katakis, I. Multi-Label Classification: An Overview. Database Technol. 2011, 3, 309–319. [Google Scholar] [CrossRef]
- Maalouf, M. Logistic regression in data analysis: An overview. Int. J. Data Anal. Tech. Strateg. 2011, 3, 281–299. [Google Scholar] [CrossRef]
- Wang, G. A survey on training algorithms for support vector machine classifiers. In Proceedings of the 2008 Fourth international conference on networked computing and advanced information management, Gyeongju, Republic of Korea, 2–4 September 2008; Volume 1, pp. 123–128. [Google Scholar] [CrossRef]
- Charbuty, B.; Abdulazeez, A. Classification Based on Decision Tree Algorithm for Machine Learning. J. Appl. Sci. Technol. Trends 2021, 2, 20–28. [Google Scholar] [CrossRef]
- Féraud, R.; Clérot, F. A methodology to explain neural network classication. Neural Netw. 2002, 15, 237–246. Available online: http://ac.els-cdn.com/S0893608001001277/1-s2.0-S0893608001001277-main.pdf?_tid=014dc778-07fe-11e7-bef2-00000aab0f02&acdnat=1489417498_65d78a487ce5847b13d2f7030ab219a4 (accessed on 29 July 2023).
- Sedgwick, P. Simple linear regression. BMJ 2013, 346, f2340. [Google Scholar] [CrossRef] [Green Version]
- Heiberger, R.M.; Neuwirth, E. RExcel: R Through Excel; Springer: Berlin/Heidelberg, Germany, 2009. [Google Scholar]
- Sinha, P. Multivariate Polynomial Regression in Data Mining: Methodology, Problems and Solutions. Int. J. Sci. Eng. Res. 2013, 4, 962–965. Available online: http://www.ijser.org (accessed on 29 July 2023).
- Demaris, A. A Tutorial in Logistic Regression Published by: National Council on Family Relations. J. Marriage Fam. 1995, 57, 956–968. [Google Scholar]
- Scott, A.J.; Hosmer, D.W.; Lemeshow, S. Applied Logistic Regression. Biometrics 1991, 47, 1632. [Google Scholar] [CrossRef]
- Pradhan, A. Support vector machine—A Survey. Int. J. Emerg. Technol. Adv. Eng. 2012, 2, 82–85. [Google Scholar]
- Awad, M.; Khanna, R.; Awad, M.; Khanna, R. Efficient Learning Machines: Theories, Concepts, and Applications for Engineers and System Designers; Apress Open: New York, NY, USA, 2015. [Google Scholar]
- Anand, P.; Rastogi, R.; Chandra, S. A class of new Support Vector Regression models. Appl. Soft Comput. J. 2020, 94, 106446. [Google Scholar] [CrossRef]
- Moguerza, J.M.; Muñoz, A. Support vector machines with applications. Stat. Sci. 2006, 21, 322–336. [Google Scholar] [CrossRef] [Green Version]
- Ghosh, S.; Dasgupta, A.; Swetapadma, A. A study on support vector machine based linear and non-linear pattern classification. In Proceedings of the 2019 International Conference on Intelligent Sustainable Systems (ICISS), Palladam, India, 21–22 February 2019; pp. 24–28. [Google Scholar] [CrossRef]
- Lin, K.M.; Lin, C.J. A study of reduced support vector machines. IEEE Trans. Neural Netw. 2003, 14, 1449–1459. [Google Scholar] [CrossRef] [PubMed]
- Lewis, R.J.; Ph, D.; Street, W.C. An Introduction to Classification and Regression Tree (CART) Analysis. In Proceedings of the 2000 Annual Meeting of the Society for Academic Emergency Medicine, San Francisco, CA, USA, 22–25 May 2000; Available online: http://citeseerx.ist.psu.edu/viewdoc/download?doi=10.1.1.95.4103&rep=rep1&type=pdf (accessed on 29 July 2023).
- Singh Kushwah, J.; Kumar, A.; Patel, S.; Soni, R.; Gawande, A.; Gupta, S. Comparative study of regressor and classifier with decision tree using modern tools. Mater. Today Proc. 2022, 56, 3571–3576. [Google Scholar] [CrossRef]
- de Ville, B. Decision trees. Wiley Interdiscip. Rev. Comput. Stat. 2013, 5, 448–455. [Google Scholar] [CrossRef]
- Anyanwu, M.N.; Shiva, S.G. Comparative Analysis of Serial Decision Tree Classification Algorithms. Int. J. Comput. Sci. Secur. 2009, 3, 230–240. Available online: http://www.cscjournals.org/csc/manuscriptinfo.php?ManuscriptCode=72.73.66.82.82.44.55.49.99 (accessed on 29 July 2023).
- Myles, A.J.; Feudale, R.N.; Liu, Y.; Woody, N.A.; Brown, S.D. An introduction to decision tree modeling. J. Chemom. 2004, 18, 275–285. [Google Scholar] [CrossRef]
- Suzuki, K. Artificial Neural Networks—Methodological Advanced and Biomedical Applications; InTechOpen: London, UK, 2017. [Google Scholar]
- Marius-Constantin, P.; Balas, V.E.; Perescu-Popescu, L.; Mastorakis, N. Multilayer perceptron and neural networks. WSEAS Trans. Circuits Syst. 2009, 8, 579–588. [Google Scholar]
- Canziani, A.; Paszke, A.; Culurciello, E. An Analysis of Deep Neural Network Models for Practical Applications. arXiv 2016, arXiv:1605.07678. [Google Scholar]
- Bianco, S.; Cadene, R.; Celona, L.; Napoletano, P. Benchmark analysis of representative deep neural network architectures. IEEE Access 2018, 6, 64270–64277. [Google Scholar] [CrossRef]
- Sonde, V.M.; Shirpurkar, P.P.; Giripunje, M.S.; Ashtankar, P.P. Deep Learning Techniques: An Overview; Springer: Berlin/Heidelberg, Germany, 2021; Volume 1141. [Google Scholar]
- Massaoudi, M.; Abu-Rub, H.; Refaat, S.S.; Chihi, I.; Oueslati, F.S. Deep Learning in Smart Grid Technology: A Review of Recent Advancements and Future Prospects. IEEE Access 2021, 9, 54558–54578. [Google Scholar] [CrossRef]
- Chen, L.; Li, S.; Bai, Q.; Yang, J.; Jiang, S.; Miao, Y. Review of image classification algorithms based on convolutional neural networks. Remote Sens. 2021, 13, 4712. [Google Scholar] [CrossRef]
- Khodayar, M.; Liu, G.; Wang, J.; Khodayar, M.E. Deep learning in power systems research: A review. CSEE J. Power Energy Syst. 2021, 7, 209–220. [Google Scholar] [CrossRef]
- Neupane, D.; Kim, Y.; Seok, J.; Hong, J. Cnn-based fault detection for smart manufacturing. Appl. Sci. 2021, 11, 11732. [Google Scholar] [CrossRef]
- Torres, J.F.; Hadjout, D.; Sebaa, A.; Martínez-Álvarez, F.; Troncoso, A. Deep learning for time series forecasting: A survey. Big Data 2021, 9, 3–21. [Google Scholar]
- Xue, N.; Triguero, I.; Figueredo, G.P.; Landa-Silva, D. Evolving Deep CNN-LSTMs for Inventory Time Series Prediction. In Proceedings of the 2019 IEEE Congress on Evolutionary Computation (CEC), Wellington, New Zealand, 10–13 June 2019; pp. 1517–1524. [Google Scholar] [CrossRef]
- Hoffmann, F.; Bertram, T.; Mikut, R.; Reischl, M.; Nelles, O. Benchmarking in classification and regression. Wiley Interdiscip. Rev. Data Min. Knowl. Discov. 2019, 9, e1318. [Google Scholar] [CrossRef]
- Hossin, M.; Sulaiman, M.N. A review on evaluation metrics for data classification evaluations. Int. J. Data Min. Knowl. Manag. Process 2015, 5, 1–11. [Google Scholar]
- Tiwary, S.K.; Pal, J.; Chanda, C.K. Multiple-Classification of Power System States Using Multidimensional Neural Network. J. Inst. Eng. Ser. B 2023, 104, 893–900. [Google Scholar] [CrossRef]
- Plevris, V.; Solorzano, G.; Bakas, N.P.; Ben Seghier, M.E.A. Investigation of Performance Metrics in Regression Analysis and Machine Learning-Based Prediction Models. In Proceedings of the 8th European Congress on Computational Methods in Applied Sciences and Engineering (ECCOMAS Congress 2022), Oslo, Norway, 5–9 June 2022; p. 25. [Google Scholar] [CrossRef]
- Nti, I.K.; Teimeh, M.; Nyarko-Boateng, O.; Adekoya, A.F. Electricity load forecasting: A systematic review. J. Electr. Syst. Inf. Technol. 2020, 7, 13. [Google Scholar] [CrossRef]
- Zhao, Y.; Zhang, C.; Zhang, Y.; Wang, Z.; Li, J. A review of data mining technologies in building energy systems: Load prediction, pattern identification, fault detection and diagnosis. Energy Built Environ. 2020, 1, 149–164. [Google Scholar] [CrossRef]
- Gasparin, A.; Lukovic, S.; Alippi, C. Deep learning for time series forecasting: The electric load case. CAAI Trans. Intell. Technol. 2022, 7, 1–25. [Google Scholar] [CrossRef]
- Hong, Y.; Zhou, Y.; Li, Q.; Xu, W.; Zheng, X. A deep learning method for short-term residential load forecasting in smart grid. IEEE Access 2020, 8, 55785–55797. [Google Scholar] [CrossRef]
- Ahmad, A.; Javaid, N.; Mateen, A.; Awais, M.; Khan, Z.A. Short-Term load forecasting in smart grids: An intelligent modular approach. Energies 2019, 12, 164. [Google Scholar] [CrossRef] [Green Version]
- Sevlian, R.; Rajagopal, R. Short Term Electricity Load Forecasting on Varying Levels of Aggregation. arXiv 2014, arXiv:1404.0058. [Google Scholar]
- Dunaieva, I.; Barbotkina, E.; Vecherkov, V.; Popovych, V.; Pashtetsky, V.; Terleev, V.; Nikonorov, A.; Akimov, L. Spatial and temporal databases for decision making and forecasting. In Energy Management of Municipal Transportation Facilities and Transport; Springer International Publishing: Cham, Switzerland, 2019; pp. 198–205. [Google Scholar]
- Pirbazari, A.M.; Farmanbar, M.; Chakravorty, A.; Rong, C. Short-term load forecasting using smart meter data: A generalization analysis. Processes 2020, 8, 484. [Google Scholar] [CrossRef]
- Kim, Y.; Son, H.-G.; Kim, S. Short term electricity load forecasting for institutional buildings. Energy Rep. 2019, 5, 1270–1280. [Google Scholar] [CrossRef]
- Ardakanian, O.; Wong, V.W.S.; Dobbe, R.; Low, S.H.; Von Meier, A.; Tomlin, C.J.; Yuan, Y. On identification of distribution grids. IEEE Trans. Control Netw. Syst. 2019, 6, 950–960. [Google Scholar] [CrossRef] [Green Version]
- Farsi, B.; Amayri, M.; Bouguila, N.; Eicker, U. On short-term load forecasting using machine learning techniques and a novel parallel deep LSTM-CNN approach. IEEE Access 2021, 9, 31191–31212. [Google Scholar] [CrossRef]
- Son, H.; Kim, C. A deep learning approach to forecasting monthly demand for residential-sector electricity. Sustainability 2020, 12, 3103. [Google Scholar] [CrossRef] [Green Version]
- Yazici, I.; Beyca, O.F.; Delen, D. Deep-learning-based short-term electricity load forecasting: A real case application. Eng. Appl. Artif. Intell. 2022, 109, 104645. [Google Scholar] [CrossRef]
- Dong, L.I.U.; Yue, L.I.; Jianping, L.I.N.; Houqiang, L.I.; Feng, W.U. Deep learning-based video coding: A review and a case study. ACM Comput. Surv. 2020, 53, 1–35. [Google Scholar] [CrossRef] [Green Version]
- Dey, R.; Salemt, F.M. Gate-variants of Gated Recurrent Unit (GRU) neural networks. In Proceedings of the 2017 IEEE 60th International Midwest Symposium on Circuits and Systems (MWSCAS), Boston, MA, USA, 6–9 August 2017; pp. 1597–1600. [Google Scholar] [CrossRef] [Green Version]
- Sekhar, C.; Dahiya, R. Robust framework based on hybrid deep learning approach for short term load forecasting of building electricity demand. Energy 2023, 268, 126660. [Google Scholar] [CrossRef]
- Vasenin, D.N.; Makarova, T.V.; Bogatova, T.V.; Semenova, E.E. Methods of day ahead load forecasting on the example of a residential area. J. Phys. Conf. Ser. 2021, 1926, 012007. [Google Scholar] [CrossRef]
- Rezaei, H.; Bozorg-Haddad, O.; Chu, X. Grey wolf optimization (GWO) algorithm. In Advanced Optimization by Nature-Inspired Algorithms; Springer: Berlin/Heidelberg, Germany, 2018; pp. 81–91. [Google Scholar]
- Ozer, I.; Efe, S.B.; Ozbay, H. A combined deep learning application for short term load forecasting. Alex. Eng. J. 2021, 60, 3807–3818. [Google Scholar] [CrossRef]
- Zhuang, F.; Qi, Z.; Duan, K.; Xi, D.; Zhu, Y.; Zhu, H.; Xiong, H.; He, Q. A Comprehensive Survey on Transfer Learning. Proc. IEEE 2021, 109, 43–76. [Google Scholar] [CrossRef]
- Larsen, E.M.; Pinson, P.; Leimgruber, F.; Judex, F. Demand response evaluation and forecasting—Methods and results from the EcoGrid EU experiment. Sustain. Energy Grids Netw. 2017, 10, 75–83. [Google Scholar]
- Beretta, D.; Grillo, S.; Pigoli, D.; Bionda, E.; Bossi, C.; Tornelli, C. Functional principal component analysis as a versatile technique to understand and predict the electric consumption patterns. Sustain. Energy Grids Netw. 2020, 21, 100308. [Google Scholar]
- Tarmanini, C.; Sarma, N.; Gezegin, C.; Ozgonenel, O. Short term load forecasting based on ARIMA and ANN approaches. Energy Rep. 2023, 9, 550–557. [Google Scholar] [CrossRef]
- Mathematics, A. Time series analysis using autoregressive integrated moving average (ARIMA) models. Acad. Emerg. Med. 1998, 5, 39–744. [Google Scholar]
- Guo, W.; Che, L.; Shahidehpour, M.; Wan, X. Machine-Learning based methods in short-term load forecasting. Electr. J. 2021, 34, 106884. [Google Scholar] [CrossRef]
- Segal, M.R. Machine Learning Benchmarks and Random Forest Regression; Center for Bioinformatics and Molecular Biostatistics: San Francisco, CA, USA, 2004. [Google Scholar]
- Shabbir, N.; Ahmadiahangar, R.; Kutt, L.; Rosin, A. Comparison of machine learning based methods for residential load forecasting. In Proceedings of the 2019 Electric Power Quality and Supply Reliability Conference (PQ) & 2019 Symposium on Electrical Engineering and Mechatronics (SEEM), Kärdla, Estonia, 12–15 June 2019; pp. 2–5. [Google Scholar] [CrossRef]
- Khan, S.U.R.; Hayder, I.A.; Habib, M.A.; Ahmad, M.; Mohsin, S.M.; Khan, F.A.; Mustafa, K. Enhanced Machine-Learning Techniques for Medium-Term and Short-Term Electric-Load Forecasting in Smart Grids. Energies 2023, 16, 276. [Google Scholar] [CrossRef]
- Bergstra, J.; Bengio, Y. Random search for hyper-parameter optimization. J. Mach. Learn. Res. 2012, 13, 281–305. [Google Scholar]
- Shahare, K.; Mitra, A.; Naware, D.; Keshri, R.; Suryawanshi, H.M. Performance analysis and comparison of various techniques for short-term load forecasting. Energy Rep. 2023, 9, 799–808. [Google Scholar] [CrossRef]
- Ostertagová, E.; Ostertag, O. Forecasting using simple exponential smoothing method. Acta Electrotech. Inform. 2013, 12, 62–66. [Google Scholar] [CrossRef]
- Cameron, A.C.; Windmeijer, F.A.G. An R-squared measure of goodness of fit for some common nonlinear regression models. J. Econ. 1997, 77, 329–342. [Google Scholar] [CrossRef]
- Kiprijanovska, I.; Stankoski, S.; Ilievski, I.; Jovanovski, S.; Gams, M.; Gjoreski, H. Houseec: Day-ahead household electrical energy consumption forecasting using deep learning. Energies 2020, 13, 2672. [Google Scholar] [CrossRef]
- Chen, K.; Chen, K.; Wang, Q.; He, Z.; Hu, J.; He, J. Short-Term Load Forecasting with Deep Residual Networks. IEEE Trans. Smart Grid 2019, 10, 3943–3952. [Google Scholar] [CrossRef] [Green Version]
- Estebsari, A.; Rajabi, R. Single residential load forecasting using deep learning and image encoding techniques. Electronics 2020, 9, 68. [Google Scholar] [CrossRef] [Green Version]
- De Santo, A.; Ferraro, A.; Galli, A.; Moscato, V.; Sperlì, G. Evaluating time series encoding techniques for Predictive Maintenance. Expert Systems with Applications. Expert Syst. Appl. 2022, 210, 118435. [Google Scholar]
- Ryu, S.; Noh, J.; Kim, H. Deep neural network based demand side short term load forecasting. Energies 2017, 10, 3. [Google Scholar] [CrossRef]
- Hinton, G.E. A practical guide to training restricted Boltzmann machines. In Neural Networks: Tricks of the Trade; Springer: Berlin/Heidelberg, Germany, 2012; pp. 599–619. [Google Scholar]
- Hara, K.; Saito, D.; Shouno, H. Analysis of function of rectified linear unit used in deep learning. In Proceedings of the 2015 International Joint Conference on Neural Networks (IJCNN), Killarney, Ireland, 12–17 July 2015; pp. 1–8. [Google Scholar] [CrossRef]
- Dang-Ha, T.H.; Bianchi, F.M.; Olsson, R. Local short term electricity load forecasting: Automatic approaches. In Proceedings of the 2017 International Joint Conference on Neural Networks (IJCNN), Anchorage, AK, USA, 14–19 May 2017; pp. 4267–4274. [Google Scholar] [CrossRef] [Green Version]
- Kuo, P.H.; Huang, C.J. A high precision artificial neural networks model for short-Term energy load forecasting. Energies 2018, 11, 213. [Google Scholar] [CrossRef] [Green Version]
- Zolfaghari, A.A.; Mirzaee, S.; Gorji, M. Comparison of different models for estimating cumulative infiltration. Int. J. Soil Sci. 2012, 7, 108. [Google Scholar]
- Jiang, H.; Zhang, Y.; Muljadi, E.; Zhang, J.J.; Gao, D.W. A Short-Term and High-Resolution Distribution System Load Forecasting Approach Using Support Vector Regression with Hybrid Parameters Optimization. IEEE Trans. Smart Grid 2018, 9, 3331–3350. [Google Scholar] [CrossRef]
- Gribble, C.P.; Lze, T.; Kensler, A.; Wald, I.; Parker, S.G. A coherent grid traversal approach to visualizing particle-based simulation data. IEEE Trans. Vis. Comput. Graph. 2007, 13, 758–768. [Google Scholar] [CrossRef]
- Marini, F.; Walczak, B. Particle swarm optimization (PSO). A tutorial. Chemom. Intell. Lab. Syst. 2015, 149, 153–165. [Google Scholar] [CrossRef]
- Kumari, R.; Jain, S.K. Effect of Different Activation Function on Short Term Load Forecasting Using Neural Network- A Comparative Study. In Proceedings of the 2019 IEEE Innovative Smart Grid Technologies-Asia (ISGT Asia), Chengdu, China, 21–24 May 2019; pp. 1069–1074. [Google Scholar] [CrossRef]
- Saber, A.Y.; Alam, A.K.M.R. Short term load forecasting using multiple linear regression for big data. In Proceedings of the 2017 IEEE Symposium Series on Computational Intelligence (SSCI), Honolulu, HI, USA, 27 November–1 December 2017; pp. 1–6. [Google Scholar] [CrossRef]
- Venu, B. Multi-core processors—An overview. arXiv 2011, arXiv:1110.3535. [Google Scholar]
- Farrokhabadi, M. Day-ahead electricity demand forecasting: Post-COVID paradigm. IEEE Open Access J. Power Energy 2022, 9, 185–191. [Google Scholar]
- Pecan Street Dataset. Available online: https://www.pecanstreet.org/dataport/ (accessed on 29 July 2023).
- Farajollahi, M.; Shahsavari, A.; Mohsenian-Rad, H. Tracking State Estimation in Distribution Networks Using Distribution-level Synchrophasor Data. In Proceedings of the 2018 IEEE Power & Energy Society General Meeting (PESGM), Portland, OR, USA, 5–10 August 2018; pp. 1–5. [Google Scholar] [CrossRef] [Green Version]
- Watitwa, J.; Awodele, K. A Review on Active Distribution System State Estimation. In Proceedings of the 2019 Southern African Universities Power Engineering Conference/Robotics and Mechatronics/Pattern Recognition Association of South Africa (SAUPEC/RobMech/PRASA), Bloemfontein, South Africa, 28–30 January 2019; pp. 726–731. [Google Scholar] [CrossRef]
- Sarada Devi, M.S.N.G.; Yesuratnam, G. Comparison of State Estimation Process on Transmission and Distribution Systems; Springer International Publishing: Cham, Switzerland, 2020. [Google Scholar]
- Sanchez Cifuentes, A.F. Enhancing the Observability of Distribution Systems State Estimation. 2019, p. 51. Available online: https://fsu.digital.flvc.org/islandora/object/fsu%3A722569#tabs-1 (accessed on 29 July 2023).
- Hayes, B.; Prodanović, M. State estimation techniques for electric power distribution systems. In Proceedings of the 2014 European Modelling Symposium, Pisa, Italy, 21–23 October 2014; pp. 303–308. [Google Scholar] [CrossRef]
- Majdoub, M.; Belfqih, A.; Boukherouaa, J.; Sabri, O.; Cheddadi, B.; Haidi, T. A review on distribution system state estimation techniques. In Proceedings of the 2018 6th International Renewable and Sustainable Energy Conference (IRSEC), Rabat, Morocco, 5–8 December 2018; pp. 1–6. [Google Scholar] [CrossRef]
- Wang, G.; Giannakis, G.B.; Chen, J.; Sun, J. Distribution system state estimation: An overview. Front. Inf. Technol. Electron. 2019, 20, 4–17. [Google Scholar] [CrossRef]
- Radhoush, S.; Vannoy, T.; Whitaker, B.M.; Nehrir, H. Random Forest Meta Learner for Generating Pseudo-Measurements in Active Distribution Power Networks. In Proceedings of the 2023 IEEE Power & Energy Society Innovative Smart Grid Technologies Conference (ISGT), Washington, DC, USA, 16–19 January 2023; pp. 1–5. [Google Scholar] [CrossRef]
- Radhoush, S.; Bahramipanah, M.; Nehrir, H.; Shahooei, Z. A Review on State Estimation Techniques in Active Distribution Networks: Existing Practices and Their Challenges. Sustainability 2022, 14, 2520. [Google Scholar] [CrossRef]
- Alimardani, A.; Therrien, F.; Atanackovic, D.; Jatskevich, J.; Vaahedi, E. Distribution System State Estimation Based on Nonsynchronized Smart Meters. IEEE Trans. Smart Grid 2015, 6, 2919–2928. [Google Scholar] [CrossRef]
- Gao, Y.; Yu, N. State estimation for unbalanced electric power distribution systems using AMI data. In Proceedings of the 2017 IEEE Power & Energy Society Innovative Smart Grid Technologies Conference (ISGT), Washington, DC, USA, 23–26 April 2017; pp. 1–5. [Google Scholar] [CrossRef] [Green Version]
- Kong, X.; Chen, Y.; Xu, T.; Wang, C.; Yong, C.; Li, P.; Yu, L. A hybrid state estimator based on SCADA and PMU measurements for medium voltage distribution system. Appl. Sci. 2018, 8, 1527. [Google Scholar] [CrossRef] [Green Version]
- Pau, M.; Pegoraro, P.A.; Sulis, S. WLS distribution system state estimator based on voltages or branch-currents: Accuracy and performance comparison. In Proceedings of the 2013 IEEE International Instrumentation and Measurement Technology Conference (I2MTC), Minneapolis, MN, USA, 6–9 May 2013; pp. 493–498. [Google Scholar] [CrossRef]
- Baran, M.E.; Jung, J.; McDermott, T.E. Including voltage measurements in branch current state estimation for distribution systems. In Proceedings of the 2009 IEEE Power & Energy Society General Meeting, Calgary, AB, Canada, 26–30 July 2009; pp. 1–5. [Google Scholar] [CrossRef]
- Fotopoulou, M.; Petridis, S.; Karachalios, I.; Rakopoulos, D. A Review on Distribution System State Estimation Algorithms. Appl. Sci. 2022, 12, 11073. [Google Scholar] [CrossRef]
- Commerell, W. The Grid of the Future. In Sustainable Energy Solutions for Remote Areas in the Tropics; Springer International Publishing: Cham, Switzerland, 2020; pp. 239–269. [Google Scholar] [CrossRef]
- Ehsan, A.; Yang, Q. State-of-the-art techniques for modelling of uncertainties in active distribution network planning: A review. Appl. Energy 2019, 239, 1509–1523. [Google Scholar] [CrossRef]
- Wuest, T.; Weimer, D.; Irgens, C.; Thoben, K.D. Machine learning in manufacturing: Advantages, challenges, and applications. Prod. Manuf. Res. 2016, 4, 23–45. [Google Scholar] [CrossRef] [Green Version]
- Rajora, G.L.; Sanz-Bobi, M.A.; Domingo, C.M. Application of Machine Learning Methods for Asset Management on Power Distribution Networks. Emerg. Sci. J. 2022, 6, 905–920. [Google Scholar] [CrossRef]
- Azimian, B.; Biswas, R.S.; Moshtagh, S.; Pal, A.; Tong, L.; Dasarathy, G. State and Topology Estimation for Unobservable Distribution Systems Using Deep Neural Networks. IEEE Trans. Instrum. Meas. 2022, 71, 9003514. [Google Scholar] [CrossRef]
- Menke, J.H.; Bornhorst, N.; Braun, M. Distribution system monitoring for smart power grids with distributed generation using artificial neural networks. Int. J. Electr. Power Energy Syst. 2019, 113, 472–480. [Google Scholar] [CrossRef] [Green Version]
- Tran, M.Q.; Zamzam, A.S.; Nguyen, P.H. Enhancement of Distribution System State Estimation Using Pruned Physics-Aware Neural Networks. In Proceedings of the 2021 IEEE Madrid PowerTech, Madrid, Spain, 28 June–2 July 2021. [Google Scholar] [CrossRef]
- Zargar, B.; Ponci, F.; Monti, A. Evaluation of Computational Complexity for Distribution Systems State Estimation. IEEE Trans. Instrum. Meas. 2023, 72, 9001512. [Google Scholar] [CrossRef]
- Andrysco, M.; Nötzli, A.; Brown, F.; Jhala, R.; Stefan, D. Towards verified, constant-time floating point operations. In Proceedings of the 2018 ACM SIGSAC Conference on Computer and Communications Security, Toronto, ON, Canada, 15–19 October 2018; pp. 1369–1382. [Google Scholar] [CrossRef] [Green Version]
- Dinda, P.A. Online prediction of the running time of tasks. In Proceedings of the 2001 ACM SIGMETRICS International Conference on Measurement and Modeling of Computer Systems, Cambridge, MA, USA, 16–20 June 2001; pp. 383–394. [Google Scholar] [CrossRef] [Green Version]
- Zargar, B.; Angioni, A.; Ponci, F.; Monti, A. Multiarea Parallel Data-Driven Three-Phase Distribution System State Estimation Using Synchrophasor Measurements. IEEE Trans. Instrum. Meas. 2020, 69, 6186–6202. [Google Scholar] [CrossRef]
- Chen, S.; Wei, Z.; Sun, G.; Lu, N.; Sun, Y.; Zhu, Y. Multi-area distributed three-phase state estimation for unbalanced active distribution networks. J. Mod. Power Syst. Clean Energy 2017, 5, 767–776. [Google Scholar] [CrossRef] [Green Version]
- Muscas, C.; Pau, M.; Pegoraro, P.A.; Sulis, S.; Ponci, F.; Monti, A. Multiarea distribution system state estimation. IEEE Trans. Instrum. Meas. 2015, 64, 1140–1148. [Google Scholar] [CrossRef]
- Ferdowsi, M.; Benigni, A.; Lowen, A.; Zargar, B.; Monti, A.; Ponci, F. A scalable data-driven monitoring approach for distribution systems. IEEE Trans. Instrum. Meas. 2015, 64, 1292–1305. [Google Scholar] [CrossRef]
- Jin, X.B.; Jeremiah, R.J.R.; Su, T.L.; Bai, Y.T.; Kong, J.L. The new trend of state estimation: From model-driven to hybrid-driven methods. Sensors 2021, 21, 2085. [Google Scholar] [CrossRef] [PubMed]
- Huang, M.; Wei, Z.; Sun, G.; Zang, H. Hybrid State Estimation for Distribution Systems With AMI and SCADA Measurements. IEEE Access 2019, 7, 120350–120359. [Google Scholar] [CrossRef]
- Mestav, K.R.; Luengo-Rozas, J.; Tong, L. Bayesian State Estimation for Unobservable Distribution Systems via Deep Learning. IEEE Trans. Power Syst. 2019, 34, 4910–4920. [Google Scholar] [CrossRef] [Green Version]
- Zamzam, A.S.; Fu, X.; Sidiropoulos, N.D. Data-Driven Learning-Based Optimization for Distribution System State Estimation. IEEE Trans. Power Syst. 2019, 34, 4796–4805. [Google Scholar] [CrossRef] [Green Version]
- Li, X.; Scaglione, A.; Chang, T.H. A framework for phasor measurement placement in hybrid state estimation via Gauss-Newton. IEEE Trans. Power Syst. 2014, 29, 824–832. [Google Scholar] [CrossRef] [Green Version]
- Wang, W.; Yu, N.; Rahmatian, F.; Pandey, S. Where to Install Distribution Phasor Measurement Units to Obtain Accurate State Estimation Results? In Proceedings of the 2022 IEEE Power & Energy Society General Meeting (PESGM), Denver, CO, USA, 17–21 July 2022; pp. 1–5. [Google Scholar] [CrossRef]
- Ahmad, F.; Tariq, M.; Farooq, A. A novel ANN-based distribution network state estimator. Int. J. Electr. Power Energy Syst. 2019, 107, 200–212. [Google Scholar] [CrossRef]
- CIGRE Technical. Benchmark Systems for Network Integration of Renewable and Distributed Energy Resources; CIGRE Technical: Paris, France, 2014; Volume 6. [Google Scholar]
- Ma, Y.; Liu, F.; Zhou, X.; Gao, Z. Key technologies of smart distribution grid. In Proceedings of the 2016 IEEE International Conference on Mechatronics and Automation, Harbin, China, 7–10 August 2016; pp. 2639–2643. [Google Scholar] [CrossRef]
- Kelley, A.W. State estimation for real-time monitoring of distribution systems. IEEE Trans. Power Syst. 1994, 9, 1601–1609. [Google Scholar]
- Fang, X.; Misra, S.; Xue, G.; Yang, D. Smart grid—The new and improved power grid: A survey. IEEE Commun. Surv. Tutor. 2012, 14, 944–980. [Google Scholar] [CrossRef]
- Salkuti, S.R. Challenges, issues and opportunities for the development of smart grid. Int. J. Electr. Comput. Eng. 2020, 10, 1179–1186. [Google Scholar] [CrossRef]
- Liu, X.; Li, Z. False data attack models, impact analyses and defense strategies in the electricity grid. Electr. J. 2017, 30, 35–42. [Google Scholar] [CrossRef]
- Sayghe, A.; Hu, Y.; Zografopoulos, I.; Liu, X.R.; Dutta, R.G.; Jin, Y.; Konstantinou, C. Survey of machine learning methods for detecting false data injection attacks in power systems. IET Smart Grid 2020, 3, 581–595. [Google Scholar] [CrossRef]
- Liu, Y.; Ning, P.; Reiter, M.K. False data injection attacks against state estimation in electric power grids. ACM Trans. Inf. Syst. Secur. 2011, 14, 1–13. [Google Scholar] [CrossRef]
- Reda, H.T.; Anwar, A.; Mahmood, A. Comprehensive survey and taxonomies of false data injection attacks in smart grids: Attack models, targets, and impacts. Renew. Sustain. Energy Rev. 2022, 163, 112423. [Google Scholar] [CrossRef]
- Deng, R.; Xiao, G.; Lu, R.; Liang, H.; Vasilakos, A.V. False data injection on state estimation in power systems-attacks, impacts, and defense: A survey. IEEE Trans. Ind. Inform. 2017, 13, 411–423. [Google Scholar] [CrossRef]
- Huang, Y.; Esmalifalak, M.; Nguyen, H.; Zheng, R.; Han, Z.; Li, H.; Song, L. Bad data injection in smart grid: Attack and defense mechanisms. IEEE Commun. Mag. 2013, 51, 27–33. [Google Scholar] [CrossRef]
- Musleh, A.S.; Chen, G.; Dong, Z.Y. A Survey on the Detection Algorithms for False Data Injection Attacks in Smart Grids. IEEE Trans. Smart Grid 2020, 11, 2218–2234. [Google Scholar] [CrossRef]
- Bhusal, N.; Gautam, M.; Benidris, M. Detection of Cyber Attacks on Voltage Regulation in Distribution Systems Using Machine Learning. IEEE Access 2021, 9, 40402–40416. [Google Scholar] [CrossRef]
- Radhoush, S.; Vannoy, T.; Liyanage, K.; Whitaker, B.M.; Nehrir, H. Distribution System State Estimation and False Data Injection Attack Detection with a Multi-Output Deep Neural Network. Energies 2023, 16, 2288. [Google Scholar] [CrossRef]
- Ganjkhani, M.; Gilanifar, M.; Giraldo, J.; Parvania, M. Integrated Cyber and Physical Anomaly Location and Classification in Power Distribution Systems. IEEE Trans. Ind. Inform. 2021, 17, 7040–7049. [Google Scholar] [CrossRef]
- Naderi, E.; Aydeger, A.; Asrari, A. Detection of False Data Injection Cyberattacks Targeting Smart Transmission/Distribution Networks. In Proceedings of the 2022 IEEE Conference on Technologies for Sustainability (SusTech), Corona, CA, USA, 21–23 April 2022; pp. 224–229. [Google Scholar] [CrossRef]
- Sapna, S. Backpropagation Learning Algorithm Based on Levenberg Marquardt Algorithm. Comput. Sci. Inf. Technol. 2012, 2, 393–398. [Google Scholar] [CrossRef]
- Kamal, M.; Shahsavari, A.; Mohsenian-Rad, H. Poisoning Attack against Event Classification in Distribution Synchrophasor Measurements. In Proceedings of the 2021 IEEE International Conference on Communications, Control, and Computing Technologies for Smart Grids (SmartGridComm), Aachen, Germany, 25 October 2021; pp. 327–332. [Google Scholar] [CrossRef]
- Grando, F.L.; Lazzaretti, A.E.; Moreto, M. The Impact of PMU Data Precision and Accuracy on Event Classification in Distribution Systems. IEEE Trans. Smart Grid 2022, 13, 1372–1382. [Google Scholar] [CrossRef]
- Seidl, T. Nearest Neighbor Classification. Encycl. Database Syst. 2009, 1, 1885–1890. [Google Scholar] [CrossRef]
- Karaca, Y.; Cattani, C. Naive Bayesian classifier. Comput. Methods Data Anal. 2018, 229–250. [Google Scholar] [CrossRef]
- Dietterich, T.G. Oregon Ensemble methods in machine learning. In Multiple Classifier Systems. MCS 2000. Lecture Notes in Computer Science; Springer: Berlin/Heidelberg, Germany, 2000; Volume 1857, pp. 1–15. [Google Scholar]
Figure 1.
Smart grid architecture—including power generation; transmission and distribution grids; and power storage and consumers—are all connected via two-way communication.
Figure 1.
Smart grid architecture—including power generation; transmission and distribution grids; and power storage and consumers—are all connected via two-way communication.

Figure 2.
Visual representation of four ML categories: supervised, unsupervised, semi-supervised, and reinforcement learning.
Figure 2.
Visual representation of four ML categories: supervised, unsupervised, semi-supervised, and reinforcement learning.

Figure 3.
Different SML techniques, categorized by regression and classification.

Figure 4.
Linear and polynomial (2nd order) regression models for 1-dimensional inputs.

Figure 5.
Logistic regression model. Blue and orange dots represent data samples from distinct classes.
Figure 5.
Logistic regression model. Blue and orange dots represent data samples from distinct classes.

Figure 6.
(a) Support vector regressor; (b) support vector classification.

Figure 7.
Decision tree algorithm.

Figure 8.
(a) A single-layer perceptron; (b) a multi-layer perceptron (DNN).

Figure 9.
Electric load forecasting time horizons and dependent factors in load forecasting.


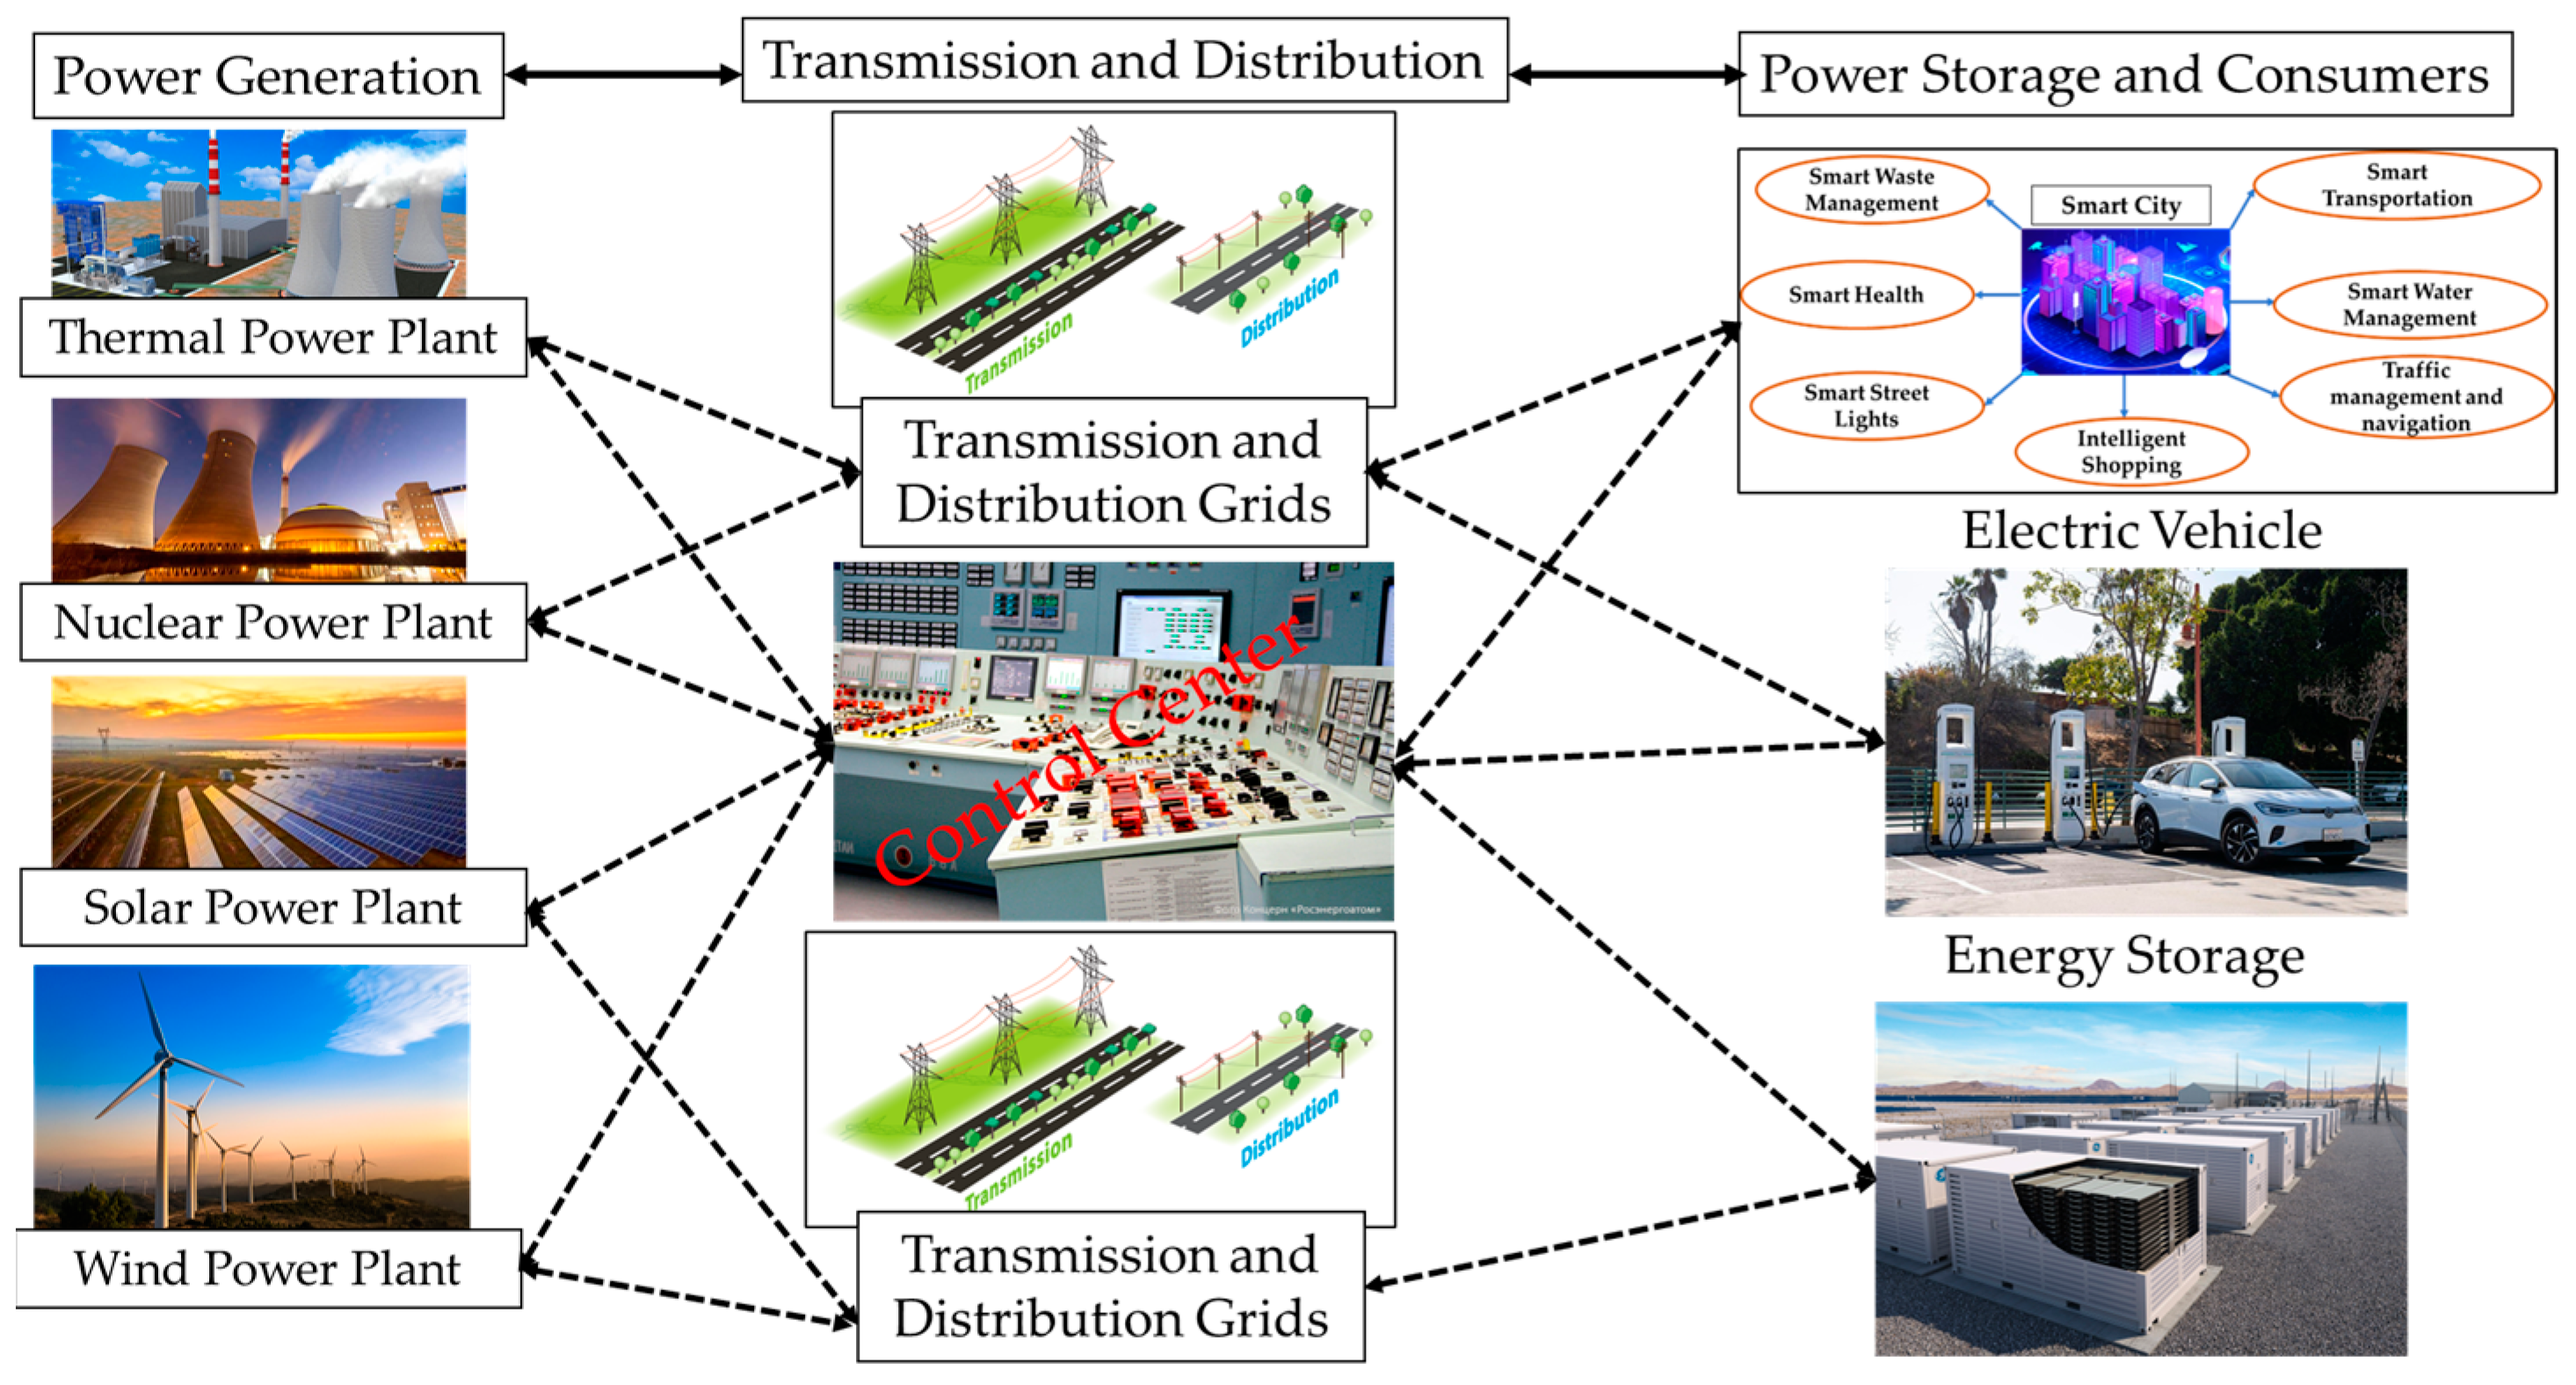
Table 1.
Review papers of STLF using SML techniques.
| References | Method | Used Dataset (s) |
|---|---|---|
| [151] | 1-D CNN | Hourly load consumption as well as corresponding temperature data for Istanbul, Turkey, between 2015 and 2017. |
| [154] | Hybrid Method (GWO-CNN-BiLSTM) | College, Hospital, Residential, and Industrial buildings from Kaggle and Mendeley datasets with different time scales. |
| [157] | LSTM-DNN | Townhome, single family, home, and apartment buildings which are collected from ENTES MPR47S (Istanbul) with 15 min resolution. |
| [161] | ANN | 709 individual residential buildings which are obtained from Irish Social Science Data Archive (ISSDA) |
| [163] | Fusion algorithm (SVR + RF + LSTM) | 5760 samples with 15 min resolution |
| [165] | SVR-DTR-LR | Estonian household data |
| [166] | ESVM and ECNN | Electricity data from the ISO/NE electricity market data |
| [168] | SVR, CNN, ANN, LSTM, and hybrid CNN-LSTM | Ref. [187] and datasets from Bornholm Island, Denmark |
| [171] | DRNN | Pecan Street dataset (four years of data) [188] |
| [173] | Time series image encoding technique + CNN | A single residential customer dataset from December 2006 to November 2010 (2,075,259 samples) in Paris, France |
| [175] | DNN | Different industrial load profiles including industrial section (retail business, R&D service, health care center, manufacturing industries) |
| [179] | Deep Energy Structure | USA district public consumption dataset |
| [181] | SVR | Load dataset for 80 days (20 samples for each season) with 1 s sample rate. |
| [184] | ANN | RTE France Electricity Consumption |
| [185] | MLR | Three years load data with 1 h sample rate |
Table 2.
Review papers of DSSE using SML techniques.
| Reference | Method | Case Study |
|---|---|---|
| [208] | DNN | A radial 34-bus system with 3 PVs and A meshed 240-node distribution network. |
| [209] | ANN | CIGRE MV distribution grid [225] and A real distribution grid in Germany (135-node) |
| [210] | ANN | 123-bus distribution test system |
| [211] | ANN | 15-bus, 30-bus, 60-bus, and 123-bus distribution system |
| [214] | ANN | Unbalanced 123-bus distribution system |
| [217] | ANN | European distribution system (a LV and a MV distribution grid) |
| [219] | Hybrid method (DNN + WLAV) | 33-bus distribution network |
| [220] | Distribution learning + regression + DNN | 85-bus radial network and 3120-bus meshed network (Polish network) |
| [221] | ANN | IEEE-37 distribution feeder with 6 DGs |
| [223] | ANN | A modified IEEE 37-bus distribution system |
| [224] | ANN | 33-bus, 69-bus distribution network and a real 48-bus Danish network |
Disclaimer/Publisher’s Note: The statements, opinions and data contained in all publications are solely those of the individual author(s) and contributor(s) and not of MDPI and/or the editor(s). MDPI and/or the editor(s) disclaim responsibility for any injury to people or property resulting from any ideas, methods, instructions or products referred to in the content. |
© 2023 by the authors. Licensee MDPI, Basel, Switzerland. This article is an open access article distributed under the terms and conditions of the Creative Commons Attribution (CC BY) license (https://creativecommons.org/licenses/by/4.0/).
Share and Cite
MDPI and ACS Style
Radhoush, S.; Whitaker, B.M.; Nehrir, H. An Overview of Supervised Machine Learning Approaches for Applications in Active Distribution Networks. Energies 2023, 16, 5972. https://doi.org/10.3390/en16165972
AMA Style
Radhoush S, Whitaker BM, Nehrir H. An Overview of Supervised Machine Learning Approaches for Applications in Active Distribution Networks. Energies. 2023; 16(16):5972. https://doi.org/10.3390/en16165972
Chicago/Turabian StyleRadhoush, Sepideh, Bradley M. Whitaker, and Hashem Nehrir. 2023. "An Overview of Supervised Machine Learning Approaches for Applications in Active Distribution Networks" Energies 16, no. 16: 5972. https://doi.org/10.3390/en16165972
Note that from the first issue of 2016, this journal uses article numbers instead of page numbers. See further details here.