
Osmotic Membrane Distillation Crystallization of NaHCO3
by
 , , and
Mar Garcia Alvarez
1,2,* ,
,
Vida Sang Sefidi
1,2,*,
Marine Beguin
1,
Alexandre Collet
1,
Raul Bahamonde Soria
1,3 and
Patricia Luis
1,2,* 1
Materials & Process Engineering (iMMC-IMAP), UCLouvain, Place Sainte Barbe 2, B-1348 Louvain-la-Neuve, Belgium
2
Research & Innovation Centre for Process Engineering (ReCIPE), Place Sainte Barbe, 2 bte L5.02.02, B-1348 Louvain-la-Neuve, Belgium
3
Renewable Energy Laboratory, Chemical Sciences Faculty, Universidad Central del Ecuador, Quito 170129, Ecuador
*
Authors to whom correspondence should be addressed.
Energies 2022, 15(7), 2682; https://doi.org/10.3390/en15072682
Submission received: 28 February 2022
/
Revised: 28 March 2022
/
Accepted: 28 March 2022
/
Published: 6 April 2022
(This article belongs to the Special Issue Thermal Performance of Membrane Distillation)
Abstract
:A new crystallization process for sodium bicarbonate (NaHCO3) was studied, proposing the use of osmotic membrane distillation crystallization. Crystallization takes place due to the saturation of the feed solution after water evaporation on the feed side, permeating through the membrane pores to the osmotic side. The process operational parameters, i.e., feed and osmotic velocities, feed concentration, and temperature were studied to determine the optimal operating conditions. Regarding the feed and osmotic velocities, values of 0.038 and 0.0101 m/s, respectively, showed the highest transmembrane flux, i.e., 4.4 × 10⁻⁸ m3/m2·s. Moreover, study of the temperature variation illustrated that higher temperatures have a positive effect on the size and purity of the obtained crystals. The purity of the crystals obtained varied from 96.4 to 100% In addition, the flux changed from 2 × 10⁻⁸ to 7 × 10⁻⁸ m3/m2·s with an increase in temperature from 15 to 40 °C. However, due to heat exchange between the feed and the osmotic solutions, the energy loss in osmotic membrane distillation crystallization is higher at higher temperatures.
1. Introduction
Climate change is redirecting global objectives to regulate greenhouse gas emissions. Industry accounts for 21% of these emissions [1] Thus, in order to minimize waste production and its effect on the environment, the design of more efficient processes is required. Many industrial sectors are already focused on lower energy consumption, such as the pharmaceutical industry, food industry, fine chemicals industry, and construction. However, some of their processes are still far from sustainable [2,3]. That is the case for crystallization, a separation technique for producing or purifying solid products from a supersaturated solution. Crystals have high stability, are easy to store, and have a long life. For these reasons, there is an immense requirement for their production from industry [4].
On a larger scale, several principles are used to form crystals, such as cooling of the feed solution, evaporation of the solvent, and anti-solvent techniques. The conventional equipment for performing crystallization is a batch stirred tank, which has several drawbacks. Firstly, the conventional crystallizer cannot provide crystalline solid products of sufficient morphological quality (size, shape, and crystal size distribution), structure (polymorphism), and purity [5]. Secondly, there are some reproducibility issues such as imperfect mixing, where the solution is not homogeneous, and the supersaturation control is limited. Moreover, the points at which crystallization can be performed vary from one batch to another. Furthermore, a great deal of energy is needed either to heat/cool the solution in a conventional evaporator or to power vacuum systems, which are not efficient [6].
In addition, the stirred tank mostly operates as a batch reactor, meaning that the process is not continuous and has to be stopped to recover the products. It would be more convenient and energetically more efficient to use a continuous process [5,7,8,9]. As conventional crystallizers have many inconveniences, research has been conducted to find alternatives allowing better control and performance during the crystallization process, and membrane distillation crystallization is one of these alternatives [4].
Osmotic membrane distillation crystallization (OMDC) is an innovative technique in which two liquids are brought into contact through a non-selective hydrophobic microporous membrane [10]. Because the concentration is not the same on both sides, this induces a water activity difference and leads to the evaporation of water from the feed to the osmotic side. Thus, the driving force is the vapor pressure gradient created by the water activity difference between the two sides of the membrane. Figure 1 depicts the mass transfer profile for the OMDC system [7,8].
OMDC has advantages over conventional distillation and crystallization processes. This technique has a very high specific contact area, promoting higher mass transfer with more compact equipment than in conventional crystallization or distillation. The main advantage of OMDC is lower energy consumption [11,12]. As the driving force is created through the partial pressure gradient, no additional pressure is required, which allows equipment costs to be reduced and process safety to be increased in comparison with pressure-driven processes. Residual heat or renewable energy can also be used, if available, which could reduce the overall cost and environmental impact [12,13,14]. Another benefit of OMDC is the use of polymer materials in the equipment, which decreases or even avoids erosion problems [4,5,6,7].
OMDC is presented as an alternative option for crystallizing sodium bicarbonate (NaHCO3). NaHCO3 is a salt obtained from a reaction between soda ash and carbon dioxide (CO2) [15,16]. NaHCO3 is used in various industries such as food, pharmaceuticals, agriculture, etc. However, the purity and the morphology of the obtained crystals play an important role in where the NaHCO3 salts can be used. To crystallize NaHCO3 in a conventional crystallizer, CO2 must be introduced to the tank atmosphere as NaHCO3, which can easily be converted to CO2 by heat or stirring [15]. Shifeng Jiang also studied the crystallization of NaHCO3 using a cooling crystallizer to generate more NaHCO3 crystals [17]. However, when using OMDC technology to crystallize NaHCO3, there is no need for the constant addition of CO2. Moreover, as the solution is not heated, less NaHCO3 is converted to CO2, which is the main advantage of OMDC for crystallizing NaHCO3. To the best of our knowledge, no studies have been performed on the crystallization of NaHCO3 using membrane distillation crystallization. However, OMDC has been used for other materials. Israel Ruiz Salmon et al. studied OMDC for the crystallization of sodium carbonate. It was observed that in OMDC, the main resistance was the membrane itself, and the process suffered from concentration polarization and possible wetting [18].
In this study, the main objective was to optimize the OMDC system for the crystallization of NaHCO3. Several operational parameters such as the feed and osmotic velocities, the effect of feed concentration, and the feed temperature were studied. Moreover, the purity, shape, and size of the crystals were analyzed using X-ray diffraction (XRD) and scanning electron microscopy (SEM).
2. Materials and Methods
2.1. Chemicals
The feed solution for each experiment was produced by dissolving NaHCO3 salt (sodium bicarbonate, ≥99.7%, AnalaR NORMAPUR, Leuven, Belgium) in ultrapure water, and the osmotic solution was obtained by dissolving sodium chloride (NaCl) (sodium chloride, ≥99.9%, AnalaR NORMAPUR, Leuven, Belgium) up to the maximum solubility in ultrapure water.
2.2. Equipment
Figure 2 shows the scheme for the distillation/crystallization setup. The membrane contactor used to carry out experiments was a 3MTM Liqui-CelTM MM-1 × 5.5 Series Membrane Contactor. The characteristics of the membrane are given in Table 1. The feed and osmotic solution were in contact with a countercurrent flow. The feed solution flowed on the lumen side and the osmotic solution was on the shell side. The weight of the feed reservoir was measured constantly using a balance (LP 4202I, VWR, Milano, Italy), and is used in Equation (1) for calculating the transmembrane flux and in Equation (2) for the mass transfer coefficient calculation. The feed solution was always kept in a closed-cap container. The feed and osmotic solutions were kept at room temperature for most experiments, except for the temperature study, in which a cooler (Corio CD-900F, Julabo, Seelbach, Germany) and a water bath (VWB2 12L, VWR, Poole, UK) were used to change the temperature in the range of 15 to 40 °C. The temperature was measured using thermocouple thermometers (2000, TME, Birmingham, UK).
Scanning electron microscopy (SEM) (GEMINI, Zeiss, Ultra 55) was used to observe the NaHCO3 crystals produced at different feed temperatures. The SEM images studied were taken at 500× magnification with a signal A = E2.
X-ray diffraction (XRD) (Bruker, AXS D8 ADVANCE) was used to determine whether the feed temperature altered the crystal purity. First, a metal sputter deposition system (CEA030, Balzers, Liechtenstein) was used to coat the surface with a thin gold layer to produce a conductive surface. Subsequently, the analyses were performed with a LYNXEYE detector, with a 2Theta from 20° to 100°.
2.3. Overall Mass Transfer Coefficient and Transmembrane Flux Calculation
Two parameters allow characterization of the operating conditions of the membrane system, namely, the transmembrane flux (J, m3/m2·s) and the overall mass transfer coefficient (Kov, m3/m2·Pa.s). J was calculated by measuring the weight of the feed tank over time and recorded in intervals of 20 min. The flux shown in the figures is an average of the fluxes during the experiment, calculated by Equation (1) [12,19,20].
In this equation, p* and a are the vapor pressure and the activity coefficient of the feed (f) and osmotic (o) sides, respectively, which were computed following the procedure described by Hamer et al. [21] and by Sandler [22] when the values of the osmotic coefficients were not found in the literature [23]. The vapor pressure (mmHg) was calculated using Antoine’s equation, with the temperature T given in °C:
where aw is the sum of the ions of the electrolyte (−), Mm is the molar mass of water (kg/mol), M is the molality (mol/kg), and aw is the water activity.
3. Results and Discussion
3.1. Influence of the Fluid Dynamics
Improving the mass transfer is the key to having a lower required contact area and reducing capital costs. There are three resistances to mass transfer in the OMDC system: the feed boundary layer, the membrane, and the osmotic boundary layer. An increment in the velocity has a positive effect on reducing the lumen- and shell-side boundary resistances and increasing Kov. Figure 3 and Figure 4 show the flux and Kov versus the change in the osmotic/feed velocities, respectively, while the velocity at the other side was set at a constant value. In addition to the boundary resistances, membrane crystallization is significantly affected by the phenomenon of concentration polarization (e.g., when the concentration of the salt is higher on the surface of the membrane), and therefore higher velocities in the membrane are more suitable, since they result in higher turbulence and thus better mixing of the solution in the membrane contactor. However, it can be observed in Figure 3a that overall, the feed velocity presents a maximum flux at 0.04 m/s when the osmotic solution operates at 0.01 m/s. At higher velocities of the feed solution, there is a decrease in flux. This decrease might be because of partial wetting of the membrane pores. As previously reported [17], wetting of the pores results in a lower flux and a higher resistance to mass transfer. In Figure 3b, with increasing feed velocity, Kov decreases slightly, reinforcing the idea of potential membrane wetting. The error bars for the feed flow rate of 0.01 m/s are around 13%. Regarding the osmotic velocity, Kov increases slightly when a higher velocity is used, which is an indication of more turbulence on the osmotic side and lower resistance to mass transfer. It can be observed in Figure 4a that in general, there is a rise in flux with an increase in the osmotic velocity. The maximum flux was observed at an osmotic velocity of 0.01 m/s. In Figure 4b, Kov increases when the feed flow rate is higher, to overcome the resistance in the osmotic boundary layer. However, there is a drop after 0.015 m/s due to possible membrane wetting. It can be concluded that the effect of the osmotic flow rate is higher than that of the feed flow rate, and it is more favorable to have a higher osmotic flow rate than a lower feed flow rate to avoid membrane wetting.
Another set of experiments was performed to check whether there was total membrane wetting. This would be the case if NaCl was found in the feed solution. Ultrapure water was placed in the feed container, and the conductivity of the feed was measured over time with a conductivity meter. It was concluded that there was a high mass transfer of NaCl salts to the feed container at high velocity. For example, when the feed and osmotic velocities were 0.078 and 0.02 m/s, respectively, the conductivity of the ultrapure water changed from 13 μS/cm to 32 mS/cm within 2 h. This also confirms the hypothesis of partial membrane wetting at higher flow rates. Thus, velocities of 0.038 m/s (200 mL/min) for the feed side and 0.01 m/s (~200 mL/min) for the osmotic side were chosen as the optimal conditions, leading to a high Kov without significant membrane wetting. These velocities were set as constant values for the rest of the experiments described in the following sections.
3.2. Influence of the Feed Concentration
Figure 5 shows the flux and Kov versus the change in NaHCO3 concentration. The average flux decreases with an increase in concentration. This is due to a decrease in the driving force. In osmotic membrane crystallization, the driving force for water evaporation is the vapor pressure difference between the two sides of the membrane, which is influenced by the water activity. To promote flux, the driving force must be increased. This can be achieved either by increasing the osmotic concentration or by decreasing the feed concentration. An increase in the osmotic concentration implies a lower water activity, while a decrease in the feed concentration induces a lower water activity. Globally, this results in a higher driving force [7]. Therefore, we expect to see a drop in flux with an increase in feed concentration, as can be observed in Figure 5a. By calculating Kov using Equation (2), the effect of the driving force will be removed, and a constant Kov is expected with a change in concentration. However, it can be observed in Figure 5b that Kov still decreases with an increase in the concentration. The factor that causes Kov to decrease could be concentration polarization.
3.3. Influence of the Feed Temperature
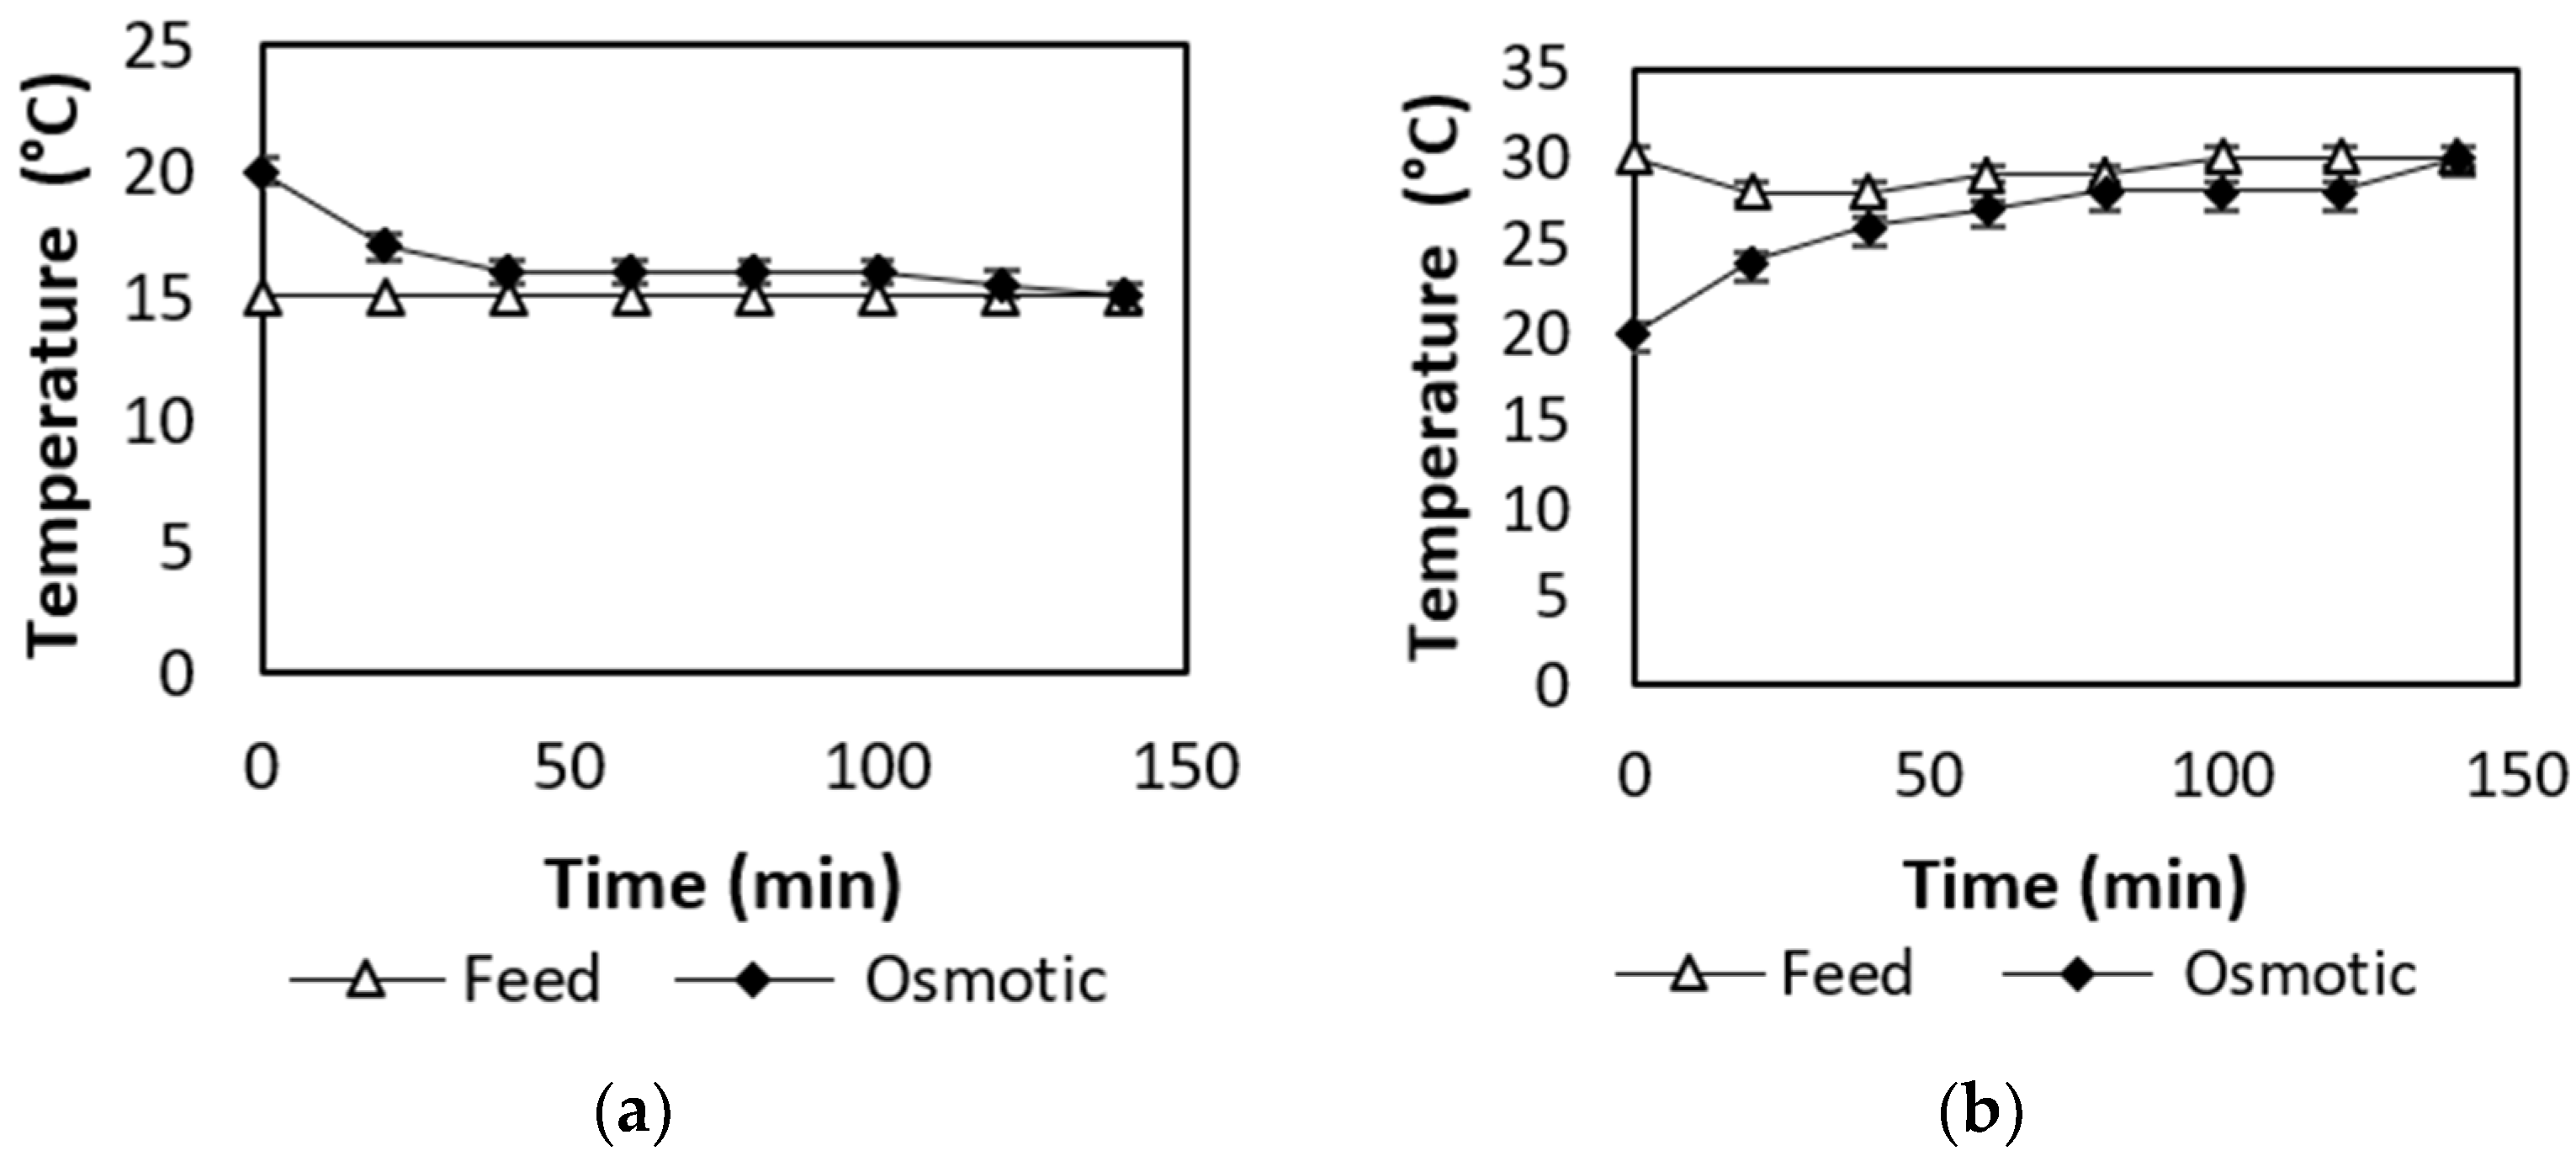
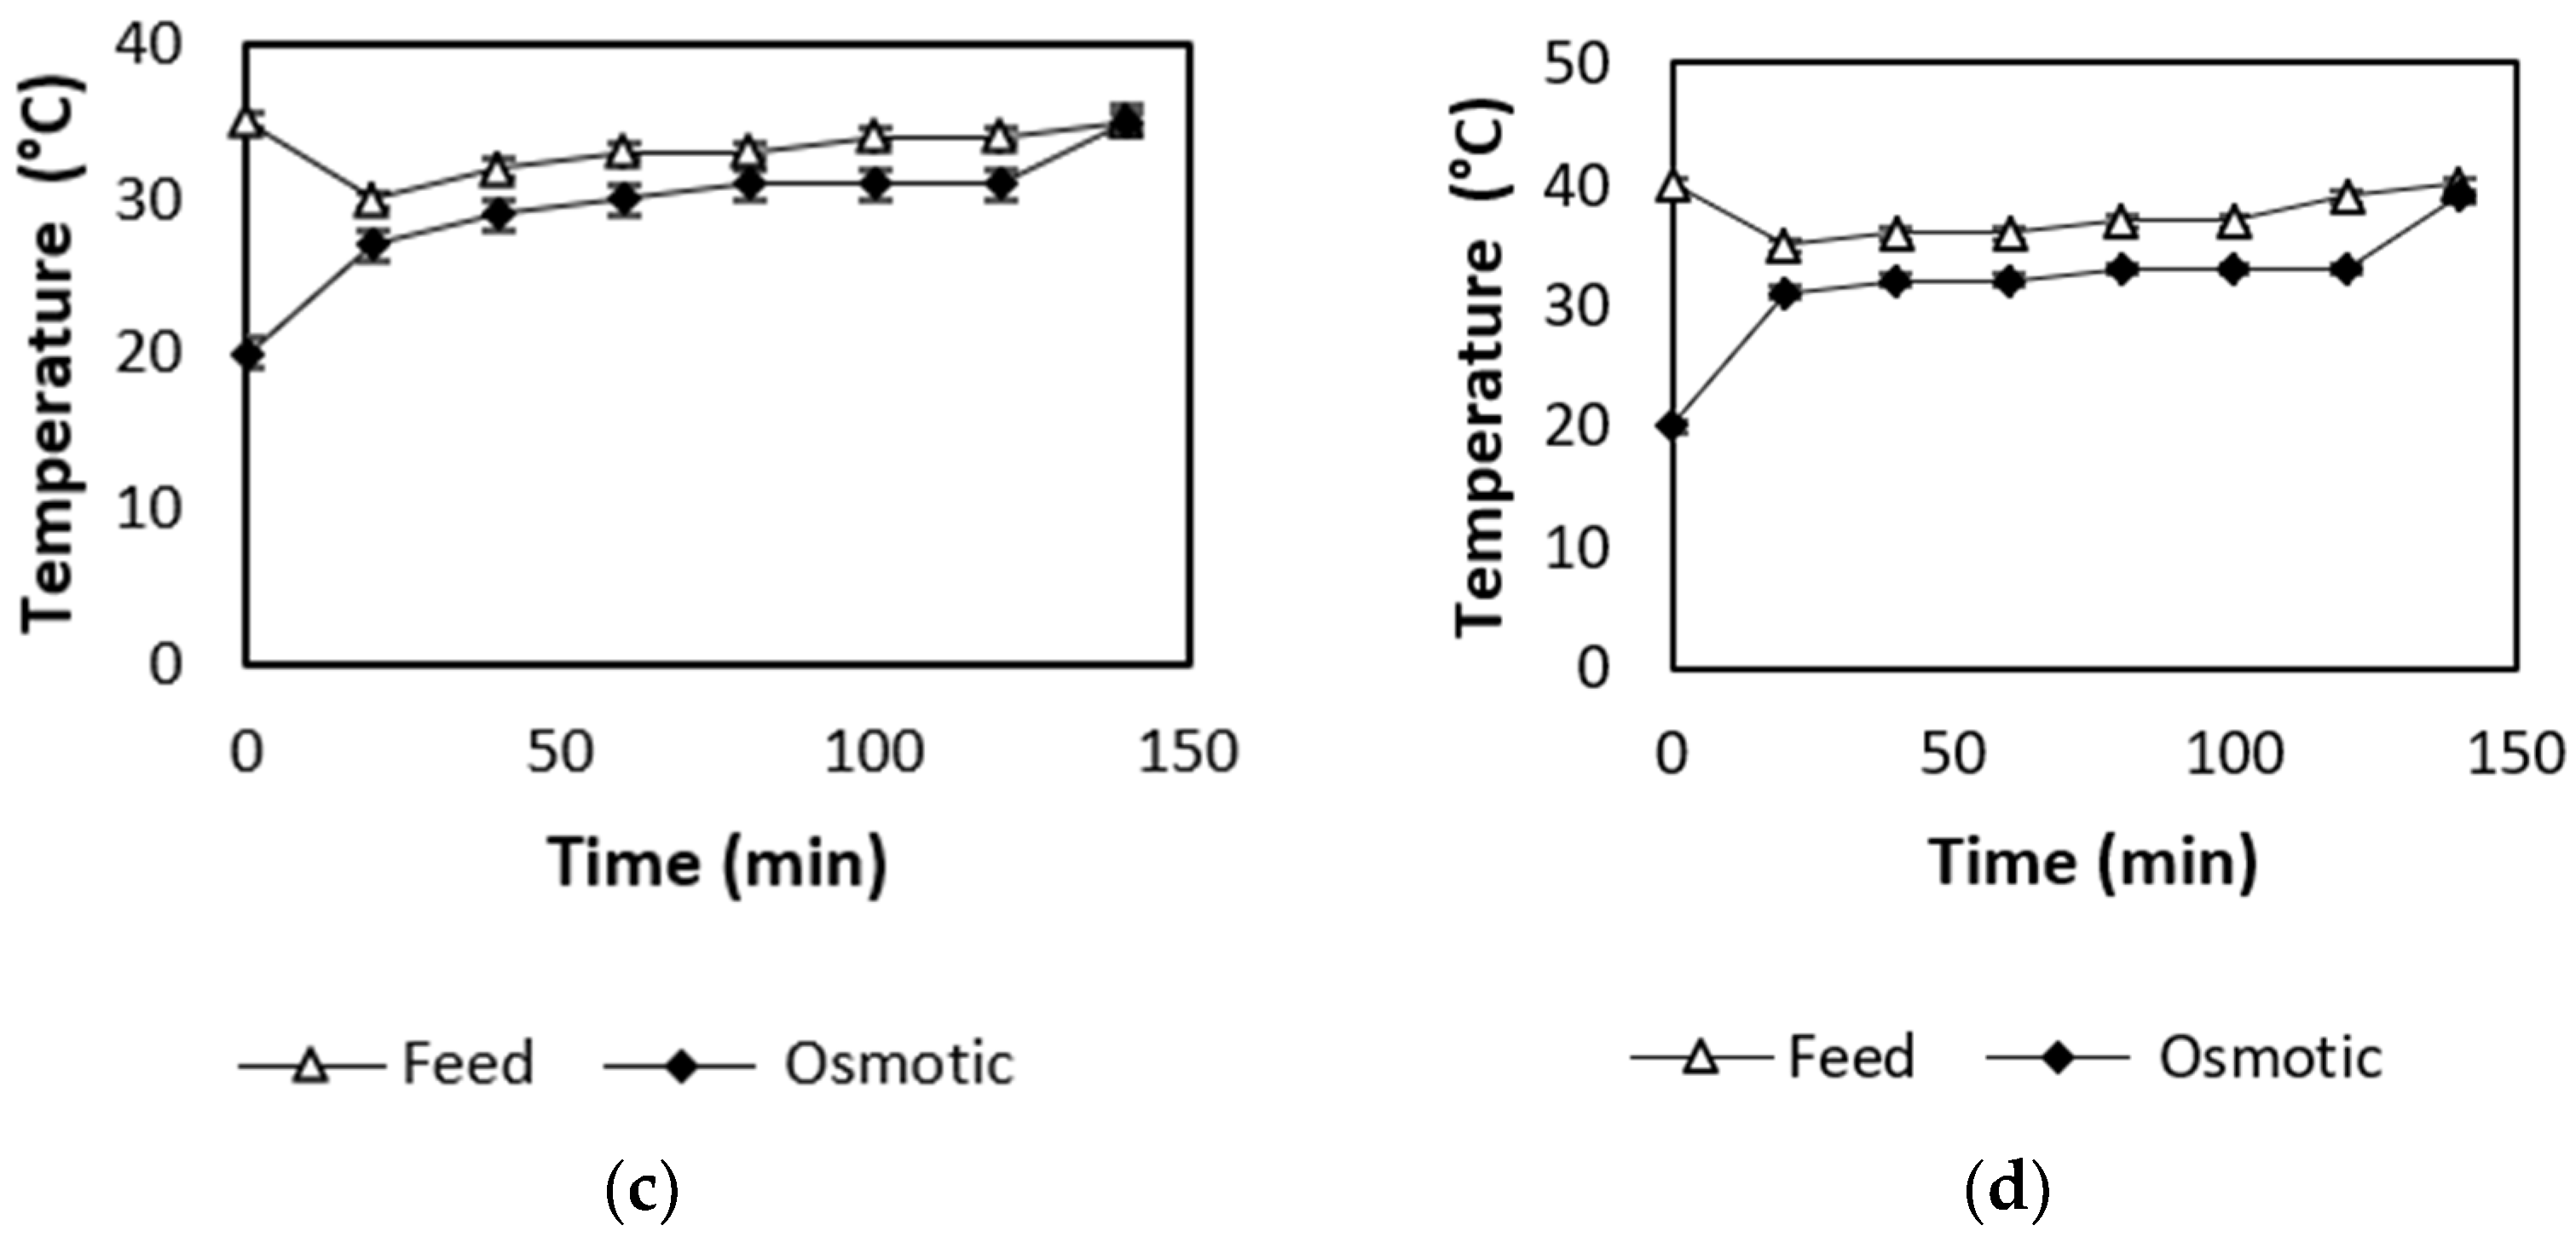
The temperature of the feed solution was varied in a range between 15 °C and 40 °C, while the osmotic temperature was kept at 20 °C, equivalent to room temperature (see the evolution of temperatures shown in Appendix A). This study was limited to 40° by the membrane contactor characteristics. To investigate the effect of feed temperature on the flux and the overall mass transfer coefficient, experiments were conducted with a feed concentration of 0.8 mol/L (67.2 g/L) and an osmotic concentration of 6.16 mol/L (360 g/L). The feed flow rate and the osmotic flow rate were at their optimal values for this system. The results are presented in Figure 6. When the feed temperature increases, the flux increases due to the vapor pressure difference created by the temperature difference and the concentration difference across the membrane at the same time. After some time of operation, the feed solution and the osmotic solution reach the same temperature, since the two streams are recirculated in the experimental setup. The membrane contactor acts as an excellent heat exchanger between the feed and osmotic solutions, which unfortunately is not the desired effect, since most of the energy is lost in heating the osmotic solution rather than evaporating the water in the feed. Thus, it is more efficient if a membrane with a lower heat conductivity is used. Unlike the flux, the mass transfer coefficient decreases when the temperature increases, which could be explained by the presence of the temperature polarization effect. These phenomena were also observed by Salmon et al. [18] and by Boubakry et al. [24].
The results of previous studies on membrane crystallization are presented in Table 2, for comparison with the results obtained in this study. It can be observed that the flux obtained in this work was in good agreement with the values obtained with the same type of hollow fibers but was inferior to the flux obtained in bigger membrane contactors. The fact that most of the studies did not report the mass transfer coefficient is a critical limitation, in terms of making a fair comparison. Sparenberg et al. [20] used the same type of membrane contactor for direct contact and vacuum membrane crystallization. The vacuum membrane crystallization had a higher flux in comparison to OMCD and DCMD, as the heat losses during the process were lower. The same applied to Kov: the values obtained in previous studies using the same type of hollow fibers were near the values obtained in this study, ranging from 4.8 × 10 − 11 m3/m2·Pa·s to 6.53 × 10 − 11 m3/m2·Pa·s.
3.4. Crystalline Phases
Commercial crystals were observed via SEM for comparison with the crystals produced at 15, 20, 30, 35, and 40 °C. The images produced via SEM are shown in Figure 7a–f. Commercial sodium bicarbonate is a powder consisting of flat sheet crystals with no preferential shape, while the crystals produced by membrane distillation crystallization were in the form of squares, sticks, and other shapes. The shape of the crystals obtained in this study was similar to that of crystals obtained in the literature using other novel crystallization processes. Therefore, the effect of OMDC on the shape of the crystals was not significant [17,29,30]. The temperature influenced the morphology and the size of the crystals, giving bigger crystals at 35 °C. This is due to the fact that temperature has a great effect on the nucleation and growth rate of crystals [16]. The experiment at 35 °C gave larger crystals. This experiment was repeated four times, and it was observed that on two occasions the crystal size was similar to the size in the experiment at 40 °C, while on the other two occasions bigger crystals were obtained. For this reason, the average size should be taken carefully. This is due to the effect that temperature, or the residence time of the crystals in the tank, has on the nucleation and growth rate of crystals. The crystal size obtained in this study agreed with the crystal size obtained by Adnan Abdel-Rahaman et al. [31]. To find an optimal temperature, higher temperatures may have to be tested, but this was not possible in this study due to the thermal limitations of the material of the module.
XRD analysis was performed on various bicarbonate crystals. The first was the original sodium bicarbonate powder from the industrial supplier. The second to the sixth samples analyzed were NaHCO3 crystals obtained after membrane crystallization distillation at 15, 20, 30, 35, and 40 °C for the feed solution. A comparison of the different XRD spectra is shown in Figure 8. As previously reported [32,33], all the spectra compared showed peaks at 29.7, 35.4, and 40.8 (2Theta), attributed to the NaHCO3 crystal phase.
The purity of the crystals obtained was in a range between 96.4 and 100%. While the crystals obtained at 30° had the lowest purity, showing a composition of 96.4% pure NaHCO3 and 3.6% hydrated Na2CO3, the highest purity was observed at 20, 35, and 40 °C, with crystals of 100% NaHCO3. The quantitative analysis of purity is included in Appendix B. As observed by Wang et al. [34], two factors influence the decomposition process of NaHCO3 to Na2CO3 + CO2 + H2O: temperature and water activity. The change in water activity is sensitive to both temperature and the composition of the liquid. The variation in the purity of the crystal can be explained by the membrane system’s energy losses while heating the osmotic solution. This produces a slight variation along the membrane that can induce decomposition of NaHCO3 to Na2CO3.
4. Conclusions
Osmotic membrane distillation crystallization (OMDC) is a novel technology considered as an alternative to conventional crystallizers. OMDC has been studied for crystallization of sodium bicarbonate, due to its advantages such as lower energy and material consumption, control over the operational parameters, and larger evaporation surface area, among others. Several parameters such as the feed and osmotic velocities, feed concentration, and feed temperature were optimized. Regarding the feed and osmotic velocities, as the velocity increases the possibility of membrane wetting increases significantly. Therefore, a feed velocity of 0.078 m/s and an osmotic velocity of 0.01 m/s were chosen as the optimal conditions, which resulted in obtaining a Kov of 5.4 × 10 − 11 m3/Pa·m2·s. In addition, since the driving force in OMDC is the difference in concentration, an increase in feed concentration reduces the driving force and results in a reduction in the flux. However, when studying Kov and removing the driving force effect, the process was found to be affected by concentration polarization, and Kov still decreased by 23.6%. Finally, the effect of the temperature on water evaporation showed that the driving force of the system increased with temperature, as the flux increased from 2.45 × 10⁻⁸ to 7.49 × 10⁻⁸ m3/m2·s, but a great deal of energy was lost via the heat exchange between the feed and osmotic solutions. It was also observed that the size and the purity of the crystals were affected by the temperature, with larger sizes and higher purities obtained at higher temperatures.
5. Patents
The process presented here is registered under the patent application EP 2021163.
Author Contributions
Conceptualization, M.G.A. and V.S.S.; methodology, M.G.A. and V.S.S.; formal analysis, M.G.A. and V.S.S.; investigation, M.G.A., V.S.S., M.B. and A.C.; writing—original draft preparation, M.G.A. and V.S.S.; writing—review and editing M.G.A., V.S.S., R.B.S. and P.L.; visualization, P.L.; supervision, P.L.; funding acquisition P.L. All authors have read and agreed to the published version of the manuscript.
Funding
This research was funded by the European Research Council (ERC) as part of the European Union’s Horizon 2020 research and innovation program (grant agreement ERC Starting Grant UE H2020 CO2LIFE 759630).
Institutional Review Board Statement
Not applicable.
Informed Consent Statement
Not applicable.
Data Availability Statement
Data available upon request to the authors.
Conflicts of Interest
The authors declare no conflict of interest.
Appendix A
Figure A1.
Feed and osmotic temperature evolution with time during the thermal evaluation of membrane distillation crystallization: (a) 15 °C; (b) 20 °C; (c) 35 °C; (d) 40 °C.
Figure A1.
Feed and osmotic temperature evolution with time during the thermal evaluation of membrane distillation crystallization: (a) 15 °C; (b) 20 °C; (c) 35 °C; (d) 40 °C.
Appendix B
Figure A2.
XRD quantitative analysis for crystals produced at 15 °C.
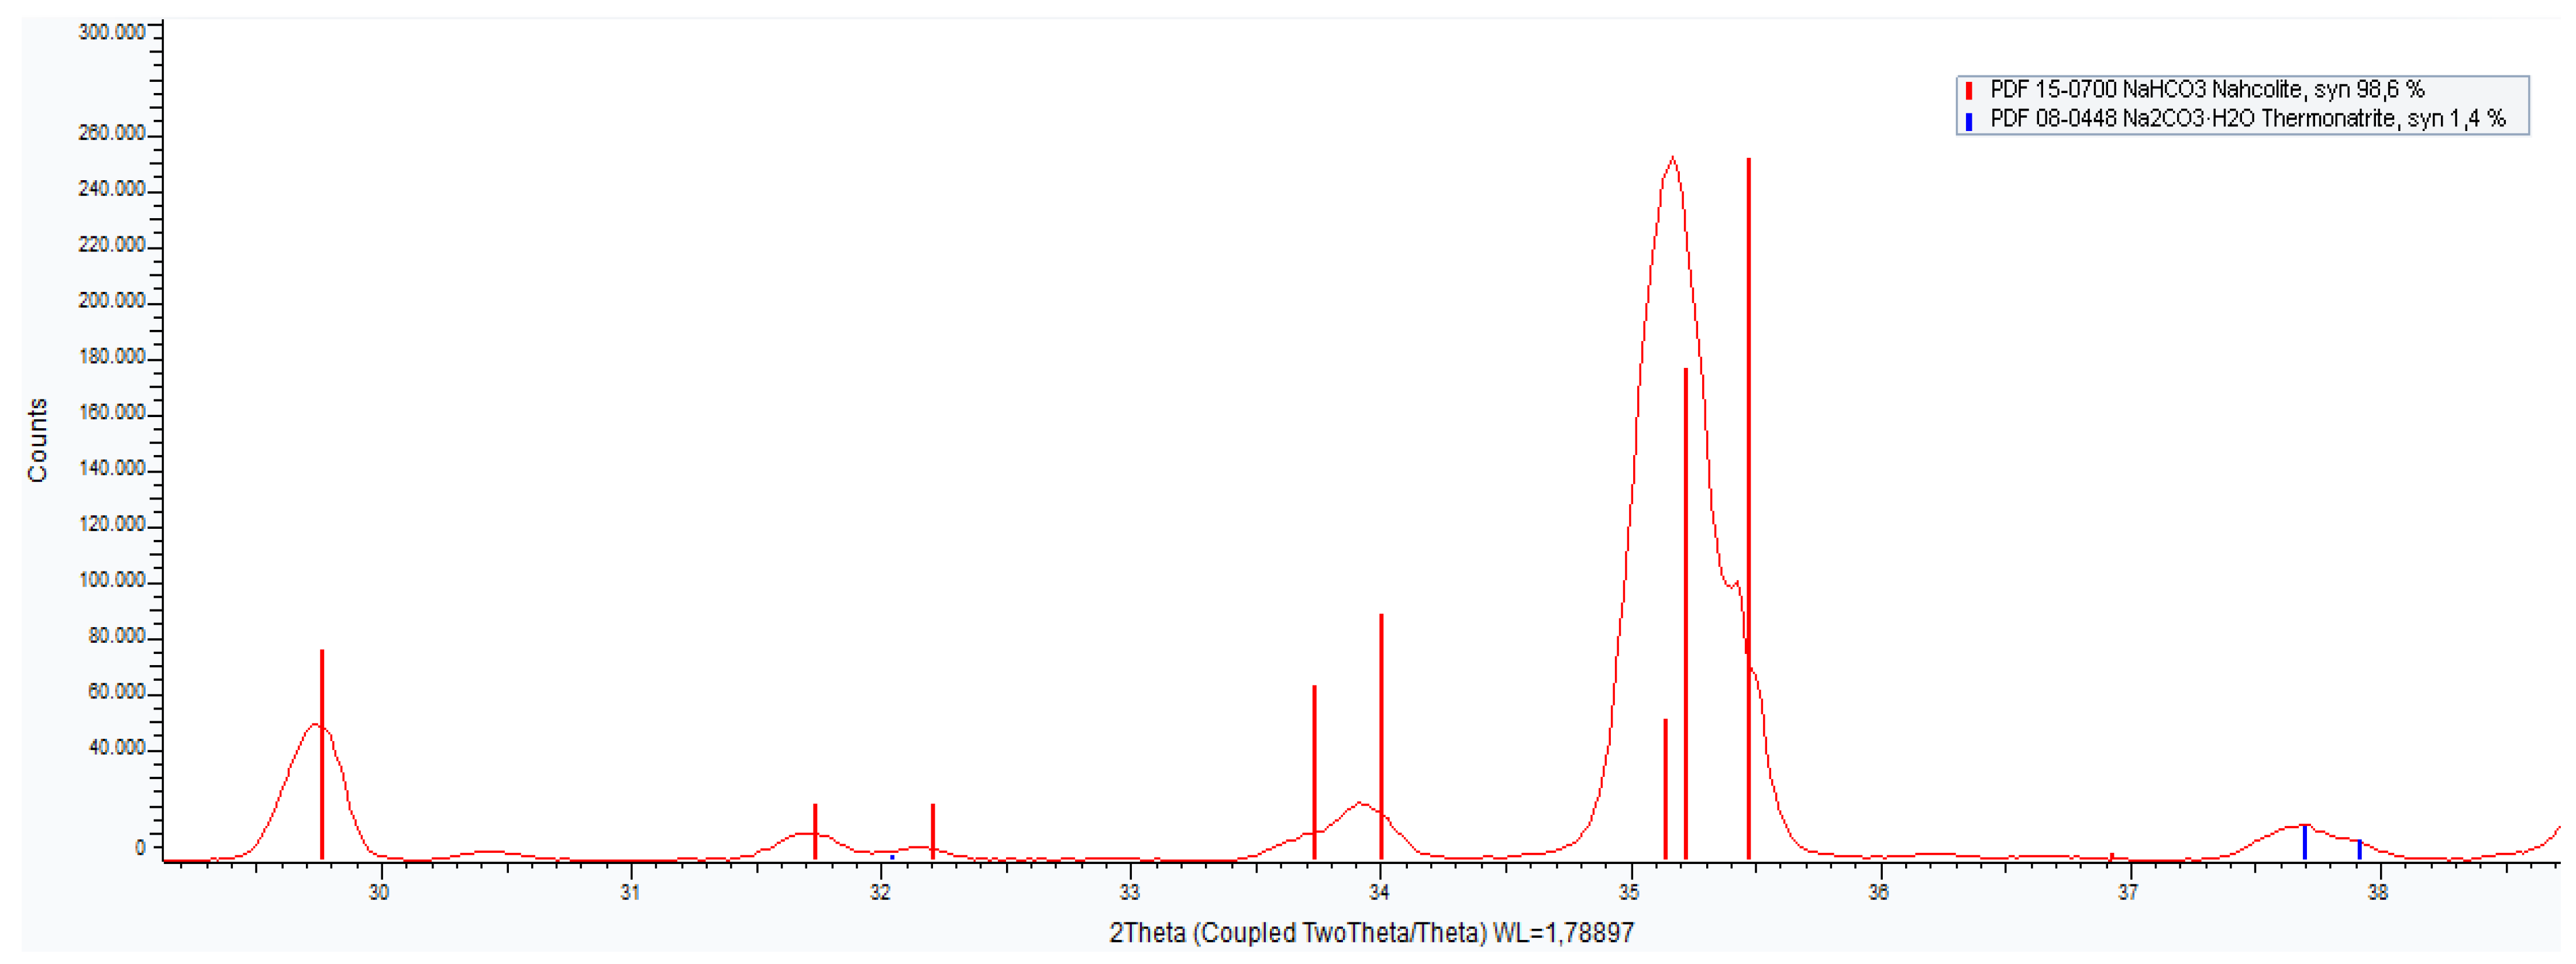
Figure A3.
XRD quantitative analysis for crystals produced at 20 °C.
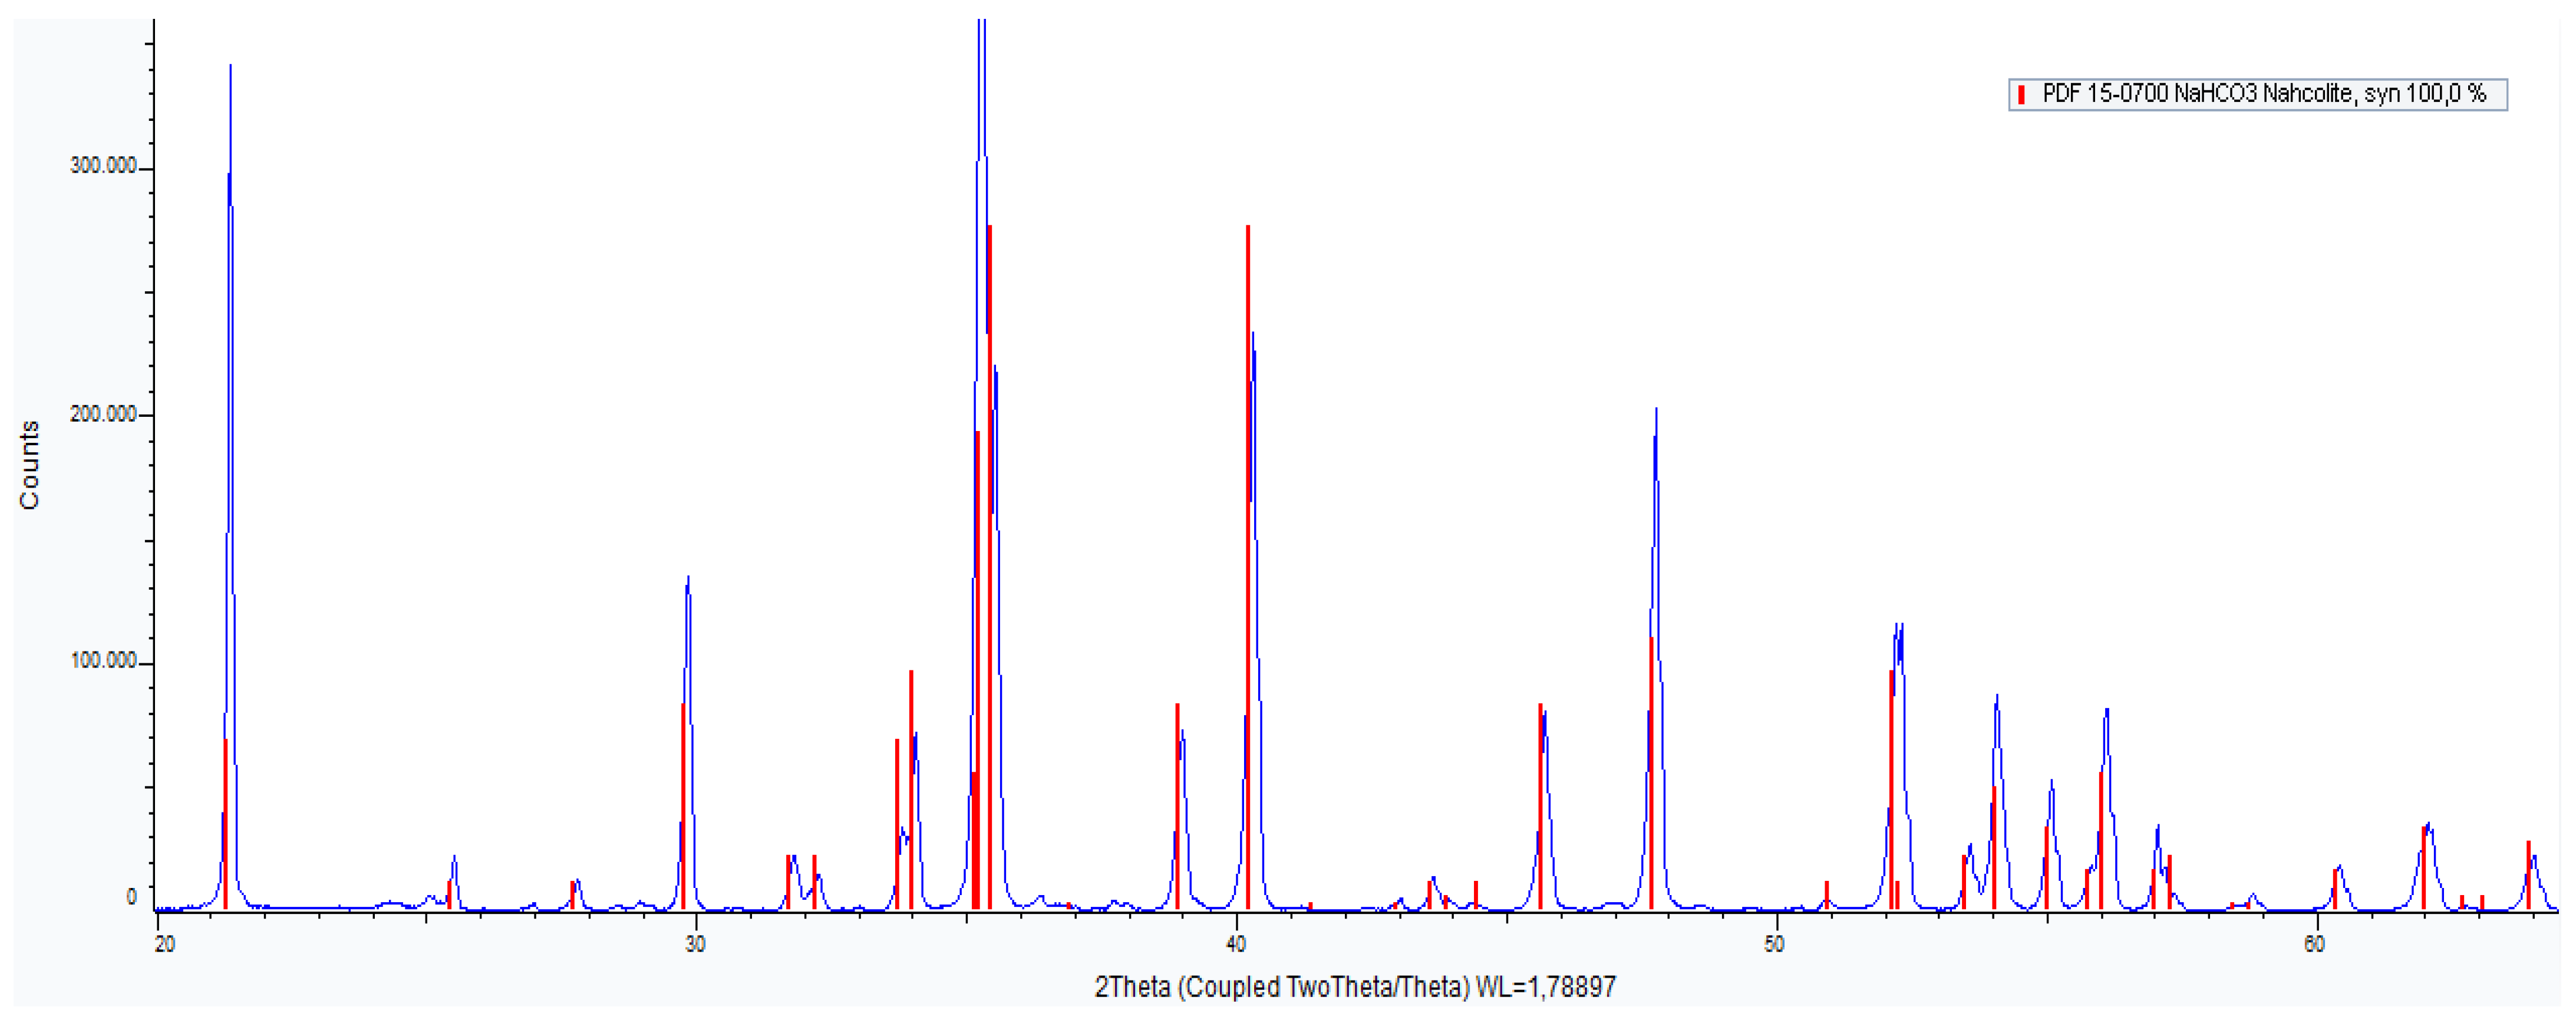
Figure A4.
XRD quantitative analysis for crystals produced at 30 °C.
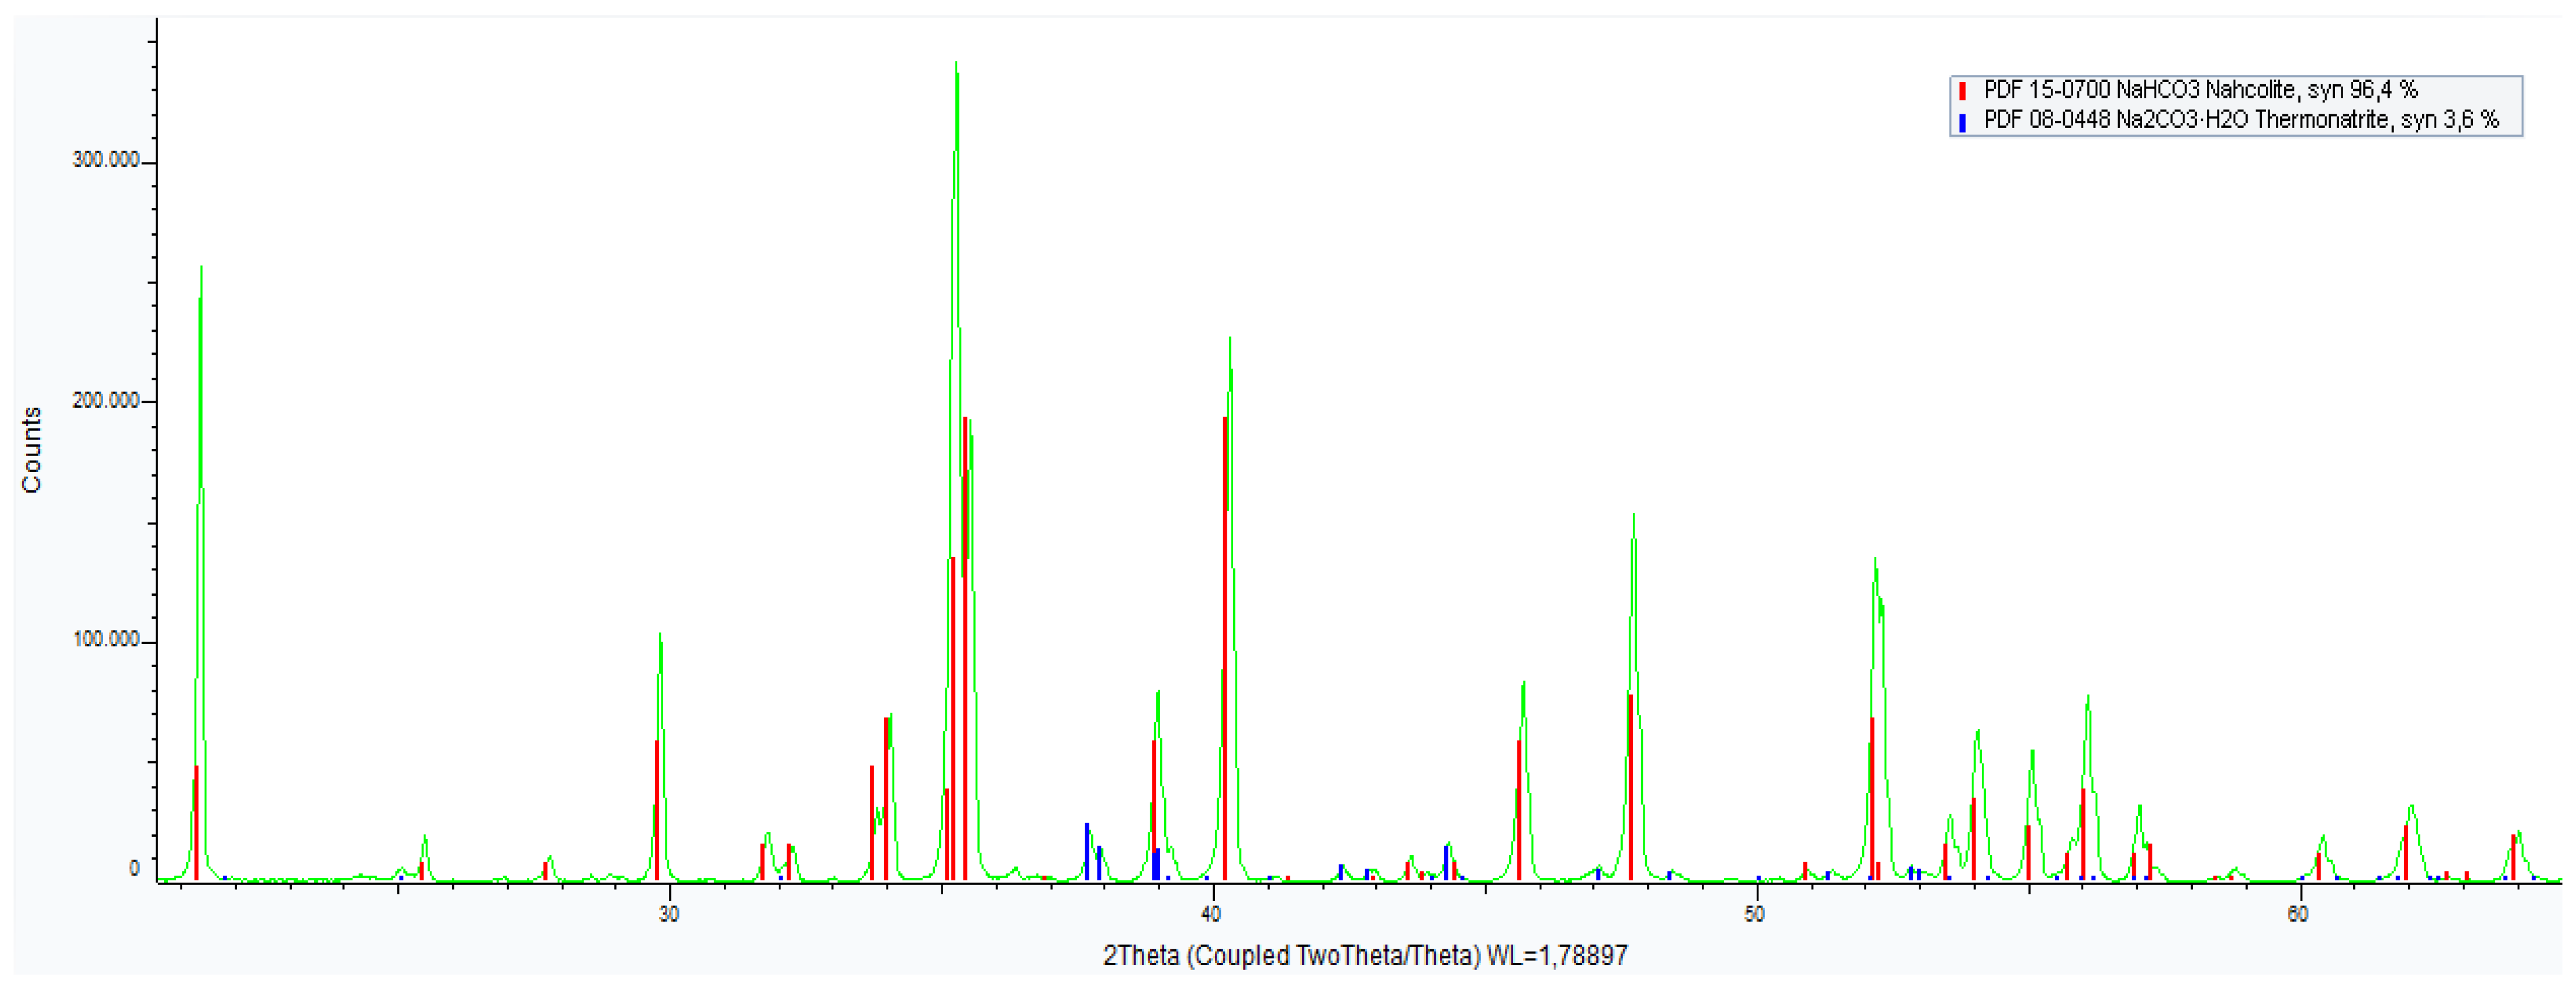
Figure A5.
XRD quantitative analysis for crystals produced at 35 °C.
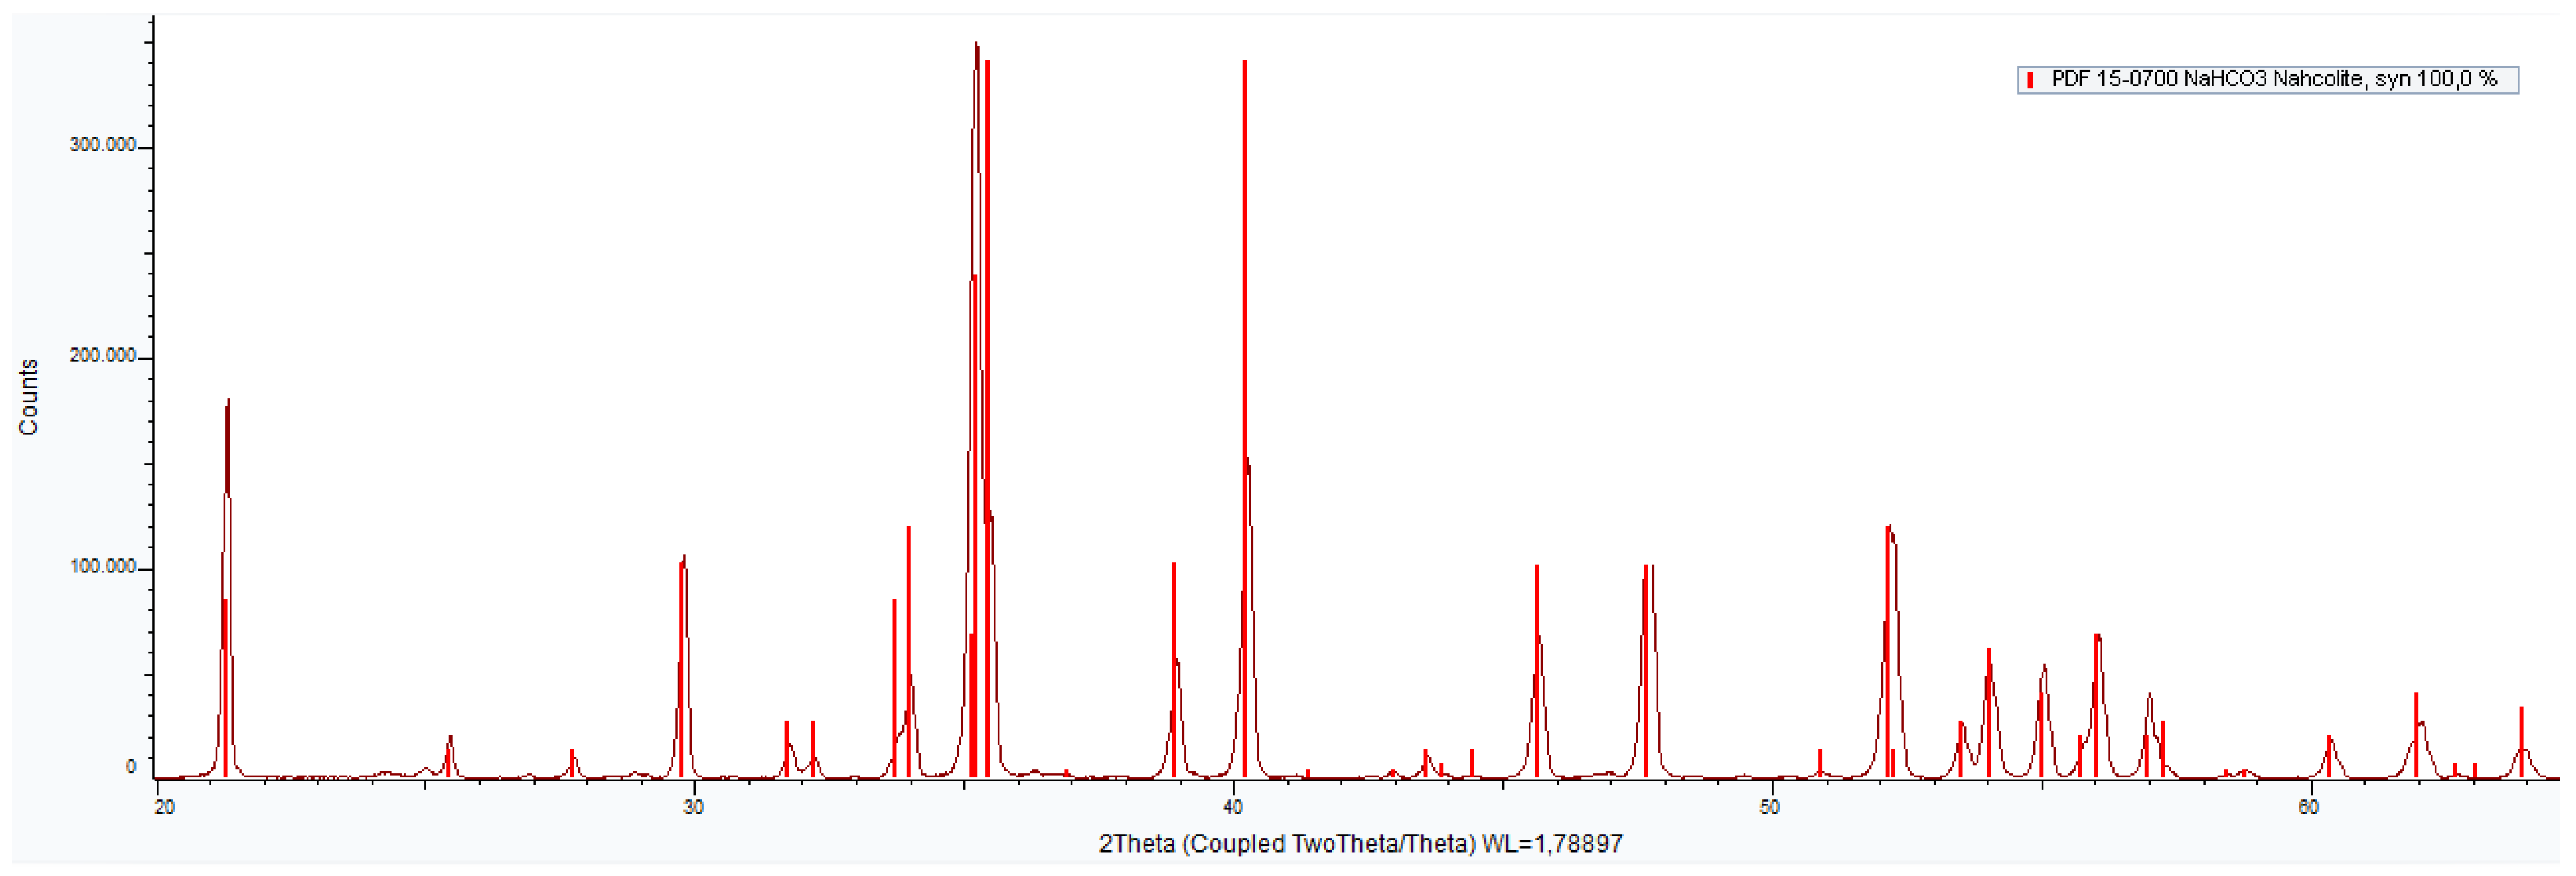
Figure A6.
XRD quantitative analysis for crystals produced at 40 °C.

References
- Edenhofer, O.; Madruga-Pichs, R.; Sokona, Y.; Minx, J.C.; Farahani, E.; Kadner, S.; Seyboth, K.; Adler, A.; Baum, I.; Brunner, S.; et al. (Eds.) Climate Change 2014 Mitigation of Climate Change Working Group III Contribution to the Fifth Assessment Report of the Intergovernmental Panel on Climate Change; IPCC: Cambridge, UK; New York, NY, USA, 2014. [Google Scholar]
- Cassano, A.; Conidi, C.; Drioli, E. A Comprehensive Review of Membrane Distillation and Osmotic Distillation in Agro-Food Applications. J. Membr. Sci. Res. 2020, 6, 304–318. [Google Scholar] [CrossRef]
- Wang, J.; Li, F.; Lakerveld, R. Process Intensification for Pharmaceutical Crystallization. Chem. Eng. Process. Process Intensif. 2018, 127, 111–126. [Google Scholar] [CrossRef]
- Salmón, I.R.; Luis, P. Membrane Crystallization via Membrane Distillation. Chem. Eng. Process. Process Intensif. 2018, 123, 258–271. [Google Scholar] [CrossRef]
- di Profio, G.; Salehi, S.M.; Curcio, E.; Drioli, E. Membrane Crystallization Technology. In Comprehensive Membrane Science and Engineering, 2nd ed.; Elsevier: Amsterdam, The Netherlands, 2017; Volume 3, pp. 297–317. [Google Scholar]
- Drioli, E.; di Profio, G.; Curcio, E. Progress in Membrane Crystallization. Curr. Opin. Chem. Eng. 2012, 1, 178–182. [Google Scholar] [CrossRef]
- Kramer, H.; Anisi, F.; Burak, E.; Stankiewicz, A.I. Membrane Crystallization Technology and Process Intensification. In Comprehensive Membrane Science and Engineering; Drioli, E., Lidietta, G., Fontananova, E., Eds.; Elsevier: Amsterdam, The Netherlands, 2017; Volume 4, pp. 1–7. [Google Scholar]
- Chabanon, E.; Mangin, D.; Charcosset, C. Membranes and Crystallization Processes: State of the Art and Prospects. J. Membr. Sci. 2016, 509, 57–67. [Google Scholar] [CrossRef]
- Drioli, E.A.C.; Curcio, E. Membrane Contactors: Fundamentals, Applications and Potentialities; Elsevier: Amsterdam, The Netherlands, 2011. [Google Scholar]
- Drioli, E.; Curcio, E.; di Profio, G. State of the Art and Recent Progresses in Membrane Contactors. Chem. Eng. Res. Des. 2005, 83, 223–233. [Google Scholar] [CrossRef]
- Alkhudhiri, A.; Darwish, N.; Hilal, N. Membrane Distillation: A Comprehensive Review. Desalination 2012, 287, 2–18. [Google Scholar] [CrossRef]
- Luis, P. Fundamental Modeling of Membrane Systems: Membrane and Process Performance; Elsevier: Amsterdam, The Netherlands, 2018. [Google Scholar]
- Nagy, E. Basic Equations of Mass Transport through a Membrane Layer, 2nd ed.; Elsevier: Amsterdam, The Netherlands, 2019. [Google Scholar]
- Macedonio, F.; Ali, A.; Drioli, E. Membrane Distillation and Osmotic Distillation. In Comprehensive Membrane Science and Engineering; Elsevier: Amsterdam, The Netherlands, 2017; Volume 3, pp. 282–296. [Google Scholar]
- Zhu, Y.; Haut, B.; Halloin, V.; Delplancke-Ogletree, M.P. Investigation of Crystallization Kinetics of Sodium Bicarbonate in a Continuous Stirred Tank Crystallizer. J. Cryst. Growth 2005, 282, 220–227. [Google Scholar] [CrossRef]
- Saberi, A.; Goharrizi, A.S.; Ghader, S. Precipitation Kinetics of Sodium Bicarbonate in an Industrial Bubble Column Crystallizer. Cryst. Res. Technol. 2009, 44, 159–166. [Google Scholar] [CrossRef]
- Jiang, S.; Zhang, Y.; Li, Z. A New Industrial Process of NaHCO3 and Its Crystallization Kinetics by Using the Common Ion Effect of Na2CO3. Chem. Eng. J. 2019, 360, 740–749. [Google Scholar] [CrossRef]
- Salmón, I.R.; Janssens, R.; Luis, P. Mass and Heat Transfer Study in Osmotic Membrane Distillation-Crystallization for CO2 Valorization as Sodium Carbonate. Sep. Purif. Technol. 2017, 176, 173–183. [Google Scholar] [CrossRef]
- Sparenberg, M.C.; Ruiz Salmón, I.; Luis, P. Economic Evaluation of Salt Recovery from Wastewater via Membrane Distillation-Crystallization. Sep. Purif. Technol. 2020, 235, 116075. [Google Scholar] [CrossRef]
- Sparenberg, M.C.; Hanot, B.; Molina-Fernández, C.; Luis, P. Experimental Mass Transfer Comparison between Vacuum and Direct Contact Membrane Distillation for the Concentration of Carbonate Solutions. Sep. Purif. Technol. 2021, 275, 119193. [Google Scholar] [CrossRef]
- Brito, M.M.; Jullok, N.; Rodríguez, Z.N.; van der Bruggen, B.; Luis, P. Membrane Crystallization for the Recovery of a Pharmaceutical Compound from Waste Streams. Chem. Eng. Res. Des. 2014, 92, 264–272. [Google Scholar] [CrossRef]
- Sandler, S.I. Chemical, Biochemical, and Engineering Thermodynamics, 5th ed.; Wiley: Hoboken, NJ, USA, 2014; ISBN 1118915178/9781118915172. [Google Scholar]
- Pitzer, K.S.; Peiper, J.C. Activity Coefficient of Aqueous Sodium Bicarbonate. J. Phys. Chem. 1980, 84, 2396–2398. [Google Scholar] [CrossRef]
- Boubakri, A.; Hafiane, A.; al Tahar, S.B. Nitrate Removal from Aqueous Solution by Direct Contact Membrane Distillation Using Two Different Commercial Membranes. Desalination Water Treat. 2015, 56, 2723–2730. [Google Scholar] [CrossRef]
- Creusen, R.; van Medevoort, J.; Roelands, M.; van Renesse van Duivenbode, A.; Hanemaaijer, J.H.; van Leerdam, R. Integrated Membrane Distillation–Crystallization: Process Design and Cost Estimations for Seawater Treatment and Fluxes of Single Salt Solutions. Desalination 2013, 323, 8–16. [Google Scholar] [CrossRef]
- Luo, L.; Zhao, J.; Chung, T.S. Integration of Membrane Distillation (MD) and Solid Hollow Fiber Cooling Crystallization (SHFCC) Systems for Simultaneous Production of Water and Salt Crystals. J. Membr. Sci. 2018, 564, 905–915. [Google Scholar] [CrossRef]
- Shi, W.; Li, T.; Tian, Y.; Li, H.; Fan, M.; Zhang, H.; Qin, X. An Innovative Hollow Fiber Vacuum Membrane Distillation-Crystallization (VMDC) Coupling Process for Dye House Effluent Separation to Reclaim Fresh Water and Salts. J. Clean. Prod. 2022, 337, 130586. [Google Scholar] [CrossRef]
- Bush, J.A.; Vanneste, J.; Leavitt, D.; Bergida, J.; Krzmarzick, M.; Kim, S.J.; Ny, C.; Cath, T.Y. Membrane Distillation Crystallization of Ammonium Nitrate Solutions to Enable Sustainable Cold Storage: Electrical Conductivity as an in-Situ Saturation Indicator. J. Membr. Sci. 2021, 631, 119321. [Google Scholar] [CrossRef]
- Zhu, Y.; Demilie, P.; Davoine, P.; Cartage, T.; Delplancke-Ogletree, M.P. Influence of Calcium Ions on the Crystallization of Sodium Bicarbonate. J. Cryst. Growth 2005, 275, e1333–e1339. [Google Scholar] [CrossRef]
- Ga, R.S.; Seckler, M.M.; Witkamp, G.-J. Reactive Recrystallization of Sodium Bicarbonate. Ind. Eng. Chem. Res. 2005, 44, 4272–4283. [Google Scholar] [CrossRef]
- Abdel-Rahman, Z.A.; Hamed, H.H.; Khalaf, F.K. Optimization of Sodium Bicarbonate Production Using Response Surface Methodology (RSM). Diyala J. Eng. Sci. 2018, 11, 22–28. [Google Scholar] [CrossRef]
- Yoo, M.; Han, S.J.; Wee, J.H. Carbon Dioxide Capture Capacity of Sodium Hydroxide Aqueous Solution. J. Environ. Manag. 2013, 114, 512–519. [Google Scholar] [CrossRef] [PubMed]
- Wang, Y.; Cheng, Y.-S.; Yu, M.-G.; Li, Y.; Cao, J.-L.; Zheng, L.-G.; Yi, H.-W. Methane Explosion Suppression Characteristics Based on the NaHCO3/Red-Mud Composite Powders with Core-Shell Structure. J. Hazard. Mater. 2017, 335, 84–91. [Google Scholar] [CrossRef] [PubMed]
- Wang, Q.; Li, Z. A Modified Solvay Process with Low-Temperature Calcination of NaHCO3 Using Monoethanolamine: Solubility Determination and Thermodynamic Modeling. AIChE J. 2019, 65, e16701. [Google Scholar] [CrossRef]
Figure 1.
Concentration profiles in osmotic membrane distillation crystallization.

Figure 2.
Schematic diagram of the membrane distillation crystallization setup: A feed solution; B gear pump; C membrane contactor; D peristaltic pump; E osmotic solution; F balance; G water bath/cooler; T1–T4 thermometers.
Figure 2.
Schematic diagram of the membrane distillation crystallization setup: A feed solution; B gear pump; C membrane contactor; D peristaltic pump; E osmotic solution; F balance; G water bath/cooler; T1–T4 thermometers.
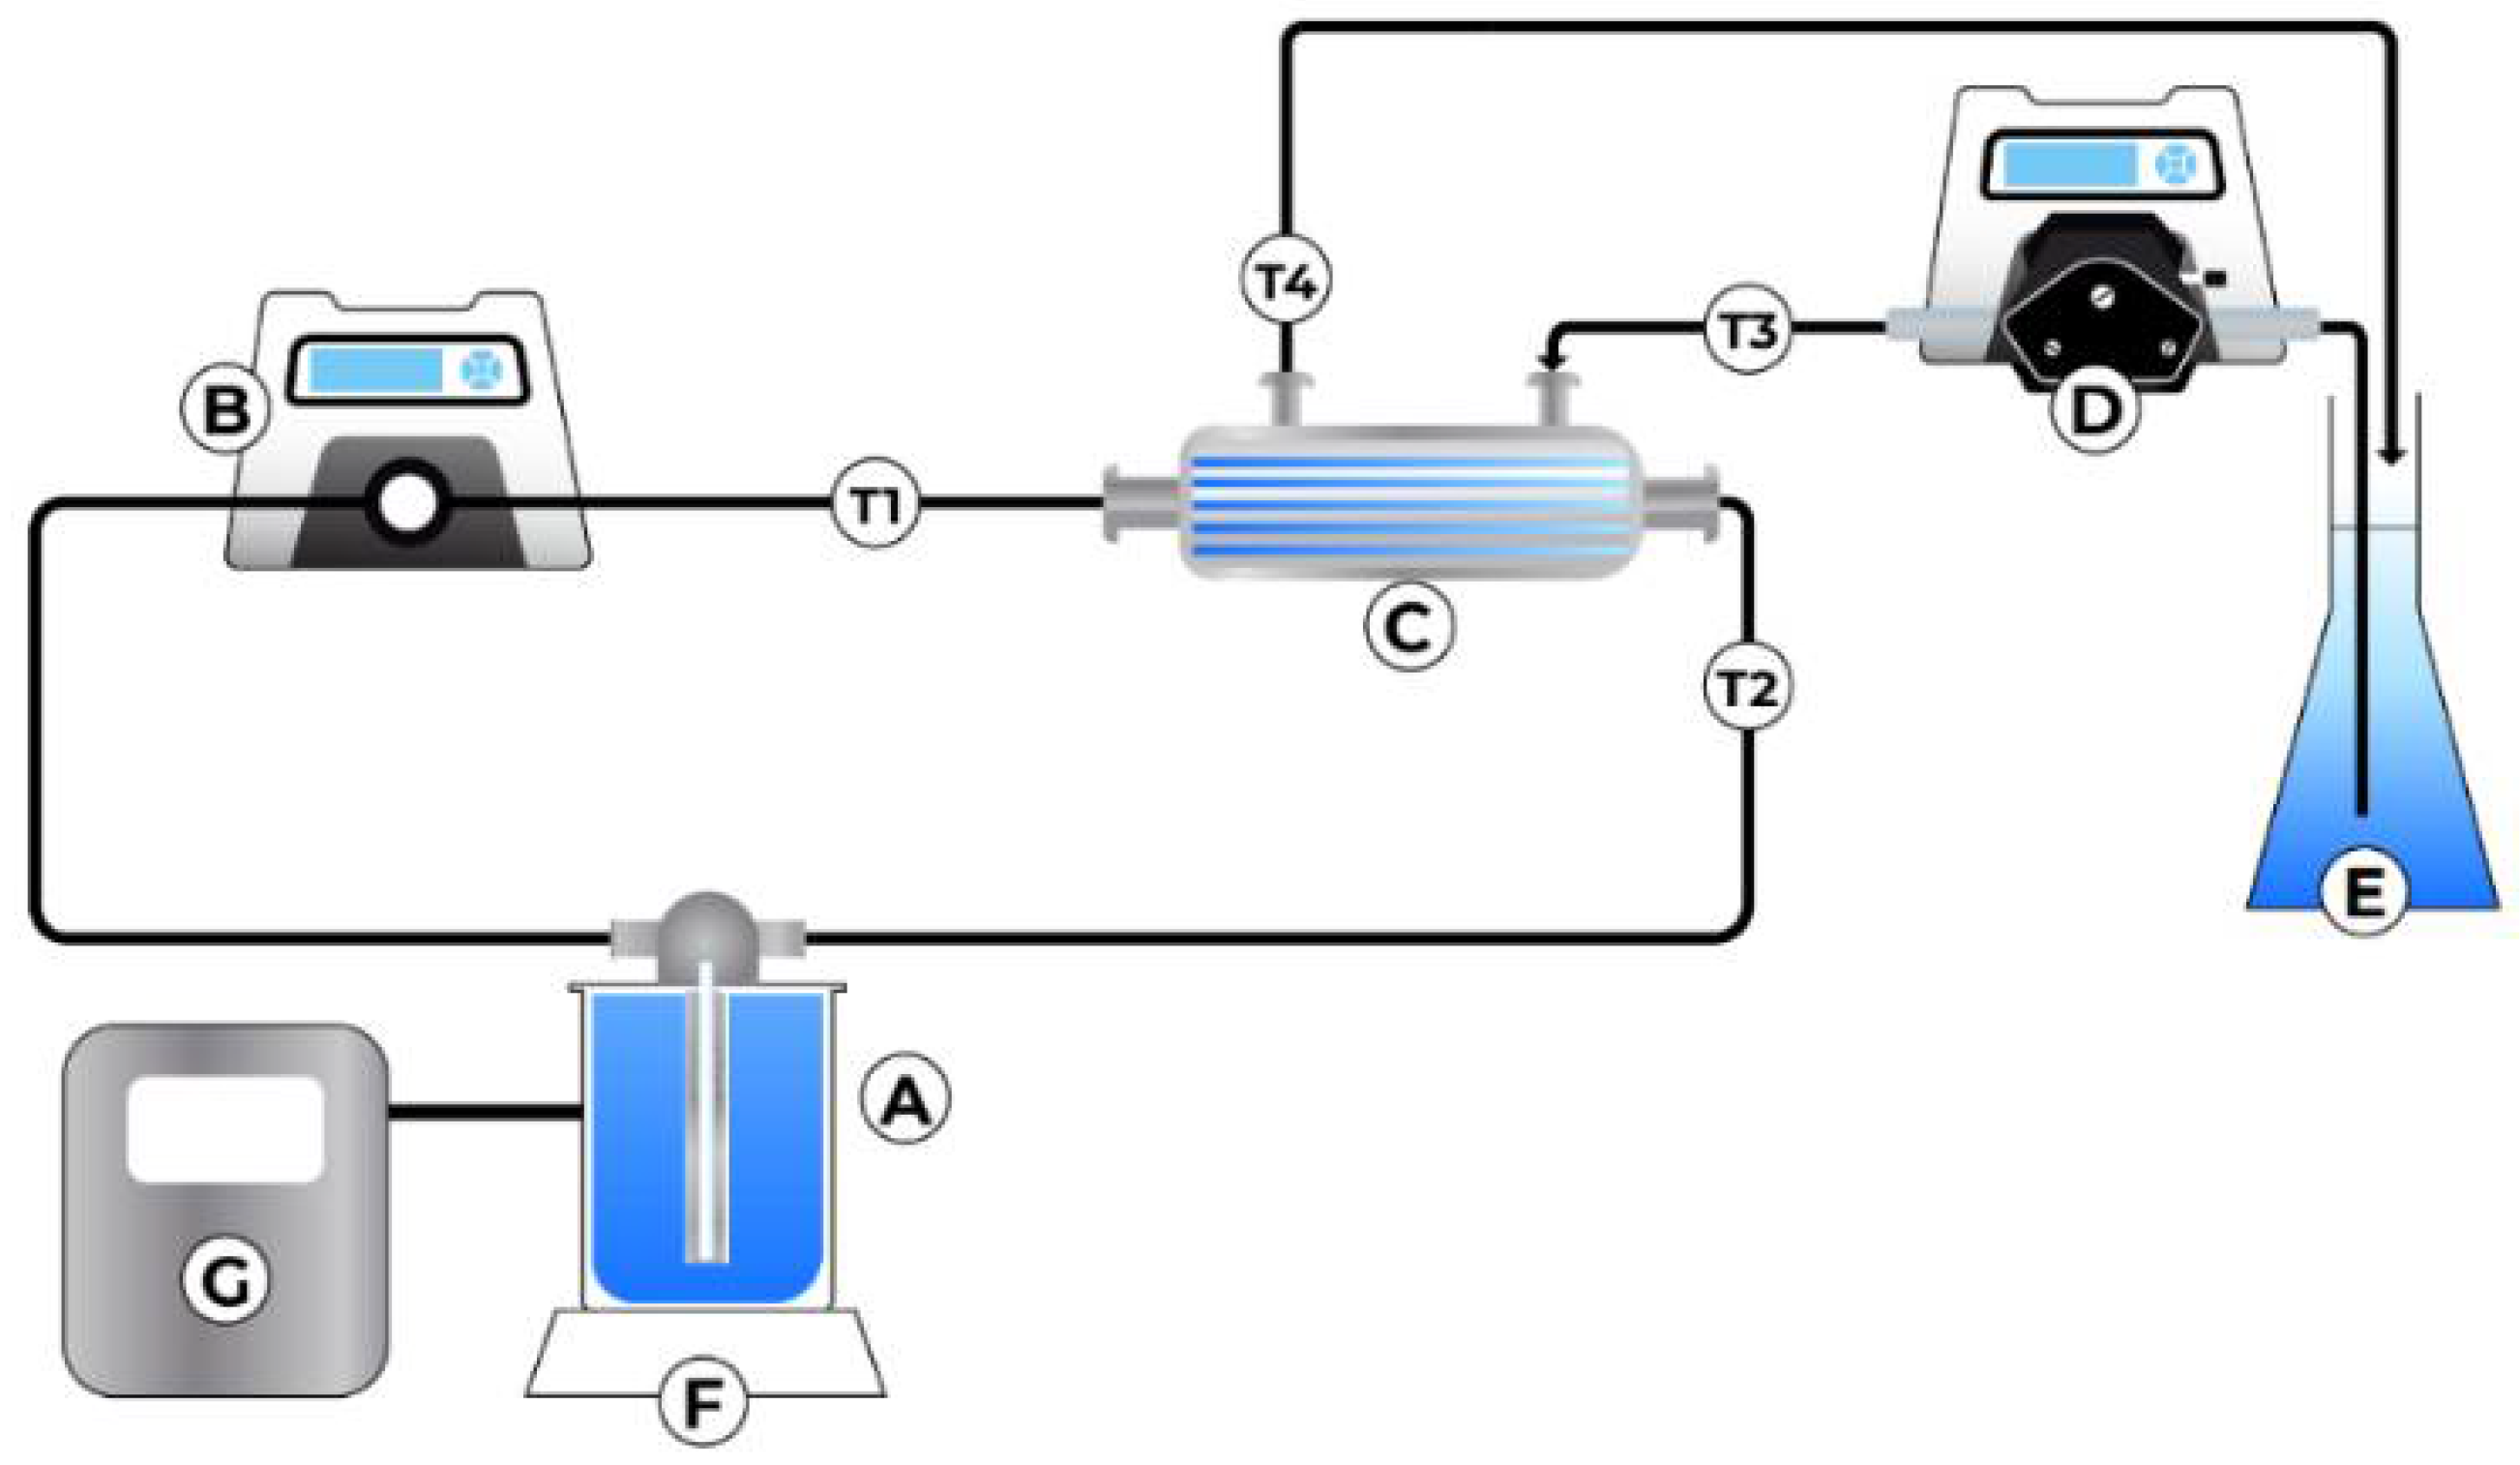
Figure 3.
Effect of feed and osmotic velocities on (a) flux and (b) Kov. The concentration of the NaHCO3 was at a maximum, and feed and osmotic solutions were at room temperature.
Figure 3.
Effect of feed and osmotic velocities on (a) flux and (b) Kov. The concentration of the NaHCO3 was at a maximum, and feed and osmotic solutions were at room temperature.

Figure 4.
(a) Flux for changes in osmotic flow rate. (b) Kov for changes in osmotic flow rate. The concentration of NaHCO3 was at a maximum, and the feed and osmotic solutions were at room temperature.
Figure 4.
(a) Flux for changes in osmotic flow rate. (b) Kov for changes in osmotic flow rate. The concentration of NaHCO3 was at a maximum, and the feed and osmotic solutions were at room temperature.
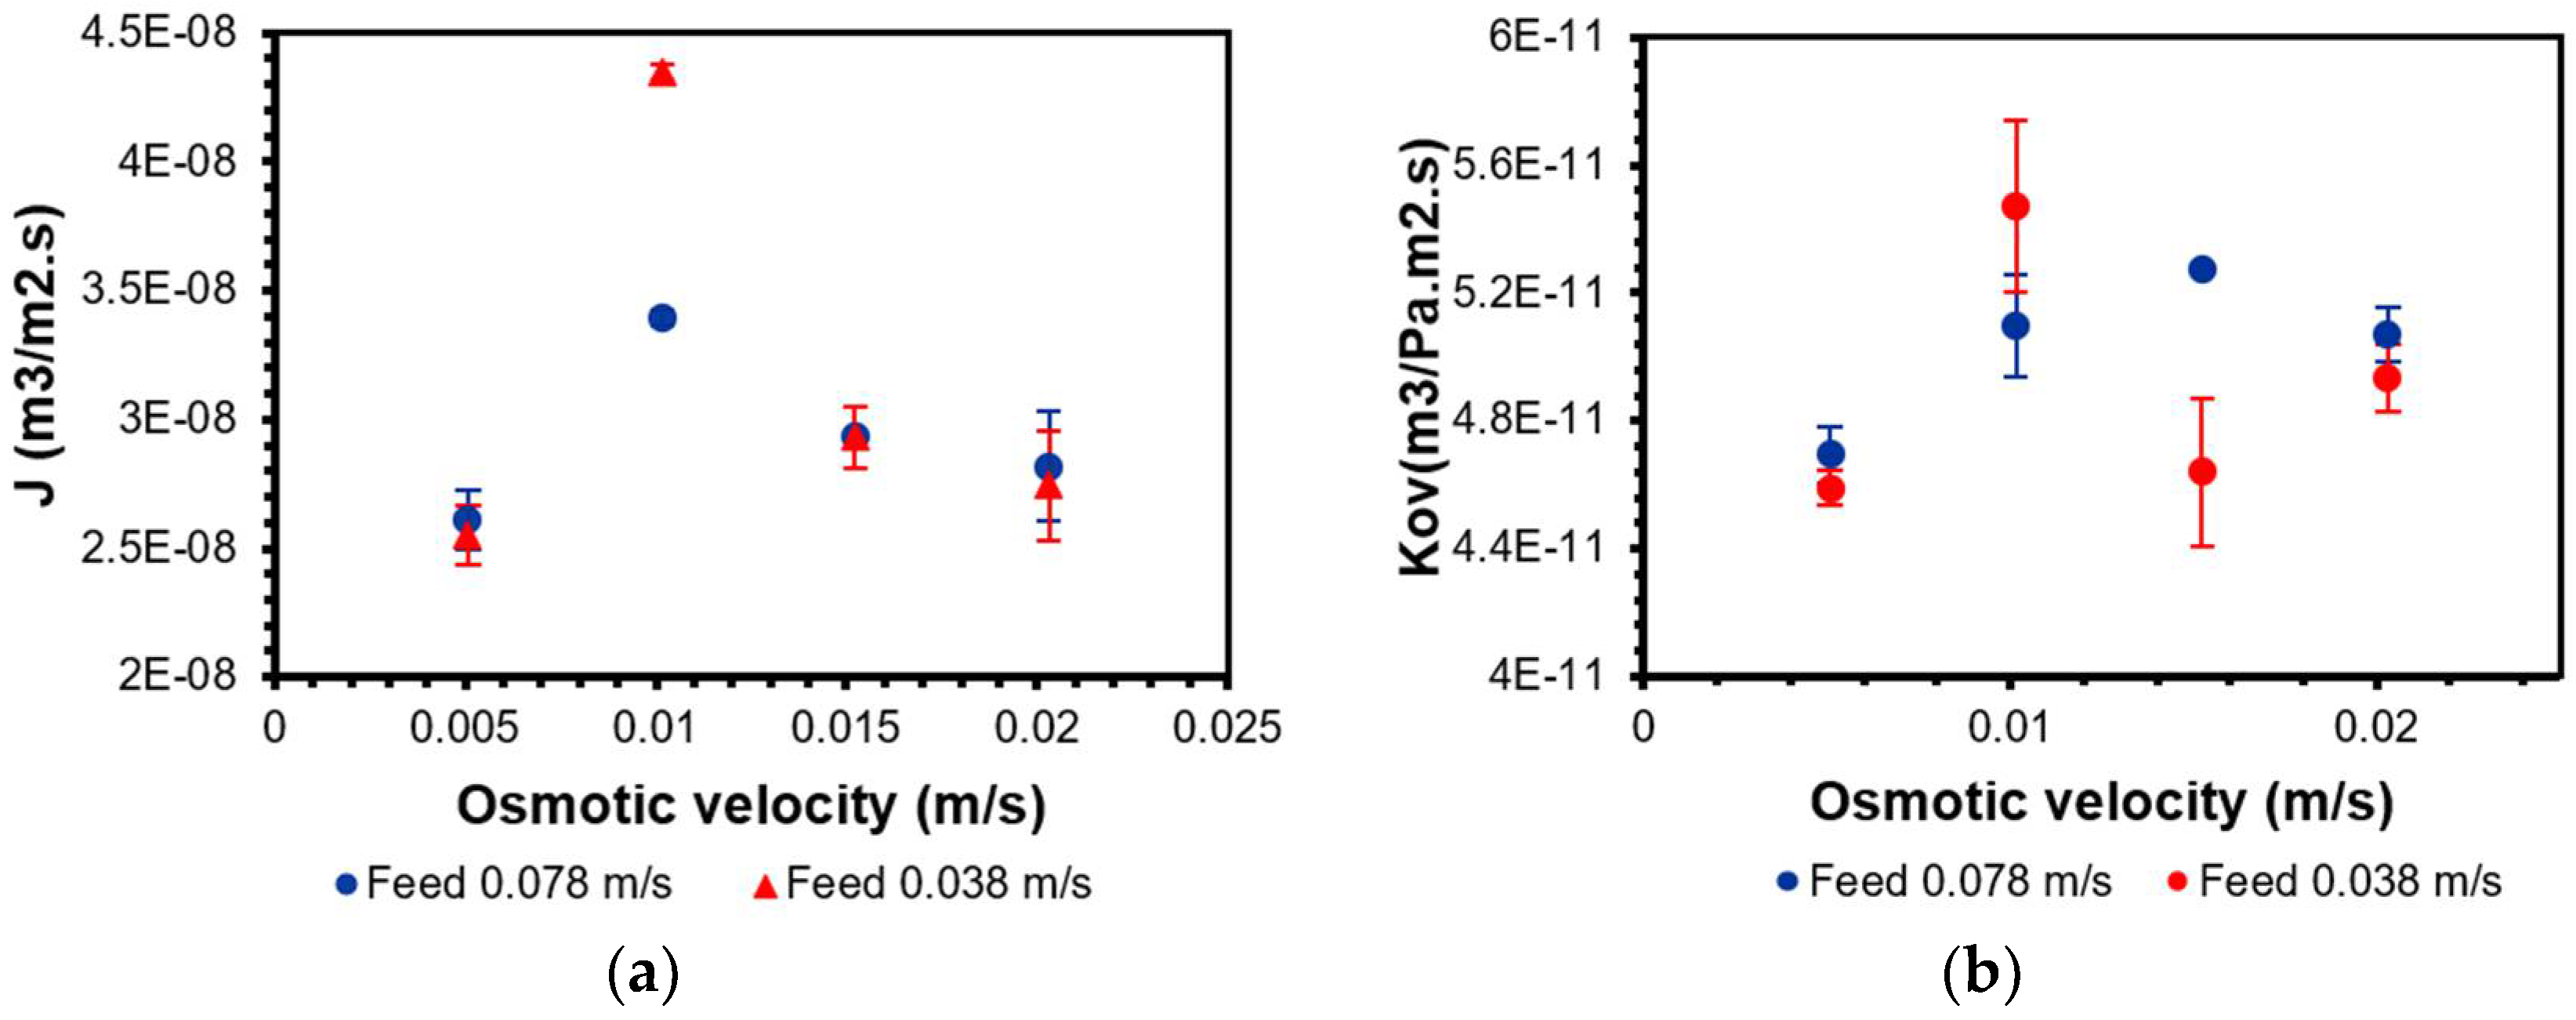
Figure 5.
Effect of the concentration of NaHCO3 in the feed solution on: (a) flux and (b) Kov. Feed velocity was 0.038 m/s, osmotic velocity was 0.01 m/s, and osmotic and feed solutions were at room temperature.
Figure 5.
Effect of the concentration of NaHCO3 in the feed solution on: (a) flux and (b) Kov. Feed velocity was 0.038 m/s, osmotic velocity was 0.01 m/s, and osmotic and feed solutions were at room temperature.
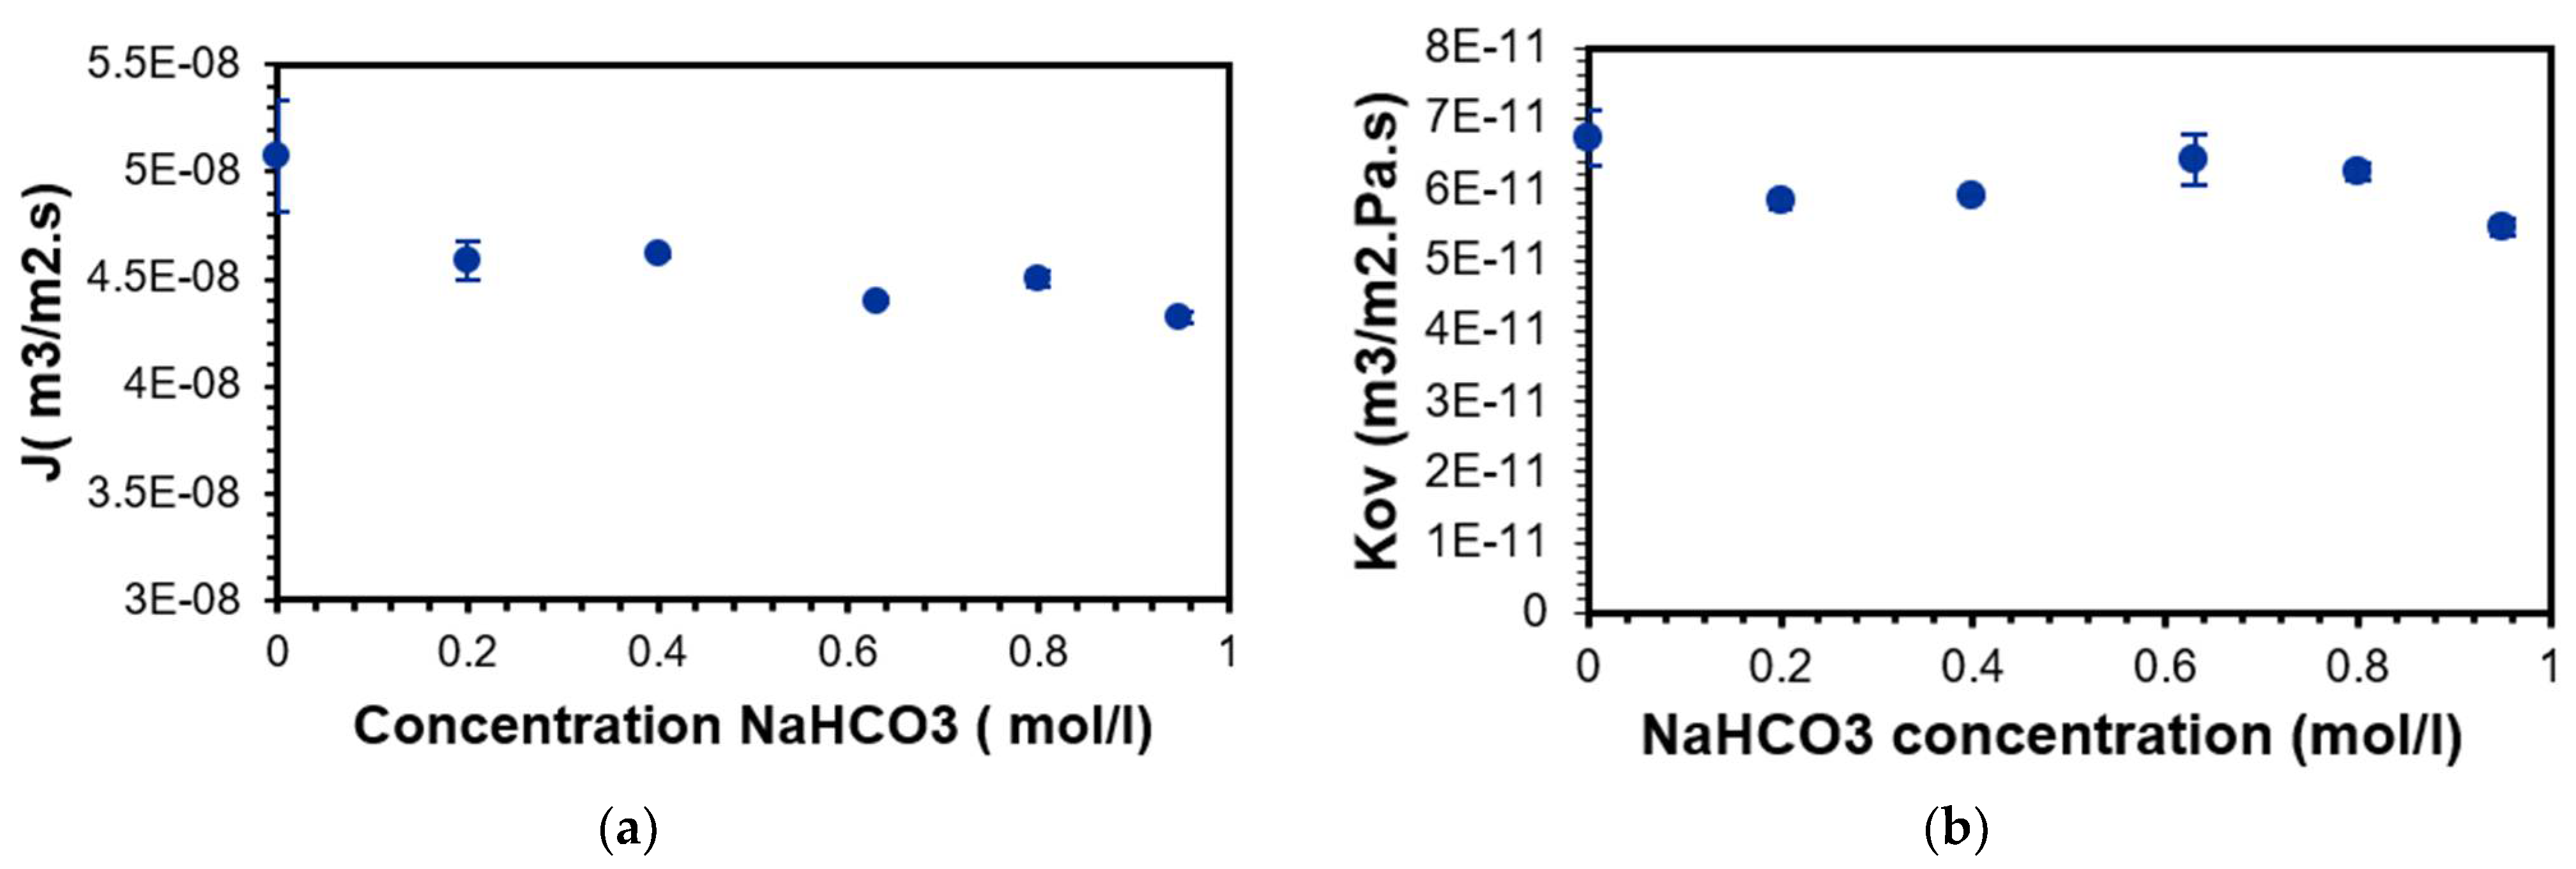
Figure 6.
(a) Flux for changes in temperature, for 0,8 mol/L of NaHCO3. (b) Kov for changes in temperature, for 0,8 mol/L of NaHCO3.
Figure 6.
(a) Flux for changes in temperature, for 0,8 mol/L of NaHCO3. (b) Kov for changes in temperature, for 0,8 mol/L of NaHCO3.
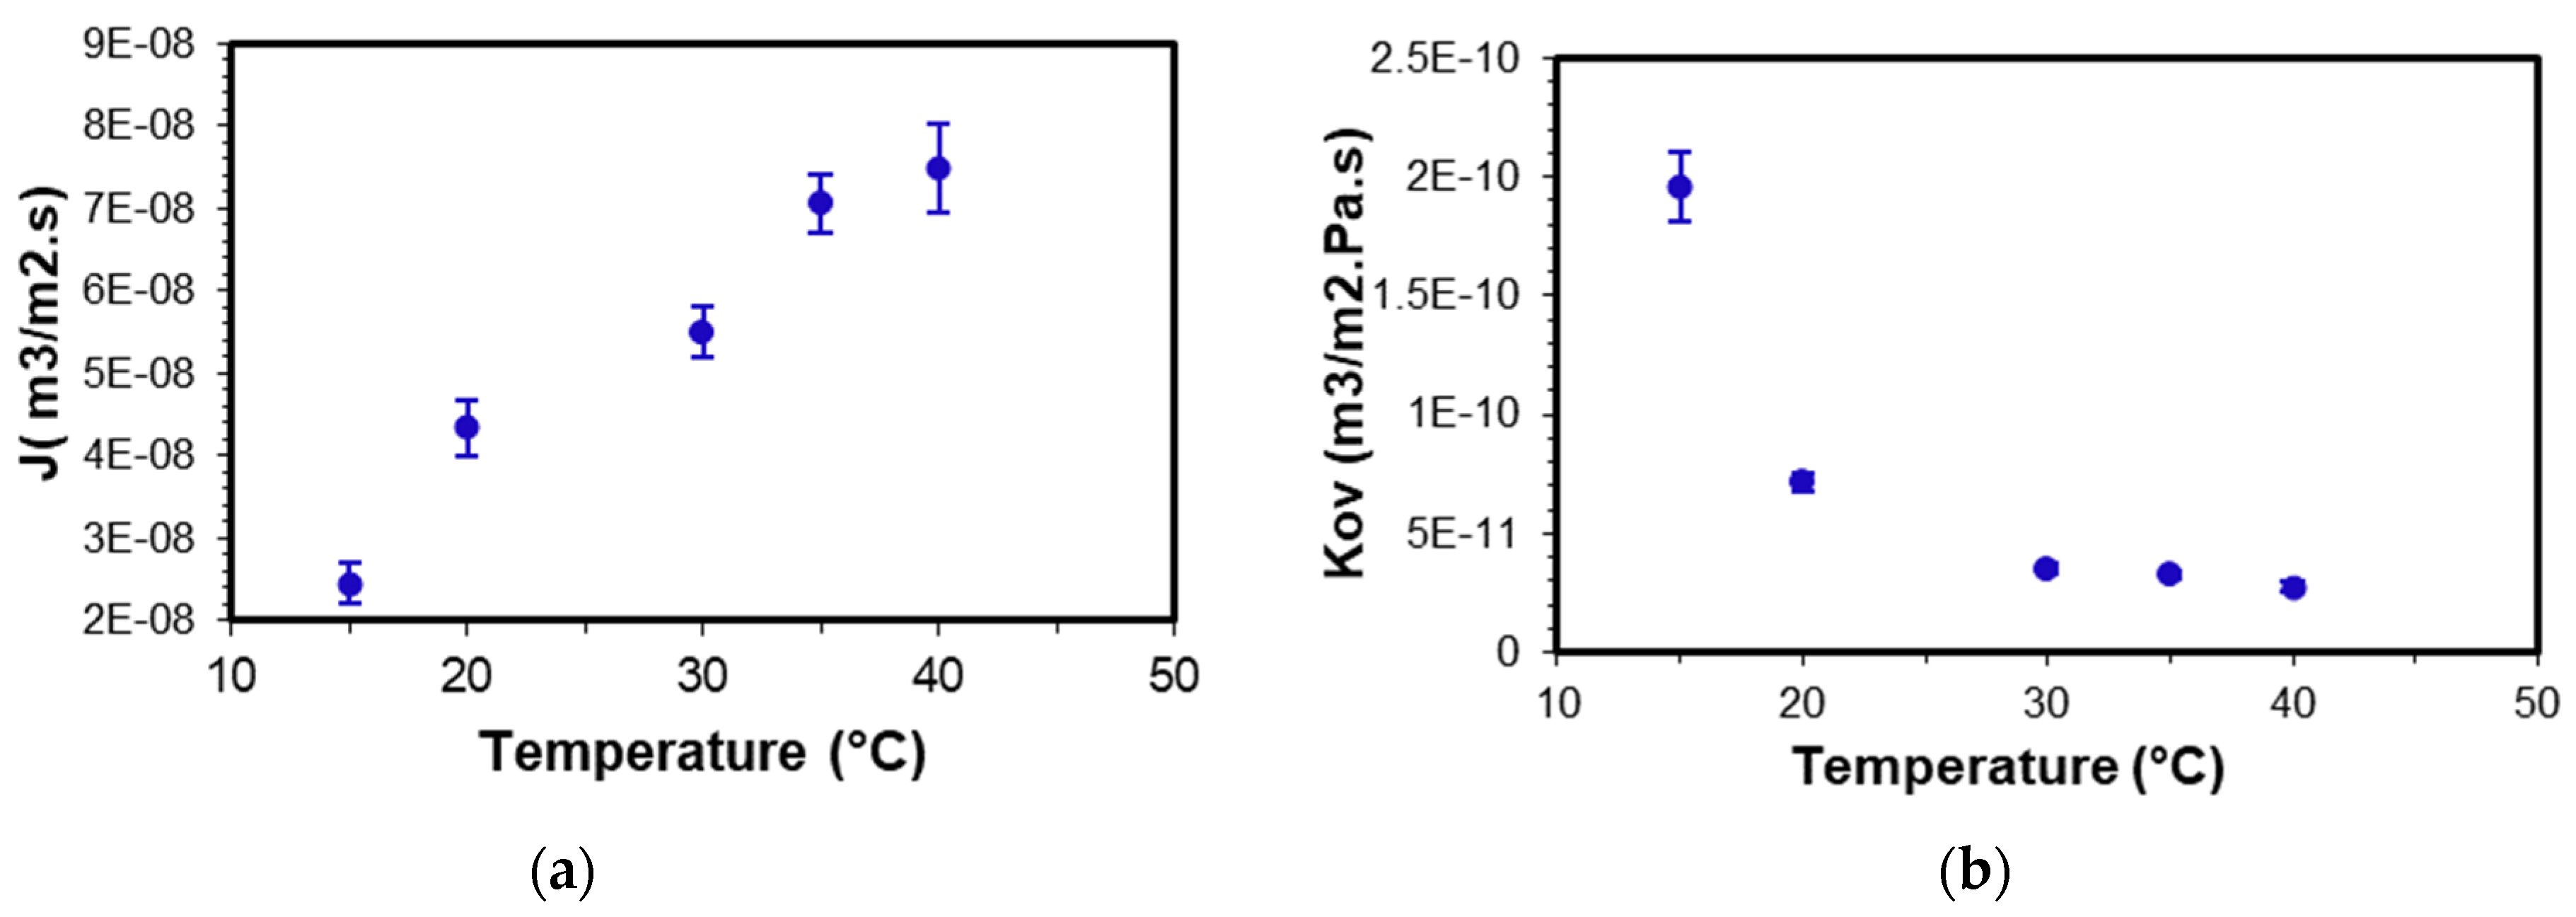
Figure 7.
SEM images of NaHCO3, comparing commercial crystals (a) with crystals obtained using osmotic membrane distillation crystallization at different temperatures: (b) 15 °C; (c) 20 °C; (d) 30 °C; (e) 35 °C; (f) 40 °C.
Figure 7.
SEM images of NaHCO3, comparing commercial crystals (a) with crystals obtained using osmotic membrane distillation crystallization at different temperatures: (b) 15 °C; (c) 20 °C; (d) 30 °C; (e) 35 °C; (f) 40 °C.
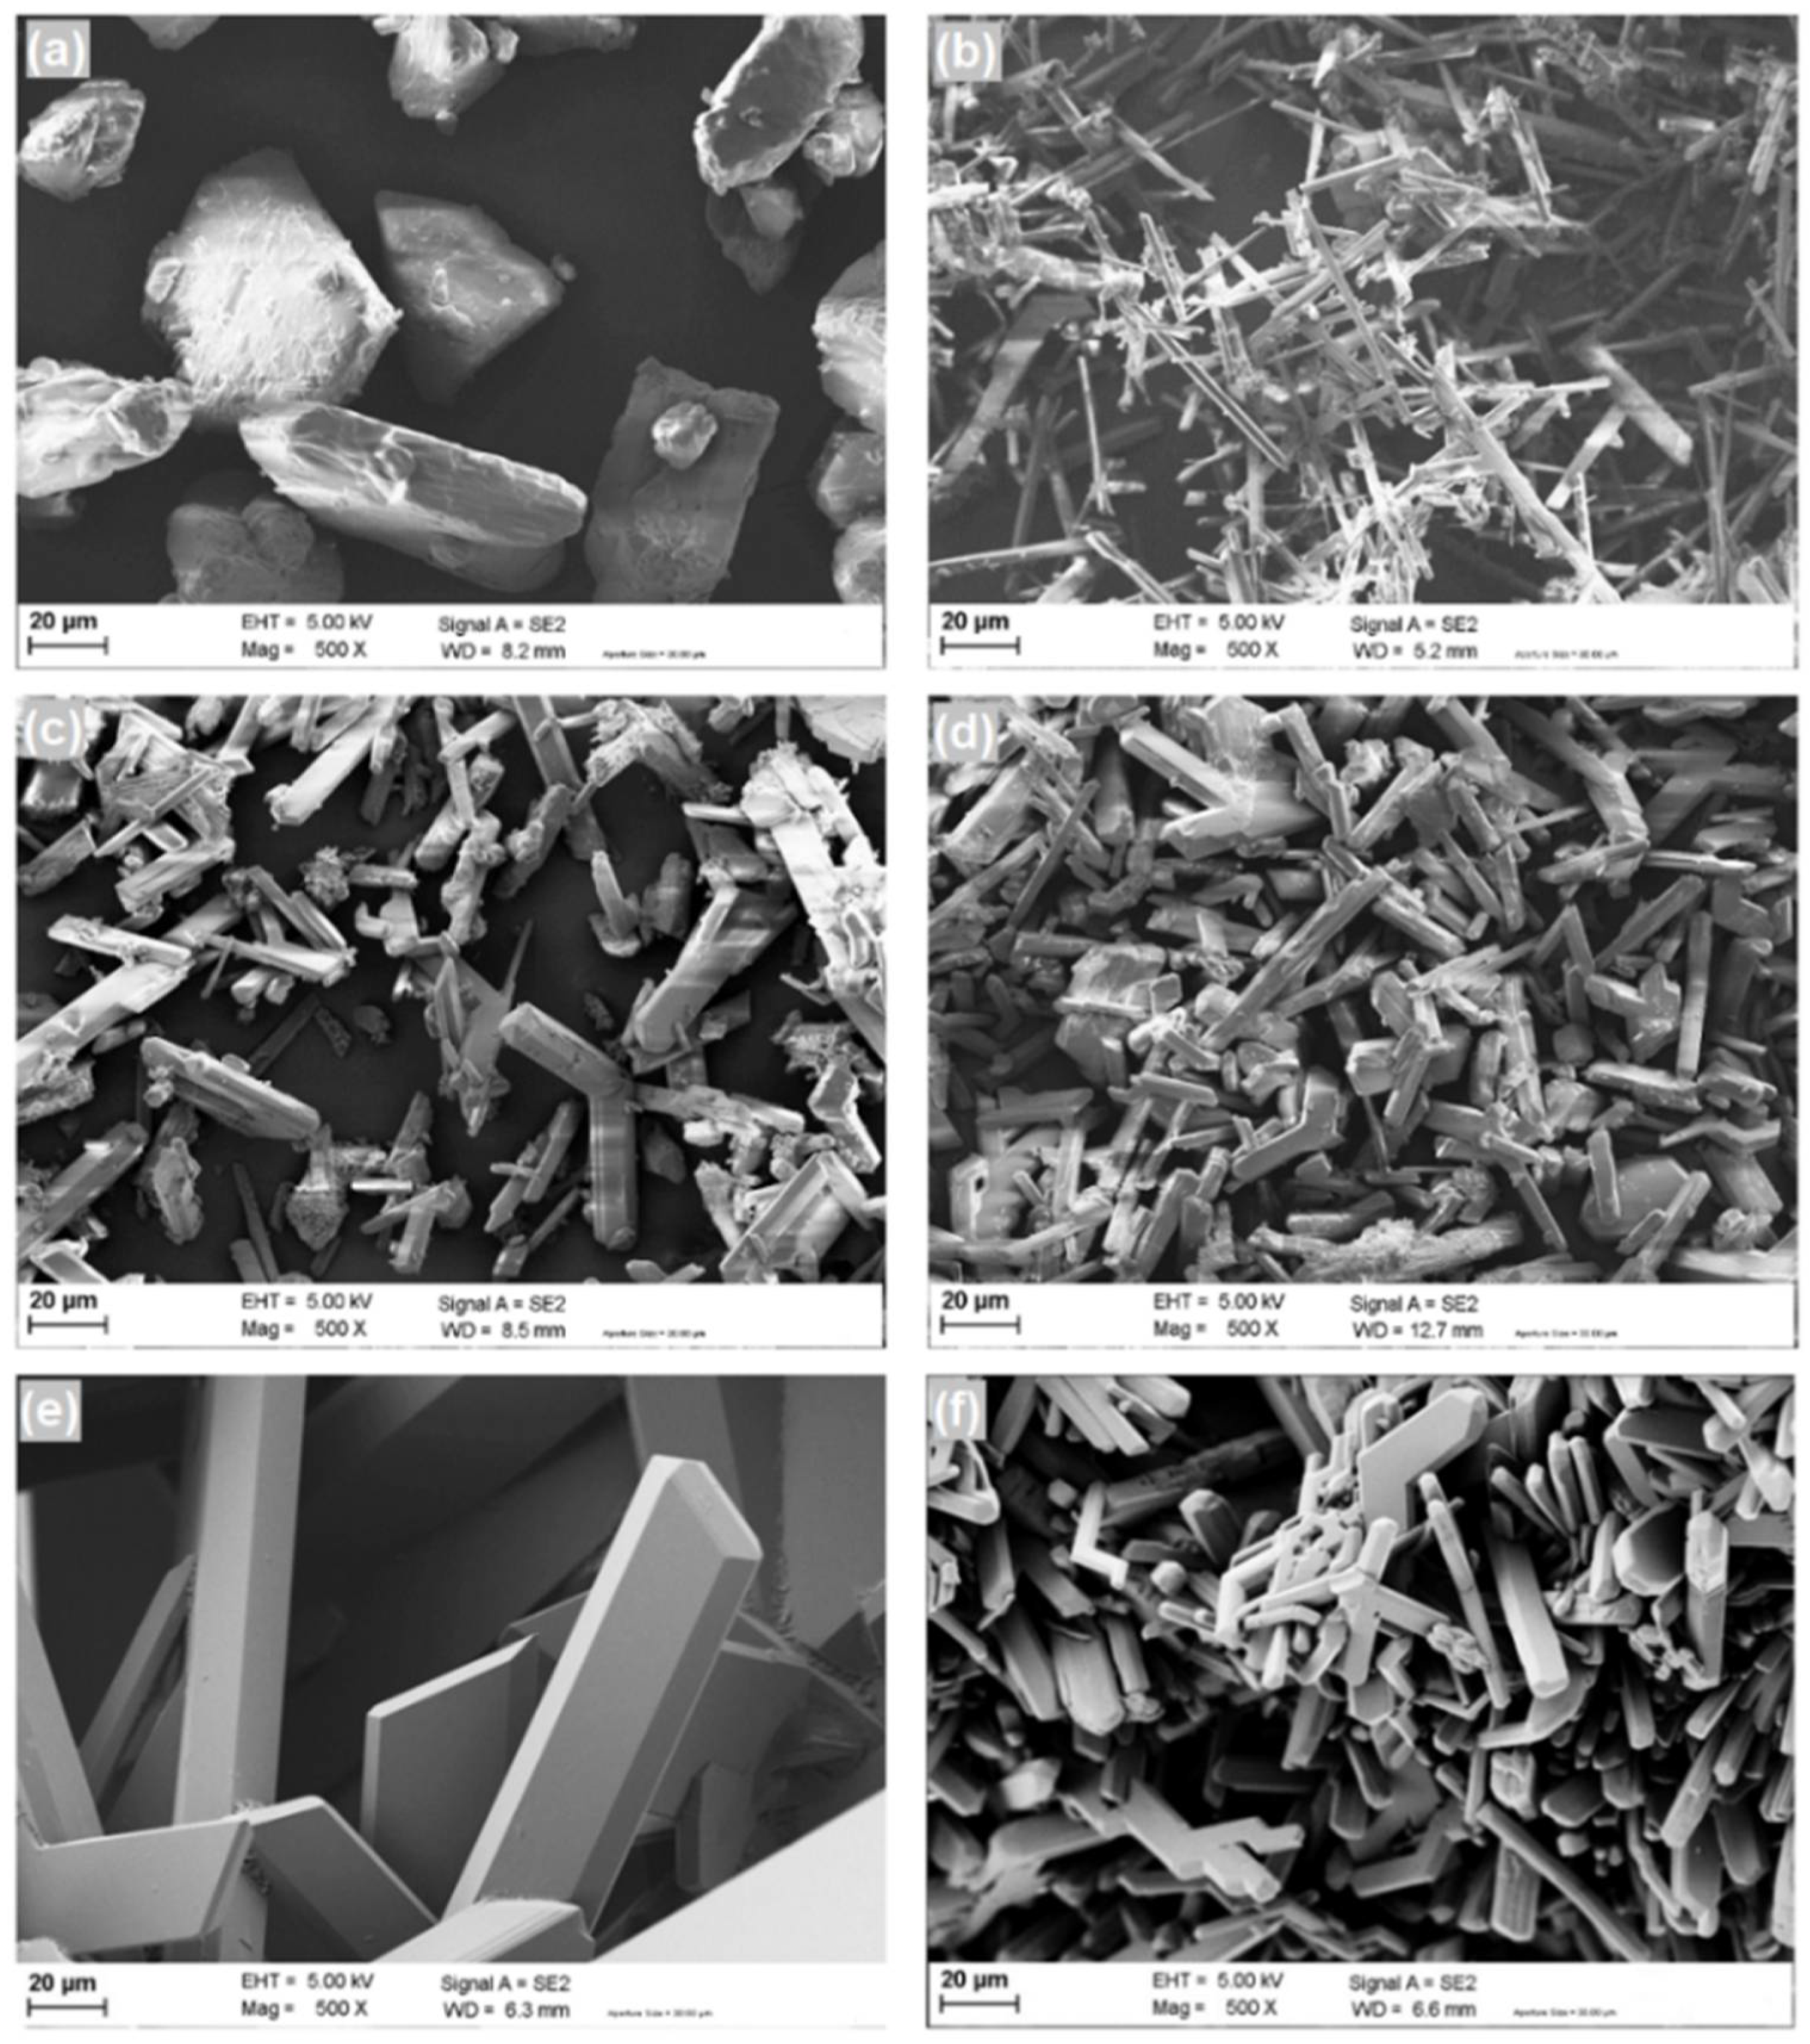
Figure 8.
NaHCO3 crystals—X-ray diffraction analysis.


Table 1.
Characteristics of the membrane contactor and hollow fibers.
| Contactor Type | Liqui-Cel® 1 × 5.5 MiniModuleTM |
|---|---|
| Module configuration | Hollow fibers |
| Housing/potting | Polycarbonate/polyurethane |
| Membrane type | X50 microporous fiber |
| Membrane material | Pp (hydrophobic) |
| Porosity | 40% |
| Effective pore size | 0.04 µm |
| Inner diameter/outer diameter | 300 µm/220 µm |
| Active surface area | 0.18 m2 |
| Number of fibers | 2300 |
Table 2.
Comparison of performance of previous membrane crystallization processes with the process in this study.
Table 2.
Comparison of performance of previous membrane crystallization processes with the process in this study.
| Reference | Membrane Process | Membrane Type | Material | Crystal Product | Jmax (kg/m2·h) | Kmax (m3/m2 Pa s) |
|---|---|---|---|---|---|---|
| [18] | OMCD | Hollow fiber | PP | NaCO3 | 0.138 | 6.53 × 10⁻¹¹ |
| [20] | VMD/DCMD | Hollow fiber | PP | NaCO3 | 0.8 and 0.11 | 4.8 × 10⁻¹¹ and 3.7 × 10⁻¹¹ |
| [25] | MDC | Flat sheet | PTFE | CaCO3, NaCl, KC | 6 | - |
| [26] | MDC | Hollow fiber | PVDF/PTFE particles | NaCl | 8 | - |
| [27] | VMDC | Hollow fiber | PVDF | Al(NO3) | 9.6 | - |
| [28] | MDC | Flat sheet | Elongated PTFE | NH4NO3 | 2–5 | - |
| This study | OMCD | Hollow fiber | PP | NaCO3 | 0.269 | 6.41 × 10⁻¹¹ |
Publisher’s Note: MDPI stays neutral with regard to jurisdictional claims in published maps and institutional affiliations. |
© 2022 by the authors. Licensee MDPI, Basel, Switzerland. This article is an open access article distributed under the terms and conditions of the Creative Commons Attribution (CC BY) license (https://creativecommons.org/licenses/by/4.0/).
Share and Cite
MDPI and ACS Style
Garcia Alvarez, M.; Sang Sefidi, V.; Beguin, M.; Collet, A.; Bahamonde Soria, R.; Luis, P. Osmotic Membrane Distillation Crystallization of NaHCO3. Energies 2022, 15, 2682. https://doi.org/10.3390/en15072682
AMA Style
Garcia Alvarez M, Sang Sefidi V, Beguin M, Collet A, Bahamonde Soria R, Luis P. Osmotic Membrane Distillation Crystallization of NaHCO3. Energies. 2022; 15(7):2682. https://doi.org/10.3390/en15072682
Chicago/Turabian StyleGarcia Alvarez, Mar, Vida Sang Sefidi, Marine Beguin, Alexandre Collet, Raul Bahamonde Soria, and Patricia Luis. 2022. "Osmotic Membrane Distillation Crystallization of NaHCO3" Energies 15, no. 7: 2682. https://doi.org/10.3390/en15072682
Note that from the first issue of 2016, this journal uses article numbers instead of page numbers. See further details here.