
Mitigating the Impact of an Official PEV Charger Deployment Plan on an Urban Grid


Department of Electrical and Computer Engineering, Hellenic Mediterranean University, GR-71410 Heraklion, Greece
*
Author to whom correspondence should be addressed.
Energies 2022, 15(4), 1321; https://doi.org/10.3390/en15041321
Submission received: 14 January 2022
/
Revised: 8 February 2022
/
Accepted: 9 February 2022
/
Published: 11 February 2022
(This article belongs to the Collection Invited Papers on Electric Vehicles)
Abstract
:Plug-in electric vehicles (PEVs) are rapidly increasing all over the world as electromobility is being promoted to reduce the greenhouse gas (GHG) emissions. PEVs locally produce zero emissions and they are more efficient in contrast to internal combustion engine vehicles. On the other hand, the impact of the uncoordinated charging of PEVs is expected to create new challenges for the established distribution grid. This article initially evaluates the impact of uncoordinated charging on the voltage regulation and transformer loading in the city of Heraklion, Greece. Then, a coordinated charging strategy is proposed to deal with the issue of transformer capacity violation by PEVs. Two cases were considered when the transformer overloading from PEV charging was taken into consideration: (a) keeping the transformer below its nominal capacity limit and (b) keeping the transformer below 90% of its nominal capacity limit. This was achieved by distributing the available capacity (nominal capacity minus the residential loads) of the transformer to the PEV chargers in a way that the aforementioned limits were satisfied. Real-world data of the distribution grid and the hourly power consumption of the city were used to validate the proposed method. Results show that possible transformer capacity violation can be tackled by the proposed coordinated charging, without exceeding the voltage regulation limits.
1. Introduction
Europe aims to be climate neutral by 2050. The transition to a climate-neutral society is imperative to build a better and sustainable future for all [1]. The electrification of the transport sector could be one of the means to achieve this goal, as it represents almost 21.5% of Europe’s greenhouse gas (GHG) emissions [2]. Especially, road transport is responsible for 72% of all GHG emissions of the transportation systems in 2019, making it the largest emitter within this sector [2].
Electric vehicles (EVs) have already made their appearance. In particular, the use of EVs has become a trend gaining increasingly more ground in response to their technical advancements and environmental benefits [3]. In Greece, the market share of plug-in electric vehicles (PEVs) has increased from 0.5% in 2019, to 2.6% in 2021 [4]. The introduction of PEVs has many benefits, such as no noise, zero emissions and better efficiency [5,6]. However, several challenges for the transportation and power systems operation have arisen due to the uncoordinated charging of PEVs, such as voltage quality problems, new congestion and demand peaks [7,8]. At the same time, PEVs could be the solution for most of the problems they cause through the provision of ancillary services to the power system [9], and through the coordination of their charging schedule [10,11,12]. Hence, it is crucial to evaluate the impact of PEV penetration on the distribution grid and to be able to recommend solutions to address potential issues.
The suitable allocation of PEV chargers has been previously studied, while taking into consideration several points of view, such as different scenarios, methodologies and objectives. Indicatively, in [13], the authors proposed a Geographic Information System (GIS) method for the optimal allocation of EV chargers in the city of Bolzano and in the province of Alto Adige, exploiting residential data, parking places, the electricity network and already installed charging points. In [14], a tool and a genetic algorithm (GA) were developed in R, a language and environment for statistical computing, to find the more suitable location for the charging infrastructure of the city of Thessaloniki. A list of candidate EV charging points, the distance between the potential charging locations, the expected demand per location, the desired number of stations for the examined scenario, the average cover distance radius per station, the charging speed and the average generalized cost per km were given as inputs.
Apart from the suitable allocation, the explicit impact of PEVs on the distribution grid is currently under investigation by the distribution system operators, municipalities, governments and of course, the scientific community. Furthermore, in some cases, charging strategies have been proposed to cope with the problems that PEV charging creates to the electric grid. The study in [15] investigated the effect of EV chargers on substation load profile, voltage profile, and harmonic profile of the Thailand grid. The authors of [16] examined the maximum number of three-phase chargers in a low-voltage distribution grid, considering voltage management by injecting reactive power from the chargers to the electric grid. In [17], the authors evaluate the voltage violation, voltage unbalance, feeders’ thermal limit and transformers’ thermal limit in a residential LV distribution network in Malaysia. Three scenarios were created: (1) unbalanced EV charging, (2) evenly distributed EV charging and (3) controlled EV charging. In [18], the authors mitigate the voltage unbalance, which is caused by uncoordinated EV charging, in an Urban Distribution Network with a time-varying pricing scheme. In [19], a prototype park was used to examine the impact of EV chargers on the LV distribution network in terms of harmonic distortion and power factor. Three charging strategies, depending on the cost, the valley filling or the GHG emission, were proposed in [20]. Voltage drop, thermal rating of cables, voltage unbalance, photovoltaics self-consumption and electrical grid losses were the examined criteria. In [21], a steady-state analysis of a distribution power system was proposed to evaluate the proper voltage variation, considering the additional load demand during different charging strategies of EVs. In [22], the authors proposed the location of charging stations within the administrative boundary of Heraklion, taking as consideration parameters of the existing parking spaces of all kinds, data from the official urban plan, land use characteristics, transport conditions in terms of hierarchy of the road network and transport flows, including public transportation vehicles. They also proposed a coordinated charging strategy in order to deal with the grid congestion at the level of 20 kV, which is the medium-voltage substation. Nevertheless, the power system operation was not analytically examined under the considered scenarios.
Transmission and distribution transformers are an important part of the distribution network and PEV charging also heavily impacts their operation. In [23,24], the authors show that the unmanaged charging of an increasing number of EVs has adverse impacts on distribution transformers, i.e., transformer overloading, aging rate and performance. In [25], the authors have developed different charging patterns, using a probabilistic model for vehicle charging start time and duration of charging in order to analyze the degradation on distribution transformers because of the charging of the PEVs. The authors in [26] performed a similar study by examining the impact of EV battery charging on distribution transformers. Both studies concluded that a simple charging strategy could help in reducing the transformer loss of life duration. In [27], the authors evaluated the impact of current harmonics generated by two types of EV chargers on power loss and temperature rise of distribution transformers. In [28], the authors proposed a proportional distribution of the power to the charging piles of a charging station. The authors in [29] examined the transformer overloading issue and the possible voltage instability, when EV charging takes place. In particular, they proposed a fuzzy logic control system, embedded within the EV supply equipment, in order to deal with these issues. In [30], the authors used various charging strategies in order to study the effects of EV charging on the grid level demand and the distribution transformers.
Even if the PEVs’ charging impact to the distribution grid operation has been studied thoroughly in the literature, dealing with the issue of transformer capacity violation without changing the parking/charging habit of the PEVs’ drivers while at the same time fulfilling the PEVs’ charging target, has not been widely investigated. Moreover, rarely a real distribution system, PEVs’ deployment plans are used for the verification of the proposed methods. The combination of a simple way to cope with transformer overloading, without changing the parking/charging habit of the PEVs’ drivers and its evaluation in a real-world distribution grid highlights the scope of this paper. In particular, this paper aims at evaluating the impact of PEVs charging on a real MV/LV distribution network, taking into consideration the chargers’ allocation, which was proposed in [22], and it further proposes a simple strategy to relieve the transformers from overloading due to PEVs’ charging. Particularly, the chargers were connected to the nearest transformer of the location pointed out at the deployment plan and multiple scenarios were created. It was observed that under an uncoordinated charging system, transformer capacity was not enough in some of the transformers in which PEV chargers were connected. On the contrary, the proposed charging strategy managed to keep the transformer loading under a specific limit and at the same time, the charging objective of all the PEVs was satisfied. The understanding of how the PEVs charging could negatively affect the MV/LV distribution network [7,8] could provide insight on what charging strategies could be applied by the distribution operator and the parking lot or charging network operators in order to ensure the proper operation of the electrical grid.
The rest of the paper is organized as follows: Section 2 describes the methodology, the creation and processing of the input data; Section 3 presents the proposed coordinated charging strategy; Section 4, simulation results obtained for both charging strategies are presented and discussed; and finally, Section 5, concludes the paper.
2. Methodology
In order to evaluate the impact of uncoordinated charging on the grid and propose a coordinated charging strategy, a considerable amount of data is required. Here, to describe the methodology of this paper, data from a real residential grid, i.e., from the city of Heraklion, will be employed as the case study of the paper is concerned with the same electrical network. Part of this data, i.e., PEVs appearance and chargers, was created according to assumptions about the profile of Heraklion city’s habitants. The other part of the data was based on actual information of the city of Heraklion and its power network. In the sequel of this section, the required data to evaluate the impact of uncoordinated charging to the distribution network as well as a proposal for an advanced coordinated strategy are presented.
2.1. Distribution Grid
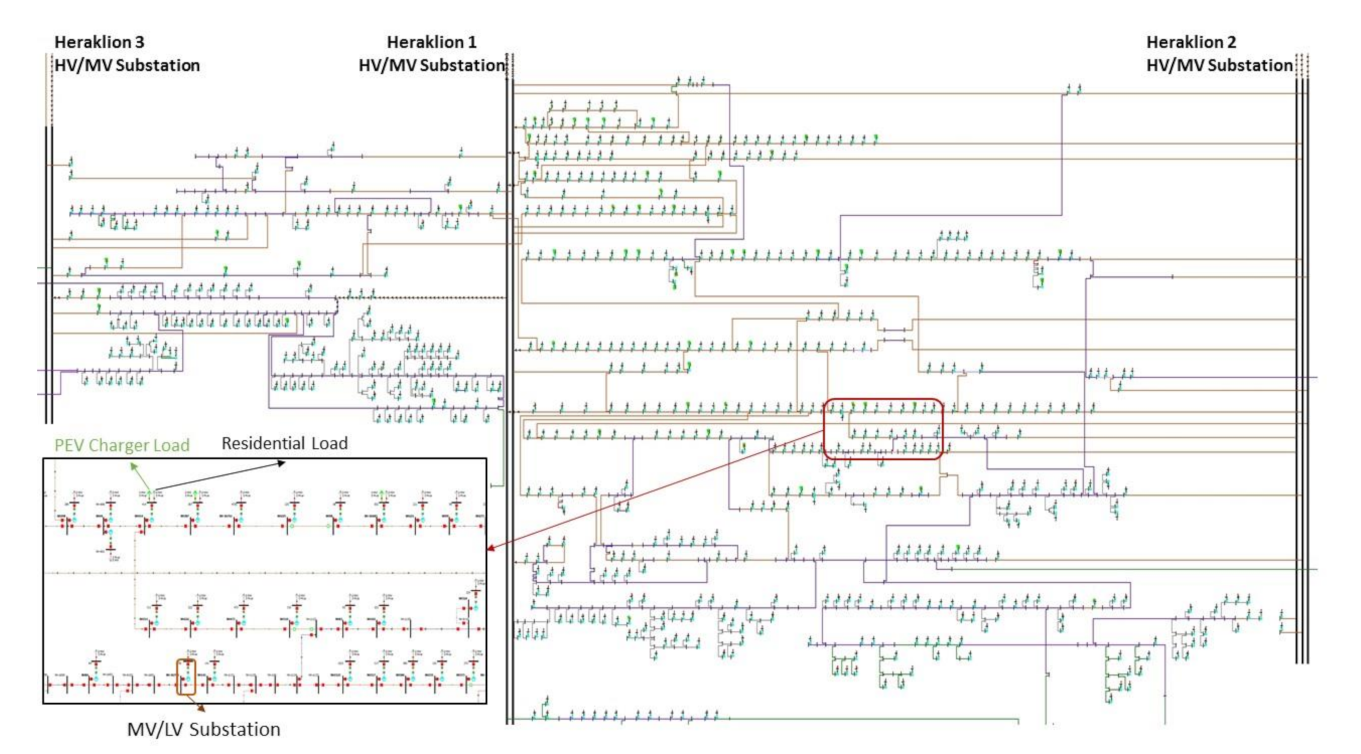
The distribution grid of the Heraklion is at the level of 20 kV, its feeders start from three high-to-medium voltage (HV/MV) substations and the medium-to-low voltage (MV/LV) is at the level of 20 kV/400 V. The data of the distribution grid were provided to the authors by the system operator, HEDNO [31], and it was then designed to the PowerWorld simulator for the needs of this paper. The single-line diagram of the medium voltage (20 kV) distribution network of the city is presented in Figure 1.
2.2. PEV Type
Fifteen representative models of PEVs were used. Their technical characteristics are shown in Table 1. Each PEV type appearance was approximately calculated as recorded in [22]. There are three types of PEVs: the EVs, the electric two-wheelers (ETW) and the electric minibuses (EMB). The EV appearance percentage was calculated from [32]. Smaller ETW, with regards to their horsepower, are considered to be higher in number compare to the bigger motorbikes, because of their lower cost. Finally, in case that the on-board charger limitation was not known, it was assigned a value that was considered more suitable. That value appears with the sign “*”.
2.3. Charger Type
This study takes into consideration the proposed charger type and the location that was proposed in [22]. There are six types of charges that were used in the aforementioned study, whereas their basic technical info is presented in Table 2. Finally, the column “PEV charger” represents which type of charger could connect each PEV, according to [22]. Taking into consideration the location of the chargers from [22], each PEV charger was connected to the nearest transformer of its location.
2.4. Arrivals, Departures and State of Charge of PEVs
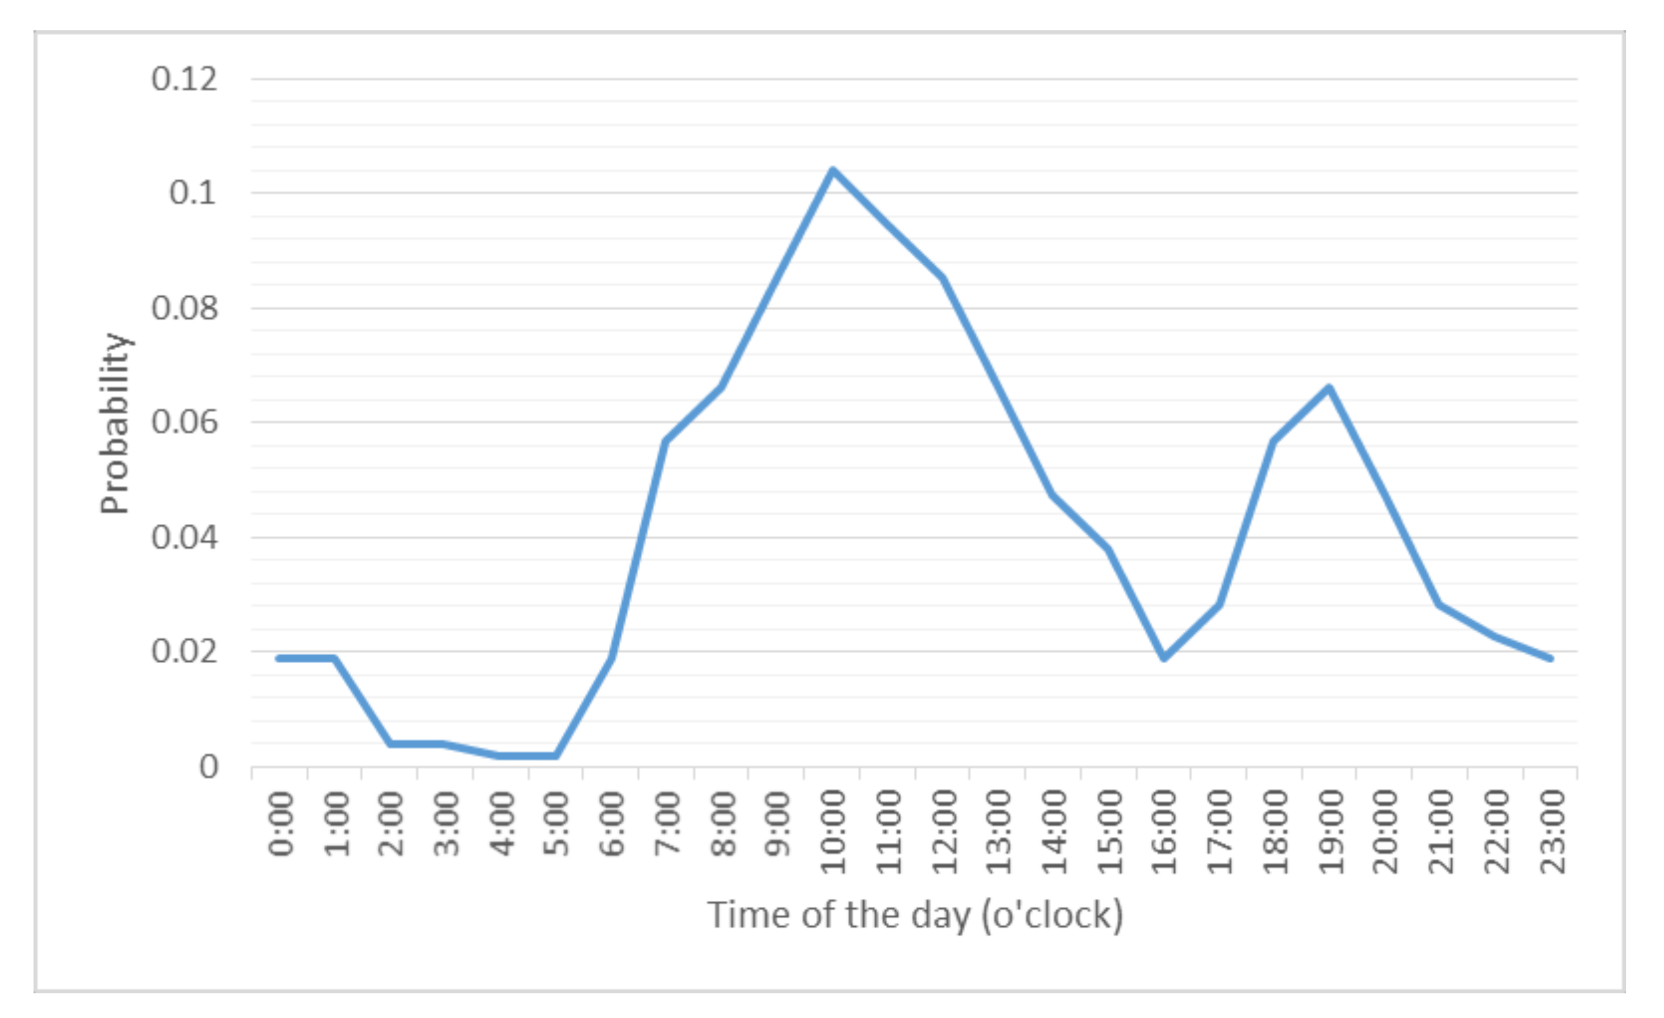
The probability of the arriving time of each PEV is presented in Figure 2. Most people go to work in the morning between 7:00 to 9:00 and in the evening between 16:00 to 18:00. It was considered that the majority of the PEVs’ arrival would happen between the time that the shops and public and private services open and a couple of hours later when people would visit them. The arrival probability of PEVs is shown in Figure 2.
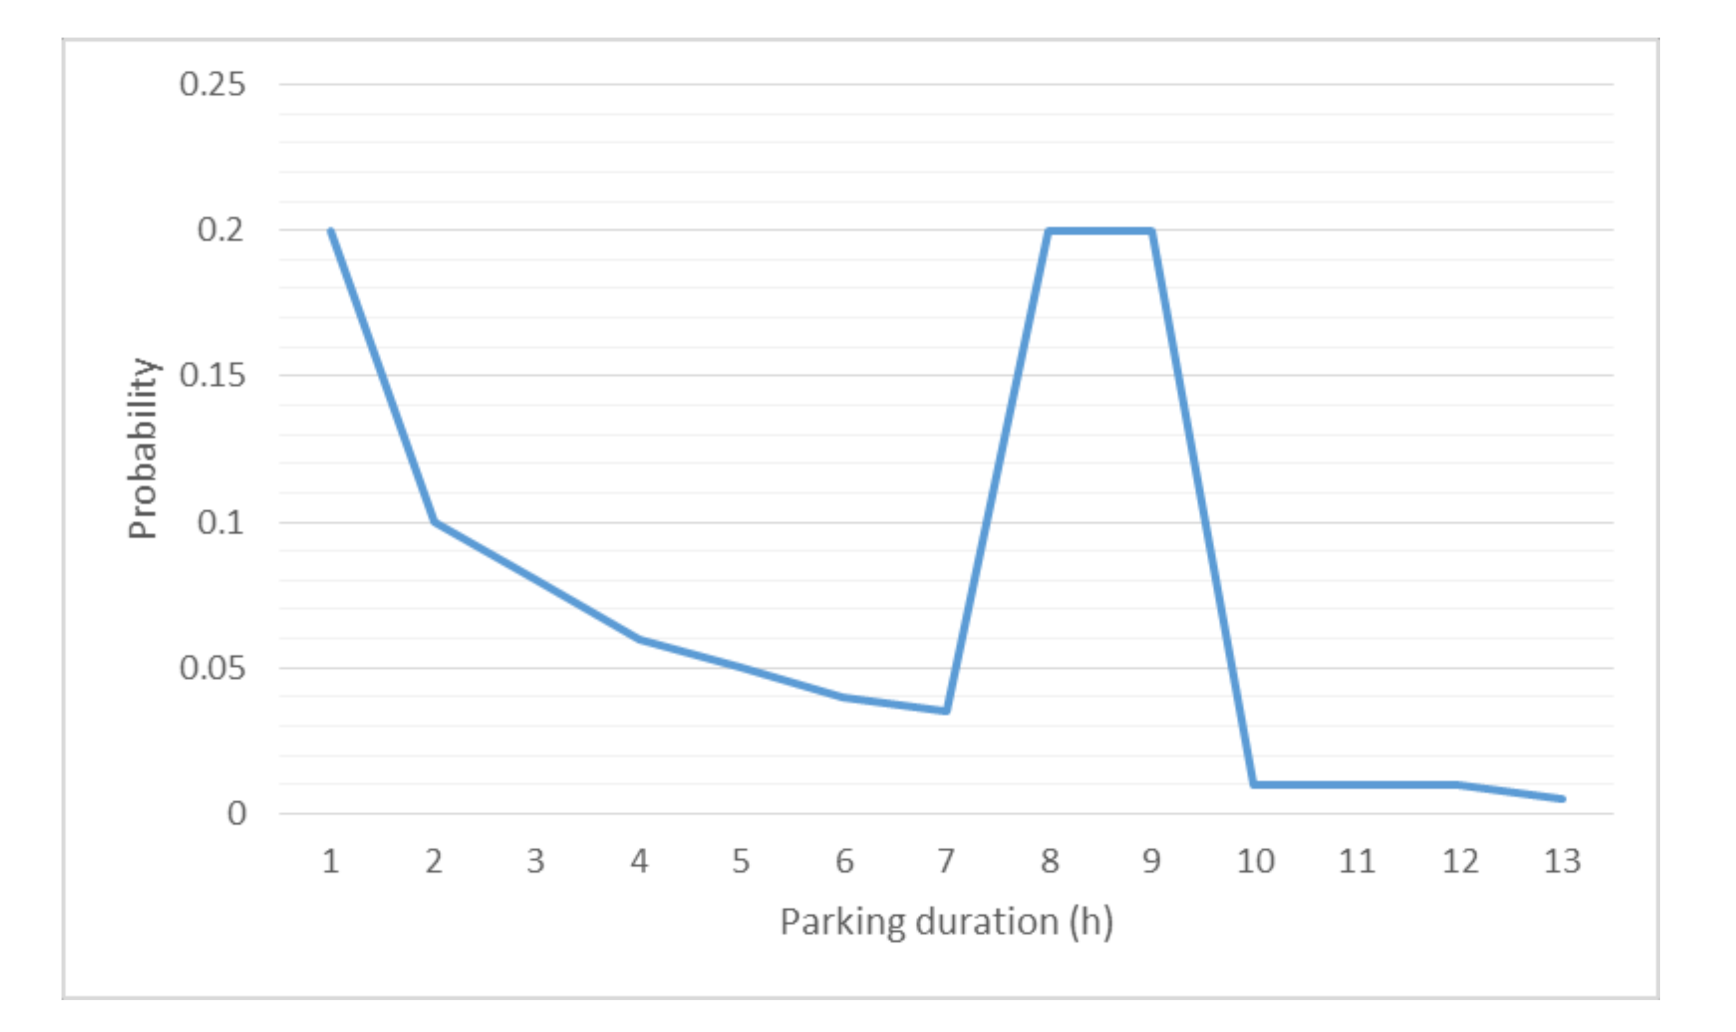
The probability of parking duration of each PEV is presented in Figure 3. It was considered that most people work 8–9 h. Additionally, many people would go downtown for errands that take a small amount of time to be completed. Thus, most departure would happen an hour or eight hours after the connection time of the PEVs. The departure time of each PEV was calculated as the sum of its arriving time and its parking duration.
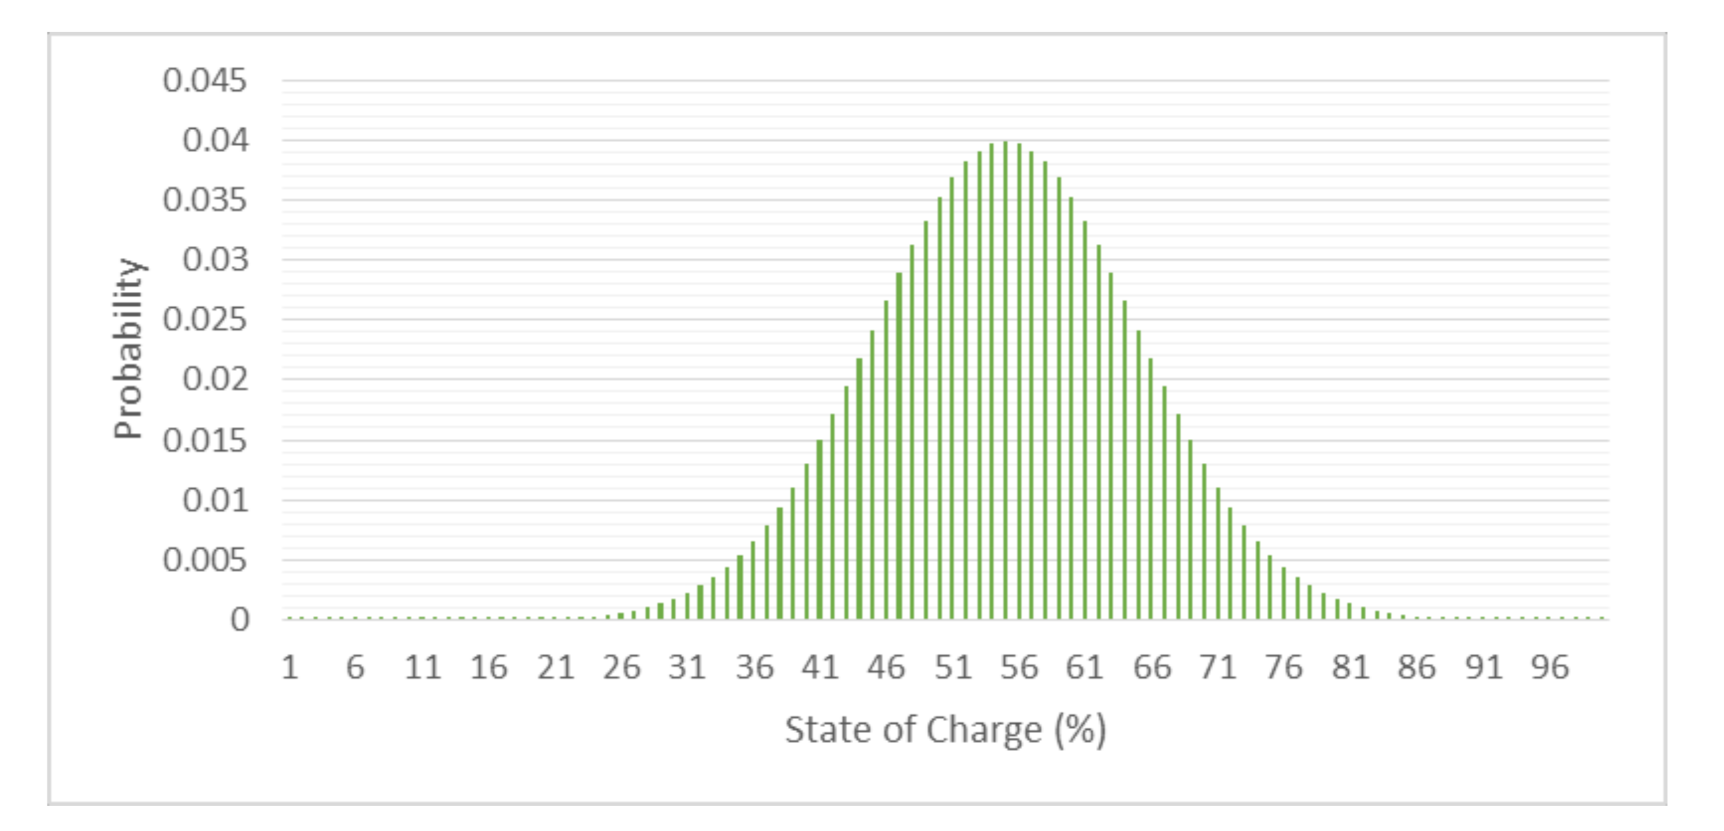
When the PEVs are connected to the chargers, the residual state of charge of the PEVs (SoCArr) is a random number that is assigned to each arriving PEV and follows the normal distribution, with μ = 55 and σ = 10 [10]. The probability mass function used to estimate the SoCArr is illustrated in Figure 4.
As desirable SOC target (SOCt) was considered a random number between 90 and 100.
2.5. Feeders Load
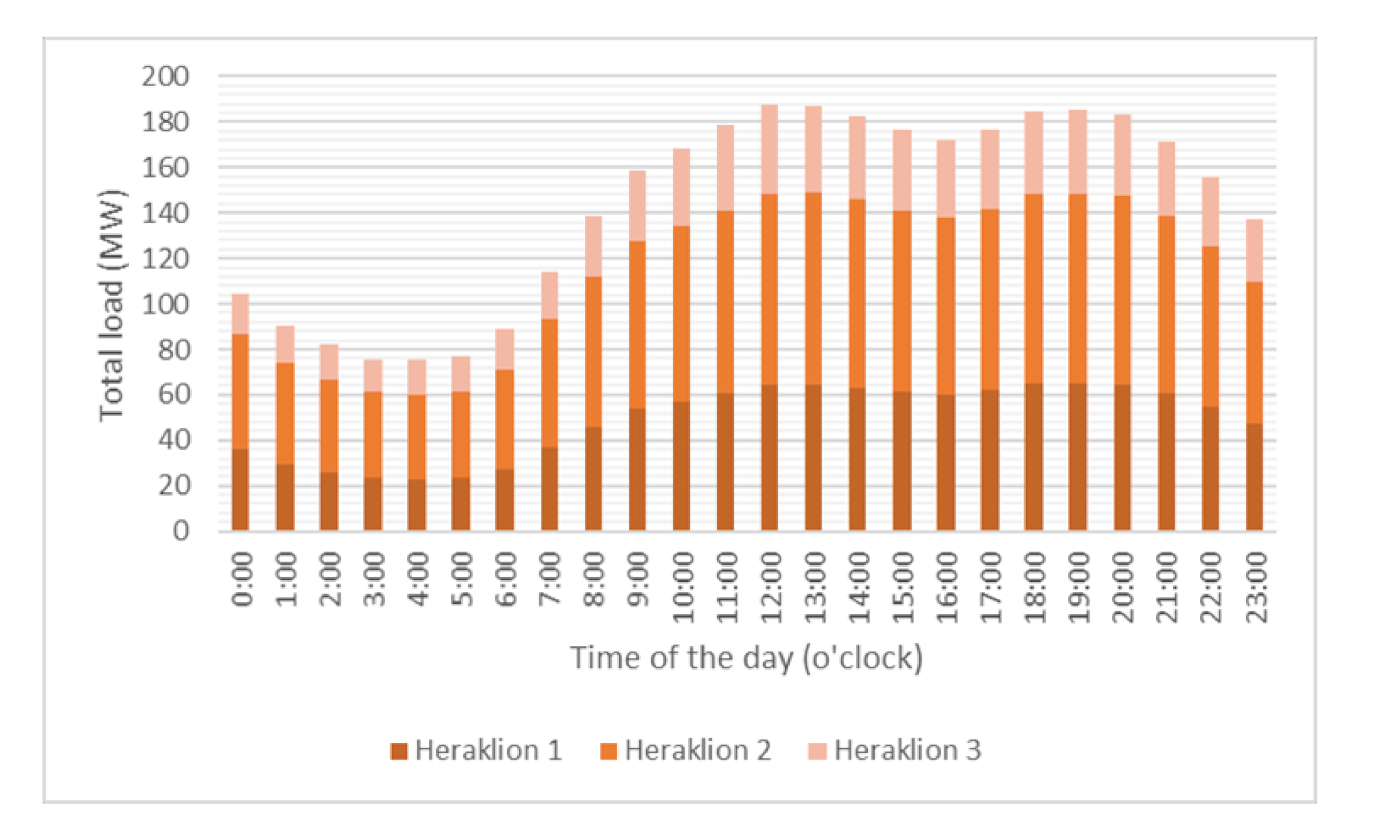
The distribution grid of the city of Heraklion, which was chosen for the case study of this paper, is at the level of 20 kV and its feeders start from three high-to-medium voltage (HV/MV) substations. The consumption of these three substations (Heraklion 1, Heraklion 2 and Heraklion 3) for the year 2019 was extracted from the independent power transmission operator (IPTO) [48]. It was found that 8 January 2019 was the day with the highest power consumption. That day was considered as the examined day of this study as it is the day with the highest congestion of the year, in the distribution grid. The total load of the three high voltage substations is represented in Figure 5 and it was distributed equally to the MV/LV substations. For the residential loads, a 0.97 power factor was assumed.
3. Proposed Coordinated Charging Strategy
The charging strategy (CS), which is applied for the charging of PEVs plays an important role in the final electricity demand curve.
3.1. Selection of Charger
The time horizon was divided into time slots with length Δt = 1 h. In this period, the external environment is considered unchanged. Depending on the type of PEV (electric vehicles (EVs), electric two wheelers (ETW), electric minibus (EMB)), there are different spots for charging. The EVs charge in an AC 7 kW, in an AC 22 kW, in a DC 50 kW and in a DC 100 kW charger. The ETW charge in a 3.7 kW charger and the EM charge in a DC 6 kW, in a DC 50 kW and in a DC 100 kW charger. In the case of EVs, the parking duration is checked to confirm if it is enough to charge in an AC charger.
where is the maximum energy that the charger of the EV could give to the ith EV if it operates with its nominal power, under the charging limitation of the EV, during the parking duration. is the energy required for the ith EV to achieve its charging target before its departure.
If the charging at an AC charger is not adequate to reach the EV its charging target, then the availability of the DC 50 kW chargers is checked, and the same process takes place.
Similar with the DC 100 kW.
Supposing that there is not a charger that could charge the EV to the SOCt at the time of departure, then a new departure time is calculated. In order for the new departure time to be as close to the departure time as the driver desires, the EV would charge, depending on the availability, following the priority order of the chargers: DC 100 kW, DC 50 kW and AC 22 kW. The calculation of the new departure time would occur according to the type of charger and the charging limitation of each PEV. A similar process to choose a suitable charger is followed for the EMB.
The charging efficiency was considered 0.93. It represents the losses (cabling, EV battery and conversion losses) during the charge process.
3.2. CS1: Uncoordinated Charging
In order to justify the need for a coordinated charging strategy, the issues that the uncoordinated charging would create need to first be examined. In this subsection, the assumed uncoordinated strategy is presented.
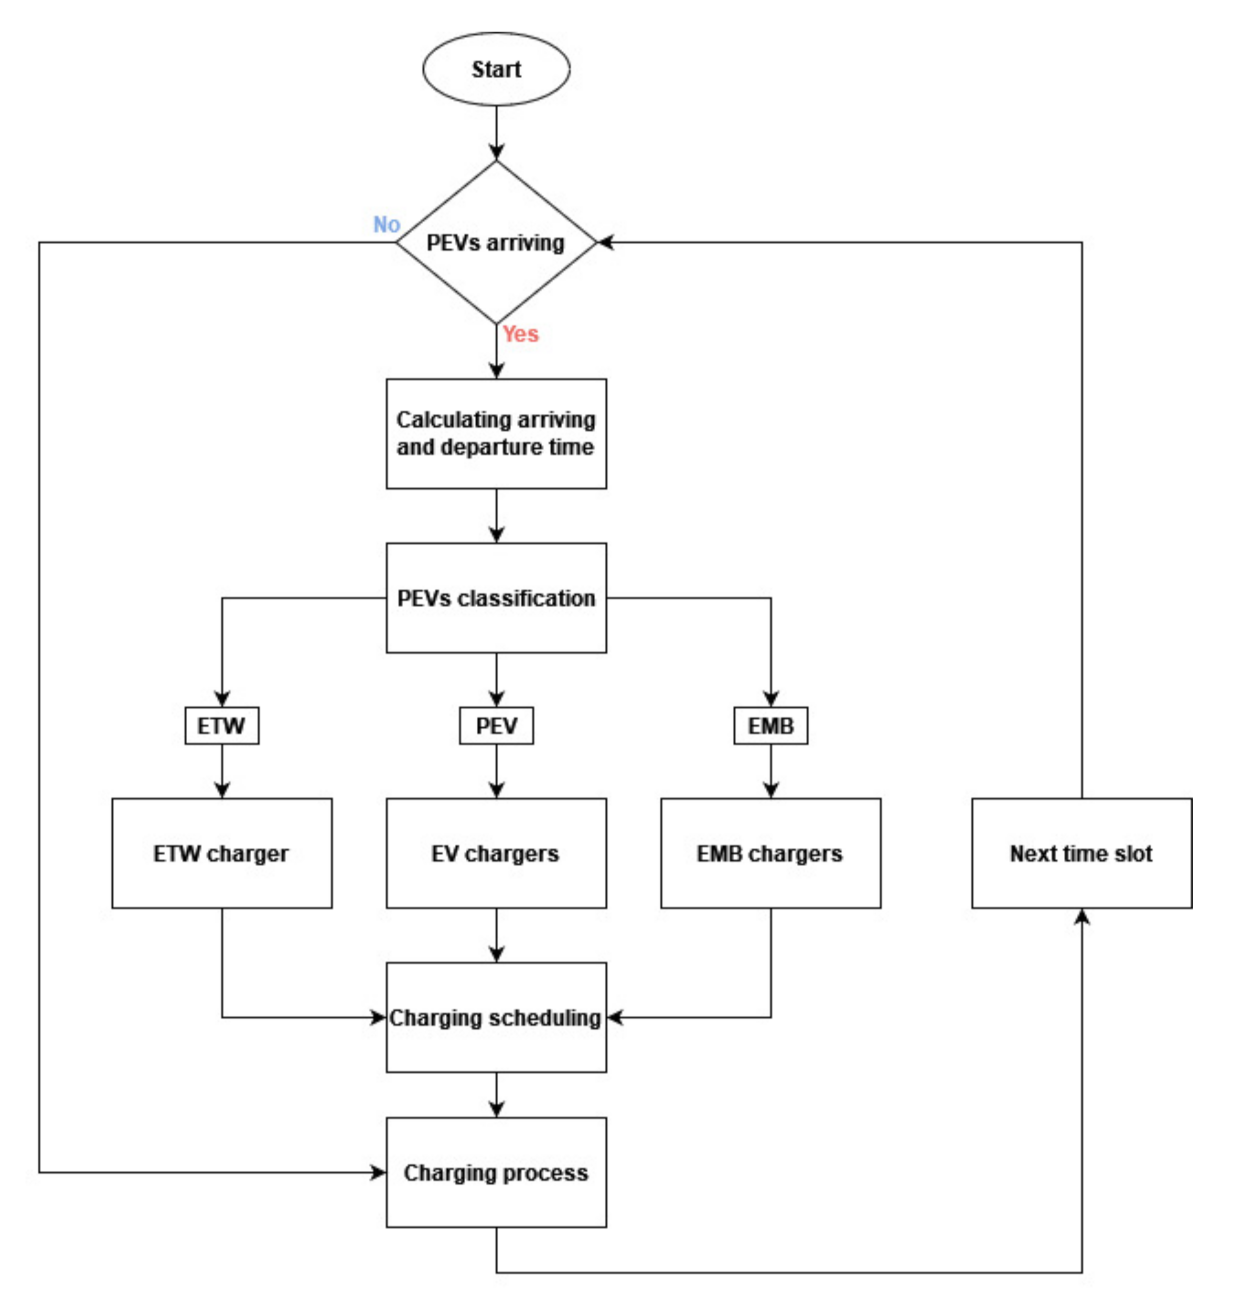
In this strategy, PEV starts charging at the time that they are connected to the charger. Initially, the algorithm is calculated for each time slot for the number of PEVs, which has been estimated according to the arrival probability (Figure 2). Then, the type of the PEV is estimated depending on the possibility of their appearance (Table 1). The random selection of the charger follows, as described in Section 3.1. The charging rate depends on the charging limits of each PEV and the nominal power of the charger that it connects with, as shown in Equations (1)–(4). The PEV charges until it reaches the SOC target as formulated in Equations (5) and (6). Then, it remains at the charger until the departure time, without exchanging any energy with the grid. In that scenario, the capacity limits of the transformers are not taken into consideration. The process of the uncoordinated charging strategy is shown in Figure 6.
where is the maximum power output of the charger, / is the on-board charger limitation when the PEV charges in an AC and DC charger, respectively. tA and tD are the time slots that the PEV is plugged in and unplugged from the charger, respectively. is the charger power of the ith PEV at the tth time slot. c is a binary variable and set to 1 when the PEV is on charging mode, Et is the energy that the ith PEV has received at the tth time slot, ce is the charging efficiency which was considered 0.93, is the energy required to fulfill the ith PEV in its charging requirement.
3.3. CS2: Coordinated Charging
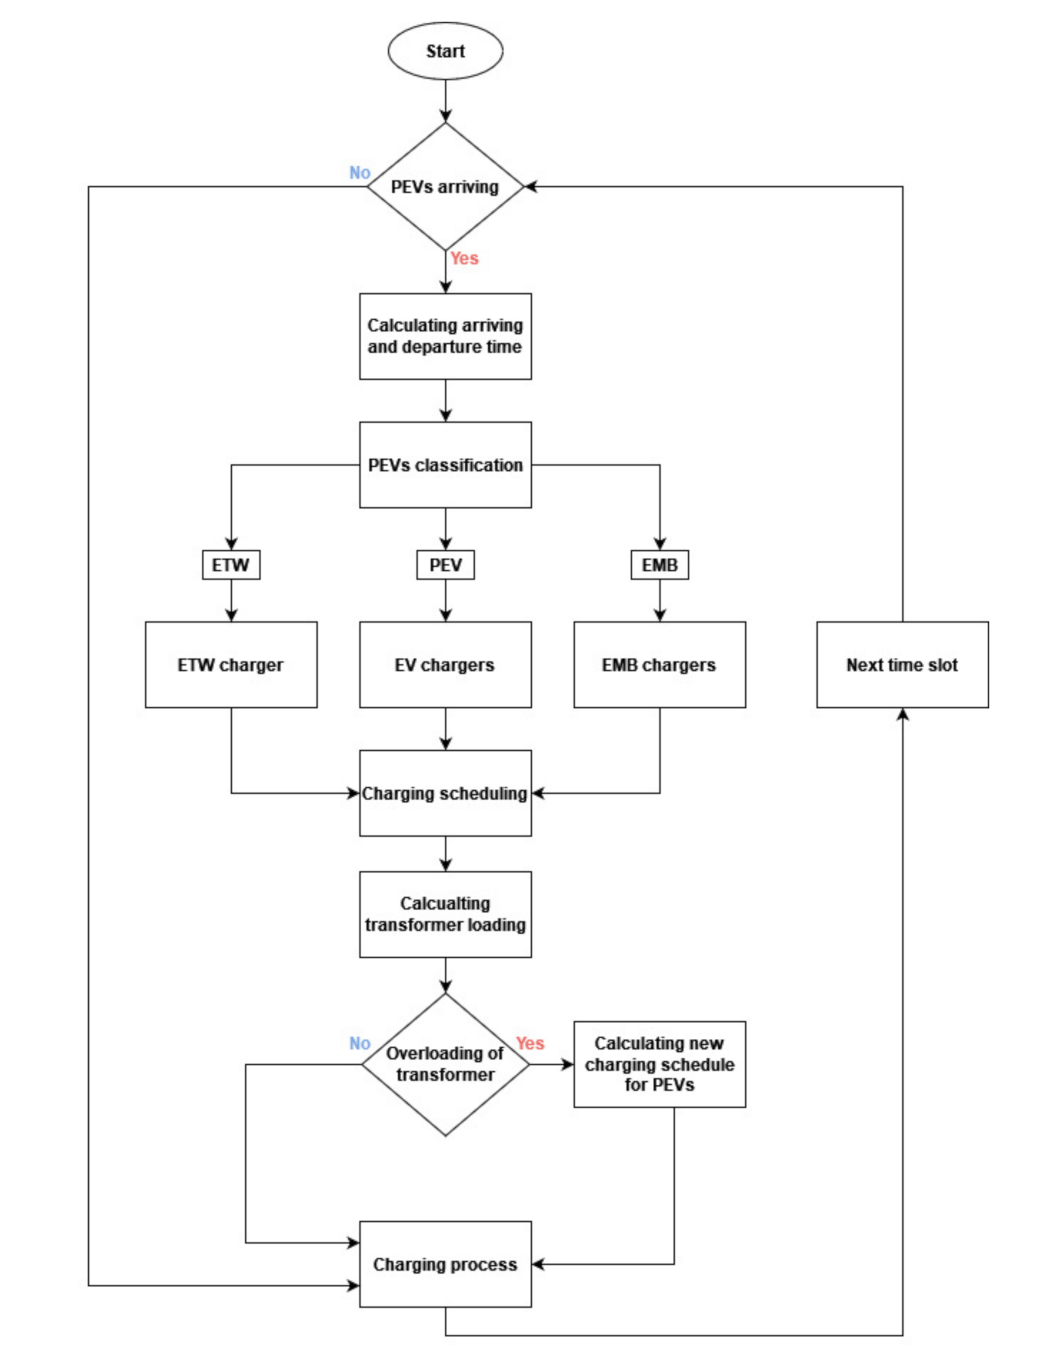
The coordinated charging takes place in order to avoid the overload of the transformers, which is created by the charging of PEVs. This would lead to a more effective and sustainable PEV charging solution for the distribution grid. The process of the coordinated charging strategy is shown in Figure 7. The Equations (1)–(6) apply in this case, too. Initially, the procedures before charging schedule are same with those at CS1. Then, the transformer capacity limit is checked. In case the chargers total charging demand is higher than the available transformer capacity, a coordinated charging schedule is assigned to the chargers, otherwise the charging process is continued. The new charging power that is assigned to each charger when the transformer is overloaded is shown in Equation (7). Equation (7) proportionally distributes the available transformer capacity, i.e., the capacity limit that has been assigned to the transformer minus the residential loads, to the chargers of the transformer.
where Pold is the charging power of the ith PEV at the tth time slot when transformer capacity violation has occurred, PAll is the sum of the charging power of all chargers connected to the jth transformer at the tth time slot and PLimit is the transformer’s available capacity for charging. TV is the time period when transformer capacity limit is violated and Transf is the transformer in which PEVs chargers are connected. In this way, the allowed transformer capacity limit is not exceeded, which in this study was considered as the nominal capacity (case 1) and 90% of the nominal capacity (case 2) of the transformer.
It was estimated in [49] that the idle time of PEVs is approximately 60.32% of their parking duration. Idle time is the period between the time that the PEV has completed its desirable charge and the time that the PEV is unplugged from the charger. That time was exploited to postpone PEVs’ charging when the transformers were overloaded. It can be observed in the scenarios that were created for the simulations that many PEVs stay connected to the charger without charging. Hence, their charging was rescheduled when transformer capacity limit was violated.
Moreover, if there is not adequate time to modify the PEV charging schedule, in order to achieve its SOC and departure target and contribute to the transformer overload reduction, then the PEV’s charging program will not change and the charging schedule of the PEVs will be reprogrammed without taking into consideration these PEVs. This process takes place in the step: “Calculating new charging schedule for PEVs” (Figure 7). Although, in our case study, this never occurred, the Equation (8) represents a potential scenario that could happen. The idle time was adequate in order to reschedule their charging to these time slots. The PEVs that will not change their charging schedule can be estimated as follows:
where cp(i,t) is a binary variable and set to 1 when the PEVs participate in CS2, EC is the energy that the ith PEV has received before the power violation event and EN is the energy that the ith PEV could receive with the new charging schedule that occurs when the transformer is overloaded.
4. Case Study
This work aims to examine the influence of PEVs’ charging stations (CSs) in the distribution grid of the city of Heraklion.
Multiple scenarios were created in Matlab, with the data presented in Section 2, to simulate the arrival, departure and charging of PEVs in both scenarios. The PowerWorld simulator (version 21) was used to reflect the real-world distribution grid status and obtain accurate results.
4.1. Power System Operation without EVs
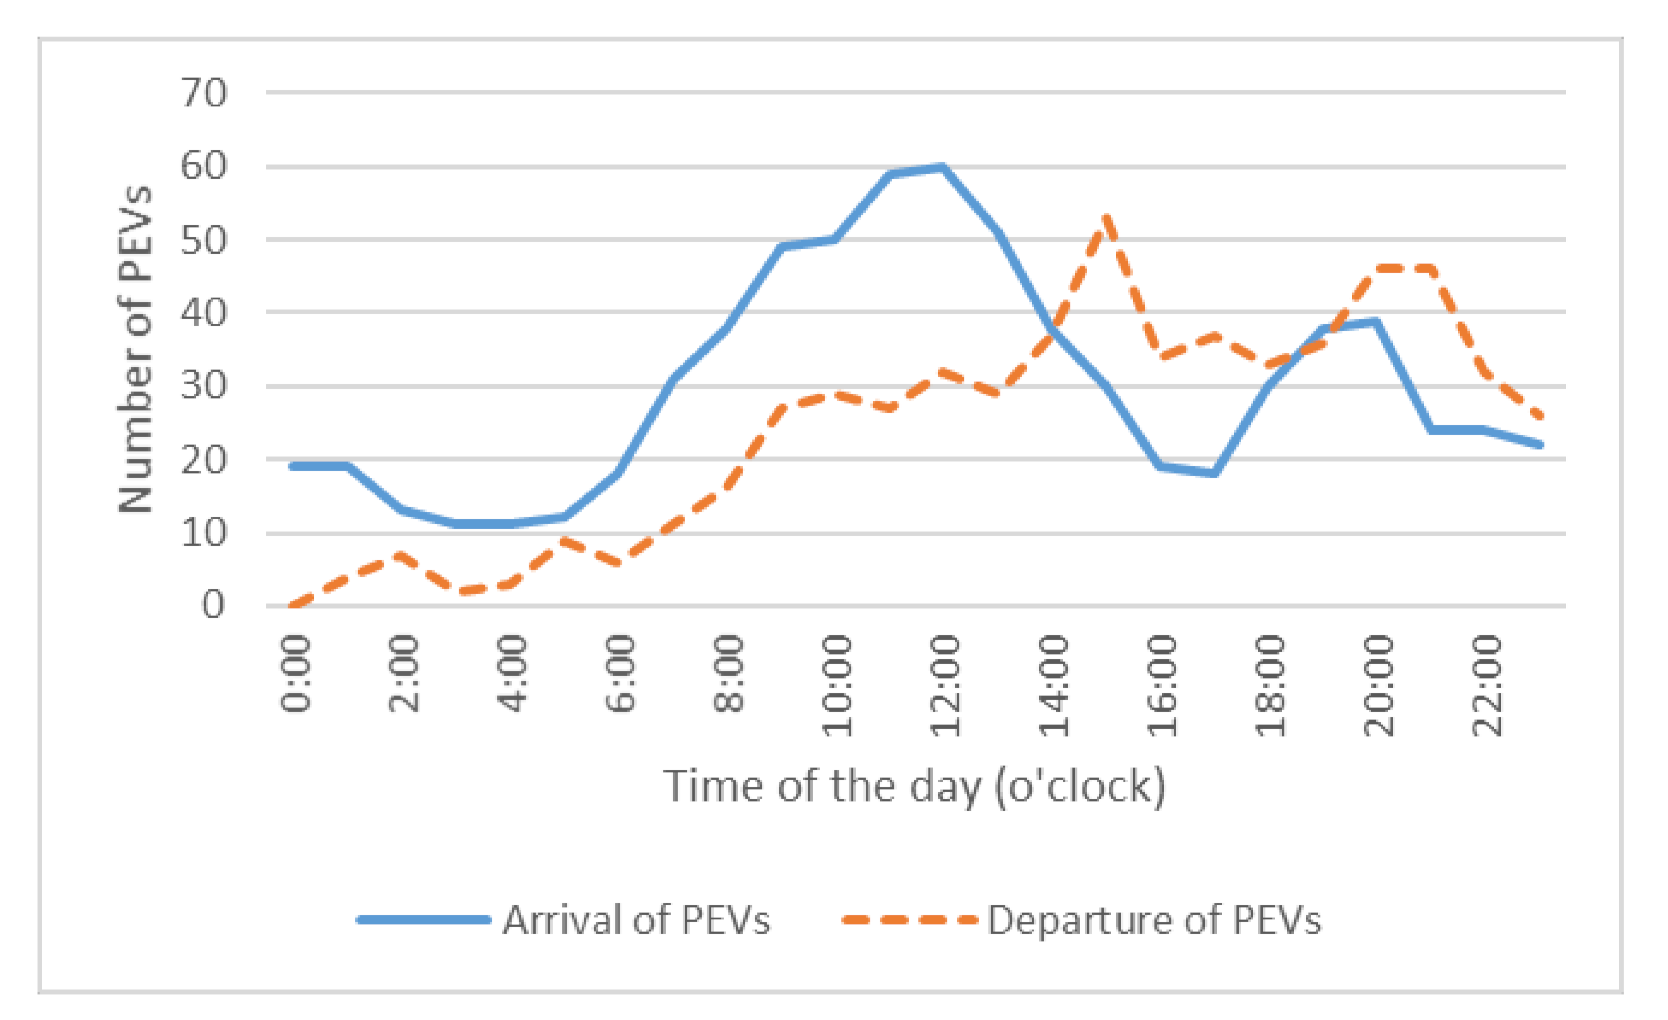
The data from Matlab were extracted and imported to the PowerWorld simulator in order to simulate the impact of charging strategies on the transformer capacity at the distribution system of the city. The scenarios had similar results. More specific, the voltage drop percentage and the transformer capacity violation were similar in all scenarios. In total, 720 PEVs were charged during the examined period from the scenario, which was randomly selected. The power, which was consumed from the grid to charge all the PEVs to the SOCt, was 16.565 MW. The arrivals and departures of PEVs are presented in Figure 8.
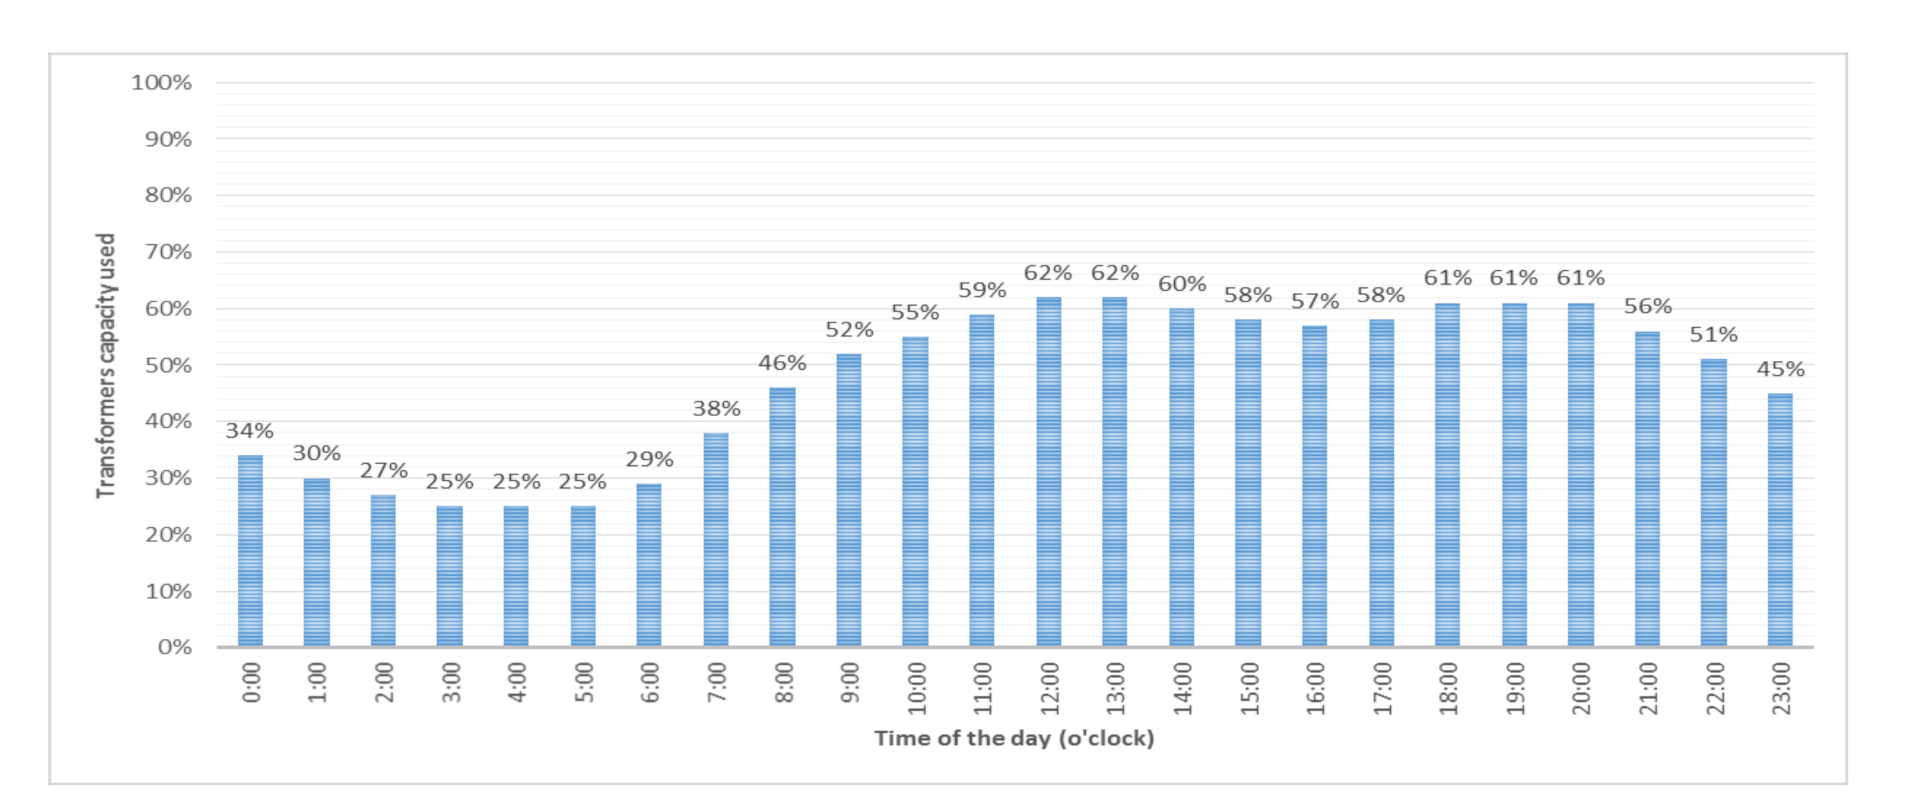
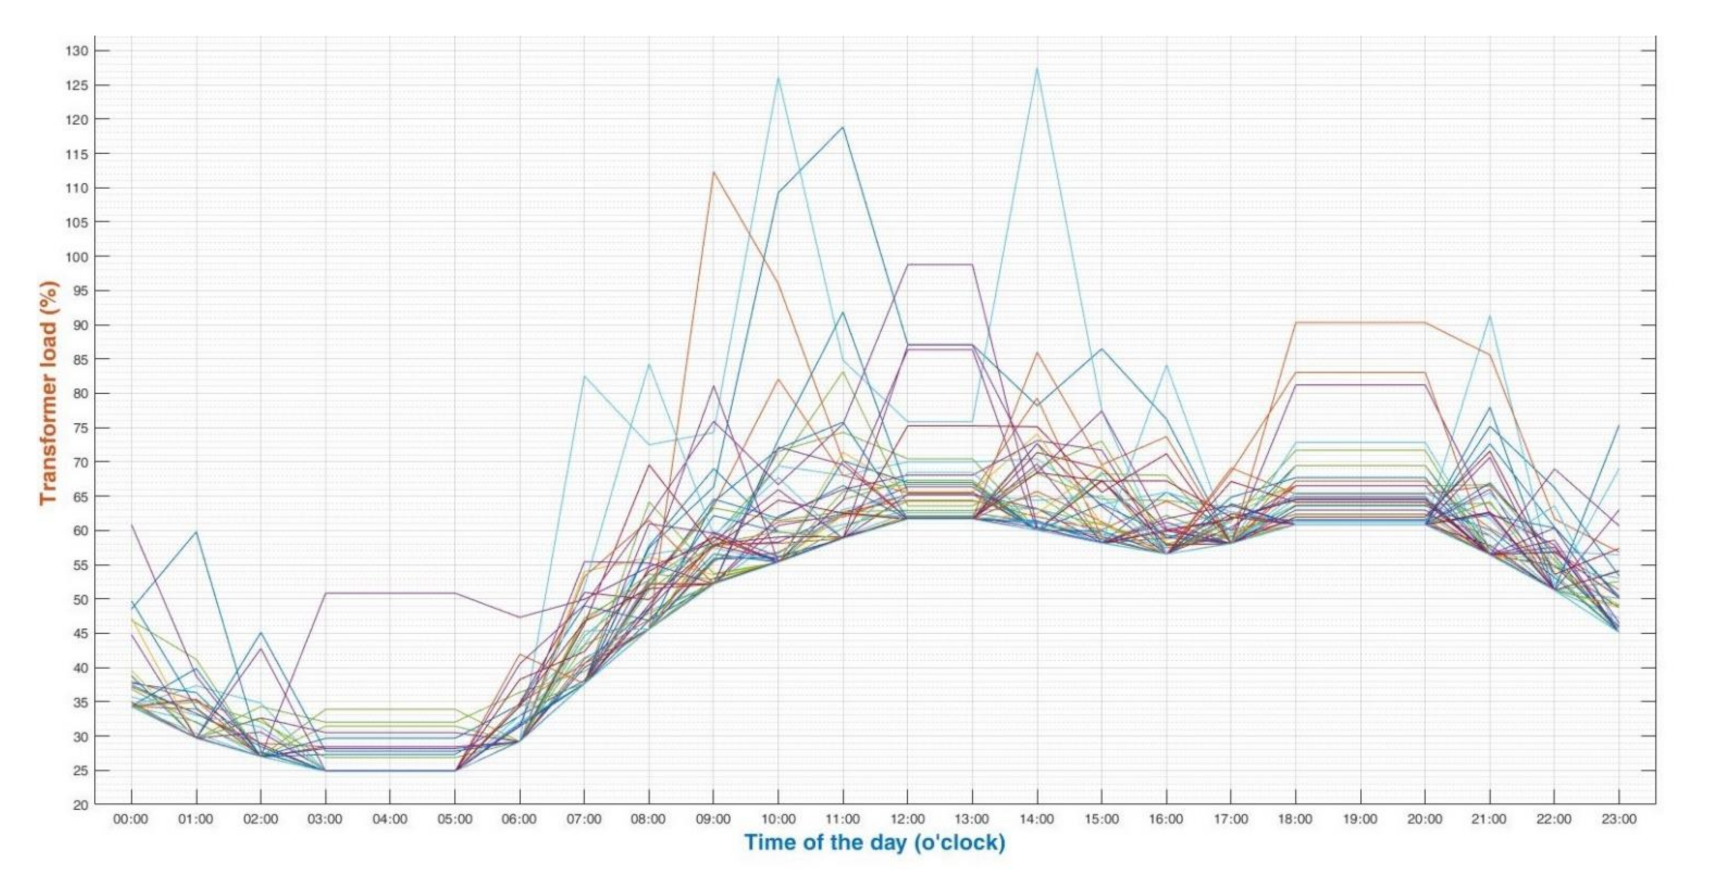
The total load of the three high voltage substations was distributed equally to the feeders of the MV substations. The percentage of the transformers’ (MV/LV) capacity congestion when the PEV chargers were not being used is shown in Figure 9.
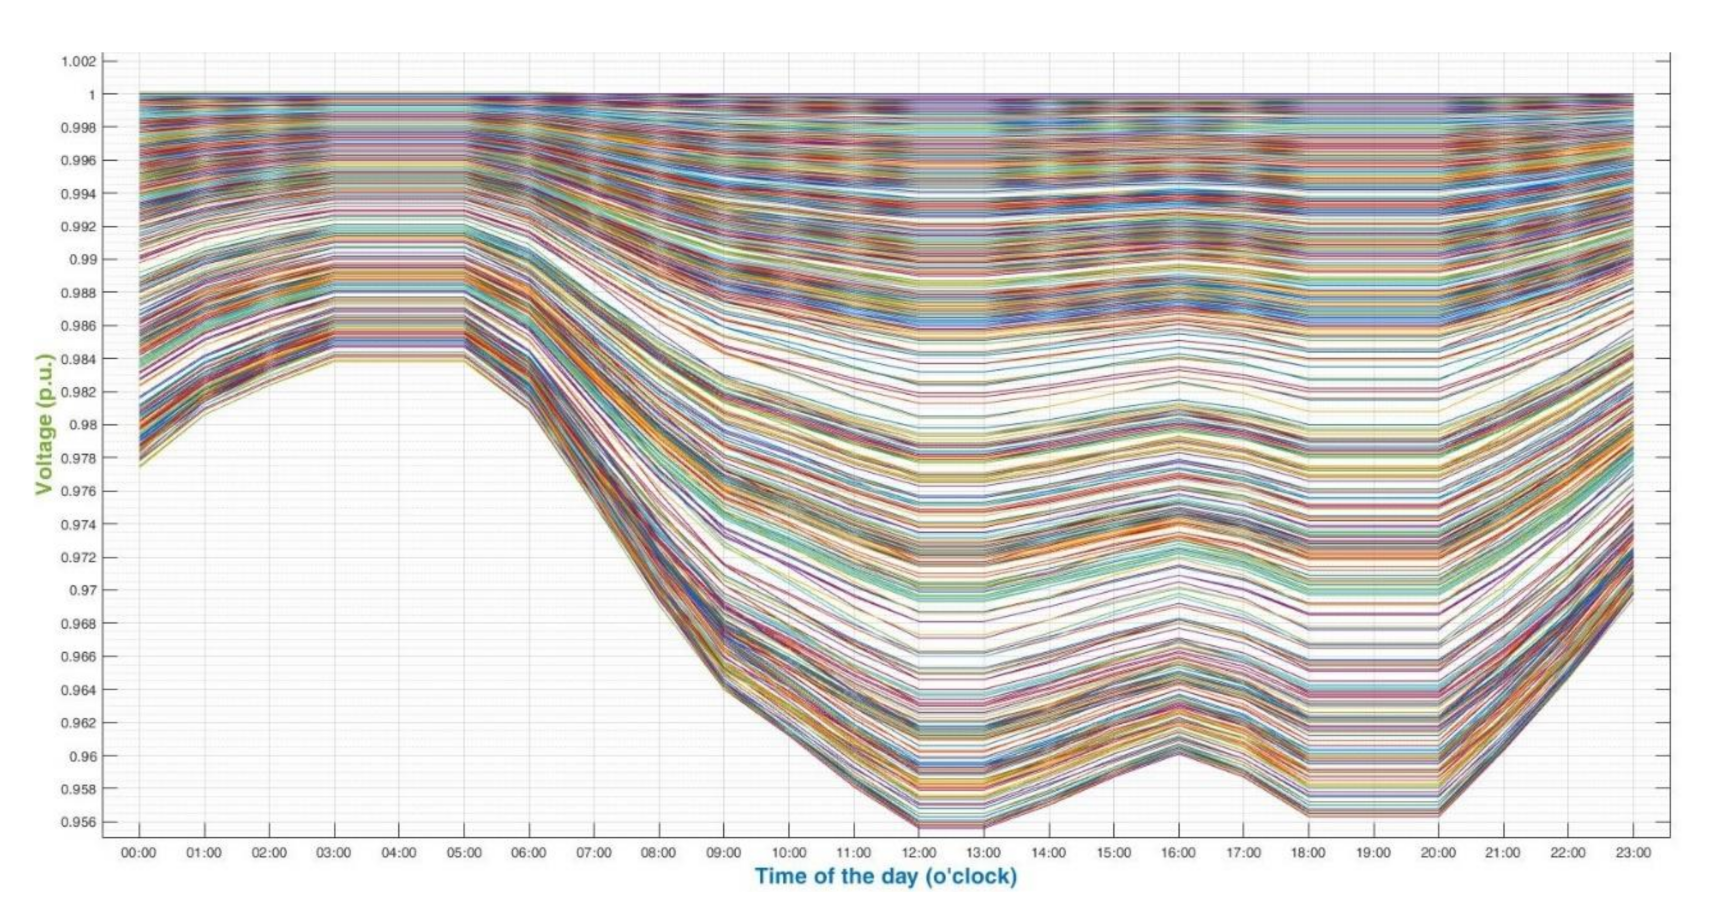
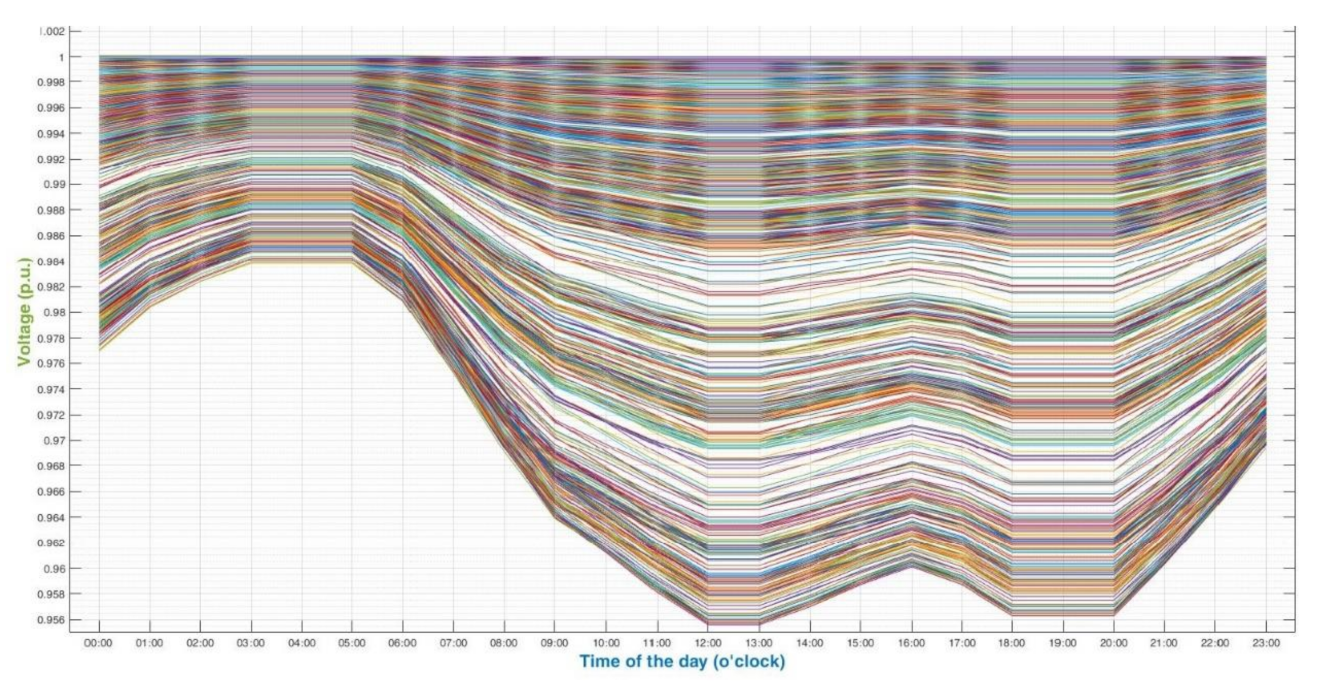
The per unit voltage magnitude of the LV/MV buses when the PEVs were not connected to the distribution network is illustrated in Figure 10. The permitted voltage fluctuation in the low and medium voltage has been found to be ±10% [50]. There was no voltage fluctuation limit violation. The major results obtained for the charging strategies of the per unit voltage magnitude are depicted in Figure 11, Figure 12 and Figure 13.
4.2. Power System Operation with CS1
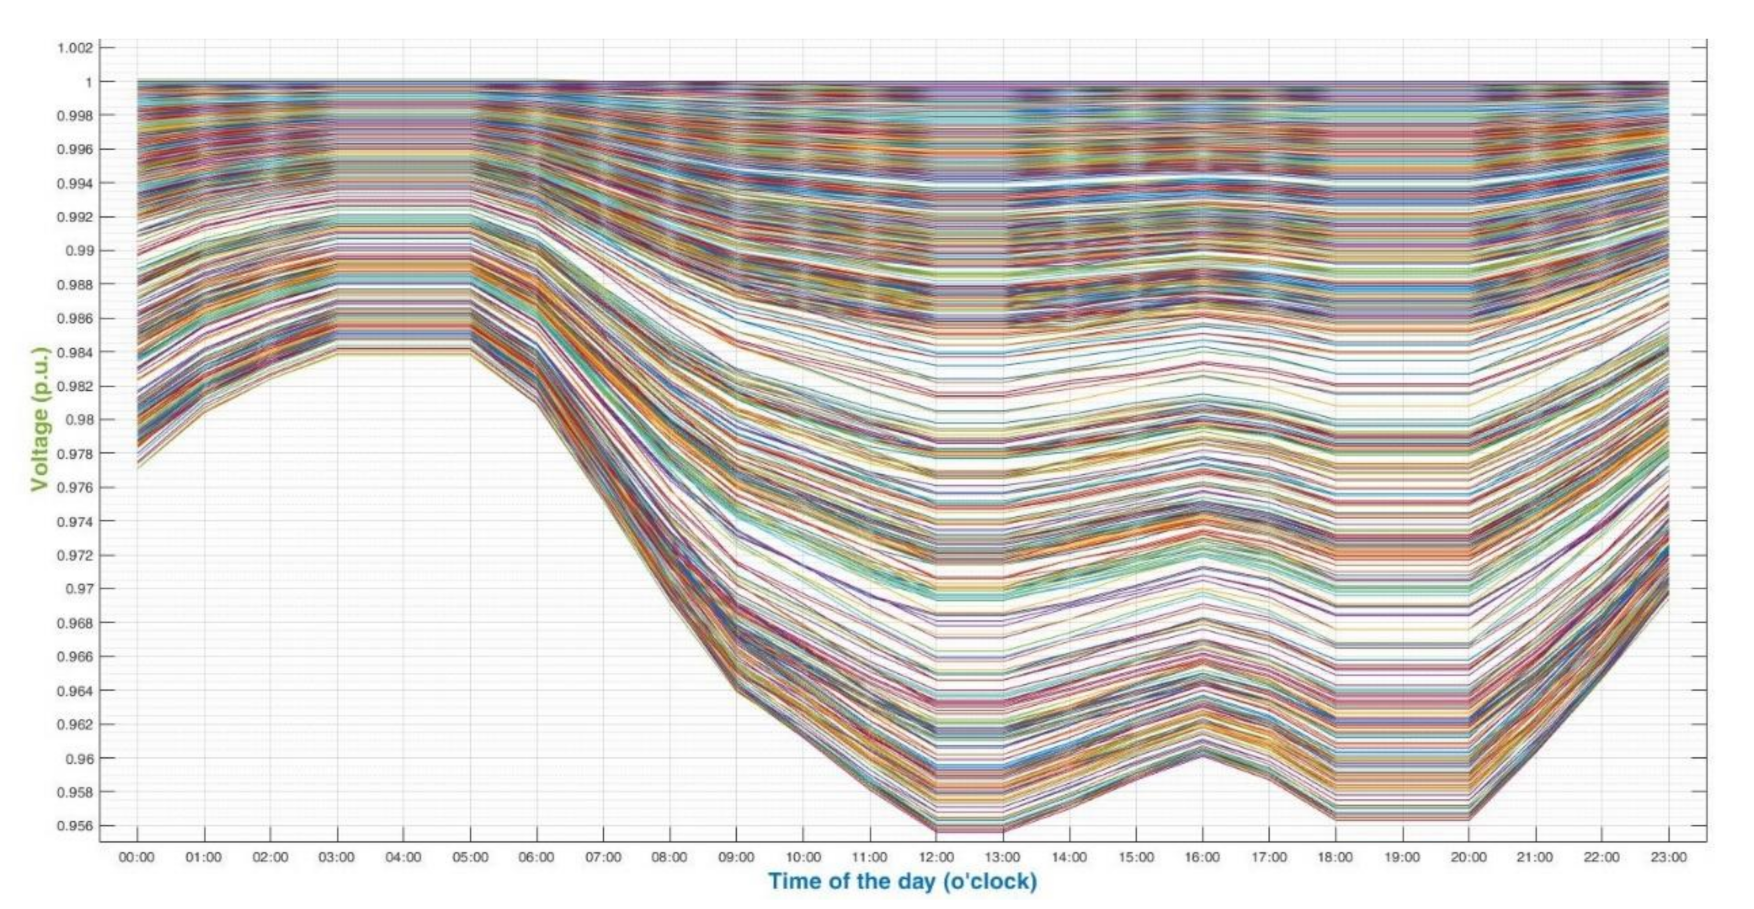
The voltage magnitude per unit of the LV/MV buses when CS1 was applied is illustrated in Figure 11. As it was expected, there was a small, but within the limits, voltage drop in the buses. Additionally, the maximum percentage of voltage drop, compared to the scenario in which there were no PEVs, was 0.8%.
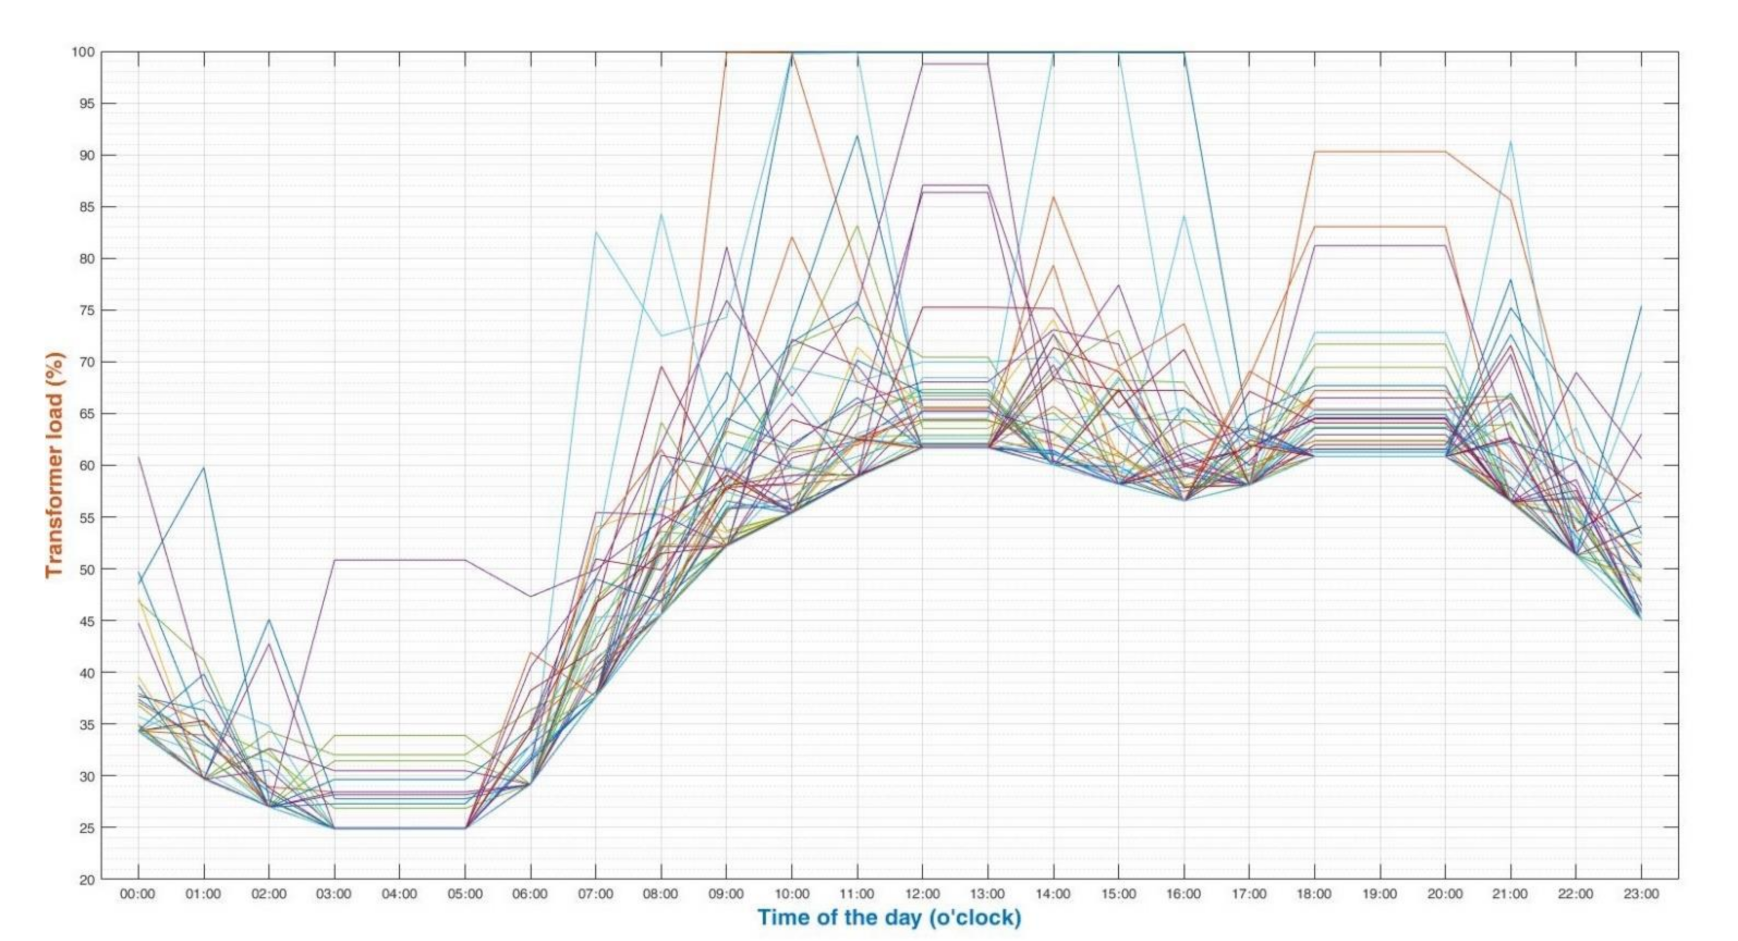
Figure 14 illustrates the percentage of transformers loading when CS1 was applied. The lines of the transformers loading that were higher than the values of Figure 9 means that the PEV chargers, which connected to the specific transformer, were being used. Moreover, it can be observed that there was a capacity violation in some transformers, particularly at 9:00, 10:00, 11:00 and 14:00 and a specific transformer was overloaded two times (9:00 and 14:00).
When uncoordinated charging is happening, violation of some transformer capacity limit is almost certain. The capacity of transformers has been estimated and installed according to the residential load. PEV chargers are the new unpredicted big energy consumers; their load would burden the transformer in which they connect. To cope with this, there are two main solutions. The first solution would be to upgrade the transformers and generally update the distribution network, which has a significant cost. On the other hand, this could be postponed if coordinated charging strategies are applied in order to protect the electric grid from the PEVs’ charging.
4.3. Power System Operation with CS2
4.3.1. Case 1: The Limit of the Transformer Load Is Its Nominal Capacity
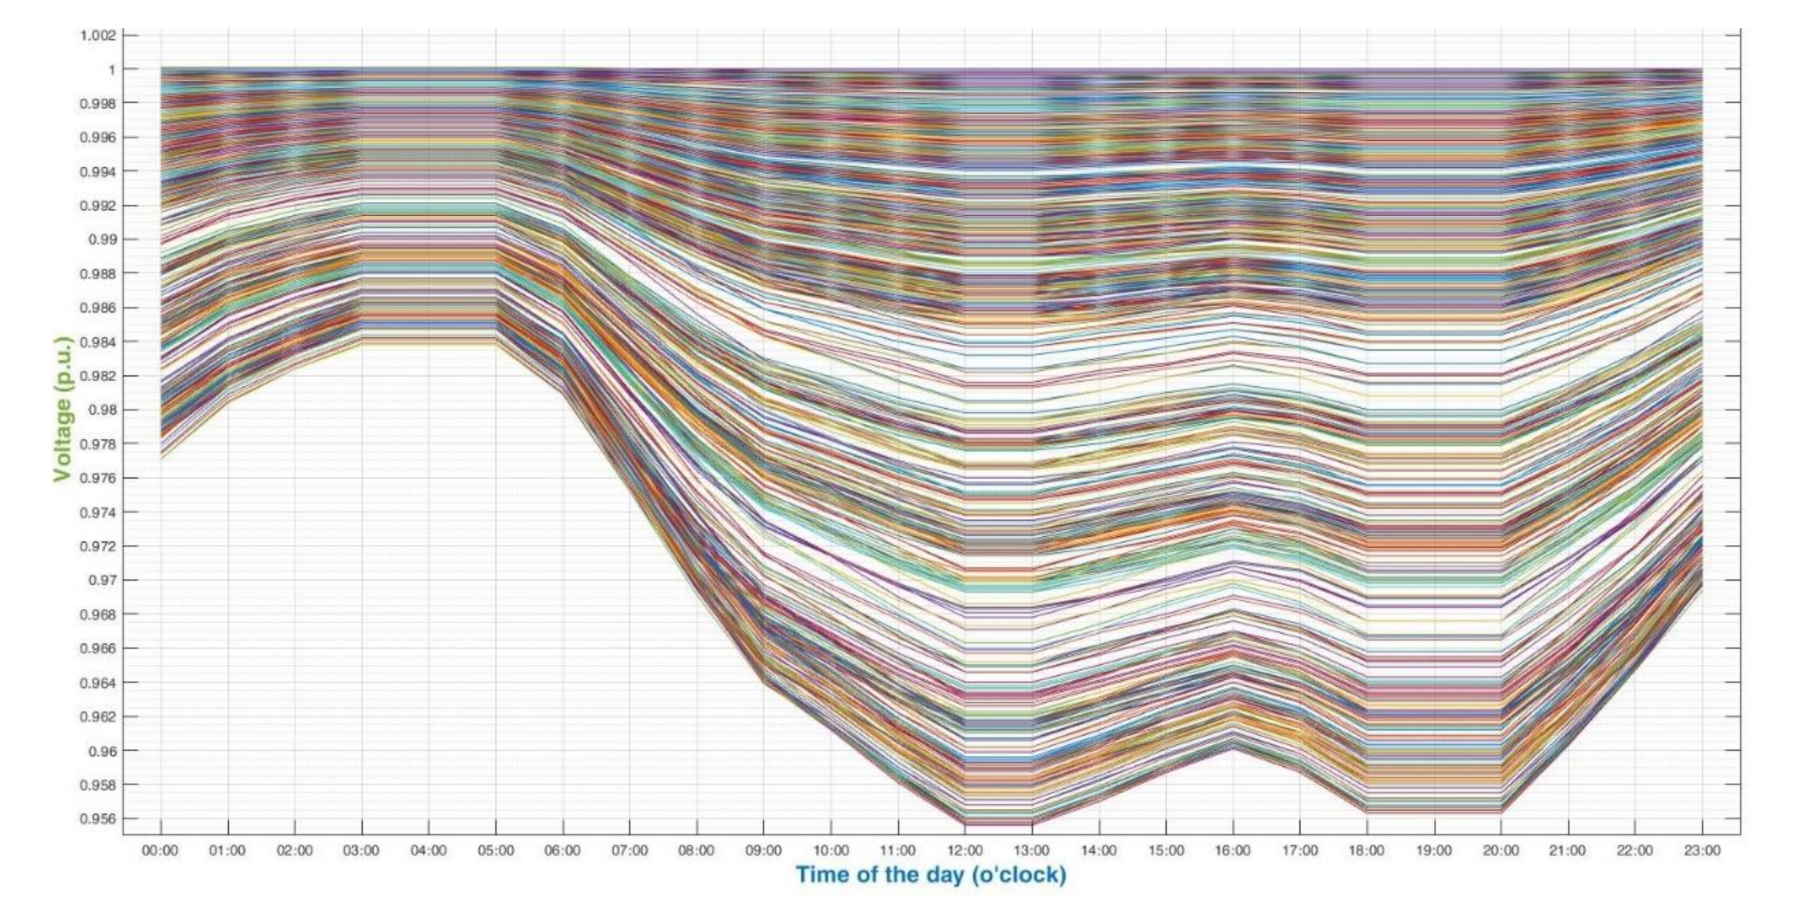
The voltage magnitude per unit of the LV/MV buses when in case 1 CS2 was applied as illustrated in Figure 12. In this case, there was not a voltage drop under the permitted limit. Furthermore, the maximum percentage of voltage drop, compared to the scenario in which there were no PEVs, was 0.6%. When the CS2 was applied, the transformers operated in their capacity limit and at the same time, the charging targets of the PEVs were fulfilled. Figure 15 illustrates the capacity congestion of the transformers when CS2 in case 1 is applied. It can be observed that the transformers, which were overloaded when following CS1, are now operating below their nominal capacity. Not only are they operating to their nominal capacity at the time slot when the overload happened, but also, in some cases, at the coming time slot. This can be seen to be happening when the transformer load in the next time slot of the transformer overload is already high. More specific, the extra power that is needed to cover the power demand, which was reduced in the previous time slot, is added to the next slot.
4.3.2. Case 2: The Limit of the Transformer Load Is 90% of Its Nominal Capacity
In case 2, the transformer capacity limit was considered as 90% of the nominal capacity. The voltage magnitude per unit of the LV/MV buses and the capacity congestion of the transformers are shown in Figure 13 and Figure 16, respectively. Finally, the maximum percentage of voltage drop, compared to the scenario in which there were no PEVs, was 0.6% as it was in case 1. Although, the shift of the PEVs’ charging load was bigger in case 2, there was no PEV in which its departure time was delayed with the CS2 in any of the scenarios. The charging rate of PEVs and chargers is sufficient to charge the PEV and there is adequate time to postpone the charging process to the idle time when the transformer is overloaded.
From both scenarios, it can be observed that the impact of PEV chargers on the distribution grid in terms of voltage is not significant, but this is not the same for the transformers at MV/LV substations. The congestion of the transformers when PEVs are charging is high, especially when the PEV charging process is synchronized with peak demand of the residential load. Although, transformers could afford a small amount of overloading time, frequent exposure to this situation is not recommended. Furthermore, the overloading of the transformer might last longer than it can tolerate, which can be devastating to its operation. Applying a coordinated charging strategy would protect transformers from potential overloading, and by extension, postpone the power system upgrade, allowing time for the distribution operator for a smoother transition for the futured upgraded distribution network. The proposed method is a simple and efficient way to be implemented by monitoring transformer loading, and through a communication channel, controllers would assign the suitable charging rate to the chargers, as it has been calculated in CS2. Moreover, when CS1 is applied, it can be observed which transformers are overloaded, while if CS2 could not cope with this situation, it can be proposed some of the chargers to be connected to other transformers or to increase the transformers’ capacity. The capacity of the new transformers could be estimated well by conducting many simulations and through the proper forecasting of the PEVs’ penetration and residential loads in the future.
5. Conclusions
The anticipation of a large penetration of PEVs is reshaping the regular view of power systems. The uncoordinated charging of PEVs would stress the distribution grid creating issues, such as new peak demand, overloading of the lines and transformers. National strategies are being investigated to address these problems and promote electromobility and simultaneously the sustainability of the distribution network. To that end, the present work examined the impact of selected charging points on the medium-to-low voltage distribution network of the city of Heraklion.
In detail, this paper employed real-world data regarding the daily consumption profile of the city and the distribution network as input to the charging management mechanism for evaluating the uncoordinated and coordinated charging of PEVs to the electric network. A simple but efficient method was used to coordinate the charging process of PEVs to avoid the overloading of transformers, exploiting the idle time of PEVs. Coordinated charging was found to be able to delay the need for upgrading the distribution grid in an effort to cope with the PEVs’ charging by controlling the charging load of PEVs. In particular, a rescheduling of the charging process of the PEVs takes place when the transformer is overloaded. The available transformer loading, i.e., the capacity limit that has been assigned to the transformer minus the residential loads, is distributed proportionally to the chargers of the transformer. In this way, the loading of the transformer does not violate its capacity limit. At the same time, no voltage limit violations occurred in the examined scenarios.
Future research will focus on the development of charging strategies, which take into account the charging cost. Another step in this direction could be the consideration of vehicle-to-grid (V2G) services. Lastly, limitations of this work could also be another future work direction, such as the investigation of an effective communication and control process to implement the coordinating charging in real situations.
Author Contributions
Conceptualization, G.K., A.P. and E.K.; methodology, G.K.; validation, G.K., E.K. and A.P.; resources, E.K.; data curation, G.K.; writing—original draft preparation, G.K.; writing—review and editing, E.K. and A.P.; supervision, E.K.; project administration, E.K. All authors have read and agreed to the published version of the manuscript.
Funding
This research received no external funding.
Institutional Review Board Statement
Not applicable.
Informed Consent Statement
Not applicable.
Data Availability Statement
Not applicable.
Acknowledgments
We would like to thank Hellenic Electricity Distribution Network Operator (HEDNO S.A.) for giving us the information and real-world data to conduct research in a realistic power system.
Conflicts of Interest
The authors declare no conflict of interest.
References
- 2050 Long-Term Strategy. Available online: https://ec.europa.eu/clima/eu-action/climate-strategies-targets/2050-long-term-strategy_en (accessed on 25 December 2021).
- Greenhouse Gas Emissions from Transport in Europe. Available online: https://www.eea.europa.eu/ims/greenhouse-gas-emissions-from-transport (accessed on 12 January 2022).
- Global EV Outlook 2020. Available online: https://www.iea.org/reports/global-ev-outlook-2020 (accessed on 25 December 2021).
- European EV Policy & Sales Trends—Greece, Netherlands, Italy, Spain, Austria, Belgium, Germany, Norway, Denmark, Iceland, & UK. Available online: https://cleantechnica.com/2021/08/02/european-ev-policy-sales-trends-greece-netherlands-italy-spain-austria-belgium-germany-norway-denmark-iceland-uk/ (accessed on 25 December 2021).
- Noel, L.; de Rubens, G.Z.; Kester, J.; Sovacool, B.K. Beyond emissions and economics: Rethinking the co-benefits of electric vehicles (EVs) and vehicle-to-grid (V2G). Transp. Policy 2018, 71, 130–137. [Google Scholar] [CrossRef]
- Thiel, C.; Tsakalidis, A.; Jäger-Waldau, A. Will electric vehicles be killed (again) or are they the next mobility killer app? Energies 2020, 13, 1828. [Google Scholar] [CrossRef] [Green Version]
- Capuder, T.; Sprčić, D.M.; Zoričić, D.; Pandžić, H. Review of challenges and assessment of electric vehicles integration policy goals: Integrated risk analysis approach. Int. J. Electr. Power Energy Syst. 2020, 119, 105894. [Google Scholar] [CrossRef]
- Dimitropoulou, M.; Tsikalakis, A.; Gigantidou, A.; Thalassinakis, E.; Pylarinos, D. Estimation of Hosting Electric Vehicles Capacity in the Transformers on the Island of Crete; Engineering and Industry Series; Volume Power Systems, Energy Markets and Renewable Energy Sources in South-Eastern Europe; Trivent Publishing: Budapest, Hungary, 2016; pp. 235–246. [Google Scholar]
- Siyamak, S.; Arnaud, D.; Vincent, C.; Yann, R.; Benoît, R. Potential of vehicle-to-grid ancillary services considering the uncertainties in plug-in electric vehicle availability and service/localization limitations in distribution grids. Appl. Energy 2016, 171, 523–540. [Google Scholar]
- Konstantinidis, G.; Kanellos, F.D.; Kalaitzakis, K. A Simple Multi-Parameter Method for Efficient Charging Scheduling of Electric Vehicles. Appl. Syst. Innov. 2021, 4, 58. [Google Scholar] [CrossRef]
- Kanellos, F.D. Optimal Scheduling and Real-Time Operation of Distribution Networks with High Penetration of Plug-In Electric Vehicles. IEEE Syst. J. 2021, 15, 3938–3947. [Google Scholar] [CrossRef]
- Karfopoulos, E.; Hatziargyriou, N. A multi-agent system for controlled charging of a large population of electric vehicles. IEEE Trans. Power Syst. 2013, 28, 1196–1204. [Google Scholar] [CrossRef]
- Optimal Allocation of Electric Vehicle Charging Infrastruction in Cities and Regions. Available online: https://publications.jrc.ec.europa.eu/repository/handle/JRC101040 (accessed on 26 December 2021).
- Efthymiou, D.; Chrysostomou, K.; Morfoulaki, M.; Aifantopoulou, G. Electric vehicles charging infrastructure location: A genetic algorithm approach. Eur. Transp. Res. Rev. 2017, 9, 27. [Google Scholar] [CrossRef] [Green Version]
- Pothinun, T.; Premrudeepreechacharn, S. Power Quality Impact of Charging Station on MV Distribution Networks: A Case Study in PEA Electrical Power System. In Proceedings of the 53rd International Universities Power Engineering Conference (UPEC), Glasgow, UK, 4–7 September 2018; pp. 1–6. [Google Scholar]
- Carrión, M.; Zárate-Miñano, R.; Domínguez, R. Integration of Electric Vehicles in Low-Voltage Distribution Networks Considering Voltage Management. Energies 2020, 13, 4125. [Google Scholar] [CrossRef]
- Tie, C.H.; Gan, C.K.; Ibrahim, K.A. The impact of electric vehicle charging on a residential low voltage distribution network in Malaysia. In Proceedings of the IEEE Innovative Smart Grid Technologies—Asia (ISGT ASIA), Kuala Lumpur, Malaysia, 20–23 May 2014; pp. 272–277. [Google Scholar]
- Ul-Haq, A.; Cecati, C.; Strunz, K.; Abbasi, E. Impact of Electric Vehicle Charging on Voltage Unbalance in an Urban Distribution Network. Intell. Ind. Syst. 2015, 1, 51–60. [Google Scholar] [CrossRef] [Green Version]
- Marah, B.; Bhavanam, Y.R.; Taylor, G.A.; Ekwue, A.O. Impact of electric vehicle charging systems on low voltage distribution networks. In Proceedings of the 51st International Universities Power Engineering Conference (UPEC), Coimbra, Portugal, 6–9 September 2016; pp. 1–6. [Google Scholar]
- Spitzer, M.; Schlund, J.; Apostolaki-Iosifidou, E.; Pruckner, M. Optimized Integration of Electric Vehicles in Low Voltage Distribution Grids. Energies 2019, 12, 4059. [Google Scholar] [CrossRef] [Green Version]
- Anastasiadis, G.A.; Kondylis, P.G.; Polyzakis, A.; Vokas, G. Effects of Increased Electric Vehicles into a Distribution Net-work. Energy Procedia 2019, 157, 586–593. [Google Scholar] [CrossRef]
- Karapidakis, E.; Tsikalakis, A.; Paspatis, A.; Fotakis, E.; Stavrakakis, G.; Chatzipoulka, C.; Zervas, P. Grid Operation Assessment under a Specific EV Chargers Deployment Plan in the City of Heraklion. Electronics 2021, 10, 2831. [Google Scholar] [CrossRef]
- Satarworn, S.; Hoonchareon, N. Impact of EV home charger on distribution transformer overloading in an urban area. In Proceedings of the 14th International Conference on Electrical Engineering/Electronics, Computer, Telecommunications and Information Technology (ECTI-CON), Phuket, Thailand, 27–30 June 2017; pp. 469–472. [Google Scholar]
- Kuspan, B.; Bagheri, M.; Abedinia, O.; Naderi, M.S.; Jamshidpour, E. The Influence of Electric Vehicle Penetration on Distribution Transformer Ageing Rate and Performance. In Proceedings of the 7th International Conference on Renewable Energy Research and Applications (ICRERA), Paris, France, 14–17 October 2018; pp. 313–318. [Google Scholar]
- Argade, S.; Aravinthan, V.; Jewell, W. Probabilistic modeling of EV charging and its impact on distribution transformer loss of life. In Proceedings of the IEEE International Electric Vehicle Conference (IEVC), Greenville, SC, USA, 4–8 March 2012. [Google Scholar]
- Rutherford, M.J.; Yousefzadeh, V. The impact of electric vehicle battery charging on distribution transformers. In Proceedings of the Twenty-Sixth Annual IEEE Applied Power Electronics Conference and Exposition (APEC), Fort Worth, TX, USA, 6–11 March 2011; pp. 396–400. [Google Scholar]
- Alame, D.; Azzouz, M.; Kar, N.C. Impact Assessment of Electric Vehicle Charging on Distribution Transformers Including State-of-Charge. In Proceedings of the IEEE 61st International Midwest Symposium on Circuits and Systems (MWSCAS), Windsor, ON, Canada, 5–8 August 2018; pp. 607–610. [Google Scholar]
- Ma, J.; An, W.; Ming, W.; Du, J.; Yin, W.; Chen, J. Coordinated Control Strategy for Electric Vehicle Charging Piles to Prevent Overload of Distribution Transformer. In Proceedings of the 5th Asia Conference on Power and Electrical Engineering (ACPEE), Chengdu, China, 4–7 June 2020; pp. 684–688. [Google Scholar]
- Kurniawan, T.; Baguley, C.A.; Madawala, U.K.; Suwarno; Hariyanto, N.; Adianto, Y. An Electric Vehicle Charge Scheduling Approach Suited to Local and Supplying Distribution Transformers. Energies 2020, 13, 3486. [Google Scholar] [CrossRef]
- Ramos Muñoz, E.; Razeghi, G.; Zhang, L.; Jabbari, F. Electric vehicle charging algorithms for coordination of the grid and distribution transformer levels. Energy 2016, 113, 930–942. [Google Scholar] [CrossRef]
- Hellenic Electricity Distribution Network Operator (HEDNO). Available online: https://deddie.gr/en/ (accessed on 12 January 2022).
- Europaean Sales 2020 EV and PHEV. Available online: https://carsalesbase.com/european-sales-2020-ev-phev/ (accessed on 16 December 2021).
- Renault Zoe ZE50 R135. Available online: https://ev-database.org/car/1205/Renault-Zoe-ZE50-R135 (accessed on 16 December 2021).
- Tesla Model 3. Available online: https://ev-database.org/car/1555/Tesla-Model-3 (accessed on 16 December 2021).
- Volkswagen e-Golf. Available online: https://ev-database.org/car/1087/Volkswagen-e-Golf (accessed on 16 December 2021).
- Hyundai Kona Electric 64 kWh. Available online: https://ev-database.org/car/1423/Hyundai-Kona-Electric-64-kWh (accessed on 16 December 2021).
- Peugeot e-208. Available online: https://ev-database.org/car/1583/Peugeot-e-208 (accessed on 16 December 2021).
- Nissan Leaf. Available online: https://ev-database.org/car/1106/Nissan-Leaf (accessed on 16 December 2021).
- Audi e-tron 55 Quattro. Available online: https://ev-database.org/car/1253/Audi-e-tron-55-quattro (accessed on 16 December 2021).
- Kia e-Niro 64 kWh. Available online: https://ev-database.org/car/1338/Kia-e-Niro-64-kWhquattro (accessed on 16 December 2021).
- BMW i3 120, Ah. Available online: https://ev-database.org/car/1145/BMW-i3-120-Ah (accessed on 16 December 2021).
- Volkswagen e-Up! Available online: https://ev-database.org/car/1189/Volkswagen-e-Up (accessed on 16 December 2021).
- Vespa Elettrica 70 km/h. Available online: https://www.vespa.com/us_EN/models/elettrica/elettrica-70-kmh-3-6-kw-electric-motorcycle/ (accessed on 16 December 2021).
- Gogoro S2 Adventure. Available online: https://www.e-scooter.co/gogoro-s2-adventure/ (accessed on 16 December 2021).
- Zero, S.R. Available online: https://www.zeromotorcycles.com/model/zero-sr (accessed on 16 December 2021).
- Harley-Davidson LiveWire. Available online: https://www.harley-davidson.com/us/en/motorcycles/livewire.html (accessed on 16 December 2021).
- Electric Midi/Minibus. Available online: https://thelionelectric.com/en/products/electric_minibus (accessed on 16 December 2021).
- Independent Power Transmission Operator, Data. Available online: https://www.admie.gr/en (accessed on 10 December 2021).
- Lucas, A.; Barranco, R.; Refa, N. EV Idle Time Estimation on Charging Infrastructure, Comparing Supervised Machine Learning Regressions. Energies 2019, 12, 269. [Google Scholar] [CrossRef] [Green Version]
- Ποιότητα των υπηρεσιών υπηρεσιών Δικτύου Δικτύου της ΔΕH A.Ε. Available online: https://www.dei.gr/documents/lathouris12.3.pdf (accessed on 10 December 2021).
Figure 1.
Single-line diagram of the distribution grid of the city of Heraklion.

Figure 2.
Arrival probability of PEVs.

Figure 3.
Parking duration probability of PEVs.

Figure 4.
Probability mass function of arriving state of charge.

Figure 5.
High voltage substations load.

Figure 6.
Flow chart for uncoordinated charging.

Figure 7.
Flow chart for coordinated charging.

Figure 8.
Arrival and departure of PEVs.

Figure 9.
Transformer capacity usage without considering PEV charging.

Figure 10.
Voltage magnitude per unit of the buses for the LV and MV levels.

Figure 11.
Voltage magnitude per unit of the buses for the LV and MV levels when CS1 is applied.

Figure 12.
Voltage magnitude per unit of the buses for the LV and MV levels when CS2 (case 1) is applied.
Figure 12.
Voltage magnitude per unit of the buses for the LV and MV levels when CS2 (case 1) is applied.

Figure 13.
Voltage magnitude per unit of the buses for the LV and MV levels when CS2 (case 2) is applied.
Figure 13.
Voltage magnitude per unit of the buses for the LV and MV levels when CS2 (case 2) is applied.

Figure 14.
Capacity congestion of the transformers when CS1 is applied.

Figure 15.
Capacity congestion of the transformers when CS2 (case 1) is applied.

Figure 16.
Capacity congestion of the transformers when CS2 (case 2) is applied.


Table 1.
PEV model, arrival possibility, battery capacity and on-board charger limitation at AC charging.
Table 1.
PEV model, arrival possibility, battery capacity and on-board charger limitation at AC charging.
| PEV Type | PEV Model | PEV Appearance Possibility | Battery Capacity (kWh) | On-Board Charger Limitation (kW) at AC/DC Charging |
|---|---|---|---|---|
| Electric Vehicles (77%) | Renault Zoe [33] | 0.15 | 52 | 22/46 |
| Tesla Model 3 [34] | 0.19 | 57 | 11/170 | |
| Volkswagen e-Golf [35] | 0.08 | 32 | 7.2/40 | |
| Hyundai Kona EV [36] | 0.07 | 64 | 11/77 | |
| Peugeot e-208 [37] | 0.03 | 45 | 11/101 | |
| Nissan Leaf [38] | 0.07 | 37 | 6.6/46 | |
| Audi e-Tron [39] | 0.05 | 86.5 | 11/155 | |
| Kia e-Niro [40] | 0.05 | 64 | 11/77 | |
| BMW i3 [41] | 0.06 | 37.9 | 11/49 | |
| Volkswagen e-Up! [42] | 0.02 | 32.3 | 7.2/40 | |
| Electric two Wheelers (22%) | Vespa Elettrica [43] | 0.06 | 4.2 | (1.9 *)/(3 *) |
| Gogoro Smartscooter S2 Adventure [44] | 0.06 | 7.6 | (1.9 *)/(3 *) | |
| Zero SR [45] | 0.05 | 12.6 | 3.3/6 | |
| Harley-Davidson LiveWire [46] | 0.05 | 15.5 | 1.9/(6 *) | |
| Electric Buses (1%) | Electric Minibuses [47] | 0.01 | 160 | 19.2/(100 *) |
Table 2.
Charger characteristics.
| Type of Charger | Max. Power | Number of Chargers | PEV Charger | Total Number of Chargers |
|---|---|---|---|---|
| AC | 3.7 kW | 6 | ETW | 122 |
| AC | 7 kW | 1 | EV | |
| AC | 22 kW | 76 | EV | |
| DC | 2·6 kW | 2 | EMB | |
| DC | 50 kW | 34 | EV, EMB | |
| DC | 100 kW | 3 | EV, EMB |
Publisher’s Note: MDPI stays neutral with regard to jurisdictional claims in published maps and institutional affiliations. |
© 2022 by the authors. Licensee MDPI, Basel, Switzerland. This article is an open access article distributed under the terms and conditions of the Creative Commons Attribution (CC BY) license (https://creativecommons.org/licenses/by/4.0/).
Share and Cite
MDPI and ACS Style
Konstantinidis, G.; Karapidakis, E.; Paspatis, A. Mitigating the Impact of an Official PEV Charger Deployment Plan on an Urban Grid. Energies 2022, 15, 1321. https://doi.org/10.3390/en15041321
AMA Style
Konstantinidis G, Karapidakis E, Paspatis A. Mitigating the Impact of an Official PEV Charger Deployment Plan on an Urban Grid. Energies. 2022; 15(4):1321. https://doi.org/10.3390/en15041321
Chicago/Turabian StyleKonstantinidis, George, Emmanuel Karapidakis, and Alexandros Paspatis. 2022. "Mitigating the Impact of an Official PEV Charger Deployment Plan on an Urban Grid" Energies 15, no. 4: 1321. https://doi.org/10.3390/en15041321
Note that from the first issue of 2016, this journal uses article numbers instead of page numbers. See further details here.