
Smart Energy Management Strategy for Microgrids Powered by Heterogeneous Energy Sources and Electric Vehicles’ Storage

School of Electrical Engineering, Vellore Institute of Technology, Vellore 632014, India
*
Author to whom correspondence should be addressed.
Energies 2022, 15(20), 7739; https://doi.org/10.3390/en15207739
Submission received: 2 September 2022
/
Revised: 29 September 2022
/
Accepted: 10 October 2022
/
Published: 19 October 2022
(This article belongs to the Topic Advanced Electric Vehicle Technology)
Abstract
:The rapid growths of power demand and renewable resources have led to numerous challenges. Constructing more resilient microgrids (MGs) provides an opportunity to avoid dependency on the main grid. This article proposes an innovative Energy Management Strategy (EMS) for microgrids that uses non-conventional energy sources such as solar power, wind power, and the storage of electric vehicles (EVs). Numerous studies have been published on MG EMSs using storage; however, in real-time scenarios, predominant factors limit their straightforward implementation. In this article, an attempt is made to address key aspects of EV storage exploitation to support MGEMSs. Minimizing the total MG energy cost is the key objective, considering EV battery longevity and technical limitations. The proposed EMS was implemented in three layers: Optimal Storage Distribution (OSD), Optimal Power Usage (OPU), and EV Selection (EVS). A novel probabilistic approach was implemented in the EVS process (using a Fuzzy Logic Controller (FLC)) to minimize battery degradation. Various case studies were analyzed in a grid-connected MG by implementing the proposed EMS.
1. Introduction
Microgrids are setting the trend for, and attracting attention to, constructing robust energy systems. The stochastic nature of RES requires different strategies for dynamic energy to make the grid stable. RES in conjunction with EV storage systems is becoming the most economical approach that decreases the cost of additional energy storage. This forces us to use intelligent EMSs to handle the uncertain environment [1]. As the threshold limitations are already defined, crossing these values may collapse the grid stability [2]. EVs’ technical enhancements and storage units may help MGs through the V2G and G2V functionalities. The control strategies of EV storage and the impacts associated with MG stability must be included in the literature [3]. Exclusive articles and the literature have been populated in recent decades with studies on ways to coordinate EV storage [4,5,6,7] with grid dynamics related to frequency regulation [8,9,10,11,12,13,14,15,16,17,18,19]. They can be widely classified into two categories, centralized [15,16,17,18,19] and decentralized [8,9,10,11,12,13,14]. Of these strategies, only a few considered bi-directional power flow [15,18] and variable charge rates.
In one study, a two-stage EMS was developed in which EV fleets were scheduled in stage 1, to diminish the energy cost, and in stage 2, available EVs were planned considering technical limitations [20]. In another study, the EVs’ trip energy requirement was fulfilled based on an EMS for an MG [21]. On the other hand, an MG EMS in another study was implemented with the help of an EV battery for regulation services by employing the EV charging criterion [22]. California University established an EMS using an EV battery as an additional provision in the V2G scenario by considering uncertainties in EV owner tendencies [23]. The highlighted studies mainly focused on reducing the energy cost of MGs [20,24], but the EV owner benefits were not considered. For example, an EV’s battery is portable. EV charging costs negatively impact an owner’s interest in participating in MG support activities.
On the other hand, few authors have included the benefits for EV owners and battery degradation in their studies [25]. For example, the Energy Management Strategy for a distinct house with an EV battery has reduced tariffs due to optimal charging and discharging timings [26]. In addition, changing driving patterns reduces the MG operating cost in a multi-level EMS [27].
EMSs with renewable energy resources have been implemented in intelligent homes using multiple EV storage units using a linear programming approach [28], but these strategies [26,27,28] have not included the effects of the implementations of G2V and V2G scenarios on the lifetime of an EV battery. Exploiting EV storage with a degraded battery disturbs effective energy management [29]. Maximizing EV battery longevity by scheduling charging and discharging is considered intelligent energy management [30]. A multi-stage EMS is proposed in [31] that benefits EV owners by minimizing the cost of charging and maximizing the revenue for an EV owner during the V2G scenario with the help of scheduled charging patterns. In [30,31], the EMSs were not incorporated with V2G; hence, the degradations of the batteries were not considered. The EMS implemented in [32,33,34,35] considered the lifetimes of the EV batteries while aiming to diminish the energy cost. In [32,33], a strategy is proposed for MGs involving the integrations of RES and EVs to suppress fluctuations in wind power. Finally, a multi-agent-based EMS was proposed to reduce changes in the energy market by utilizing EV support [34]. Photo-Voltaic (PV) generation and coordinated EVs are implemented in residential areas. Real-time pricing, the lifetime of an EV battery, and forecasted solar power were considered while implementing the EMS in [35]. In [36], the authors suggest an entirely distributed water-filling system among networked locally interacting users, with no centralized decision maker. The authors developed two distinct variants of a dynamic control method based on consensus, proximity, and fixed-point mapping theory. This iteratively and diffusely drives consumers’ water levels to a convergence value equivalent to the global optimum. The authors of [37] present a novel mathematical model and a comprehensive RMPC methodology for optimally controlling the energy exchange of a multi-carrier microgrid equipped with thermal and electrical units, specifically, thermal loads, renewable energy sources, electrical loads, energy storage systems, and combined heat and power units. The authors of [38] present a multi-objective and collaborative approach for MMG energy management in distribution networks. In this collaborative paradigm, the MMG attempts to reduce the total cost of the MMG and its reliance on the upstream network. In this study, the uncertainties of renewable energy sources are analyzed.
Furthermore, the effect of MMG independence from the main grid on reliability and greenhouse gas emissions has been studied. The authors of [39] provide a unique approach for determining a Nash equilibrium by concurrently updating each PEV’s optimum strategy based on the average charging strategy of the whole population. This operation is proposed to be carried out before the actual charging interval.
Extensive research has been conducted in the current literature on the feasibility of using EV storage for MG auxiliary services. The importance of EV storage in V2G applications has been studied in the existing literature. V2G deploys smaller quantities of storage capacity at the demand point, directly serving the customer/industry/organization and reducing the need for a future extension of a transmission and distribution grid that must meet the peak load demand; hence, this offers a better provision at a reasonable price and has the added benefits of being environmentally friendly. The interconnection between EVs and the grid is sometimes referred to as distributed energy storage. However, in real-time, simultaneous solutions with multiple constraints are becoming mandatory. This article suggests an innovative EMS for EVs in a practical MG scenario with various energy sources.
The following are significant research gaps in existing studies on EV storage exploitation:
- ✓
- Techno-economic factors have not been adequately addressed for when EVs participate in auxiliary services of MGs and other scenarios.
- ✓
- With many MG objectives such as grid dependability, power quality, EV battery deterioration, energy cost, and so on, comprehensive solutions have not been achieved.
- ✓
- According to the literature, EV battery deterioration due to additional assistance to MGs has not been explored, taking into account all of the variables affecting the escalation of degradation.
- ✓
- The maximization of EV storage utilization, taking into account all techno-economic variables, has yet to be achieved in the current literature.
The following are some of the critical features of the proposed EMS:
- ▪
- Setting the OSD limit using the Water-Filling Algorithm.
- ▪
- Recognizing the possibility of EV exploitation for MG support in upcoming time zones.
- ▪
- Assigning ranks (EVS) to EVs using an FLC for the intelligent selection of EVs.
The key novelty aspects of the proposed EMS are:
- ▪
- An EV battery can be used at its highest level by considering the battery lifetime, and by obeying the MG codes’ transformer burden, the energy cost is concurrently decreased.
- ▪
- While exploiting the EV battery to a maximum extent, battery fading is possible and expressed in terms of DoD (Depth of Discharge) and SoC (State of Charge).
- ▪
- Voltage regulation, peak shaving, and valley filling are executed while diminishing the energy cost of the organization.
- ▪
- An optimal distribution of energy and power is achieved during the time scale.
- ▪
- The charging station (CS) operator easily handles techno-economic objectives.
- ▪
- An innovative EV prioritization model is established with the help of ANFIS with several input parameters.
- ▪
- An advanced probabilistic methodology is implemented to obtain the approximations of EV exploitation for forthcoming zones, enhancing the process of EV ranking.
The categorization of the remaining article is as follows: In continuation to Section 1, Section 2 describes the proposed scenario and EMS, Section 3 deals with EV modeling and energy economics, and Section 4 explains optimal EV storage usage. Finally, this article deals with prioritization strategies for EVs in Section 5.
2. Proposed Scenario and EMS
On-Grid MG Scenario
Electric vehicles (EVs) have the potential to become integral components of a smart grid, as they are capable of performing valuable services for power systems in addition to consuming energy. At the transmission system level, electric vehicles are critical for balancing intermittent renewable energy sources, such as wind power. This is because electric vehicles can absorb energy during periods of high electricity penetration and then feed it back into the grid when demand is high or electricity generation is insufficient. In addition, an EV is considered a portable load (grid-to-vehicle, or G2V) with storage accessibilities (vehicle-to-grid, or V2G) in power distribution networks. RES penetration is generally referred to as a microgrid’s energy contribution percentage. Higher levels of penetration demand more intelligent management systems due to the stochasticity in the amount of RES power generation. The proposed EMS is established in a grid-tied MG, consisting of diesel generators (DG), an EVCS with V2G and G2V functionality, PV panels, and load. It is proposed to accomplish MG functionality without needing additional energy sources by using existing EV storage. Though the required SoC must be reached before leaving the CS, it serves as a mobile load throughout the parking duration. The energy transactions are conducted using G2V and V2G features according to the EMS specifications.
The proposed EMS is intended to enhance the following objectives, simultaneously:
- ▪
- Peak shaving.
- ▪
- EV battery durability.
- ▪
- Energy cost minimization.
- ▪
- Utilization of EV storage to the maximum extent.
The MGEMS is depicted using a flowchart in Figure 1, which represents the EMS implementation flow. The systematic order of the proposed EMS is:
- The EV mobility data associated with Laxity and SoC for ancillary grid services are collected.
- The PV power, energy demand data, and tariff structure are collected.
- The energy needs of different zones are estimated in order to achieve the required load demand.
The aggregate energy availability of the respective zones is optimally distributed using the WFEDA. The required number of EVs are chosen through EV prioritization involving four decision variables. The EV Selection is executed with the help of ANFIS, which was trained with the MG operator’s decision-making capabilities for ranking. A novel probabilistic theory is proposed to estimate EUP. EUP further helps improve battery life, irrespective of V2G and G2V transitions.
3. EV Modelling and Energy Economics
3.1. EV Laxity
One of the critical decision variables in prioritization is Laxity (£). The term ‘Laxity’ indicates an EV’s feasible time duration for CS/MG support. The value of Laxity differs for charging and discharging cases and is represented by Equation (1). Laxity is represented in terms of time intervals [40]:
The relation between SoC and DoD is provided by Equation (2)
SoC = 1 − DoD
3.2. EV Storage Availability
To maximize the use of EV batteries for the V2G scenario, assessing their accessibility and SoC range is essential. In this article, the educational institution data were obtained from the biometric information from which the entry time and leaving time of an EV were extracted. Let and be the arrival and departure times of the ith EV at the tth interval for a given day. The aggregated probabilities are denoted by and . The probability of EV availability is denoted by Equation (3)
The vector representation of travel length/day is denoted by ‘L’, and ‘N’ indicates the no. of EVs.
The SoC at the time of arrival is represented by Equation (5)
The SoC used during the trip schedule is represented by Equation (6)
Here, is nothing but .
The decrement in SoC due to V2G is denoted by Equation (7), and the increment in SoC due to G2V is denoted by Equation (8):
is the probability of the ith EV’s availability for V2G at the tth interval.
The storage space availability for G2V is denoted by Equation (9), and for V2G, the accessible energy is denoted by Equation (10):
The storage availabilities for G2V and V2G in vector form are represented by Equations (12) and (14):
3.3. EV Battery Degradation
Three critical factors in EV battery degradation with day-to-day use are driving patterns, charging methods, and V2G services. All previous investigations have focused on one or two of these degradation factors, while an actual battery is subjected to a combination of all. To prevent battery degradation, the amounts of DoD and SoC in an EV’s battery are considered when determining the vehicle’s rank. These amounts are represented by Equations (15) and (16), taken from [41]:
3.4. Cost of Grid Power
The Indian tariff structure is used to evaluate the total energy cost, as shown in Table 1, and the total cost of grid intake energy is represented by Equation (17):
3.5. Solar Power Cost
The cost of solar power is produced by Equation (18)
Here, initial cost and maintenance cost. The per year is produced by Equation (19)
Now, Equation (18) is modified to represent per annum by Equation (20) and per month by Equation (21):
3.6. DG Power Cost
The sum of initial cost and operational cost gives total DG power cost.
The total initial cost is represented by Equation (24), with a per year basis:
The DG power tariff is rewritten as Equation (25) to denote the annum tariff. Equation (26) represents the monthly tariff:
The fuel consumption per kWh is produced by Equation (27) [42]
3.7. EV Charging Cost
The cost of charging for an EV is estimated using Equation (28), and the total charging cost for all EVs is calculated by using Equation (29):
Here, is the transacted energy via V2G, for this fleet operator paid an incentive () to the EV owner:
4. Optimal EV Storage Usage
The V2G/G2V scenarios enable EVs to deliver bi-directional flows of energy when connected to the grid supply system. A V2G scenario is executed based on a power connection and logical connection between the grid and an EV. The power connection permits the power transmission from the V2G/G2V scenarios. The logical connection provides communication between the EV and the grid to regulate when and in which direction to send the power.
4.1. OSD Using WFEDA
4.1.1. Zones of Energy Need
The Water-Filling Energy Distribution Algorithm (WFEDA) is commonly used in communication channels to optimally distribute power among sub-channels with varying noise levels. The WFEDA is used for the optimal distribution of energy among all the intervals of each zone. The main objective is to minimize the deviation in energy while subjected to the constraint of the total energy distributed over a zone that should not be exceeded by the energy available from the EVs. The 12 hrs. are partitioned into 48 intervals each of 15 min. The zones of energy needed for load flattening are identified as charging and discharging types, as shown in Figure 2. To attain the OED, the essential quantity of energy from EV storage for load flattening in each interval t and in zone ‘Z’ has to be estimated. The quantity of power that must be drawn from the grid is determined by Equation (31). The case study presented in this article consists of six zones, out of which three are charging zones, and the remaining three are discharging zones. The following equations represent the forecasted values of the energy requirements based on the forecasted load and solar power.
where .
In this section, the OSD is presented. The energy requirements for each zone and each interval were used to formulate the objectives and constraints. Here, the goal is to optimally dispatch the available energy from the EVs for either the charging zone or discharging zone. Here, the OSD is presented for both the charging and discharging zones. The WFEDA was used to achieve the OSD value for each interval of the given zone [43].
4.1.2. Problem Formulation
The minimization of deviation in power ( is the objective considered. It is formulated in terms of energy in Equation (36) and is transformed into a power format in Equation (37). The power and energy usage limitations are produced by Equations (37)–(39):
The energy usage constraint in each t is represented in Equation (38)
For the charging zone,
Equation (41) is derived from the Lagrange multiplier:
By deriving the equation (42), Equation (43) is obtained:
where . Here, represents the essential aggregate energy and EV charge demand. In Equation (44), the RHS does not depend on time, and hence :
The quantity of energy required in each interval of time (µ) is attained using the bisection strategy; here, the value of € is 0.01. At a particular instant in time t in any zone, the ideal value of is attained by the ideal value of µ [39]. A detailed step by step procedure of WFED algorithm for energy distribution is given in Algorithm 1.
| Algorithm 1. WFED Algorithm for energy distribution. |
| Input: , €,, for = (1, 2, 3, 4, 5…, 47, 48) in ‘z’ zone. Output: µ and for = (1, 2, 3, 4, 5, …, 47,48) in ‘z’ zone
|
5. Prioritization Strategy for EVs
The prioritization of EVs is critical for extending battery life, and the maximum amount of EV battery is utilized for V2G scenarios. Prioritization creates a win-win situation for both MG operators and EV owners, resulting in a more significant number of EV owners willing to participate in V2G. This section provides an in-depth demonstration of the EV Selection process. The EV Selection was executed with the help of ANFIS, which was trained with the MG operator’s decision-making capabilities for ranking. SoC, DoD, Laxity, and EUP were the decision variables in the EV Selection process. Decision variable mapping helps in the preparation of training data, and among all these variables, the usage probability (EUP) of an EV was estimated with a probabilistic approach.
5.1. EUP, Probabilistic Approach
The most efficient way to maintain an EV battery is to keep its SoC range between 0.2 and 0.8, and it is advised to avoid deep discharge and overcharge to improve its lifetime. Moreover, continuous changeovers between V2G and G2V are not recommended to prevent EV battery degradation. Here, a battery with peak SoC was used first to serve as V2G support to exploit maximum energy from the EV battery. From this point of view, this study presents an innovative EV ranking system that considers the exploitation of an EV battery and degradation factors concurrently, and this helps in the forecasting of EV battery usage in the forthcoming time intervals in the G2V and V2G scenarios. With this perspective, a new probability theory is presented to forecast the EV transition from G2V to V2G, and vice-versa, with the help of the STP ().
The EVs are intended to participate in the V2G scenario with their probabilities of state transitions (STPs) at various instants of time, as depicted in Figure 3, and the corresponding likelihoods of zone transitions (ZTPs) are also presented in Table 2. The substantial ZTPs are key terms for finding the corresponding STPs. is the vector representation of the ZTPs, based on the estimated energy need for peak shaving and valley filling; these ZTPs are attained, as represented in Figure 4 and Table 3, and formulated, as represented by Equation (47).
Here, = kth interval from the RHS to LHS, and is the no. of intervals in zone Z.
The Laxity,, and SoC of each of the available EVs help to determine the possible state transition in zone ‘Z’. Equation (48) produces the chance of state transition from V2G to V2G at an instant of. The possible outcomes of STP are represented by Equations (49)–(53) and shown in Figure 5:
where is the change in SoC.
If the EV is in the G2V mode, which means the upcoming zone is V2G, then
If the EV is in the V2G mode,
If the EV is in the G2V mode,
If the EV is in the V2G mode,
If the EV is in the V2G mode, (1 − SoC) is the key factor in the state transition and is represented by Equation (58), and a contradiction to this is the situation represented in Equation (59):
The possible zone transition (ZTP) of an EV in the forthcoming intervals from any of the state transitions (STPs) is represented by Equations (60)–(62). Here, :
5.2. EV Selection Using Anfis
ANFIS was developed in 1990 by Jyh-Shing and Roger Jang (Jang et al., 1995) and is a combination of an Artificial Neural Network (ANN) and Fuzzy Logic System [39]. ANFIS utilizes the learning ability of ANN to achieve the desired output. Depending upon the training data characteristics, ANN can assign a ranking. In this article, the data for training were prepared by the manual mapping of the four decision variables. A Sugeno-Type Fuzzy Inference System was used in this study, with five input and one output membership functions. The i/p and o/p values were converted into p.u values.
5.3. Training Data and EV Ranking
As previously mentioned, a training data set was organized by mapping four i/p parameters with the single o/p (rank). It was carried out by splitting the training data set into two sets of data with two i/p and one o/p, as shown in Table 4. The final ranking among the available EVs is obtained from the aggregate rank from the two stages of selecting EVs. It includes all four decision variables simultaneously with equal weightage. The training data fed to ANFIS is shown in Table 5. The performance of ANFIS can be observed in Table 6, which shows the final ranking for 13 EVs. Table 6 presents the execution of ANFIS (discharging case). The way mapping that was carried out can be understood in Table 4. In this study, decision parameters were mapped together only for the discharging scenarios, and the same technique can also be implemented for the charging cases. While training and mapping four decision variables simultaneously, there may be a chance of misinterpretation in the ranking system among the available EVs.
Only two variables were considered while training to overcome this difficulty, and the remaining parameters were considered in the next stage. In stage one, parameters favoring the CS were considered, while in the second stage, parameters favoring the EV owner were considered. The final rank of EVs was obtained from the aggregate of stages one and two. In the V2G scenario, both the EV owner and CS benefitted equally from this prioritization model’s help. Profits attained by EV owners through their contribution to grid support are a key factor that encourages EV owners to participate in grid support. Because of customer revenue maximization, it would be more economical for an EV to charge during time zones with lower electricity prices. Prioritizing EVs while using them for grid support is an important task to maximize the exploitation of an EV’s storage without inconveniencing the customer. Therefore, the EV Selection was based on their final ranks while participating in grid ancillary services.
6. Results and Discussions
The proposed MGEMS is implemented in a grid-tied MG (an educational organization), accompanying the PV generation, DGs, EVs, CS, and load, as shown in Figure 6. The simulation setup is taken from DiSC programming [44]. To investigate the benefits and impacts due to the reduction in maximum grid power intake (maximum demand ), three cases were considered:
Case A—450 kW Dmax,
Case B—400 kW Dmax,
Case C—350 kW Dmax.
The influence of the OPU, OSD, and ranking on the below-mentioned cases was analyzed (with ).
CASE 0—without proposed strategy,
CASE I—proposed scenario,
CASE II–excluding OSD,
CASE III—excluding EV ranking,
CASE IV—excluding Laxity and %SoC,
CASE V—excluding EUP and %DoD.
6.1. Energy Cost
The intelligent management of EV demand addresses an enhancement in the flexibility of power systems and reduces the costs of power system investment. The optimal grid authenticated power was not investigated; instead, random values were considered (450 kW, 400 kW, and 350 kW). For case B, the total energy cost was evaluated using Equation (17), per month. The impact of the proposed EMS was compared with other cases: CASE (II) and CASE (III). There is a chance of a significant increase in during load flattening due to the absence of prioritization and OSD, which may cause additional power usage from the grid, resulting in a penalty for the excess usage. This is shown in Figure 7, which compares all four different scenarios. reduces significantly with the proposed scenario, and for the three different cases, it is diminished by 12%, 14%, and 16%, respectively. Comparing the functionalities of the OSD with EVS, both of them play almost similar roles in terms of showing the impact on . EV storage exploitation to the maximum extent for ΔP and the lifetime improvement of the battery were the objectives of the ANFIS prioritization. OSD is not biased toward another object but aims to minimize ΔP. Consequently, there is a slightly higher impact on ΔP minimization by the OSD compared with the EVS. Compared with the ANFIS prioritization, the OSD is better at minimizing ΔP, since it is independent of any other parameters.
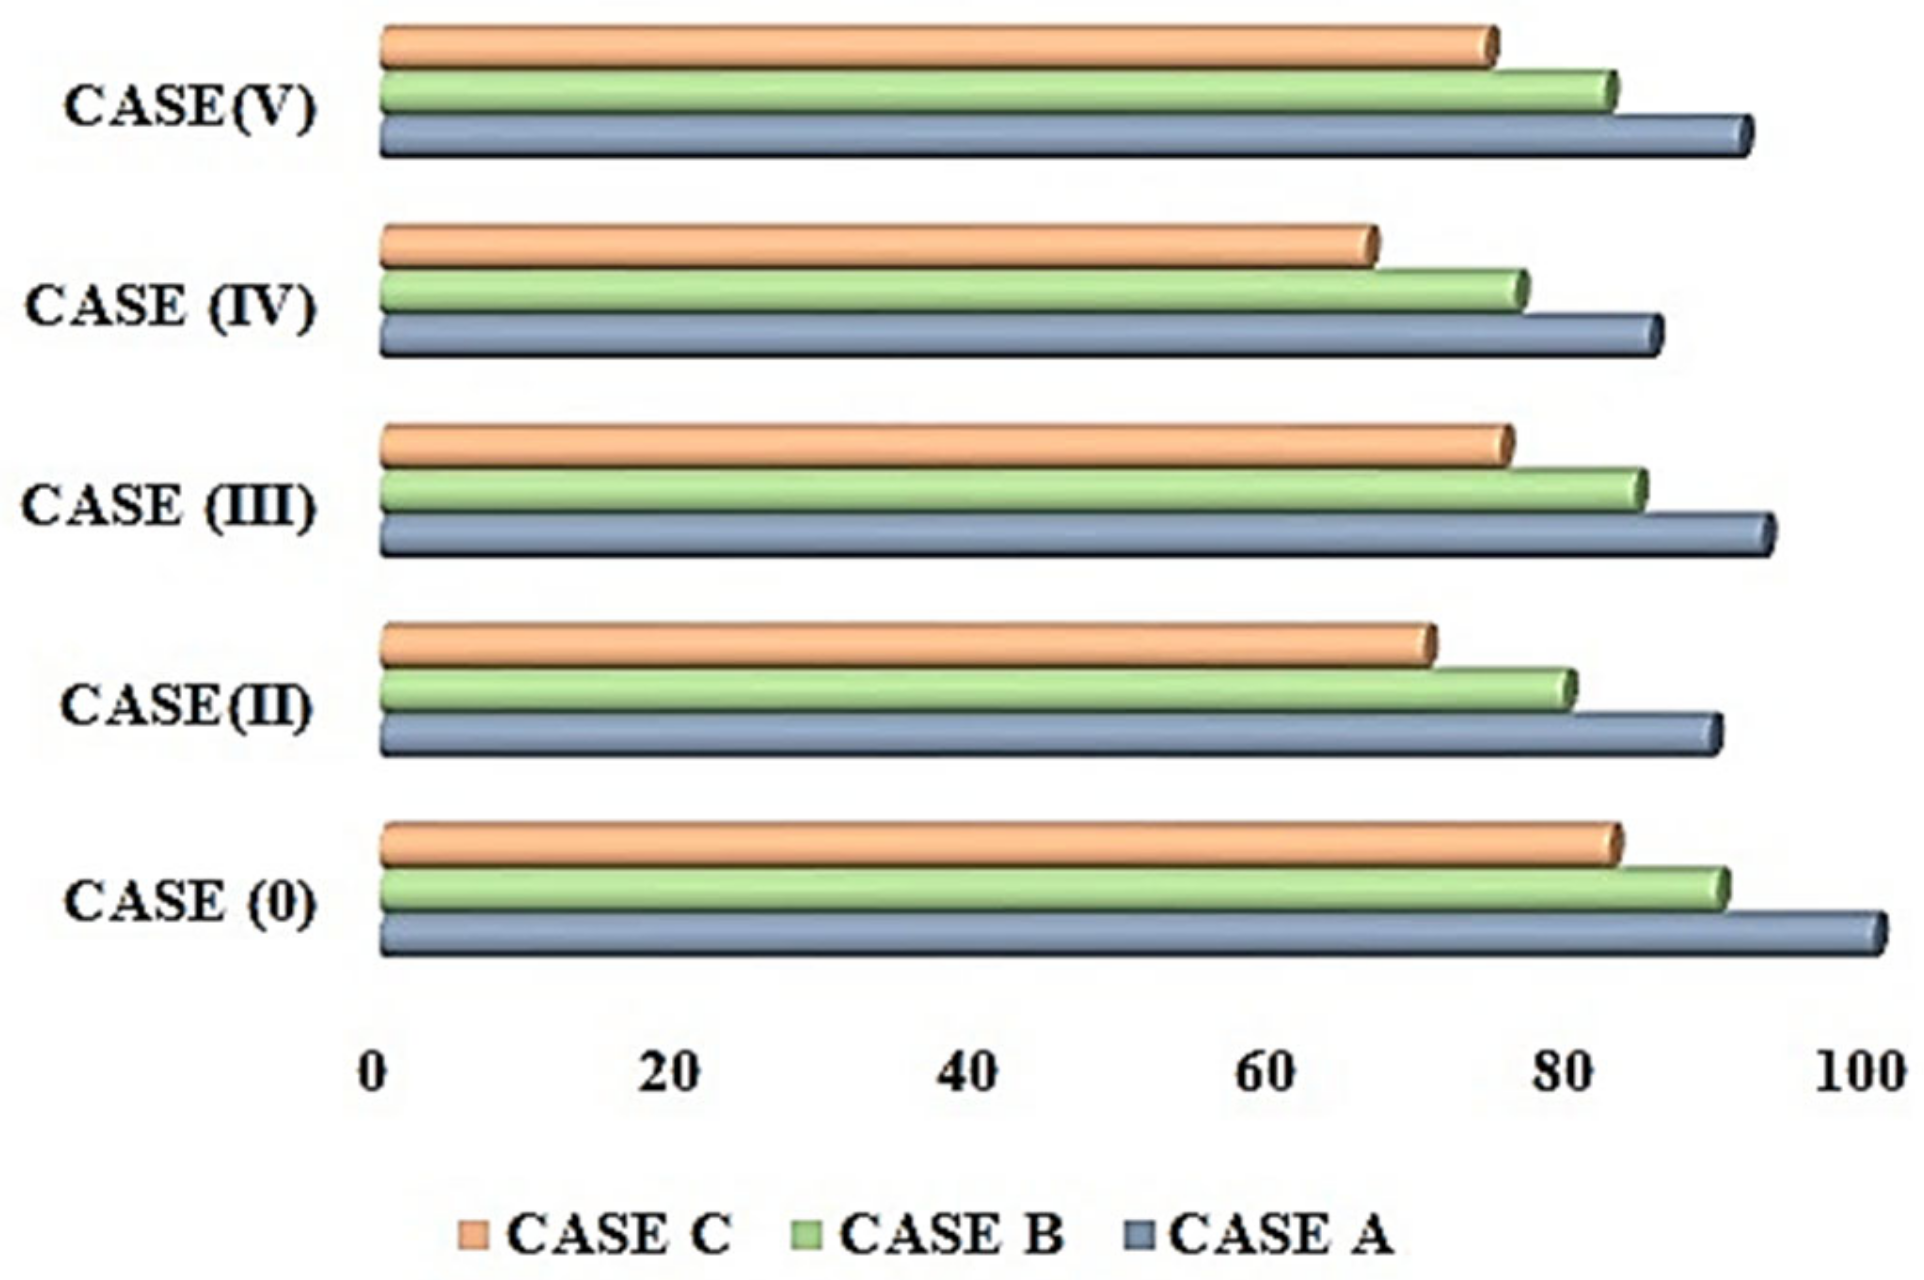
The role of a decision variable in the EV Selection process using ELC. is depicted in Figure 8. The exploitation of EV batteries is at a maximum when Laxity and SoC are considered decision parameters, which favors utility operators. DoD and EUP help minimize battery degradation (EV favor). It can be observed from Figure 8 that the MG perspective (CASE-V) may reduce the at maximum level, when compared with CASE-I, the proposed EMS. The battery degradation was not considered due to the absence of the decision variables DoD and EUP. The reduction in for CASE-V, compared with CASE-IV, is 9%, 12%, and 13.5% in cases A, B, and C, respectively. However, the win-win situation is always preferable (CASE-I), as it benefits EV owners while participating in grid ancillary services, without losing the state of health (SoH). In addition, there is a remarkable difference in between CASE-IV and CASE-V, with values estimated as 8.5%, 11.7%, and 12.5% in cases A, B, and C, respectively. The FLC decision is biased with a one-sided benefit, i.e., toward MG (CASE-V) or EV (CASE-IV).
6.2. Deviation in Power (ΔP)
The recommended EMS efficacy was examined using , which may not be the ideal amount of grid power needed. The cases mentioned earlier, from CASE-I to -V, are compared in Figure 9. The case without a proposed EMS is taken as the base case, and the remaining cases are illustrated. CASE-V is potentially the best of all, when and ΔP are taken into consideration. This is because this case is purely MG - favored, and it has a clear negative impact on ΔSoC, as depicted in Figure 10. On the other hand, CASE-III and IV have slight variations in their influence on the value of ΔP, as either of these studies leads to an ineffective way of using an EV battery. The statistical comparison is depicted in Figure 10 (comparison of mean and variability) and Figure 11 (standard deviation) for a better understanding. It is desirable to retain the grid intake power to the greatest extent feasible, to 450 kW or even less. Section 3 explains that exceeding the maximum demand leads to additional charges. It should be noted that the over-reduction in maximum demand from the grid () is not preferable as it demands numerous dedicated storage units apart from the EVs. In this article, the optimal value of was not evaluated. Instead, it was considered randomly, and the implications are studied as reported in cases A, B, and C. From Figure 10, it can be observed that CASE-V is the best of all cases, with its mean value near to 410 kW. CASE-I is the second-best, with a mean value of 425 kW. Finally, CASE-II is the undesirable one, with a mean value of around 465 kW, after which CASE-III and -IV follow, with 435 and 440 kW as their mean values. The same can be observed in Figure 11, where the standard deviations are shown for all the cases.
6.3. Impact of EV Ranking
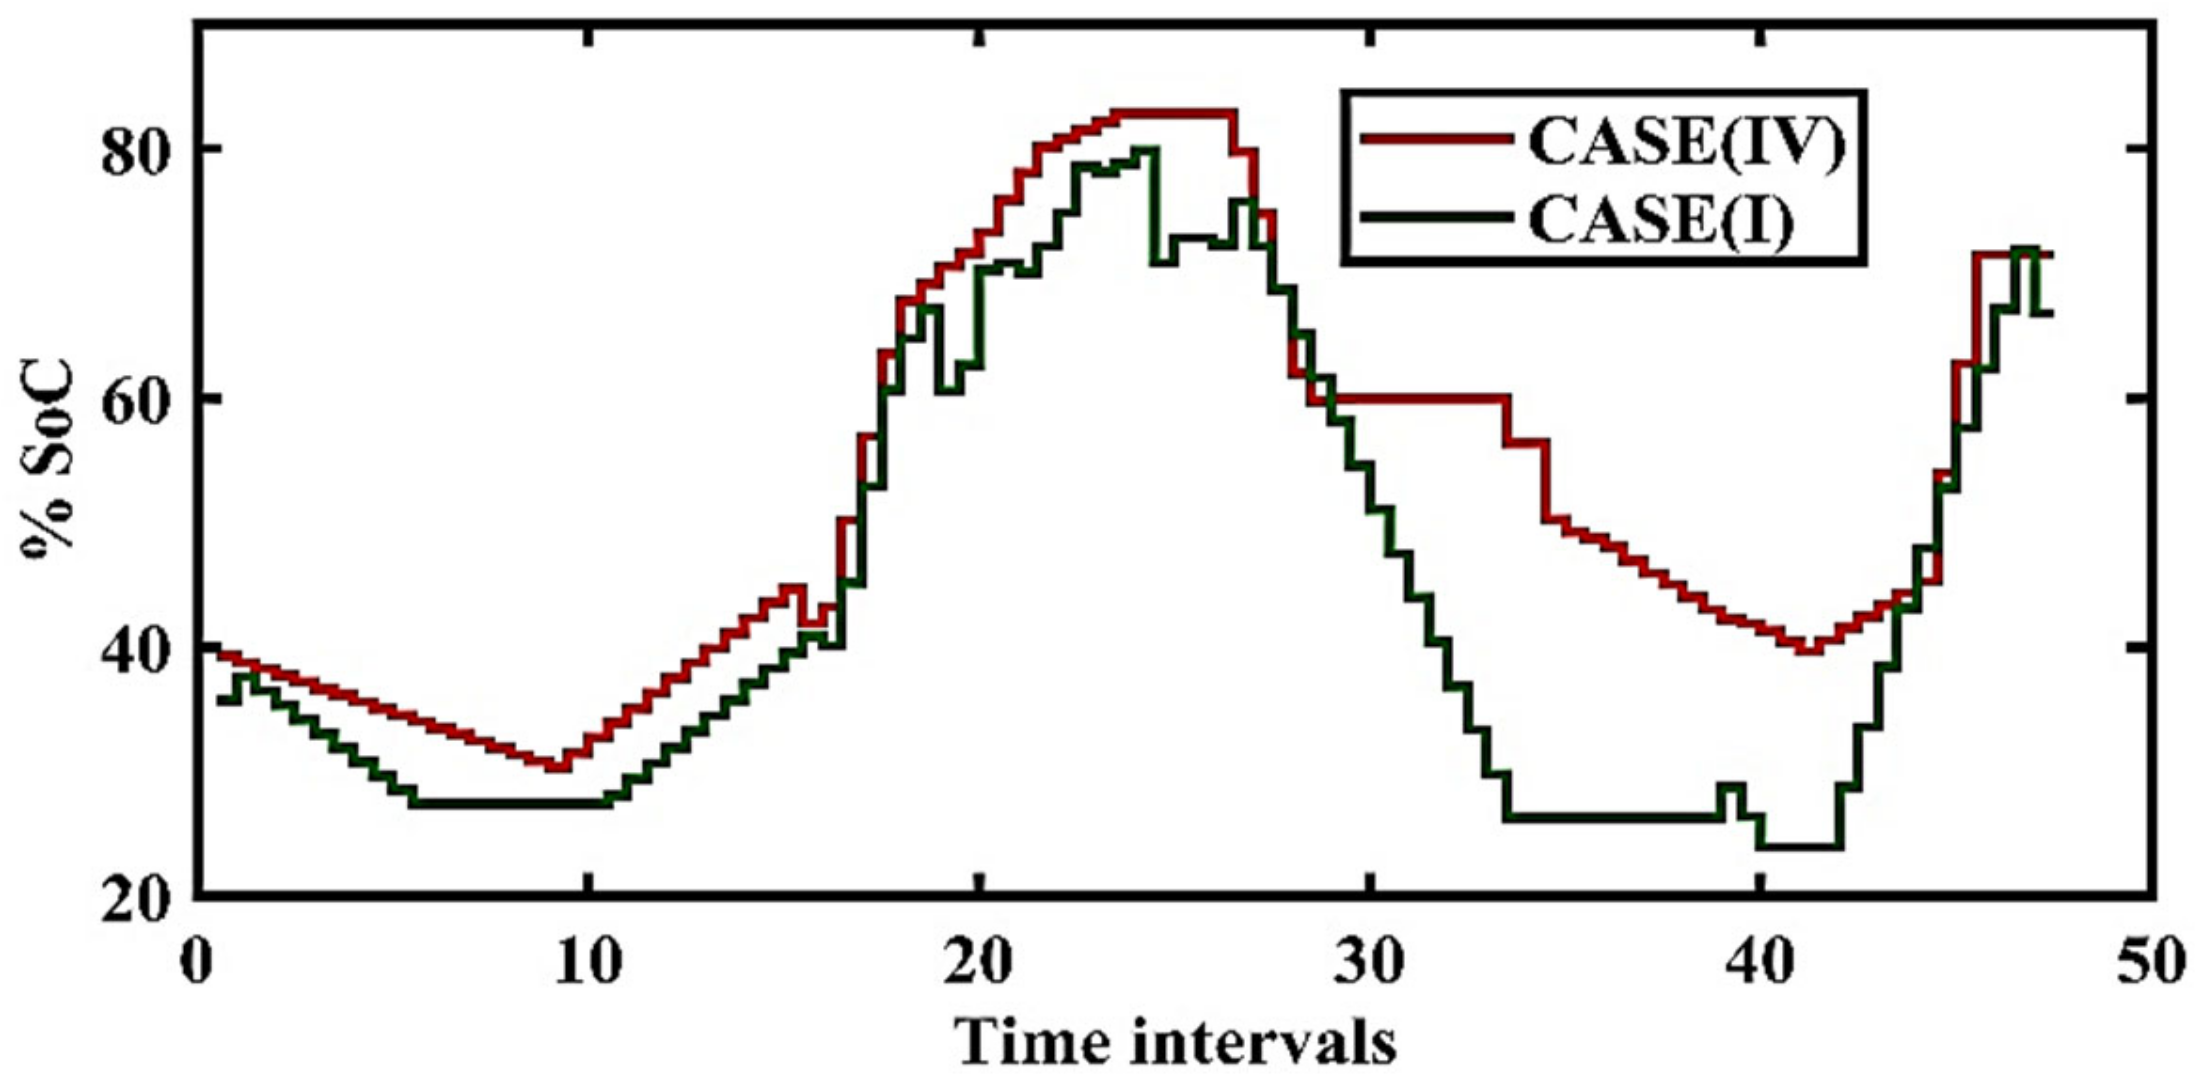
In this section, different aspects of the EVS are investigated in terms of ΔP, the energy from each EV (SoC), and the power available from all EVs (APA). In addition, the individual impacts of the decision variables during the EV ranking are presented by comparing different cases. As mentioned in Section 2, SoC levels should be maintained within the moderate range. Considering DoD and EUP as decision variables in the EV ranking process helps achieve the desired SoC profile. However, CASE-IV is purely an EV perspective that benefits battery longevity.
On the contrary, the same case works against the MG’s perspective, whereas CASE-V favors fleet operators, and SoC values are not maintained as desirable. The SoC variations are depicted in Figure 12, where the proposed scenario CASE-I and the scenario that favors EVs, i.e., CASE-IV, are compared, and in Figure 13 the proposed scenario and scenario which favors fleet operators are compared. The statistical representation of the mean and its variability of the SoC profile is presented in Figure 14. Here, CASE-II is not considered, as the absence of OSD will not impact the SoC profile. The mean SoC is around 48% for CASE-IV, with a variability between 40% and 60%, which dominates over CASE-I, with a 47% SoC and a variability between 60% and 70%. CASE-III has a 60% mean SoC, with a variability range between 40% and 80%. Since CASE-V ignores EUP and DoD as decision parameters, it is the worst among all the cases, with a 37% SoC and a variability between 28% and 65%. The APA shows a direct impact on valley filling/peak shaving at any time interval. Maximum EV battery can be exploited while considering Laxity and SoC as decision parameters in the ANFIS ranking system, i.e., CASE-V, which favors fleet operators.
On the contrary, CASE-IV leads to a lower APA, and a proportional impact on load flattening (min, ΔP) can be observed in Figure 15. In contrast, Figure 14 contradicts Figure 15 and Figure 16, where CASE-I is exceptional and favors both EVs and utility. Transacted power between EVs and the CS creates a similar influence. Table 7 Demonstrates the Comparative analysis of various cases of different parameters.
7. Conclusions
The minimization of intake power from the grid and were the two objectives achieved by the proposed strategy, which was conducted in two stages: the first was the OED using the WFA, and the second was the EV ranking using the ANFIS controller. The OED achieved a flat load via the optimal dispatch of available energy from the EVs in respective time intervals. The utilization of EV storage in each zone was optimized by the WFA, based on the energy needed and energy available to flatten the load. For the V2G and G2V operations, the utilization probabilities of the EVs during upcoming time intervals was estimated using the proposed probability technique. Proper EVs with sufficient SoC were chosen via the proposed probability technique to ensure the long lives of the EV batteries. The usefulness of the suggested strategy was studied in a grid-connected MG. The influence of the EV ranking and OED was investigated, and their outcomes were studied for various cases. The suggested strategy observed a significant reduction in the operating cost of the MG and in the deviation in grid power. In this study, all the factors that influence EV battery life were not fully considered. Here, mainly SoC limits, the number of transitions between V2G and G2V, and NoT conditions were considered. However, more sophisticated and intelligent decision-making strategies can be developed for EVS.
Author Contributions
Investigation, P.R.M.; Methodology, P.R.M.; Supervision, M.M.; Validation, M.M.; Writing—original draft, P.R.M.; Writing—review & editing, M.M. All authors have read and agreed to the published version of the manuscript.
Funding
This research did not receive any funding.
Data Availability Statement
Not applicable.
Conflicts of Interest
The authors declare no conflict of interest.
References
- Alizadeh, M.; Moghaddam, M.P.; Amjady, N.; Siano, P.; Sheikh-El-Eslami, M. Flexibility in future power systems with high renewable penetration: A review. Renew. Sustain. Energy Rev. 2016, 57, 1186–1193. [Google Scholar] [CrossRef]
- Meyn, S.; Negrete-Pincetic, M.; Wang, G.; Kowli, A.; Shafieepoorfard, E. The value of volatile resources in electricity markets. In Proceedings of the 49th IEEE Conference on Decision and Control (C.D.C.), Atlanta, GA, USA, 15–17 December 2010; pp. 1029–1036. [Google Scholar]
- Kempton, W.; Udo, V.; Huber, K.; Komara, K.; Letendre, S.; Baker, S.; Brunner, D.; Pearre, N. A Test of Vehicle-to-Grid (V2G) for Energy Storage and Frequency Regulation in the P.J.M. System. 2008. Available online: http://www1.udel.edu/V2G/resources/test-v2g-in-pjm-jan09.pdf (accessed on 14 August 2022).
- Mets, K.; Verschueren, T.; Haerick, W.; Develder, C.; de Turck, F. Optimizing smart energy control strategies for plug-in hybrid electric vehicle charging. In Proceedings of the 2010 IEEE/IFIP Network Operations and Management Symposium Workshops, Osaka, Japan, 19–23 April 2010; pp. 293–299. [Google Scholar]
- Tomić, J.; Kempton, W. Using fleets of electric-drive vehicles for grid support. J. Power Sources 2007, 168, 459–468. [Google Scholar] [CrossRef]
- Göransson, L.; Karlsson, S.; Johnsson, F. Integration of plug-in hybrid electric vehicles in a regional wind-thermal power system. Energy Policy 2010, 38, 5482–5492. [Google Scholar] [CrossRef]
- Pillai, J.R.; Bak-Jensen, B. Electric vehicle-based battery storages for future power system regulation services. In Proceedings of the 5th Nordic Wind Power Conference, Rønne, Denmark, 10–11 September 2009; pp. 1–8. [Google Scholar]
- Li, C.-T.; Ahn, C.; Peng, H.; Sun, J. Synergistic control of plug-in vehicle charging and wind power scheduling. IEEE Trans. Power Syst. 2012, 28, 1113–1121. [Google Scholar] [CrossRef]
- Lin, J.; Leung, K.-C.; Li, V.O.K. Optimal Scheduling With Vehicle-to-Grid Regulation Service. IEEE Internet Things J. 2014, 1, 556–569. [Google Scholar] [CrossRef] [Green Version]
- Donadee, J.; Ilic, M.D. Stochastic Optimization of Grid to Vehicle Frequency Regulation Capacity Bids. IEEE Trans. Smart Grid 2014, 5, 1061–1069. [Google Scholar] [CrossRef]
- Liu, H.; Hu, Z.; Song, Y.; Lin, J. Decentralized Vehicle-to-Grid Control for Primary Frequency Regulation Considering Charging Demands. IEEE Trans. Power Syst. 2013, 28, 3480–3489. [Google Scholar] [CrossRef]
- Pujari, H.K.; Rudramoorthy, M. Optimal design and techno-economic analysis of a hybrid grid-independent renewable energy system for a rural community. Int. Trans. Electr. Energy Syst. 2021, 31, e13007. [Google Scholar] [CrossRef]
- Wu, C.; Mohsenian-Rad, H.; Huang, J. Vehicle-to-Aggregator Interaction Game. IEEE Trans. Smart Grid 2011, 3, 434–442. [Google Scholar] [CrossRef]
- Escudero-Garzas, J.J.; Garcia-Armada, A.; Seco-Granados, G. Fair Design of Plug-in Electric Vehicles Aggregator for V2G Regulation. IEEE Trans. Veh. Technol. 2012, 61, 3406–3419. [Google Scholar] [CrossRef]
- Yao, E.; Wong, V.W.S.; Schober, R. Robust Frequency Regulation Capacity Scheduling Algorithm for Electric Vehicles. IEEE Trans. Smart Grid 2016, 8, 984–997. [Google Scholar] [CrossRef]
- Liu, H.; Hu, Z.; Song, Y.; Wang, J.; Xie, X. Vehicle-to-Grid Control for Supplementary Frequency Regulation Considering Charging Demands. IEEE Trans. Power Syst. 2015, 30, 3110–3119. [Google Scholar] [CrossRef]
- Vagropoulos, S.I.; Kyriazidis, D.K.; Bakirtzis, A.G. Real-Time Charging Management Framework for Electric Vehicle Aggregators in a Market Environment. IEEE Trans. Smart Grid 2015, 7, 948–957. [Google Scholar] [CrossRef]
- Le Floch, C.; Kara, E.C.; Moura, S. PDE Modeling and Control of Electric Vehicle Fleets for Ancillary Services: A Discrete Charging Case. IEEE Trans. Smart Grid 2016, 9, 573–581. [Google Scholar] [CrossRef]
- Sun, S.; Dong, M.; Liang, B. Real-Time Welfare-Maximizing Regulation Allocation in Dynamic Aggregator-EVs System. IEEE Trans. Smart Grid 2014, 5, 1397–1409. [Google Scholar] [CrossRef] [Green Version]
- He, Y.; Venkatesh, B.; Guan, L. Optimal Scheduling for Charging and Discharging of Electric Vehicles. IEEE Trans. Smart Grid 2012, 3, 1095–1105. [Google Scholar] [CrossRef]
- Nguyen, H.N.T.; Zhang, C.; Mahmud, A. Optimal Coordination of G2V and V2G to Support Power Grids with High Penetration of Renewable Energy. IEEE Trans. Transp. Electrif. 2015, 1, 188–195. [Google Scholar] [CrossRef]
- Harish Kumar, P.; Mageshvaran, R.; Baleboina, G.M.; Vasavi, K. Impact of Distributed Generation on Distribution System Under Fault and Islanding Condition. In Advances in Smart Grid Technology; Springer: Singapore, 2021; pp. 135–150. [Google Scholar]
- Wang, B.; Wang, Y.; Nazaripouya, H.; Qiu, C.; Chu, C.C.; Gadh, R. Predictive Scheduling Framework for Electric Vehicles with Uncertainties of User Behaviors. IEEE Internet Things J. 2016, 4, 52–63. [Google Scholar] [CrossRef]
- Tushar, M.H.K.; Zeineddine, A.W.; Assi, C. Demand-Side Management by Regulating Charging and Discharging of the EV, E.S.S., and Utilizing Renewable Energy. IEEE Trans. Ind. Informat. 2018, 14, 117–126. [Google Scholar] [CrossRef]
- Tushar, W.; Yuen, C.; Huang, S.; Smith, D.B.; Poor, H.V. Cost Minimization of Charging Stations with Photovoltaics: An Approach with EV Classification. IEEE Trans. Intell. Transp. Syst. 2015, 17, 156–169. [Google Scholar] [CrossRef]
- Wu, X.; Hu, X.; Moura, S.; Yin, X.; Pickert, V. Stochastic control of smart home energy management with plug-in electric vehicle battery energy storage and photovoltaic array. J. Power Sources 2016, 333, 203–212. [Google Scholar] [CrossRef] [Green Version]
- Trovão, J.P.; Pereirinha, P.G.; Jorge, H.M.; Antunes, C.H. A multi-level energy management system for multi-source electric vehicles–an integrated rule-based meta-heuristic approach. Appl. Energy 2013, 105, 304–318. [Google Scholar] [CrossRef]
- Melhem, F.Y.; Grunder, O.; Hammoudan, Z.; Moubayed, N. Optimization and Energy Management in Smart Home Considering Photovoltaic, Wind, and Battery Storage System with Integration of Electric Vehicles. Can. J. Electr. Comput. Eng. 2017, 40, 128–138. [Google Scholar] [CrossRef]
- Khodayar, M.E.; Wu, L.; Shahidehpour, M. Hourly Coordination of Electric Vehicle Operation and Volatile Wind Power Generation in S.C.U.C. IEEE Trans. Smart Grid 2012, 3, 1271–1279. [Google Scholar] [CrossRef]
- Zhou, C.; Qian, K.; Allan, M.; Zhou, W. Modeling of the Cost of EV Battery Wear Due to V2G Application in Power Systems. IEEE Trans. Energy Convers. 2011, 26, 1041–1050. [Google Scholar] [CrossRef]
- Han, B.; Lu, S.; Xue, F.; Jiang, L.; Xu, X. Three-stage electric vehicle scheduling considering stakeholders economic inconsistency and battery degradation. IET Cyber-Physical Syst. Theory Appl. 2017, 2, 102–110. [Google Scholar] [CrossRef]
- Ghofrani, M.; Arabali, A.; Etezadi-Amoli, M.; Fadali, M.S. Smart Scheduling and Cost-Benefit Analysis of Grid-Enabled Electric Vehicles for Wind Power Integration. IEEE Trans. Smart Grid 2014, 5, 2306–2313. [Google Scholar] [CrossRef]
- Moura, S.J.; Stein, J.L.; Fathy, H.K. Battery-Health-Conscious Power Management in Plug-In Hybrid Electric Vehicles via Electrochemical Modeling and Stochastic Control. IEEE Trans. Control Syst. Technol. 2012, 21, 679–694. [Google Scholar] [CrossRef]
- Nunna, H.K.; Battula, S.; Doolla, S.; Srinivasan, D. Energy Management in Smart Distribution Systems with Vehicle-to-Grid Integrated Microgrids. IEEE Trans. Smart Grid 2016, 9, 4004–4016. [Google Scholar] [CrossRef]
- Abdulla, K.; Hoog, J.D.; Muenzel, V.; Suits, F.; Steer, K.; Wirth, A.; Halgamuge, S. Optimal operation of energy storage systems considering forecasts and battery degradation. IEEE Trans. Smart Grid 2016, 9, 2086–2096. [Google Scholar] [CrossRef]
- Carli, R.; Dotoli, M. A Distributed Control Algorithm for Waterfilling of Networked Control Systems via Consensus. IEEE Control Syst. Lett. 2017, 1, 334–339. [Google Scholar] [CrossRef]
- Carli, R.; Cavone, G.; Pippia, T.; De Schutter, B.; Dotoli, M. Robust Optimal Control for Demand Side Management of Multi-Carrier Microgrids. IEEE Trans. Autom. Sci. Eng. 2022, 19, 1338–1351. [Google Scholar] [CrossRef]
- Karimi, H.; Jadid, S. Optimal energy management for multi-microgrid considering demand response programs: A stochastic multi-objective framework. Energy 2020, 195, 116992. [Google Scholar] [CrossRef]
- Ma, Z.; Callaway, D.S.; Hiskens, I.A. Decentralized Charging Control of Large Populations of Plug-in Electric Vehicles. IEEE Trans. Control Syst. Technol. 2012, 21, 67–78. [Google Scholar] [CrossRef]
- Subramanian, M.; Garcia, J.; Callaway, D.S.; Poolla, K.; Varaiya, P. Real-time scheduling of distributed resources. IEEE Trans. Smart Grid 2013, 4, 2122–2130. [Google Scholar] [CrossRef]
- Hoke, A.; Brissette, A.; Smith, K.; Pratt, A.; Maksimovic, D. Accounting for Lithium-Ion Battery Degradation in Electric Vehicle Charging Optimization. IEEE J. Emerg. Sel. Top. Power Electron. 2014, 2, 691–700. [Google Scholar] [CrossRef]
- Cecati, C.; Citro, C.; Siano, P. Combined Operations of Renewable Energy Systems and Responsive Demand in a Smart Grid. IEEE Trans. Sustain. Energy 2011, 2, 468–476. [Google Scholar] [CrossRef]
- Reddy, K.R.; Meikandasivam, S.; Vijayakumar, D. A novel strategy for maximization of plug-In electric vehicle’s storage utilization for grid support with consideration of customer flexibility. Electr. Power Syst. Res. 2019, 170, 158–175. [Google Scholar] [CrossRef]
- Pedersen, R.; Sloth, C.; Andresen, G.B.; Wisniewski, R. DiSC: A simulation framework for distribution system voltage control. In Proceedings of the 2015 European Control Conference (ECC), Linz, Austria, 15–17 July 2015. [Google Scholar]
Figure 1.
Proposed EMS for MG in flowchart illustration.


Figure 2.
Representation of WFEDA for the OED.

Figure 3.
Possible transitions of an EV.

Figure 4.
Estimation of zone transition probabilities of an EV.

Figure 5.
S.T.P.s of the EVs for the next possible intervals.

Figure 6.
DiSC simulation setup to implement the suggested EMS.

Figure 7.
Comparison of operating cost of MG for different cases.

Figure 8.
Comparison of operating cost of MG based on EV Selection process.

Figure 9.
Grid power deviation for different case studies.

Figure 10.
Grid power deviations (mean and variability) for different cases.

Figure 11.
Grid power deviations (standard deviations) for different cases.

Figure 12.
SoC statistics at various instants for cases (I) and (IV).

Figure 13.
SoC statistics at various instants for cases (IV) and (V).

Figure 14.
Statistics on the SoC outline for various cases.

Figure 15.
Microgrid power deviation for various cases.

Figure 16.
Aggregate power availabilities of EVs in various cases.


Table 1.
Grid tariff structure.
| Range | Charge (Rs.) | Type of Tariff |
|---|---|---|
| 0 to 80% of | Fixed Charges | |
| 80 to 100% of | Semi-Fixed Charges | |
| >100% of | With Penalty Charges | |
| 0 to 7000 kWh | Fixed Charges | |
| >7000 kWh | Variable Charges |
Cost of grid power = FT + SFT + VT + PT; FC = fixed tariff; SFC = semi fixed tariff; VC = variable tariff; and PC = penalty tariff.
Table 2.
Transition probabilities at a given time interval.
| G2V/1 | V2G/2 | NoT/3 | |
|---|---|---|---|
| G2V/1 | ZTP11 | ZTP12 | ZTP13 |
| V2G/2 | ZTP21 | ZTP22 | ZTP23 |
| NoT/3 | ZTP31 | ZTP32 | ZTP33 |
Table 3.
Estimation of zone transition probabilities.
| Ti | P(Z.T.) | Ti | P(Z.T.) | Ti | P(Z.T.) | Ti | P(ZT) |
|---|---|---|---|---|---|---|---|
| 1 | 0.91 | 13 | 0.85 | 25 | 0.61 | 37 | 0.80 |
| 2 | 0.82 | 14 | 0.93 | 26 | 0.57 | 38 | 0.78 |
| 3 | 0.73 | 15 | 0.96 | 27 | 0.54 | 39 | 0.76 |
| 4 | 0.64 | 16 | 0.93 | 28 | 0.50 | 40 | 0.74 |
| 5 | 0.55 | 17 | 0.89 | 29 | 0.98 | 41 | 0.72 |
| 6 | 0.45 | 18 | 0.86 | 30 | 0.96 | 42 | 0.70 |
| 7 | 0.36 | 19 | 0.82 | 31 | 0.93 | 43 | 0.67 |
| 8 | 0.27 | 20 | 0.79 | 32 | 0.91 | 44 | 0.65 |
| 9 | 0.18 | 21 | 0.75 | 33 | 0.89 | 45 | 0.63 |
| 10 | 0.09 | 22 | 0.71 | 34 | 0.87 | 46 | 0.61 |
| 11 | 0.00 | 23 | 0.68 | 35 | 0.85 | 47 | 0.98 |
| 12 | 0.92 | 24 | 0.64 | 36 | 0.83 | 48 | 0.96 |
Table 4.
Decision parameters mapping (discharging case).
| S.NO | SOC | £ | RANK 1 | DOD | EUP | RANK 2 | RANK |
|---|---|---|---|---|---|---|---|
| 1 | 0.3 | 0.3 | 16 | 0.7 | 0.4 | 16 | 16 |
| 2 | 0.4 | 0.2 | 14 | 0.6 | 0.4 | 14 | 14 |
| 3 | 0.5 | 0.2 | 12 | 0.5 | 0.3 | 12 | 12 |
| 4 | 0.6 | 0.3 | 9 | 0.4 | 0.9 | 10 | 10 |
| 5 | 0.7 | 0.5 | 5 | 0.3 | 0.4 | 6 | 6 |
| 6 | 0.8 | 0.5 | 2 | 0.2 | 0.6 | 5 | 4 |
| 7 | 0.8 | 0.4 | 3 | 0.2 | 0.8 | 4 | 4 |
| 8 | 0.6 | 0.6 | 7 | 0.4 | 0.5 | 9 | 8 |
| 9 | 0.3 | 0.7 | 15 | 0.7 | 0.6 | 15 | 15 |
| 10 | 0.4 | 0.4 | 13 | 0.6 | 0.8 | 13 | 13 |
| 11 | 0.5 | 0.6 | 10 | 0.5 | 0.7 | 10 | 10 |
| 12 | 0.6 | 0.5 | 8 | 0.4 | 0.8 | 8 | 8 |
| 13 | 0.7 | 0.7 | 4 | 0.3 | 0.6 | 7 | 6 |
| 14 | 0.8 | 0.6 | 1 | 0.2 | 0.5 | 6 | 4 |
| 15 | 0.7 | 0.3 | 6 | 0.3 | 0.6 | 7 | 7 |
| 16 | 0.5 | 0.5 | 11 | 0.5 | 0.5 | 11 | 11 |
Table 5.
Training data for EV ranking.
| SOC | £ | DOD | EUP | RANK |
|---|---|---|---|---|
| 0.3 | 0.3 | 0.7 | 0.6 | 11.0 |
| 0.4 | 0.4 | 0.6 | 0.4 | 9.0 |
| 0.5 | 0.2 | 0.5 | 0.7 | 7.0 |
| 0.6 | 0.3 | 0.4 | 0.9 | 5.0 |
| 0.7 | 0.5 | 0.3 | 0.4 | 2.0 |
| 0.8 | 0.5 | 0.2 | 0.6 | 1.0 |
| 0.8 | 0.4 | 0.2 | 0.8 | 1.0 |
| 0.6 | 0.6 | 0.4 | 0.9 | 8.0 |
| 0.3 | 0.7 | 0.7 | 0.6 | 10.0 |
| 0.4 | 0.4 | 0.6 | 0.8 | 8.0 |
| 0.5 | 0.6 | 0.5 | 0.7 | 5.0 |
| 0.6 | 0.5 | 0.4 | 0.8 | 4.0 |
| 0.7 | 0.7 | 0.3 | 0.6 | 2.0 |
| 0.8 | 0.6 | 0.2 | 0.5 | 1.0 |
| 0.7 | 0.3 | 0.3 | 0.6 | 3.0 |
| 0.5 | 0.5 | 0.5 | 0.5 | 6.0 |
Table 6.
Actual ranking of EVs.
| SOC | £ | DOD | EUP | RANK |
|---|---|---|---|---|
| 0.6 | 0.6 | 0.4 | 0.9 | 8.0 |
| 0.3 | 0.7 | 0.7 | 0.6 | 10.0 |
| 0.8 | 0.6 | 0.2 | 0.5 | 1.0 |
| 0.7 | 0.3 | 0.3 | 0.6 | 3.0 |
| 0.5 | 0.5 | 0.5 | 0.5 | 6.0 |
| 0.6 | 0.5 | 0.4 | 0.8 | 4.0 |
| 0.7 | 0.3 | 0.3 | 0.6 | 3.0 |
| 0.3 | 0.3 | 0.7 | 0.6 | 11.0 |
| 0.4 | 0.4 | 0.6 | 0.4 | 9.0 |
| 0.5 | 0.2 | 0.5 | 0.7 | 7.0 |
| 0.6 | 0.3 | 0.4 | 0.9 | 5.0 |
| 0.7 | 0.5 | 0.3 | 0.4 | 2.0 |
| 0.5 | 0.5 | 0.5 | 0.5 | 6.0 |
Table 7.
Comparative analysis of various cases of different parameters.
| CASE | Economical | ΔP | SoC Profile | Mean and Variability | Standard Deviation | Aggregate EV Power |
|---|---|---|---|---|---|---|
| CASE(I) | Optimal | Optimal | Optimal | Optimal | Optimal | Optimal |
| CASE (II) | Best | Moderate | No Impact | Worst | Moderate | Not Applicable |
| CASE (III) | Moderate | Best | Moderate | Moderate | Worst | Moderate |
| CASE (IV) | Moderate | Moderate | Best | Moderate | Moderate | Worst |
| CASE(V) | Best | Best | Low | Best | Best | Best |
Publisher’s Note: MDPI stays neutral with regard to jurisdictional claims in published maps and institutional affiliations. |
© 2022 by the authors. Licensee MDPI, Basel, Switzerland. This article is an open access article distributed under the terms and conditions of the Creative Commons Attribution (CC BY) license (https://creativecommons.org/licenses/by/4.0/).
Share and Cite
MDPI and ACS Style
Madhavaram, P.R.; M, M. Smart Energy Management Strategy for Microgrids Powered by Heterogeneous Energy Sources and Electric Vehicles’ Storage. Energies 2022, 15, 7739. https://doi.org/10.3390/en15207739
AMA Style
Madhavaram PR, M M. Smart Energy Management Strategy for Microgrids Powered by Heterogeneous Energy Sources and Electric Vehicles’ Storage. Energies. 2022; 15(20):7739. https://doi.org/10.3390/en15207739
Chicago/Turabian StyleMadhavaram, Poornachandra Reddy, and Manimozhi M. 2022. "Smart Energy Management Strategy for Microgrids Powered by Heterogeneous Energy Sources and Electric Vehicles’ Storage" Energies 15, no. 20: 7739. https://doi.org/10.3390/en15207739
Note that from the first issue of 2016, this journal uses article numbers instead of page numbers. See further details here.