
Experimental Investigation on Heat Transfer and Pressure Drop of Supercritical Carbon Dioxide in a Mini Vertical Upward Flow

1
School of Nuclear Science and Engineering, North China Electric Power University, Beijing 102206, China
2
State Key Laboratory of Multiphase Flow in Power Engineering, Xi’an Jiaotong University, No. 28 Xianning West Road, Xi’an 710049, China
*
Author to whom correspondence should be addressed.
Energies 2022, 15(17), 6135; https://doi.org/10.3390/en15176135
Submission received: 14 July 2022
/
Revised: 14 August 2022
/
Accepted: 19 August 2022
/
Published: 24 August 2022
(This article belongs to the Special Issue Advanced Research on Supercritical Carbon Dioxide in Thermal Energy and Power Engineering)
Abstract
:Experiments on the convection heat transfer and pressure drop of supercritical carbon dioxide in a mini vertical upward flow were investigated in a smooth tube with an inner diameter of 2 mm. The experiments were conducted with pressures ranging from 7.62 to 8.44 MPa, mass fluxes ranging from 600 to 1600 kg·m−2·s−1, and heat flux ranging from 49.3 to 152.3 kW·m−2. Results show that the peak of heat transfer occurs when the bulk fluid temperature is below the proposed critical temperature and the wall temperature is above the proposed critical temperature. For the 2 mm vertical upward flow, the radial buoyancy effects are relatively weak, and the axial thermal acceleration effect cannot be negligible. In this study, a new modified Jackson correlation for the supercritical carbon dioxide is proposed for convective heat transfer. To reflect the effect of flow acceleration on heat transfer, a dimensionless heat flux was introduced to construct a new semi-correlation of heat transfer. The new correlation of friction factor taking into account the variation of density and dynamic viscosity was proposed with 146 experimental data within a ±20% error band.

1. Introduction
Supercritical CO2 (S-CO2) is treated as a promising working fluid for many cutting-edge industrial applications such as concentrated solar power of S-CO2 power cycle [1,2], next-generation nuclear reactors [3], nuclear hydrogen production [4], and carbon capture and storage [5,6], due to its advantages of environmental friendliness [7] and heat transfer effectiveness. In order to improve the performance of relevant systems and components, the heat transfer mechanism and prediction of supercritical CO2 have become an important and attractive research topic [8,9].
However, the thermophysical properties of S-CO2 exhibit a steep gradient in the proximity of its pseudocritical point, both across and in the direction of the flow. Extreme transverse and axial variations in the fluid density will change flow structure and induce radial buoyancy forces and axial flow acceleration effects, respectively. The axial flow acceleration effects of fluid along the flow direction can weaken the turbulent thermal transport. This is mainly due to the change in density distance along the flow direction, thus creating an additional pressure gradient, which inhibits the mixing of the core fluid with the fluid near the wall [10,11]. If the flow acceleration effect continues to act on the length of test section, it may lead to a transition from a turbulent to a laminar boundary layer, resulting in a dramatic reduction in heat transfer capacity [12]. McEligot [13] proposed the following dimensionless number () for the acceleration flow effects. The parameter for dimensionless heat flux can be expressed as . McEligot found that the flow acceleration effect can be neglected when the reduction in Nu number is less than 5%. In this study, the dimensionless heat flux () was used as a benchmark to judge the effect of flow acceleration on heat transfer. The buoyancy effect acts on the fluid in the cross-section, changing the viscous layer near the wall to influence heat transfer. The influence of the buoyancy effect on heat transfer can be explained by, for example, the percentage of shear stress or the transformation of the turbulent flow pattern in the boundary layer. Jackson derives a criterion for judging the effect of buoyancy forces acting in turbulent flows by considering the distribution of turbulent shear stresses at the viscous layer. When the dimensionless factor satisfies , the shear stress in the cross-section caused by buoyancy force is less than 10% of the total shear stress, which corresponds to a 5% reduction in the number of Nu, and the effect of the buoyancy force can be neglected. This criterion is widely used to judge the influence of buoyancy effects on heat transfer in supercritical fluids [14,15]. Many researchers have established different evaluation benchmarks of buoyancy and flow acceleration effects for different combinations of system parameters [10,16,17,18,19]. Lei proposed that the buoyancy effect significantly influences the cooling heat transfer of supercritical carbon dioxide [20].
While the role of flow acceleration and buoyancy effects for supercritical fluids has been taken into account in some mechanistic models for different macroscale experimental sections [21,22,23,24], it is unclear if the same insights extrapolate to the flow of the mini vertical upward tube. At the same time, in the utilization of the supercritical carbon dioxide Brayton cycle for nuclear reactor energy [3], the heat exchange characteristics of the printed circuit heat exchanger (PCHE) are the key parameters that determine its performance, and the diameter of the flow channel inside the PCHE is 1~2 mm. The larger the pipe diameter, the stronger the buoyancy and thermal acceleration effects, resulting in a heat transfer model within a large pipe diameter that is not applicable to the heat transfer model within a small channel. Therefore, the mini vertical upward test section was constructed to explore the heat transfer mechanism of supercritical carbon dioxide in the mini tube. The effects of system parameter and flow acceleration and the buoyancy effect are discussed in this research.
2. Experimental Setup and Method
An experimental loop (Figure 1) was laid out and constructed to quantify heat transfer in the vertical upward flow for supercritical carbon dioxide. The major parameters that were controlled and measured were inlet pressure, heat flux, mass flux, fluid, and wall temperature. Before running the system, the air of the system was removed by a vacuum pump, and then the system was kept at a certain vacuum to check the sealing of system tubes. We started the water chilling unit and then charged the system with a high-pressure CO2 cylinder. CO2 was liquefied under high pressure and stored in the liquid accumulator. The constant-flow pump drove the liquid CO2 into the experimental loop. The accumulator that connected with the N2 cylinder was used to reduce the fluctuations. The fluid of the experimental section was heated by the direct electric heating method. After that, the high-temperature fluid flowed through the cooling heat exchanger in order to cool down and enter the liquid accumulator. Then, the closed carbon dioxide flow circulation was established.
Figure 2 shows the detailed arrangement of measurement points. The test section was a vertical mini upward tube. The length of the heated test section was 55 cm, and the inlet diameter and the thickness of the tube were 2 mm and 0.5 mm, respectively. The inlet and outlet of the test section were installed sheathed thermocouple and pressure transmitters (Manufacturer: Rosemount, Model: 3051 capacitance-type, Market Blvd Chanhassen, MN, USA) to obtain the fluid temperature and pressure drop. The wall temperatures were measured by thermocouples which were spot-welded onto the outer tube wall surface. A total of 10 sections were arranged at intervals of 5 cm to obtain the wall temperature distribution along the test heated length. Two measuring points at each section were used to obtain the accurate average wall temperature (such as #1 and #2). All the measured signals were transported into the IMP 3595 data acquisition system. The experimental data of the heated test section were measured under different pressure and mass flux values, which are shown in Table 1. The heat flux was gradually increased from 0 to 319 kW·m−2, keeping the increase of twenty under each pressure and mass flux value.
3. Results and Discussion
3.1. Classification of Flow Region
The heat transfer characteristics of supercritical fluids are significantly influenced by the thermal properties, which can lead to the formation of different heat transfer regimes. To illustrate the dramatic change in physical properties with temperature and pressure in the pseudocritical region, a thermal expansion factor (, Equation (1)) proposed by Kurganov [25,26] was used to represent the different regions.
Figure 3 shows the trends of the thermal expansion factor with the fluid temperature at different pressures. The thermal expansion factor rises slowly, then increases sharply to a maximum value, and then falls slowly. Therefore, according to its different variation patterns, the supercritical CO2 can be divided into three zones: liquid-like, pseudocritical, and gas-like region. When < 0.04 (T < 24 °C (297.15 K)), the thermal expansion factor rises slowly with the fluid temperature, and the pressure has almost no effect. This region can be treated as the liquid-like region. When 0.04 < < 0.245, the thermal expansion factor rises sharply to a maximum value, and the fluid properties change from liquid-like to gas-like, where the closer the critical pressure, the faster the growth rate. When entering the gas-like region ( ~ 0.245), the thermal expansion factor gradually decreases with fluid temperature and there is no effect with different pressure. Therefore, based on the trend of the thermal expansion factor, the supercritical CO2 flow region can be uniformly divided into three regions: liquid-like region: T < 24 °C, pseudocritical region: 24 °C < T < 68 °C, gas-like region: T > 68 °C (341.15 K).
3.2. Typical Heat Transfer Characteristics
Figure 4 shows the distribution characteristics of the wall temperature and heat transfer coefficient in the vertical upward flow under typical operating conditions. As can be seen, heat transfer coefficient presents an increasing and then decreasing trend, with a maximum value at the pseudocritical point. The wall temperature increases gradually with the enthalpy, remaining essentially constant under the pseudocritical region and continuing to rise as it moves into the gas-like region. Meanwhile, the pressure of P = 7.62 MPa and G = 1200 kg·m−2·s−1 corresponds to a pseudocritical temperature of 32.4 °C (305.55 K). When the bulk fluid temperature and wall temperature are 30.82 °C (303.97 K) and 34.89 °C (308.04 K), the corresponding heat transfer coefficient has a peak value of 19.35 kW·m−2·K−1. The analysis of the data shows that the heat transfer coefficient peaks when the wall and bulk fluid temperatures are distributed on either side of the pseudocritical temperature. An enhancement in the heat transfer coefficient exists before the pseudocritical point of the fluid. The heat transfer coefficient in the pseudocritical region is significantly greater than in the liquid-like and gas-like regions. The characteristics of this study are in line with the viewpoints of others [27]. The reason the peak phenomenon was caused was that the dramatic change in density near the pseudocritical region induced the buoyancy effect and flow acceleration effects [14,16,28].
3.3. Effect of Mass Flux on Heat Transfer and Pressure Drop
The variations in wall temperature and heat transfer coefficient for a pressure of 7.62 MPa and a mass flux ranging from 600 to 1600 kg·m−2·s−1 are presented in Figure 5. There is a slight increase in wall temperature as the mass flux increases. This is mainly due to the gradual increase of heat flux resulting in a slight change in wall temperature, which is inconsistent with the trend of decreasing wall temperature with increasing mass flux under constant heat flux [29]. The heat transfer coefficient increases as the mass flux increases. This is caused when the heat transfer coefficient is proportional to the Re and an increase in mass flux increases the turbulence of the fluid-enhancing heat transfer [10]. It can also be seen that the heat transfer peaks around the pseudocritical point for the different mass flux values. Figure 6 shows the trend of pressure drop and friction factor with fluid enthalpy under the different mass flux values. Under the low mass flux, the friction pressure drop tends to change slowly with enthalpy; as the mass flux increases, the rate of increase in the frictional pressure drop with enthalpy increases. The frictional pressure drop tends to increase overall with increasing mass flux, while the friction factor tends to decrease. The friction factor shows a decreasing and then increasing trend with enthalpy, with a depressed value near the pseudocritical point. This feature has similarities to the friction distribution characteristics of supercritical water [30], with the depression value created by the change in physical properties between the near wall and bulk flow near the pseudocritical region.
3.4. Effect of Inlet Pressure on Heat Transfer and Pressure Drop
Figure 7 shows the influence of inlet pressure on wall temperature and heat transfer under the mass flux of 1200 kg·m−2·s−1 and pressures ranging from 7.62 MPa to 8.44 MPa. The wall temperature changes are relatively weak under three different pressures, with the inlet pressure having essentially no effect on heat transfer at the liquid-like region and gas-like region, while the heat transfer coefficient decreases with increasing pressure under the pseudocritical region. As the pressure increases from 7.62 MPa to 8.44 MPa, the peak heat transfer coefficient decreases from 19.35 kW·m−2·K−1 to 12.88 kW·m−2·K−1, while the enthalpy of the fluid corresponding to the peak gradually shifts to the right and increases. Away from the pseudocritical temperature, the fluid is treated as the liquid-like and gas-like liquid, where the pressure has a weak effect on the fluid properties, resulting in little effect on heat transfer. In contrast, under the pseudocritical region, properties of fluid vary significantly with pressure, and the closer to the critical point, the more significant the fluid variation with pressure. The trends of the frictional pressure drop and friction factor with fluid enthalpy at different pressures are shown in Figure 8; the effect of pressure on the frictional pressure drop is weak and the curves basically overlap at the different pressures before the pseudocritical point. After the pseudocritical temperature, the higher the inlet pressure, the less frictional pressure drop and the smaller friction factor. This is mainly related to the variation in density at different pressures. In the liquid-like region (low temperature), the fluid is less compressible, and the pressure has a weaker effect on the density, which leads to a weaker effect of pressure on the frictional pressure drop. In contrast, under the pseudocritical region and gas-like region (high temperature), the compressibility of the fluid increases. The higher pressures lead to higher densities, which leads to a decrease in the frictional pressure drop with increasing pressure. This trend is consistent with the experimental results of Wang [30].
3.5. Heat Transfer Characteristics along the Heating Length
The wall temperature and heat transfer coefficient along the heating length are depicted in Figure 9. The experimental condition contains P = 7.62 MPa, G = 1200 kg·m−2·s−1, and heat flux from 49.3 kW·m−2 to 152.3 kW·m−2. The wall temperature increases with the heat flux, and its temperature rise rate gradually accelerates with the increase in the heating length. The bulk fluid temperature increases gradually with the increase of the heat flux, and at the convergence to the pseudocritical temperature, the rate of increase slows down and does not increase with the increase of the heat flux. The heat transfer coefficient tends to increase along the heating length when the heat flux increases from 49.3 kW·m−2 to 81.6 kW·m−2. While the heat flux continues to increase from 81.6 kW·m−2 to 152.3 kW·m−2, the heat transfer tends to increase and then decrease along the length of the tube. The maximum heat transfer coefficient peak gradually moves away from the outlet and towards the middle. By comparing the correspondence between the wall temperature and the heat transfer coefficient, it can be found that when the wall temperature is higher than the pseudocritical temperature and the fluid temperature is lower than the pseudocritical temperature, the heat transfer coefficient along the tube length decreases with the increase of the heat flux. When the wall and fluid temperature are lower than the pseudocritical temperature, the heat transfer coefficient along the tube length increases with the increase of the heat flux.
3.6. Buoyancy Forces and Flow Acceleration Effects of Supercritical Fluids
From the previous analysis, the sharp variation in physical properties under the pseudocritical region is responsible for the heat transfer peculiarities of supercritical fluids. The radial density variation creates a local buoyancy effect, while the axial density variation leads to a local velocity inconsistency which produces the flow acceleration effects. Both effects will change the tangential stress distribution near the wall, thus affecting the heat transfer characteristics of the supercritical fluid. Jackson indicates that the dimensionless number can be used to quantitatively characterize the effect of buoyancy forces on heat transfer, and proposes a benchmark for determining that the buoyancy effect is negligible when . McEligot presents , which can be treated as a dimensionless number for flow acceleration effects, where represents a dimensionless heat flux. The criteria for the flow acceleration effect are that when , the flow thermal acceleration effect on heat transfer is negligible [9]. Here, we use the criterion equation of Jackson’s buoyancy and McEligot’s acceleration to analyze the heat transfer in the mini vertical upward tube in this experiment. Figure 8 shows the dimensionless parameter variations of buoyancy and flow acceleration effects under different system parameters.
Figure 10a,b show the variation of the buoyancy forces and thermal acceleration with enthalpy for a pressure of 7.62 MPa and a mass flux of 600–1600 kg·m−2·s−1. It can be seen that the value of the buoyancy forces effect Bo* increases and then decreases with enthalpy for the different mass flux values, but the maximum value is less than the negligible threshold value of 5.6 × 10⁻⁷, so the buoyancy force effect is negligible at this parameter. The flow thermal acceleration effect decreases as the mass flux decreases, but to a lesser extent. The flow thermal acceleration effect is smaller than the negligible threshold () in the low region and is much larger than the negligible threshold in the high-enthalpy region. The effect of thermal acceleration on heat transfer is therefore not negligible under different mass flux values. Figure 10c,d show the trends of the buoyancy force and thermal acceleration with fluid enthalpy for different pressures at a mass flux of 1200 kg·m−2·s−1. The dimensionless number Bo* for buoyancy effects at all three pressures is small and does not exceed the limit value of 5.6 × 10⁻⁷. The thermal acceleration effect values partially exceed the negligible threshold value of 0.0005 at all three pressures. As the pressure increases from 7.62 MPa to 8.44 MPa, the thermal acceleration does not change with increasing pressure under the low-enthalpy region and decreases with increasing pressure under the high-enthalpy region. Therefore, the buoyancy force effect is negligible, and the thermal acceleration effect is not negligible at the pressure of 7.62 MPa to 8.44 MPa. A similar conclusion was obtained under the different heat flux value (shown in Figure 10e,f). The above analysis shows that under the test conditions of mass flux of 600–1600 kg·m−2·s−1, pressure of 7.62–8.44 MPa, and heat flux 49.3–152.3 kW·m−2, the effect of buoyancy force on heat transfer can be neglected in the vertical upward flow of the mini channel in this test condition, while the thermal acceleration effect is not negligible.
3.7. A New Correlation of Heat Transfer and Friction Factor
Heat transfer correlations of supercritical fluids are important for designing the nuclear power plant. Many correlations for heat transfer prediction have been proposed in the published literature [31,32,33]. Most of them were revamped from single-phase correlation via thermophysical modification and dimensionless number modification [34]. The measured heat transfer data were analyzed with the buoyancy and flow acceleration dimensionless number as before. Taking similar considerations as Jackson [14], the Nusselt number could be conducted as a function of dimensionless parameters (, , ). The correlation of Jackson is presented as Equation (2):
where is represented as the averaged Prandtl number, , .
In this study, the flow acceleration effects play a vital role in heat transfer in the mini vertical upward tube. Therefore, the correlation should introduce the dimensionless number () to present the flow acceleration effect. Based on vertical upward experimental data, the modified Jackson correlation was fitted by taking into account the flow thermal acceleration effects. Thus, in the present research, a new heat-transfer-predicting correlation for the mini vertical upward flow at supercritical carbon dioxide is presented as follows:
Figure 11 compares the predicted Nusselt number of Equations (3) and (4) with the experimental value. The scope of application of the new Equations (3) and (4) is the vertical mini tube with 2 mm, pressure range of 7.42~8.44 MPa, and mass fluxes of 600~1600 kg·m−2·s−1. It is observed that the maximum error is less than ±20%. By error analysis, the averaged error (AE), mean absolute error (MAE), and root mean square error (RMSE) of the equation for predicting Nu numbers and experimental data were 1.135%, 6.249%, and 7.78%, respectively. In total, 73.9% of the predicted data deviated from the test values within ±10% and all data were within the ±20% error band.
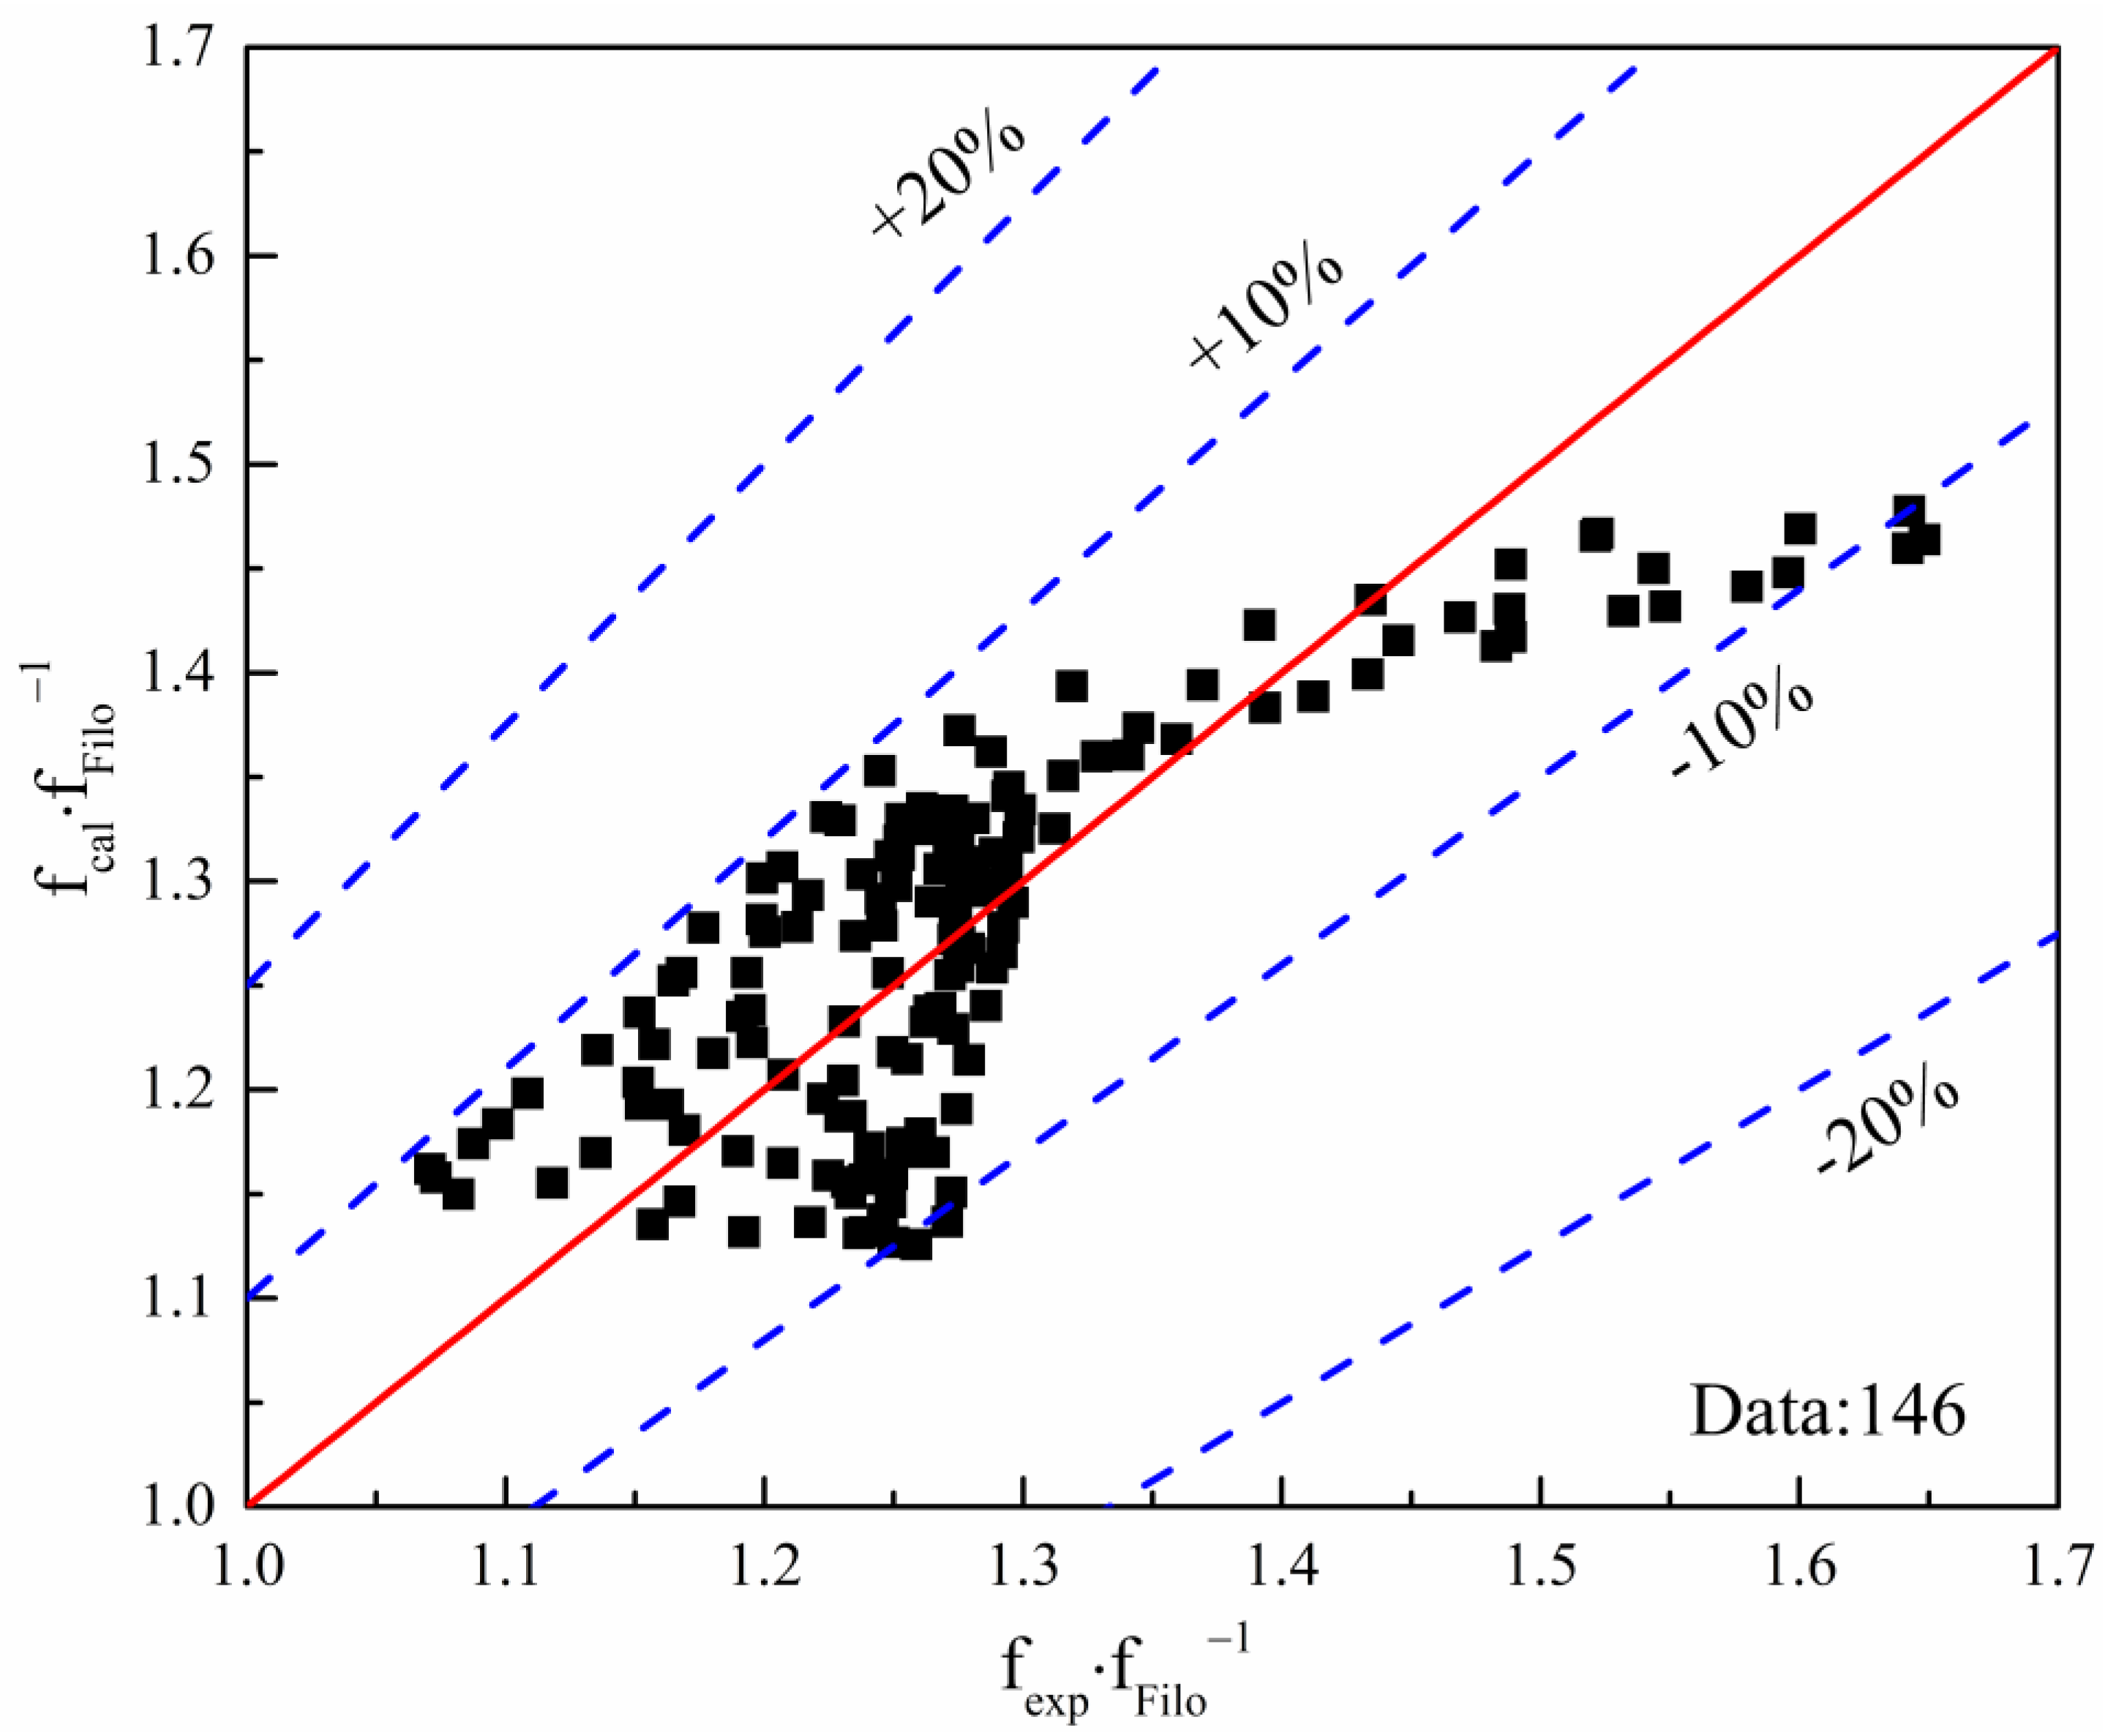
The friction distribution of supercritical fluids differs from that of single-phase fluids due to changes in local flow characteristics caused by changes in physical properties. Therefore, considering the dramatic thermal property, a new correlation is proposed using the analysis of 146 experimental data to predict the friction factor at supercritical fluids in the mini vertical upward tube:
where is calculated using the Filonenko correlation. The viscosity and density correlations of bulk and wall flow were introduced in Equations (5) and (6). Figure 12 presents the comparison of experimental and predicted friction factors using Equation (3). The mean error (ME), mean absolute error (MAE), and root mean square error (RMSE) of the equation for predicting the friction factor and experimental data were 0.09%, 4.529%, and 5.34%, respectively. Approximately 96.57% of the predicted data deviated from the test values within an error band of ±10% and all predictions fell within the ±20% error band. The density and viscosity modification was useful to improve the accuracy.
4. Conclusions
The experiments on the heat transfer and pressure drop were performed with supercritical carbon dioxide in a mini vertical upward flow. Based on the analysis of the experimental data, the following conclusions were obtained:
- (1)
- There is an effect of pressure, mass flux, and heat flux on the heat transfer and pressure drop of supercritical carbon dioxide for vertical upward flow. There is a peak of heat transfer coefficient when the wall and bulk fluid temperatures are distributed on either side of the pseudocritical temperature.
- (2)
- Based on the criteria of Jackson’s buoyancy and McEligot’s acceleration, the influence of buoyancy force on heat transfer can be neglected, while the flow thermal acceleration effect should be taken into account for the mini vertical upward flow of supercritical carbon dioxide.
- (3)
- By considering the effect of flow acceleration, the dimensionless parameter () was introduced into the modified Jackson’s correlation for mini supercritical carbon dioxide. The predictive accuracy of the new heat transfer correlation is about 73.9% of experimental data within a ±10% error band.
- (4)
- Based on the correlation of Filonenko, the new semi-empirical correlation of the friction factor was proposed by taking account of the variation in density and viscosity. The fitted correlation shows good enough accuracy for predicting the friction factor for supercritical carbon dioxide.
Author Contributions
Conceptualization, H.L.; Funding acquisition, F.N.; Investigation, H.W.; Methodology, Q.B.; Writing—Original draft, H.L.; Writing—Review and editing, H.L. All authors have read and agreed to the published version of the manuscript.
Funding
This research is supported by the National Natural Science Foundation of China (Grant No. 12027813, 11605057).
Institutional Review Board Statement
Not applicable.
Informed Consent Statement
Not applicable.
Data Availability Statement
Not applicable.
Conflicts of Interest
The authors declare no conflict of interest.
Nomenclature
| Re | Reynolds number, |
| Specific heat, kJ·kg−1·K−1 | |
| Average specific heat, kJ·kg−1·K−1, | |
| d | Diameter, m |
| G | Mass flux, kg·m−2·s−1 |
| H | Enthalpy, J·kg−1 |
| h | Heat transfer coefficient, kW·m−2·K−1 |
| P | Pressure, MPa |
| Pcrit | Critical Pressure, MPa |
| qn | Inner wall heat flux, kW·m−2 |
| dimensionless heat flux | |
| T | Temperature, K |
| x | The length of location, m |
| Bo* | Buoyancy effect numbers |
| Gr | Grashof numbers |
| Pr | Prandtl number, |
| Averaged Prandtl numbers, | |
| Nu | Nusselt number, |
| Greek symbols | |
| Thermal expansion coefficient (K−1) | |
| Density, kg·m−3 | |
| Thermal conductivity, W·m−1 K−1 | |
| Dynamic viscosity (Pa·s) | |
| Subscripts | |
| b | Bulk |
| i, o | inner, outer |
| pc | Pseudocritical |
| w, wi | Wall, Inner wall |
| exp | Experimental |
| cal | Calculated based on the correlation. |
| AE | Average Error, |
| MAE | Mean Average Error, |
| RMSE | Root Mean Square Error, |
| Filo | Filonenko |
References
- Crespi, F.; Gavagnin, G.; Sánchez, D.; Martínez, G.S. Supercritical carbon dioxide cycles for power generation: A review. Appl. Energy 2017, 195, 152–183. [Google Scholar] [CrossRef]
- Aakre, S.R.; Anderson, M.H. Pressure drop and heat transfer characteristics of nitrate salt and supercritical CO2 in a diffusion-bonded heat exchanger. Int. J. Heat Mass Transf. 2022, 189, 122691. [Google Scholar] [CrossRef]
- Dostal, V.; Hejzlar, P.; Driscoll, M.J. High-Performance Supercritical Carbon Dioxide Cycle for Next-Generation Nuclear Reactors. Nucl. Technol. 2006, 154, 265–282. [Google Scholar] [CrossRef]
- Wang, Q.; Liu, C.; Luo, R.; Li, D.; Macián-Juan, R. Thermodynamic analysis and optimization of the combined supercritical carbon dioxide Brayton cycle and organic Rankine cycle-based nuclear hydrogen production system. Int. J. Energy Res. 2022, 46, 832–859. [Google Scholar] [CrossRef]
- Vitali, M.; Corvaro, F.; Marchetti, B.; Terenzi, A. Thermodynamic challenges for CO2 pipelines design: A critical review on the effects of impurities, water content, and low temperature. Int. J. Greenh. Gas Control 2022, 114, 103605. [Google Scholar] [CrossRef]
- Samara, H.; Al-Eryani, M.; Jaeger, P. The role of supercritical carbon dioxide in modifying the phase and interfacial properties of multiphase systems relevant to combined EOR-CCS. Fuel 2022, 323, 124271. [Google Scholar] [CrossRef]
- Bieniek, A.; Kuchmacz, J.; Sztekler, K.; Mika, L.; Radomska, E. A New Method of Regulating the Cooling Capacity of a Cooling System with CO2. Energies 2021, 14, 1922. [Google Scholar] [CrossRef]
- Xu, T.; Zhao, H.; Wang, M.; Qi, J. Numerical Study of Thermal-Hydraulic Performance of a New Spiral Z-Type PCHE for Supercritical CO2 Brayton Cycle. Energies 2021, 14, 4417. [Google Scholar] [CrossRef]
- Ji, Y.; Wang, Z.; Wang, M.; Liu, Y.; Xu, H.; Zhu, P.; Ma, S.; Yang, Z.; Xiao, G. Experimental and Numerical Study on Thermal Hydraulic Performance of Trapezoidal Printed Circuit Heat Exchanger for Supercritical CO2 Brayton Cycle. Energies 2022, 15, 4940. [Google Scholar] [CrossRef]
- Kim, D.E.; Kim, M.H. Experimental study of the effects of flow acceleration and buoyancy on heat transfer in a supercritical fluid flow in a circular tube. Nucl. Eng. Des. 2010, 240, 3336–3349. [Google Scholar] [CrossRef]
- Liu, S.; Huang, Y.; Liu, G.; Wang, J.; Leung, L.K. Improvement of buoyancy and acceleration parameters for forced and mixed convective heat transfer to supercritical fluids flowing in vertical tubes. Int. J. Heat Mass Transf. 2017, 106, 1144–1156. [Google Scholar] [CrossRef]
- Jajja, S.A.; Sequeira, J.M.; Fronk, B.M. Geometry and orientation effects in non-uniformly heated microchannel heat exchangers using supercritical carbon dioxide. Exp. Therm. Fluid Sci. 2020, 112, 109979. [Google Scholar] [CrossRef]
- McEligot, D.M.; Jackson, J.D. “Deterioration” criteria for convective heat transfer in gas flow through non-circular ducts. Nucl. Eng. Des. 2004, 232, 327–333. [Google Scholar] [CrossRef]
- Jackson, J. Models of heat transfer to fluids at supercritical pressure with influences of buoyancy and acceleration. Appl. Therm. Eng. 2017, 124, 1481–1491. [Google Scholar] [CrossRef]
- Cai, C.; Wang, X.; Mao, S.; Kang, Y.; Lu, Y.; Han, X.; Liu, W. Heat Transfer Characteristics and Prediction Model of Supercritical Carbon Dioxide (SC-CO2) in a Vertical Tube. Energies 2017, 10, 1870. [Google Scholar] [CrossRef] [Green Version]
- Huang, D.; Li, W. A brief review on the buoyancy criteria for supercritical fluids. Appl. Therm. Eng. 2018, 131, 977–987. [Google Scholar] [CrossRef]
- Lv, H.; Bi, Q.; Chen, G.; Zhang, Y.; Deng, L. Experimental study on heat transfer in vertical cooling tube cooled by downward flow in the passive heat removal system of SCWR. Appl. Therm. Eng. 2020, 179, 115680. [Google Scholar] [CrossRef]
- Lv, H.; Bi, Q.; Dong, X.; Zhang, Z.; Zhu, G. Investigation on heat transfer of in-tube supercritical water cooling accompanying out-tube pool boiling. Int. J. Heat Mass Transf. 2019, 136, 938–949. [Google Scholar] [CrossRef]
- Bruch, A.; Bontemps, A.; Colasson, S. Experimental investigation of heat transfer of supercritical carbon dioxide flowing in a cooled vertical tube. Int. J. Heat Mass Transf. 2009, 52, 2589–2598. [Google Scholar] [CrossRef]
- Lei, Y.; Xu, B.; Chen, Z. Experimental investigation on cooling heat transfer and buoyancy effect of supercritical carbon dioxide in horizontal and vertical micro-channels. Int. J. Heat Mass Transf. 2021, 181, 121792. [Google Scholar] [CrossRef]
- Zhang, H.; Xu, J.; Wang, Q.; Zhu, X. Multiple wall temperature peaks during forced convective heat transfer of supercritical carbon dioxide in tubes. Int. J. Heat Mass Transf. 2021, 172, 121171. [Google Scholar] [CrossRef]
- Park, J.H.; Kim, M.H. Modeling of local heat transfer on supercritical pressure CO2 in horizontal semicircular tube. Int. J. Heat Mass Transf. 2022, 184, 122197. [Google Scholar] [CrossRef]
- Chai, L.; Tsamos, K.M.; Tassou, S.A. Modelling and Evaluation of the Thermohydraulic Performance of Finned-Tube Supercritical Carbon Dioxide Gas Coolers. Energies 2020, 13, 1031. [Google Scholar] [CrossRef] [Green Version]
- Liao, S.M.; Zhao, T.S. An experimental investigation of convection heat transfer to supercritical carbon dioxide in miniature tubes. Int. J. Heat Mass Transf. 2002, 45, 5025–5034. [Google Scholar] [CrossRef]
- Kurganov, V.A.; Zeigarnik, Y.A.; Maslakova, I.V. Heat transfer and hydraulic resistance of supercritical pressure coolants. Part III: Generalized description of SCP fluids normal heat transfer, empirical calculating correlations, integral method of theoretical calculations. Int. J. Heat Mass Transf. 2013, 67, 535–547. [Google Scholar] [CrossRef]
- Kurganov, V.A.; Zeigarnik, Y.A.; Maslakova, I.V. Heat transfer and hydraulic resistance of supercritical pressure coolants. Part IV: Problems of generalized heat transfer description, methods of predicting deteriorated heat transfer; empirical correlations; deteriorated heat transfer enhancement; dissolved gas effects. Int. J. Heat Mass Transf. 2014, 77, 1197–1212. [Google Scholar] [CrossRef]
- Guo, P.; Liu, S.; Yan, J.; Wang, J.; Zhang, Q. Experimental study on heat transfer of supercritical CO2 flowing in a mini tube under heating conditions. Int. J. Heat Mass Transf. 2020, 153, 119623. [Google Scholar] [CrossRef]
- Li, Z.-H.; Jiang, P.-X.; Zhao, C.-R.; Zhang, Y. Experimental investigation of convection heat transfer of CO2 at supercritical pressures in a vertical circular tube. Exp. Therm. Fluid Sci. 2010, 34, 1162–1171. [Google Scholar] [CrossRef]
- Lei, X.; Zhang, J.; Gou, L.; Zhang, Q.; Li, H. Experimental study on convection heat transfer of supercritical CO2 in small upward channels. Energy 2019, 176, 119–130. [Google Scholar] [CrossRef]
- Wang, H.; Bi, Q.; Wu, G.; Yang, Z. Experimental investigation on pressure drop of supercritical water in an annular channel. J. Supercrit. Fluids 2018, 131, 47–57. [Google Scholar] [CrossRef]
- Wang, Z.; Xiao, G.; Liu, Y.; Ji, Y.; Xu, H. Reference temperature correction and dimensionless number analysis for heat transfer of supercritical CO2 in horizontal tubes. Int. J. Heat Mass Transf. 2022, 194, 122973. [Google Scholar] [CrossRef]
- Li, H.; Kruizenga, A.; Anderson, M.; Corradini, M.; Luo, Y.; Wang, H.; Li, H. Development of a new forced convection heat transfer correlation for CO2 in both heating and cooling modes at supercritical pressures. Int. J. Therm. Sci. 2011, 50, 2430–2442. [Google Scholar] [CrossRef]
- Fang, X.; Xu, Y. Modified heat transfer equation for in-tube supercritical CO2 cooling. Appl. Therm. Eng. 2011, 31, 3036–3042. [Google Scholar] [CrossRef]
- Bae, Y.-Y.; Kim, H.-Y. Convective heat transfer to CO2 at a supercritical pressure flowing vertically upward in tubes and an annular channel. Exp. Therm. Fluid Sci. 2009, 33, 329–339. [Google Scholar] [CrossRef]
Figure 1.
Schematic diagram of the experimental loop.
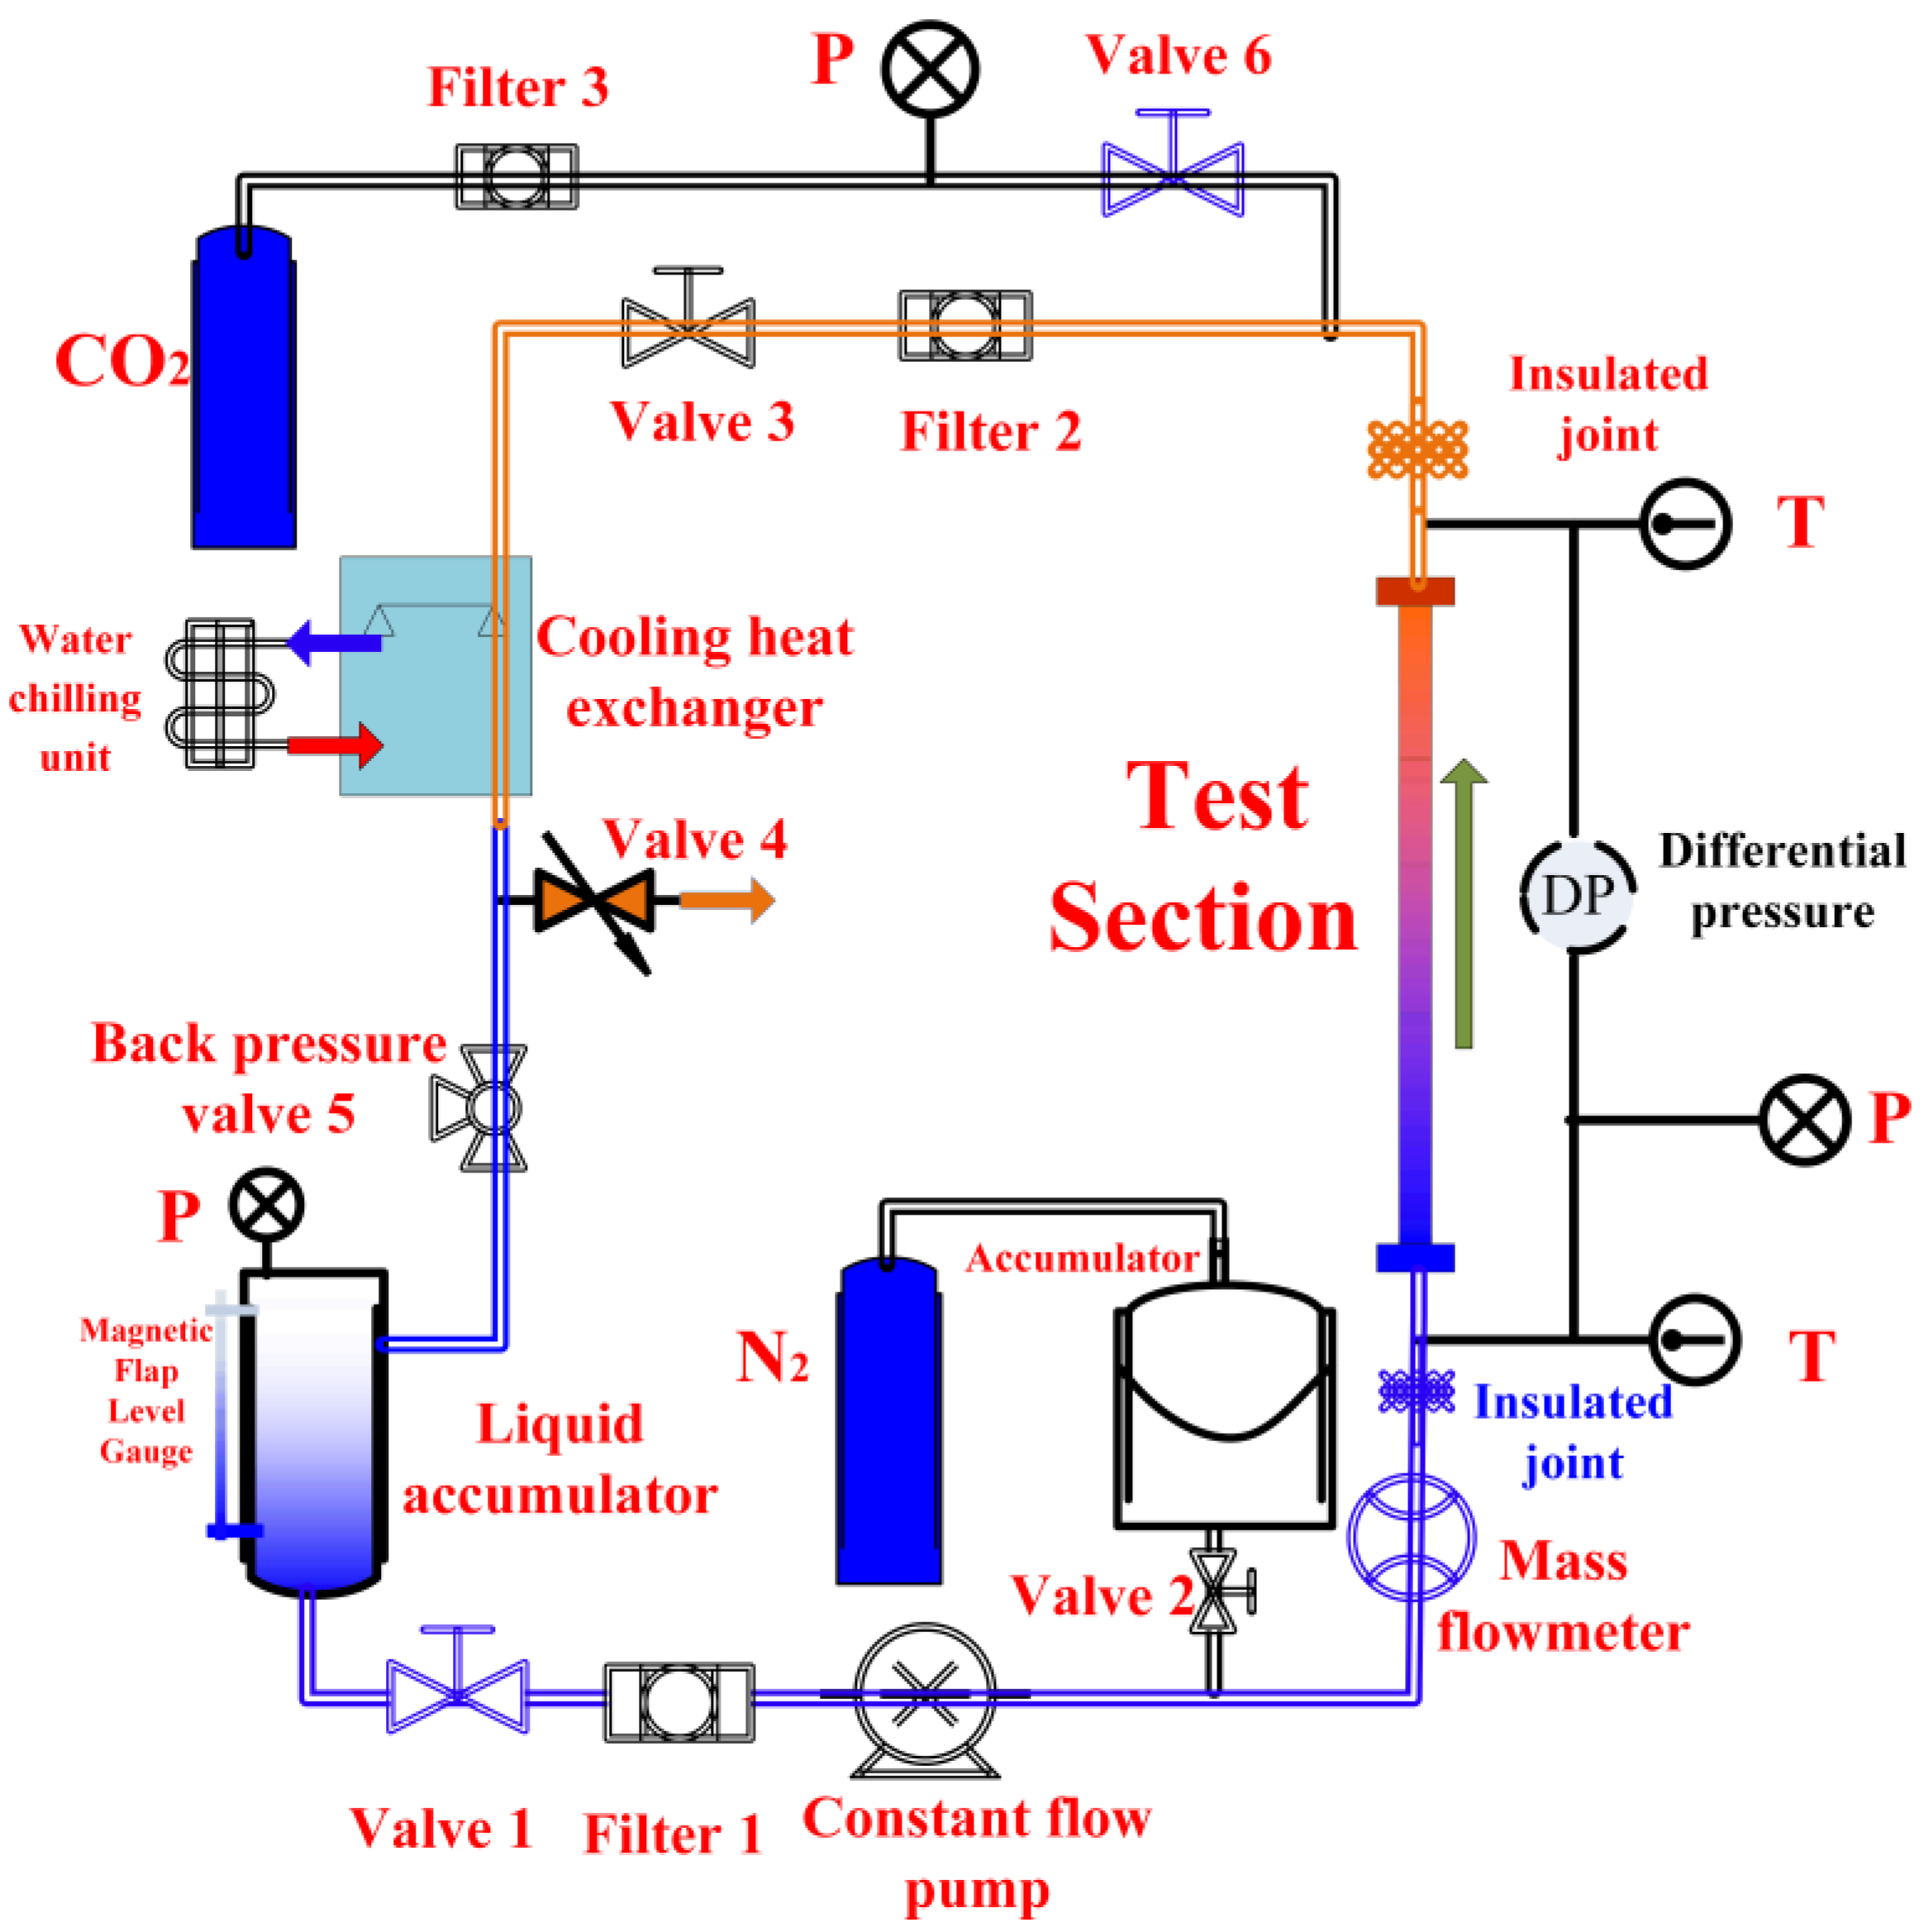
Figure 2.
Test section and distribution of measurement points.
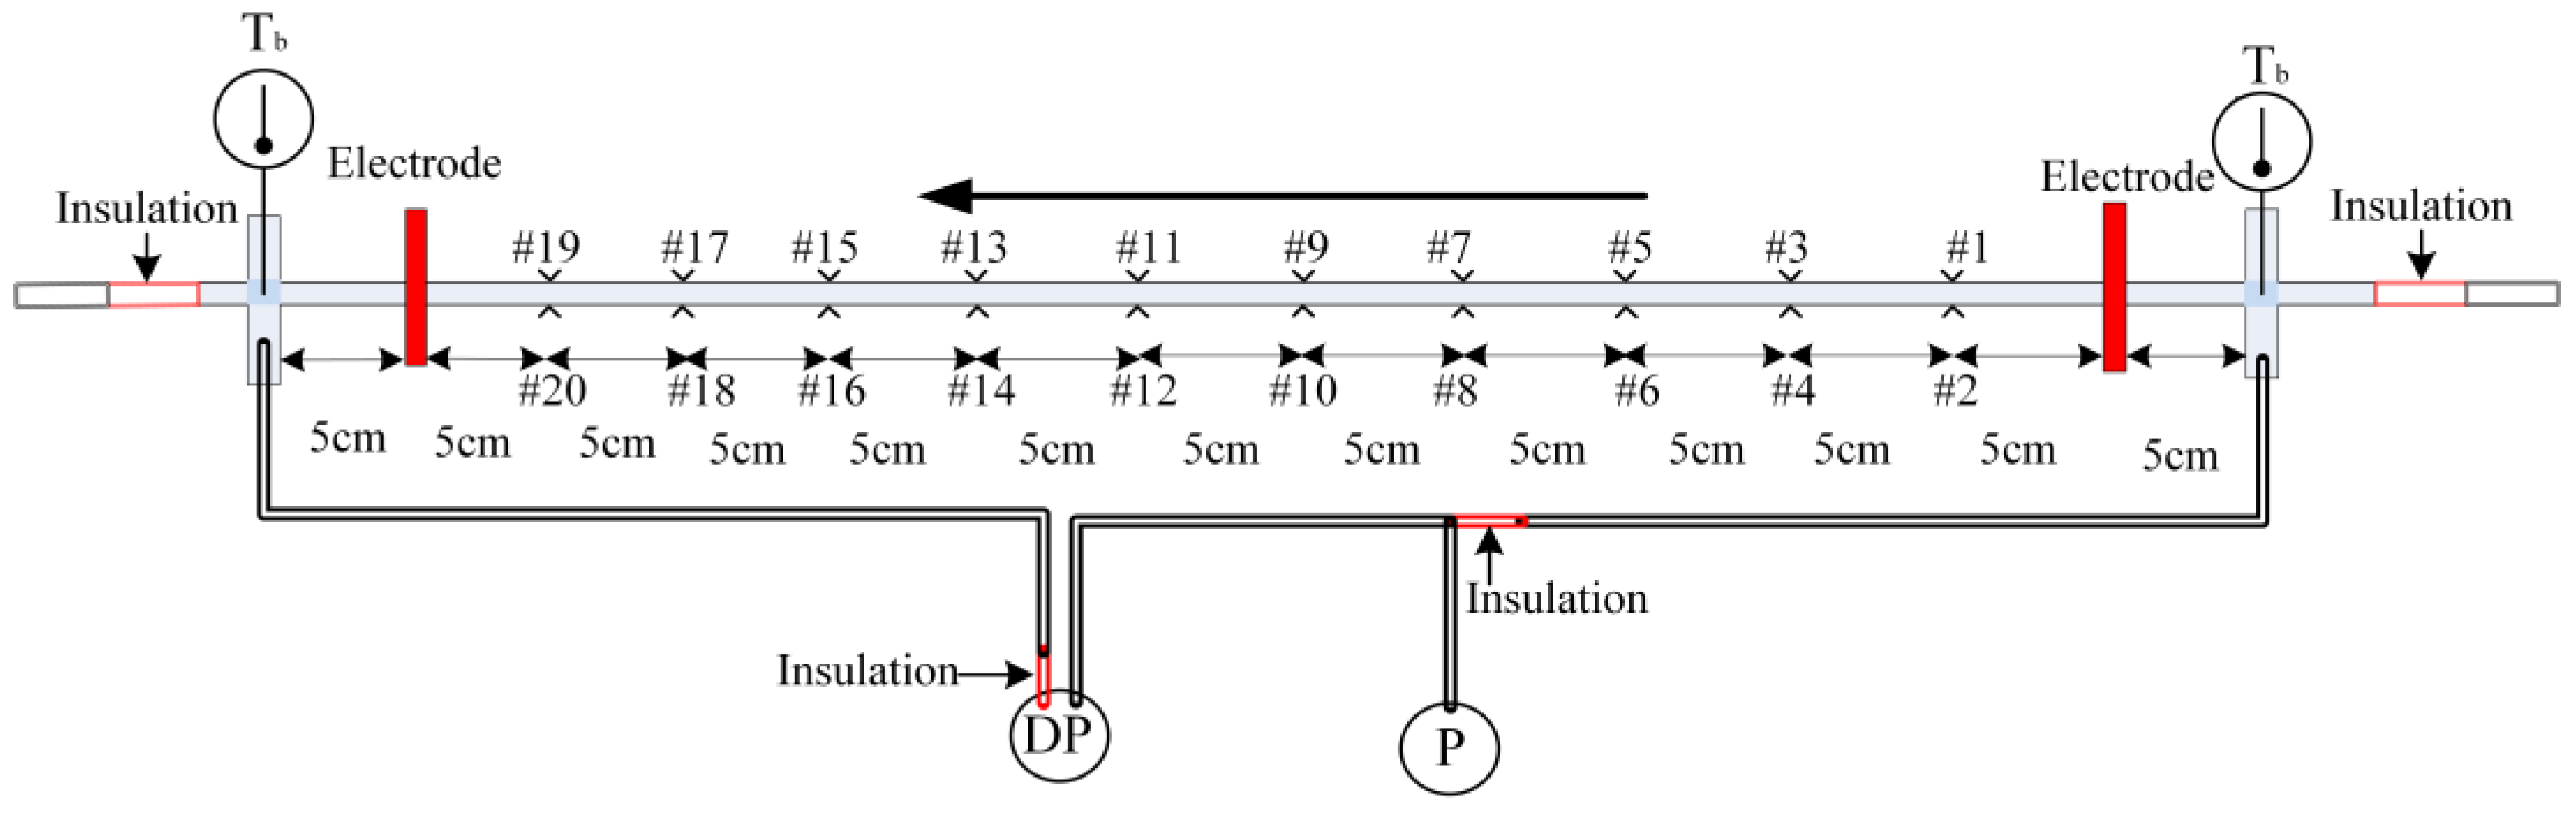
Figure 3.
The region classification based on thermal expansion factors.

Figure 4.
Basic characteristics of heat transfer in a vertical upward flow.
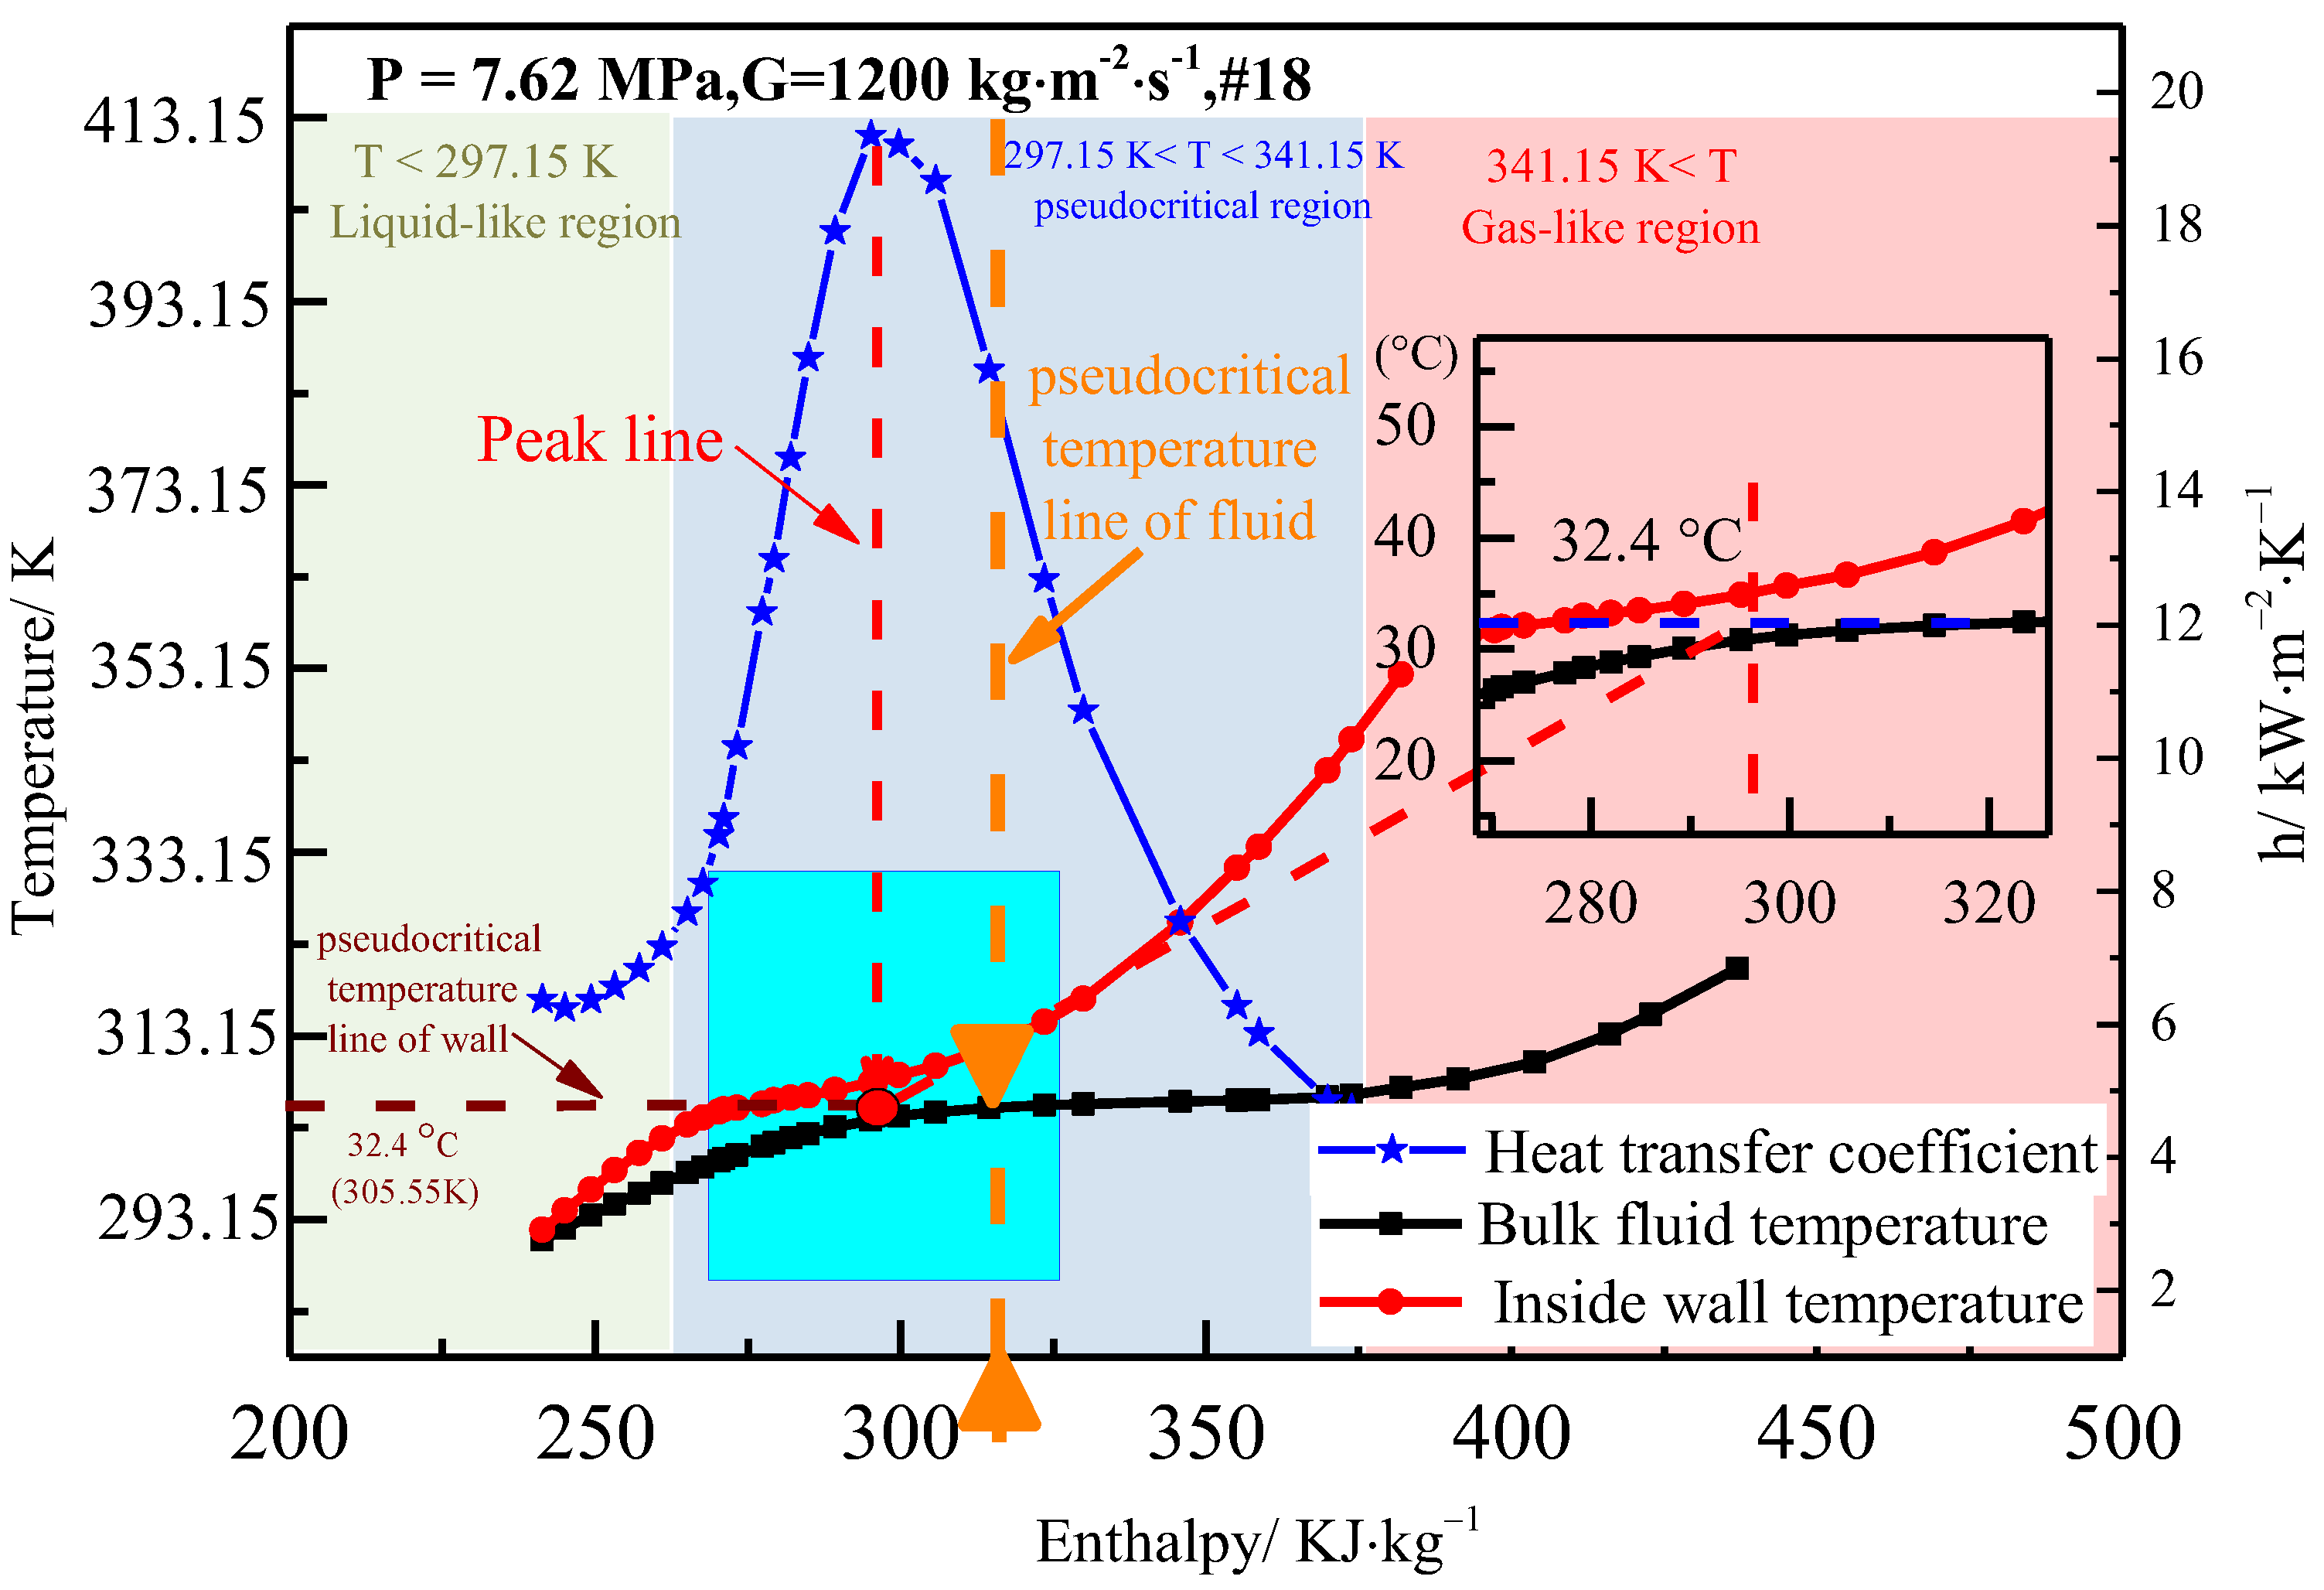
Figure 5.
Effect of mass flux on wall temperature (a) and heat transfer coefficient (b).
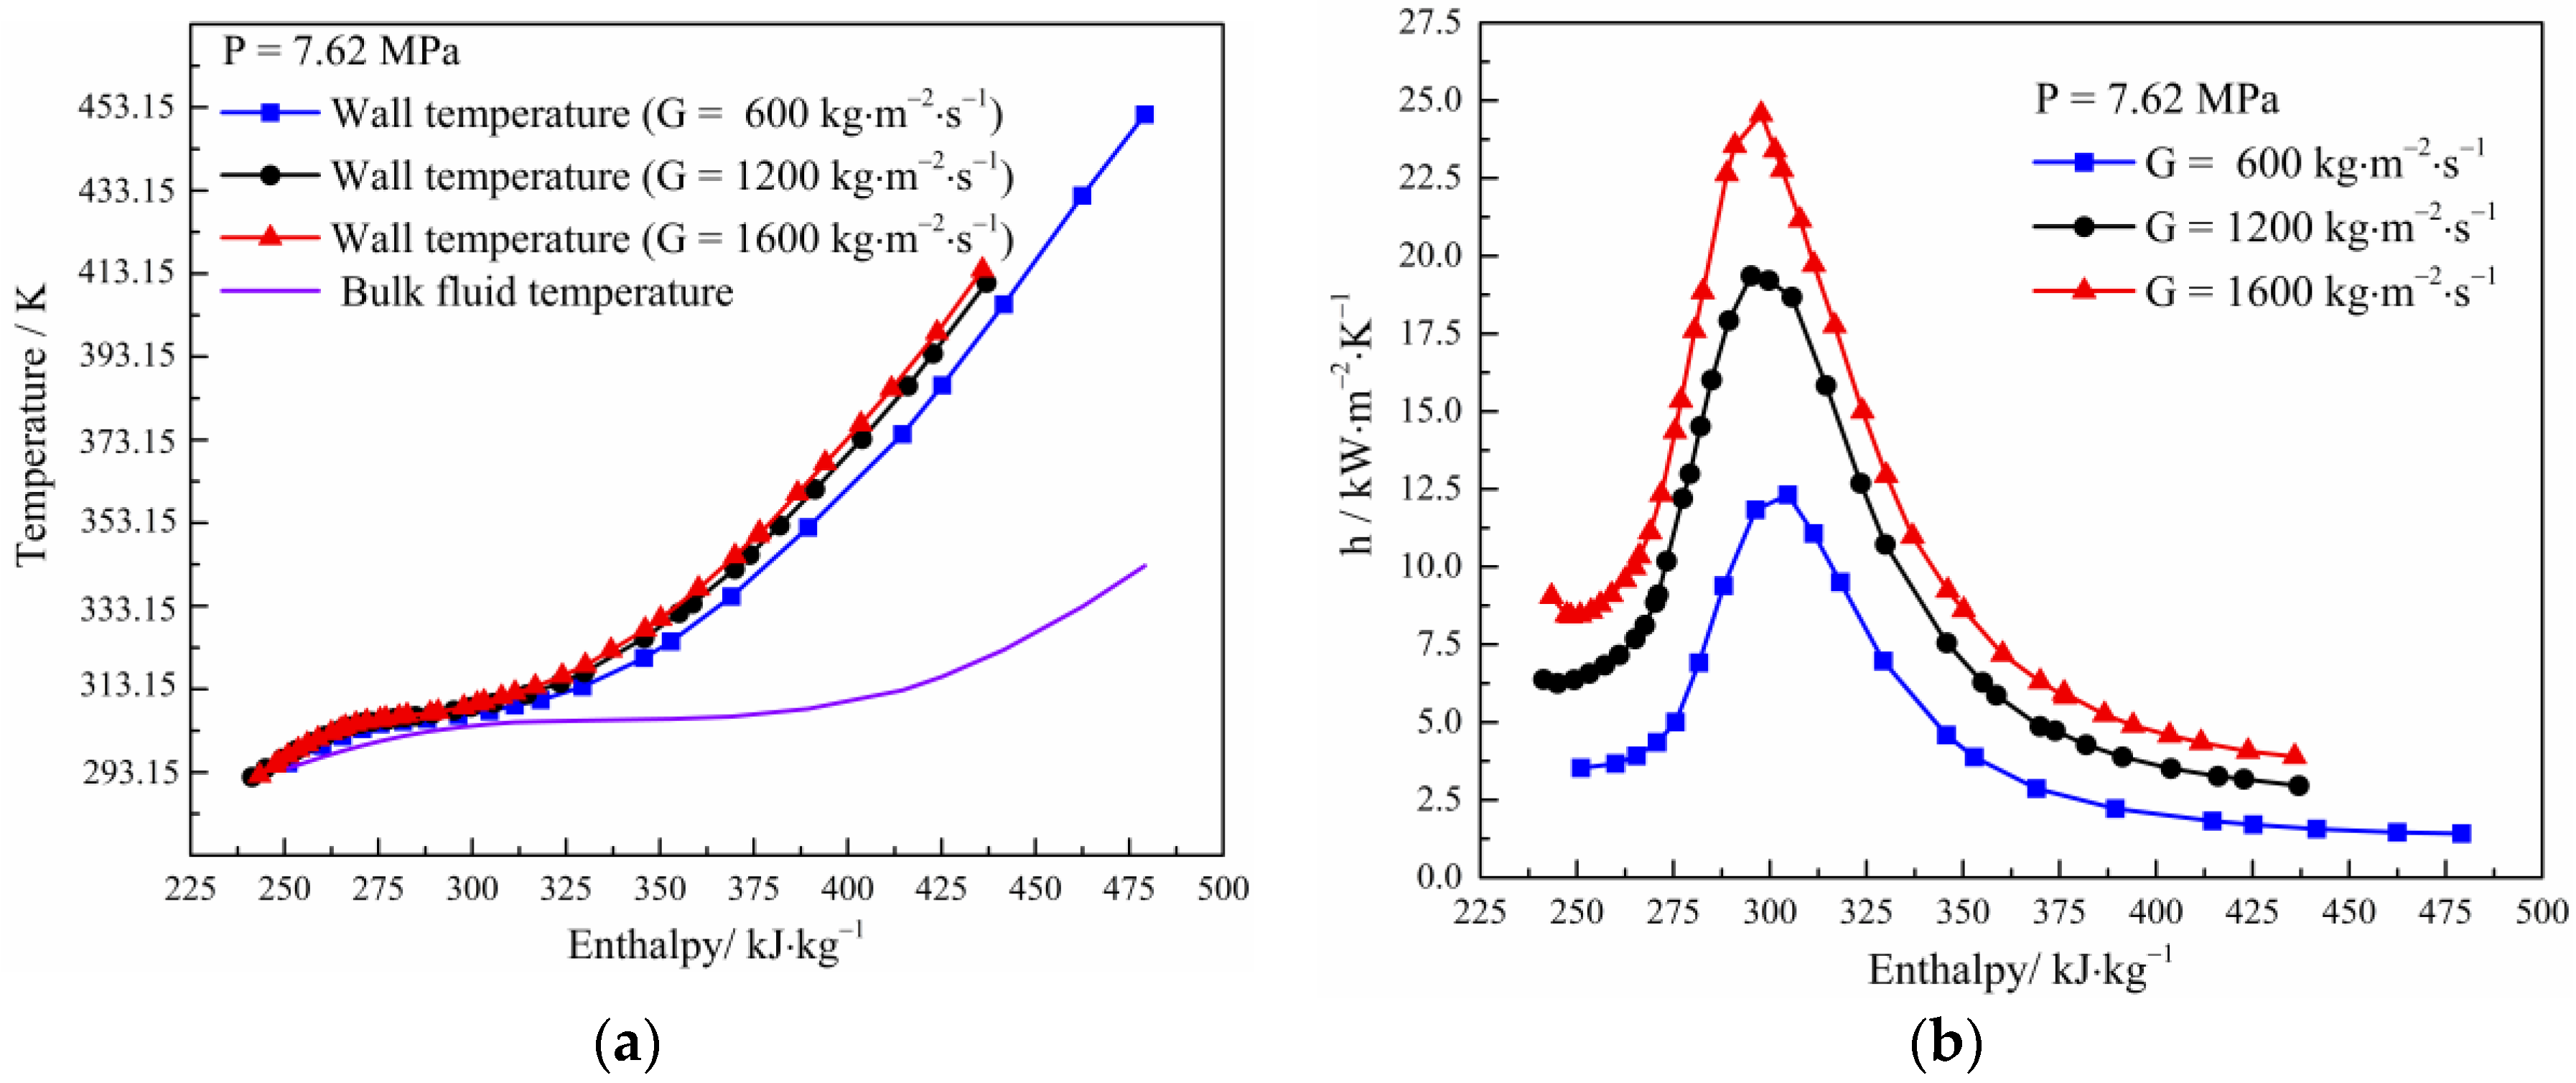
Figure 6.
Effect of mass flux on friction pressure drop (a) and friction factor (b).
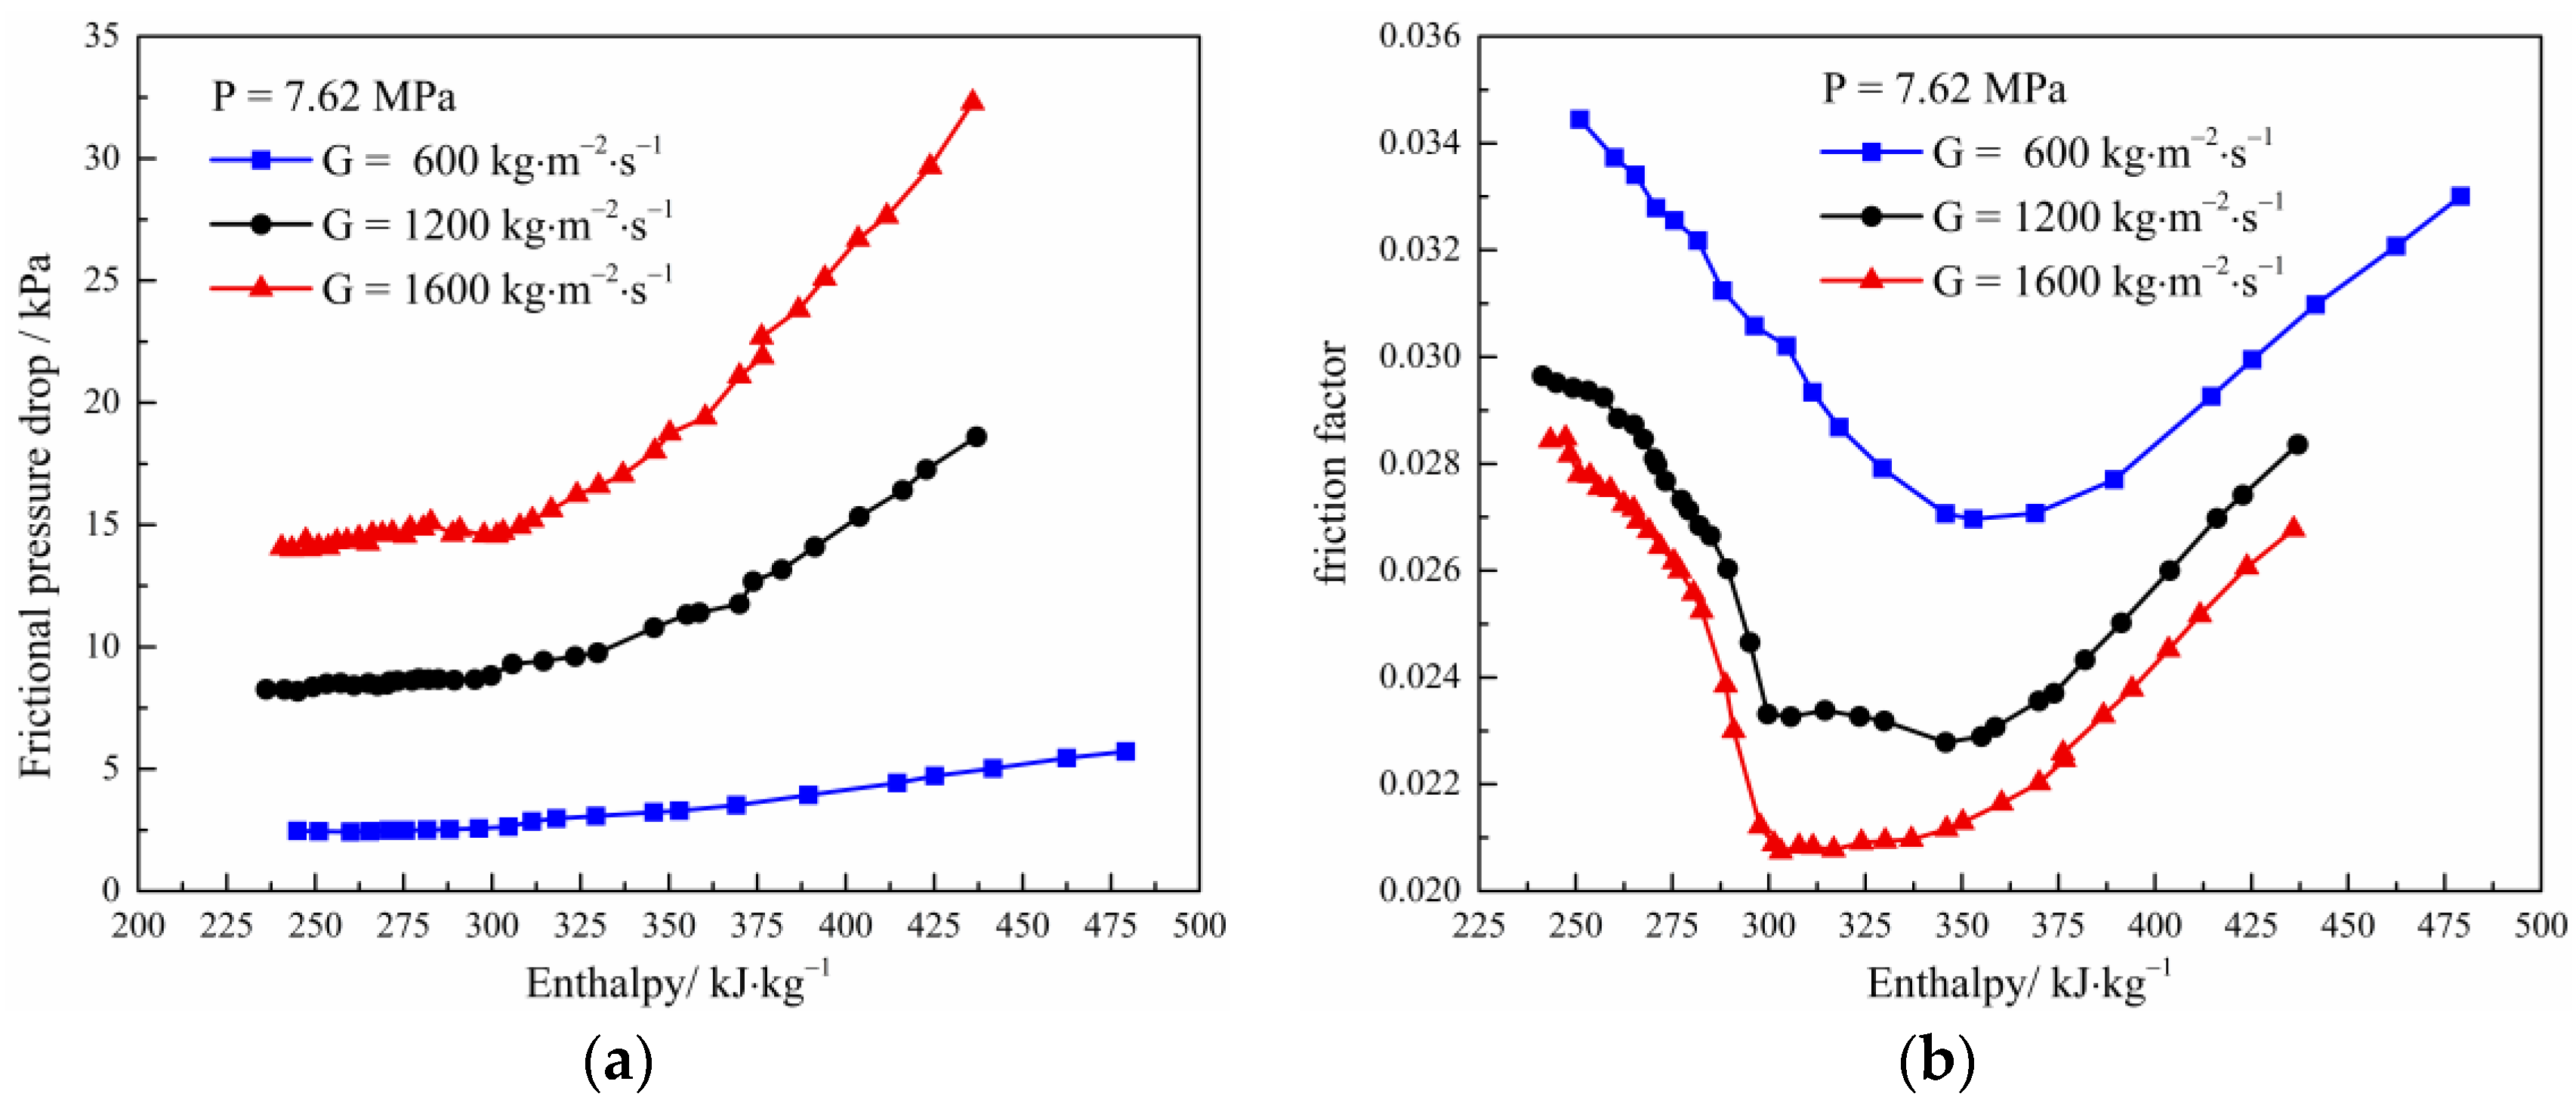
Figure 7.
Variation of wall temperature (a) and heat transfer coefficient (b) with enthalpy under different pressures.
Figure 7.
Variation of wall temperature (a) and heat transfer coefficient (b) with enthalpy under different pressures.
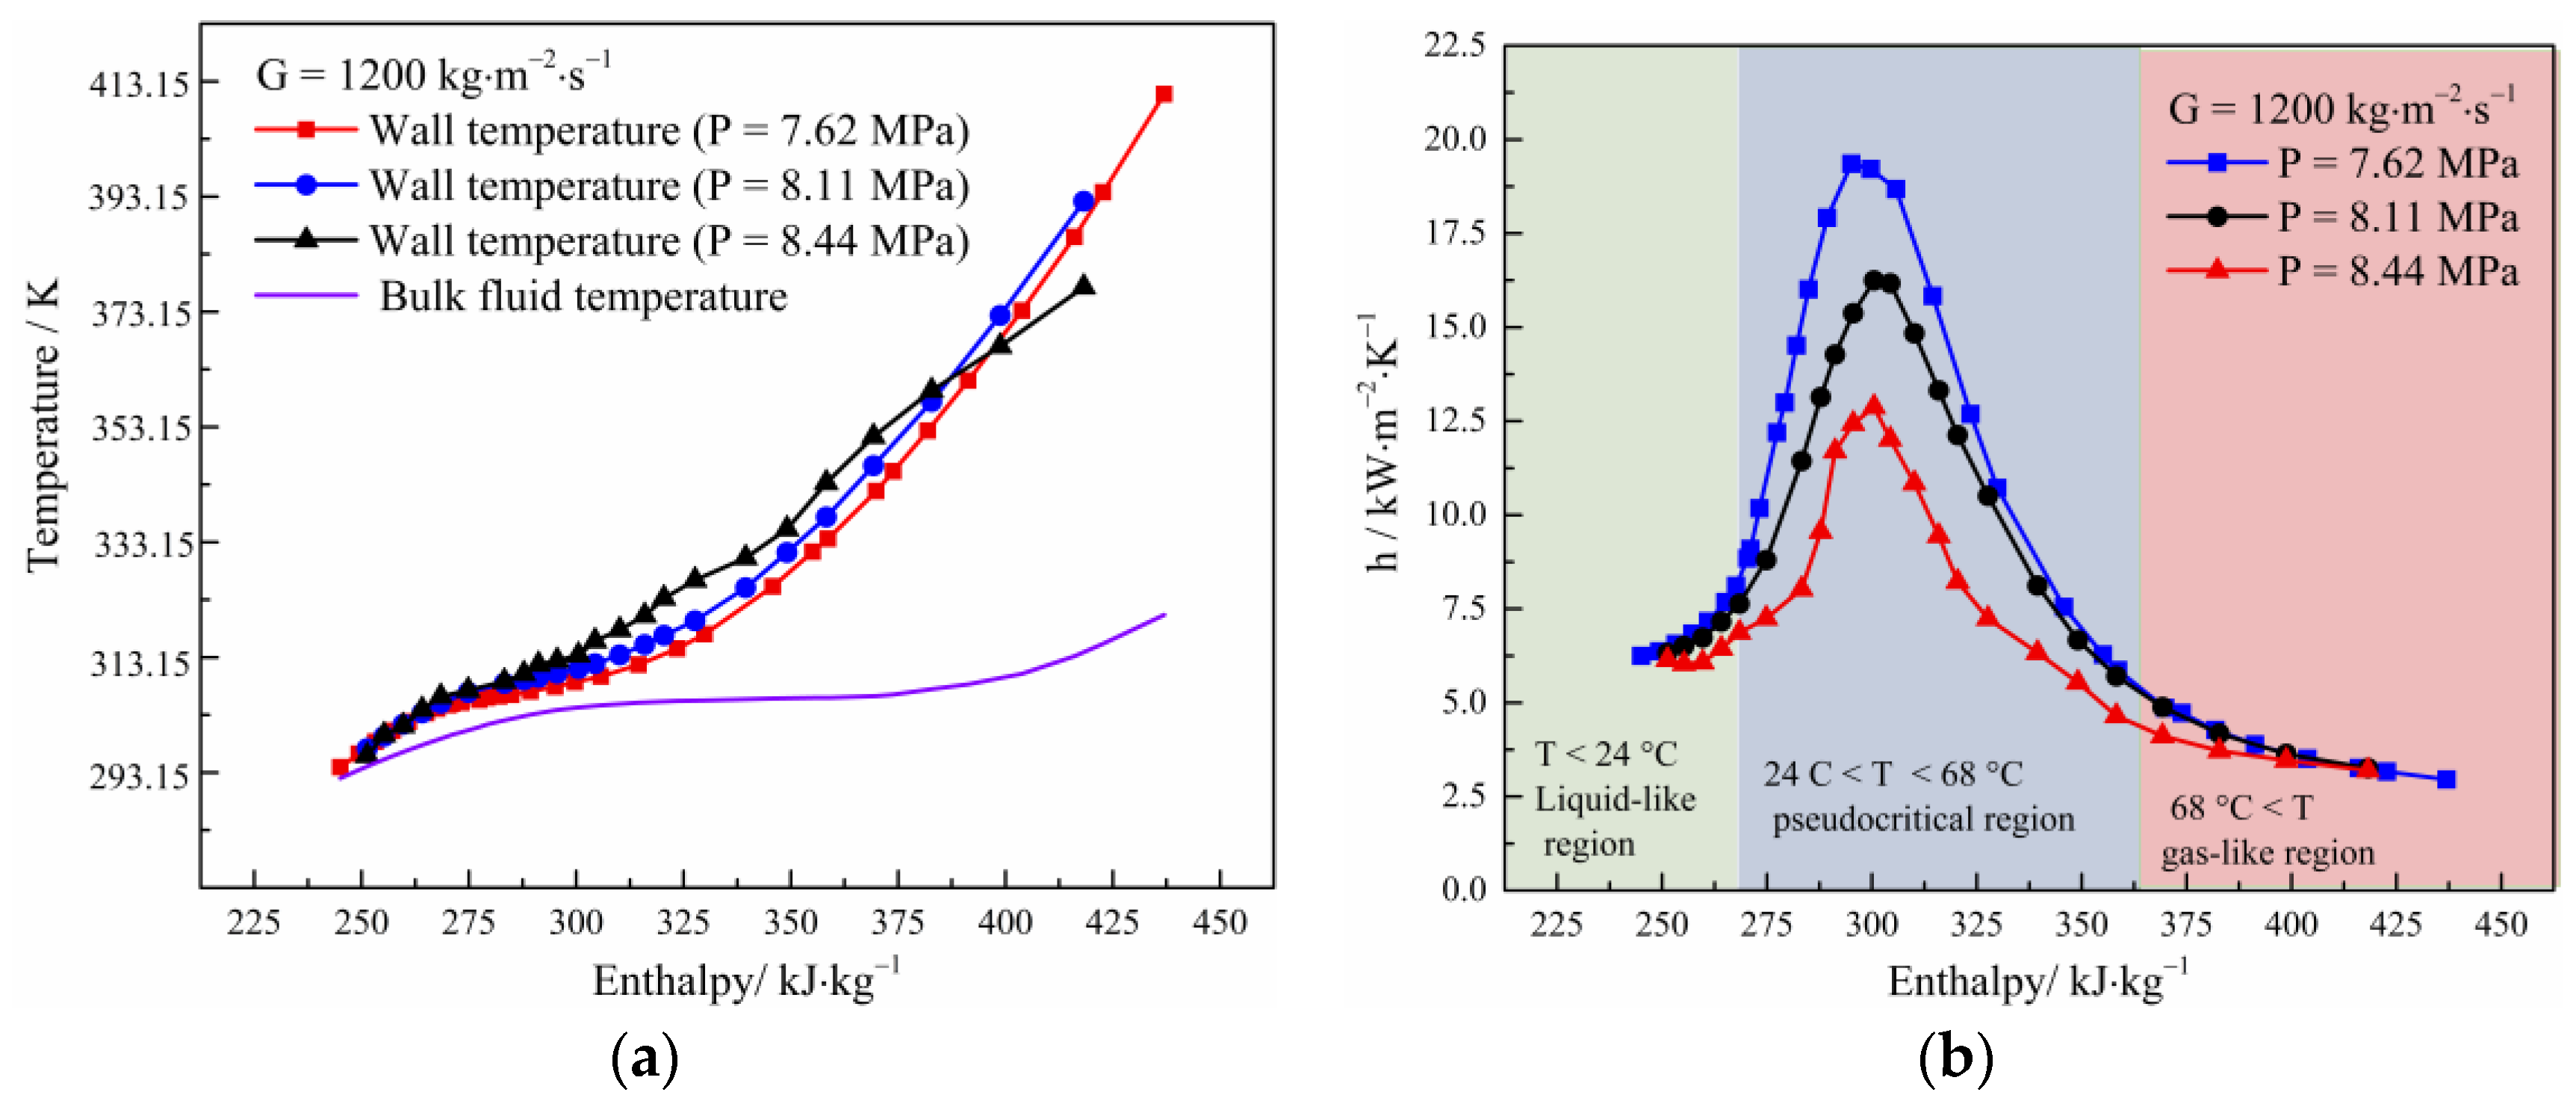
Figure 8.
Variation of frictional pressure drop (a) and friction factor (b) with enthalpy under different pressures.
Figure 8.
Variation of frictional pressure drop (a) and friction factor (b) with enthalpy under different pressures.

Figure 9.
Variation of wall temperature (a) and heat transfer coefficient (b) along the heating length under different heat flux values.
Figure 9.
Variation of wall temperature (a) and heat transfer coefficient (b) along the heating length under different heat flux values.

Figure 10.
The variation of buoyancy and flow acceleration parameters under different mass flux, pressure, and heat flux values. (a) the effect of different pressure on buoyancy, (b) the effect of different pressure on flow acceleration, (c) the effect of different mass flux on buoyancy, (d) the effect of different mass flux on flow acceleration, (e) the effect of different heat flux on buoyancy, (f) the effect of different heat flux on flow acceleration.
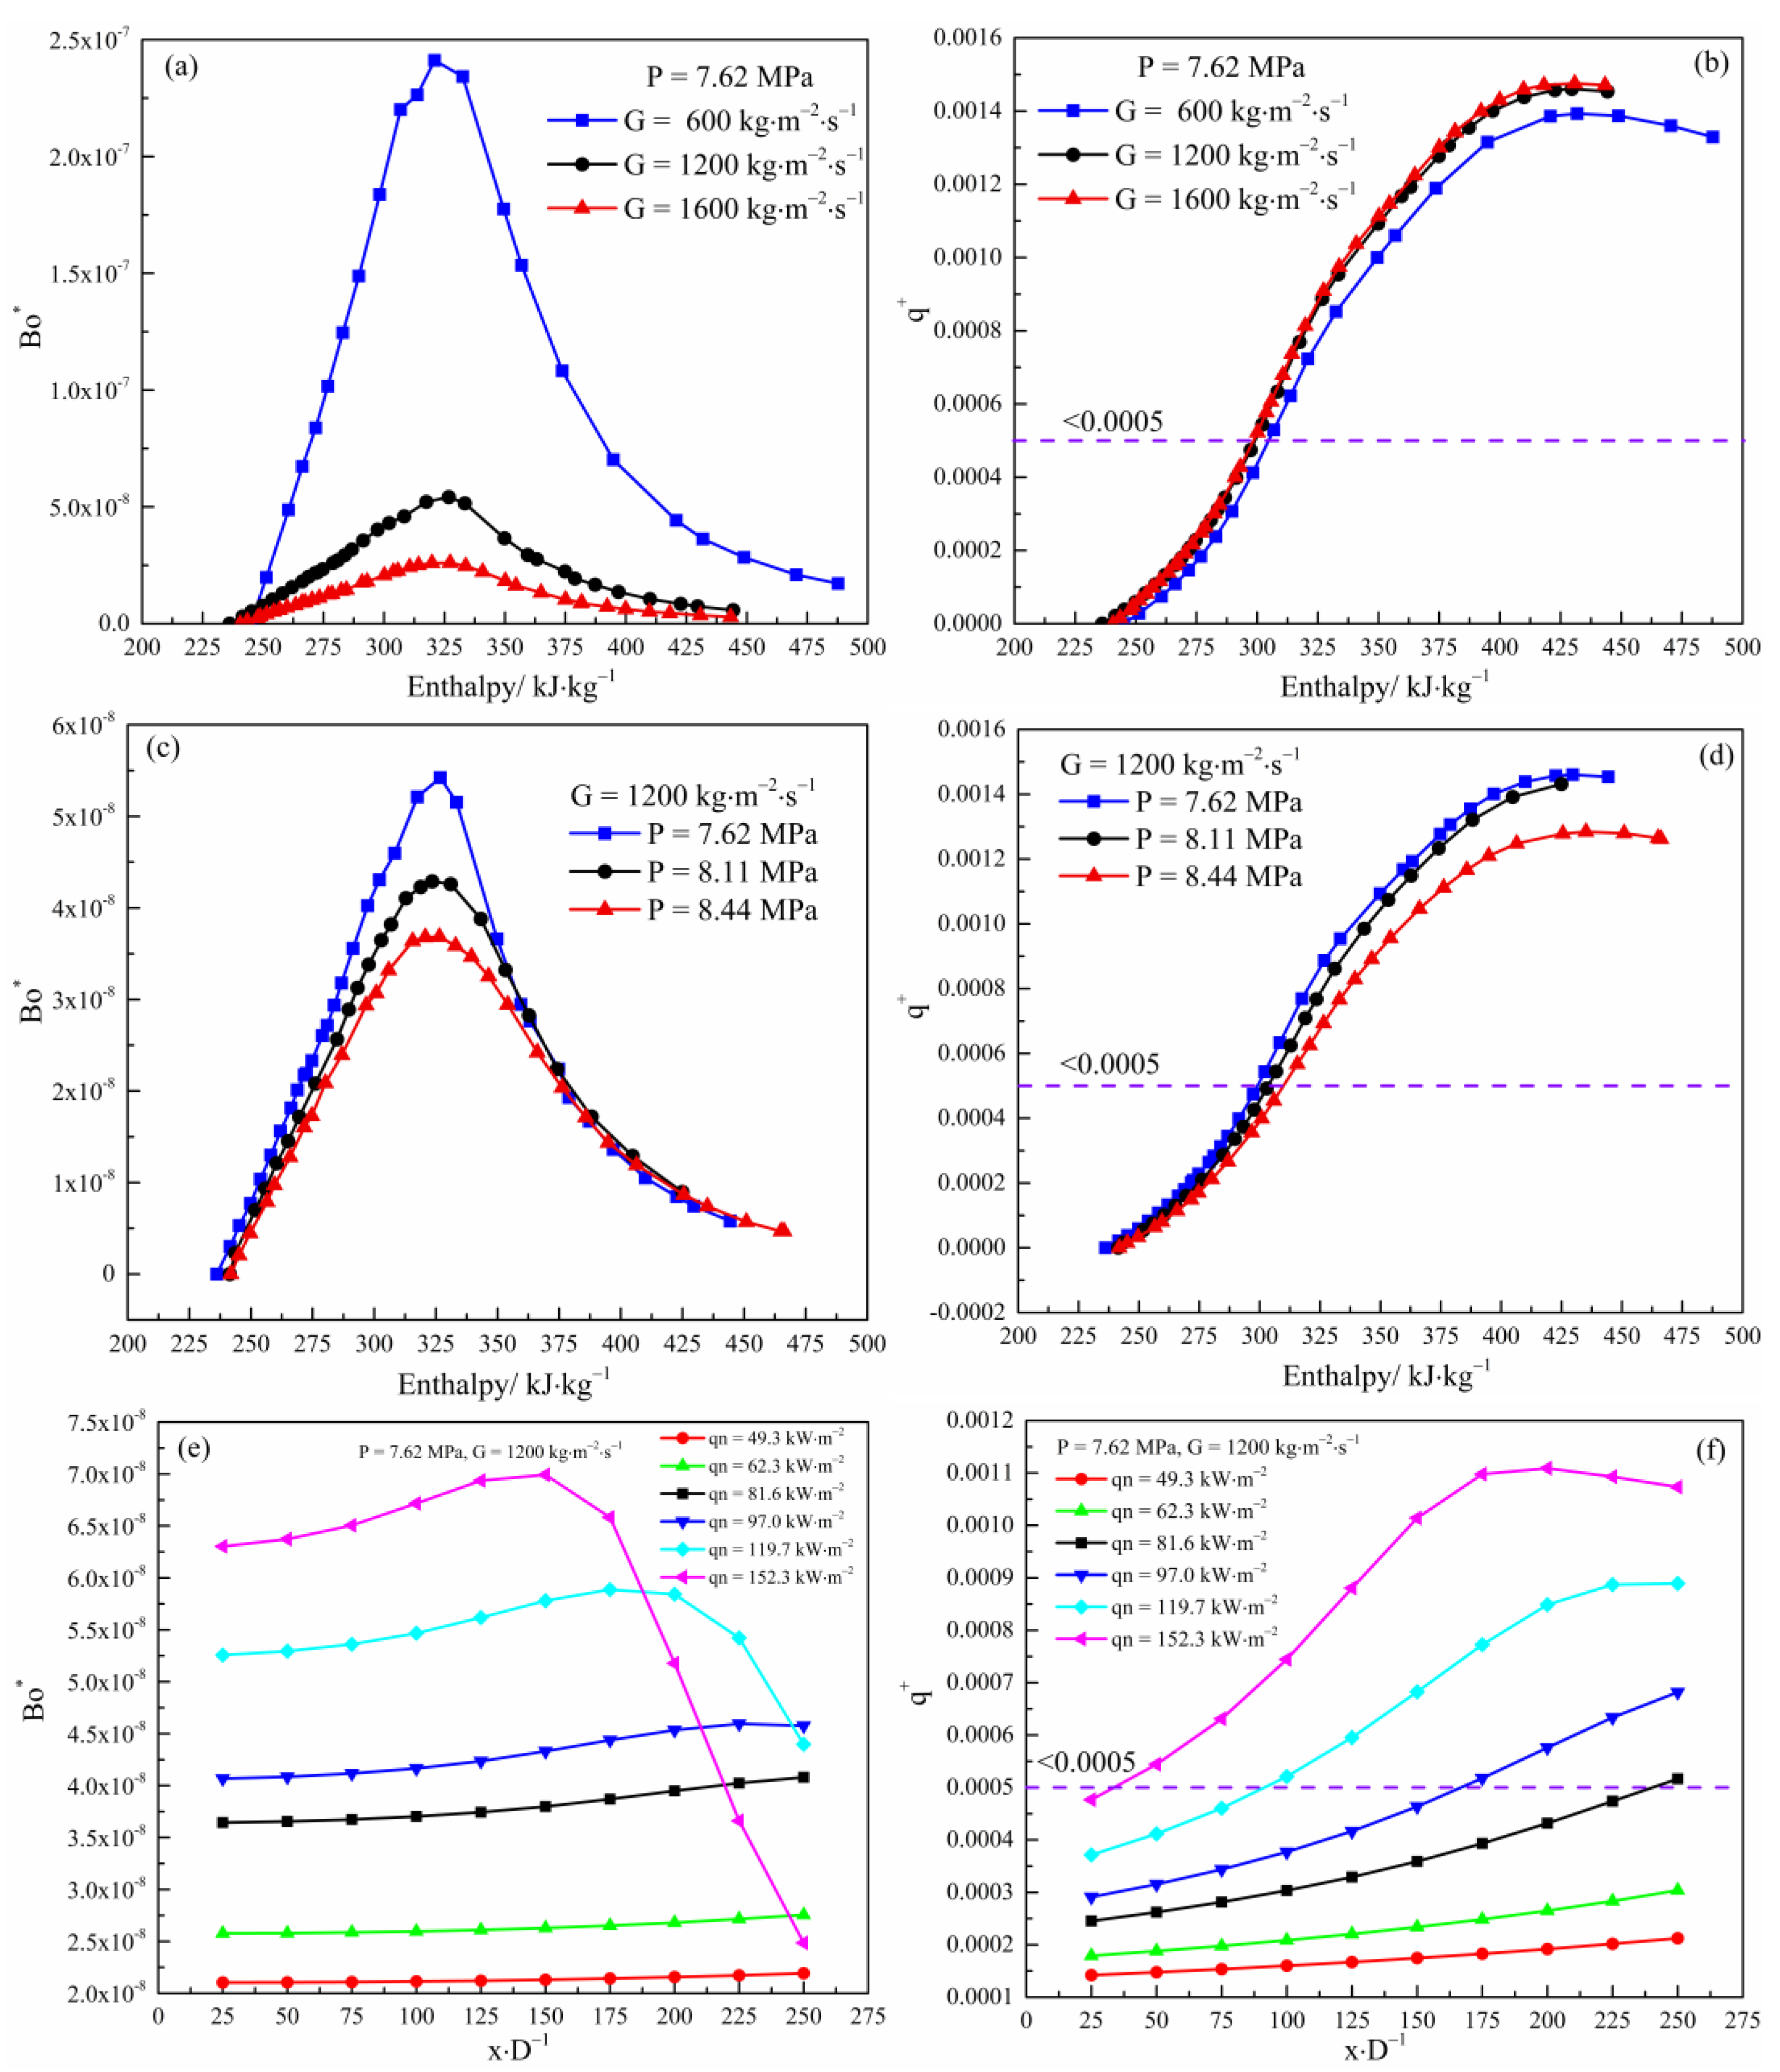
Figure 11.
Prediction performance of Nu using the new modified correlation.

Figure 12.
Comparison of the experimental friction factor with the new correlation of Equation (5). : the calculated friction factor of Equation (5), : the experimental friction factor, : the calculated friction factor of Filonenko correlation.
Figure 12.
Comparison of the experimental friction factor with the new correlation of Equation (5). : the calculated friction factor of Equation (5), : the experimental friction factor, : the calculated friction factor of Filonenko correlation.

Table 1.
Measurement conditions under different pressure and mass flux values.
| Pressure (Pseudocritical Point) | Mass Flux kg·m−2·s−1 | Heat Flux kW·m−2 |
|---|---|---|
| 7.4 MPa (30.25 °C) | 1200 | 0–319 |
| 7.62 MPa (32.3 °C) | 600 | 0–319 |
| 1200 | 0–319 | |
| 1600 | 0–319 | |
| 8.1 MPa (35.25 °C) | 1200 | 0–319 |
| 8.44 MPa (37 °C) | 1200 | 0–319 |
Publisher’s Note: MDPI stays neutral with regard to jurisdictional claims in published maps and institutional affiliations. |
© 2022 by the authors. Licensee MDPI, Basel, Switzerland. This article is an open access article distributed under the terms and conditions of the Creative Commons Attribution (CC BY) license (https://creativecommons.org/licenses/by/4.0/).
Share and Cite
MDPI and ACS Style
Lyu, H.; Wang, H.; Bi, Q.; Niu, F. Experimental Investigation on Heat Transfer and Pressure Drop of Supercritical Carbon Dioxide in a Mini Vertical Upward Flow. Energies 2022, 15, 6135. https://doi.org/10.3390/en15176135
AMA Style
Lyu H, Wang H, Bi Q, Niu F. Experimental Investigation on Heat Transfer and Pressure Drop of Supercritical Carbon Dioxide in a Mini Vertical Upward Flow. Energies. 2022; 15(17):6135. https://doi.org/10.3390/en15176135
Chicago/Turabian StyleLyu, Haicai, Han Wang, Qincheng Bi, and Fenglei Niu. 2022. "Experimental Investigation on Heat Transfer and Pressure Drop of Supercritical Carbon Dioxide in a Mini Vertical Upward Flow" Energies 15, no. 17: 6135. https://doi.org/10.3390/en15176135
Note that from the first issue of 2016, this journal uses article numbers instead of page numbers. See further details here.