
Probabilistic and Risk-Informed Life Extension Assessment of Wind Turbine Structural Components


1
Department of the Built Environment, Aalborg University, Thomas Manns Vej 23, 9220 Aalborg, Denmark
2
Environmental Energy Institute, University of Windsor, 401 Sunset Avenue, Windsor, ON N9B 3P4, Canada
*
Author to whom correspondence should be addressed.
Energies 2021, 14(4), 821; https://doi.org/10.3390/en14040821
Submission received: 7 January 2021
/
Revised: 27 January 2021
/
Accepted: 31 January 2021
/
Published: 4 February 2021
(This article belongs to the Special Issue Lifetime Extension of Wind Turbines and Wind Farms)
Abstract
:Reassessment of the fatigue life for wind turbine structural components is typically performed using deterministic methods with the same partial safety factors as used for the original design. However, in relation to life extension, the conditions are generally different from the assumptions used for calibration of partial safety factors; and using a deterministic assessment method with these partial safety factors might not lead to optimal decisions. In this paper, the deterministic assessment method is compared to probabilistic and risk-based approaches, and the economic feasibility is assessed for a case wind farm. Using the models also used for calibration of partial safety factors in IEC61400-1 ed. 4, it is found that the probabilistic assessment generally leads to longer additional fatigue life than the deterministic assessment method. The longer duration of the extended life can make life extension feasible in more situations. The risk-based model is applied to include the risk of failure directly in the economic feasibility assessment and it is found that the reliability can be much lower than the target for new turbines, without compromising the economic feasibility.
1. Introduction
Wind turbine towers are typically designed for a fatigue life of 20–25 years. Upon the end of the planned life of a wind farm, wind farm owners may consider continuing the operation for several additional years. In some countries, national regulations require inspections and an updated assessment of the fatigue life to verify that life extension can be performed safely, but the rules in countries differ [1]. Some components can be replaced if the condition is not sufficient for life extension, but this is too expensive for many structural components, such as towers [2].
Methods for fatigue life assessment are described in the DNV GL standards [3,4], which reflects the German rules. Here, an inspection is required to assess the general condition of the components, and a fatigue life assessment is required for the main components based on load assessment including an operations analysis. The loads and operations analyses result in an updated assessment of fatigue life, which could be smaller or larger than the planned original life.
Researchers search for ways to show that there is additional fatigue life remaining by exploiting differences in the design assumptions and the reality on the wind farm site. Various parameters, such as turbulence intensity, mean wind speed, availability, and corrosion, affect the fatigue life, and for offshore wind turbines, additional parameters regarding the wave climate; the interaction of these are case-specific, thus site-specific assessment is generally necessary [5]. However, for a wind farm where conditions are similar for the turbines within the wind farm, it is possible to assess the fatigue life for some turbines and extrapolate for the remaining turbines [6].
Fatigue life assessment based on data is a topic with large interest due to the challenges in exploiting the available operational data, and researchers search for methods to lower the computation burden of the otherwise time-demanding load simulations. A promising solution for site-specific fatigue assessment is in the use of surrogate models of high-fidelity load simulations. Murcia et al. [7] used polynomial surrogates based on polynomial chaos expansion (PCE) for fatigue damage equivalent loads (DEL). Slot et al. used PCE and Kriging surrogate models, and found that the additional uncertainty related to the use of a surrogate model was small [8]. Schröder et al. [9] found that artificial neural network (ANN) surrogate models performed better than PCE and quadratic polynomial models. Dimitrov [10] further used PCA and ANN surrogate models also for wake-induced loads, and Dimitrov and Natarajan [11] used ANN models to overcome challenges related to limited amounts of data, and they were able to extract useful information from Supervisory control and data acquisition (SCADA) and met-mast data, and thereby reassess the fatigue life based on operational data [12]. Other researchers considered have found potential in exploiting the directionality of the wind rose in the fatigue assessment [13,14]. Colone et al. [15] investigated the impact of turbulence-induced loads and wave kinematic models on fatigue reliability estimates of offshore wind turbine monopiles, and argue that more accurate modeling can lead to increased fatigue life.
Strain measurements are also used in several studies. Ziegler et al. [16] combined aero-hydro-elastic simulations and regression algorithms for extrapolation of strains to other locations. Smith et al. [17] used strain measurements to examine the effect of turbulence and shear on the fatigue loads, and Mai et al. [18] used strain measurements and the joint distribution of oceanographic data for reliability analysis of wind turbine support structures.
In addition to the fatigue life verification which is required in some countries, the economic feasibility of life extension projects needs to be evaluated. Acknowledging the interaction between economy and structural integrity, researchers suggest changing the control to avoid the most damaging situations. Natarajan and Pedersen [19] used a spinner anemometer to detect high-turbulence events and were able to increase the estimated tower fatigue life by 24%, while only reducing the annual energy production (AEP) by 2%. Ilsted et al. [20] reduced leading-edge erosion by reducing the tip speed in extreme precipitation events.
Several studies examining the feasibility conclude that the amount of refurbishments needed for life extension is a very important factor, as well as the unknown power price [21,22,23]. Ziegler et al. [24] investigated the effect of increasing maintenance costs on the feasibility of life extension compared to repowering. Rubert et al. [25] proposed to do the turbine-specific economic evaluation based on strain measurements, accounting for the differences in AEP between turbines. Other options include exploiting inspection data for remaining useful life assessment [26] and for reliability updating [12]. Furthermore, structural health monitoring is suggested for early fault detection for wind turbine blades, thus reducing the risk of catastrophic failure events [27].
The economic assessment can also consider the risk of structural failure directly, as assumptions regarding the economy lie behind the fatigue assessment methods applied. Usually a deterministic (semi-probabilistic) analysis is used with the same partial safety factors as in the original design, as given in IEC 61400-1 ed. 4 [28]. The partial safety factors were determined by Sørensen and Toft [29], who used a probabilistic model together with a design equation to calibrate partial safety factors, based on a design lifetime of 25 years; see also [30,31]. The partial safety factors were calibrated to result in a reliability target of = 3.3 for the annual reliability index in the last year of operation. This target was determined based on the generic table with reliability targets in ISO2394 [32], which was derived by Rackwitz [33] using a generic risk-based model. The probabilistic models and costs used in this generic model are not representative of the situation of life extension of wind turbines (see [34] for an elaboration of the background for the table).
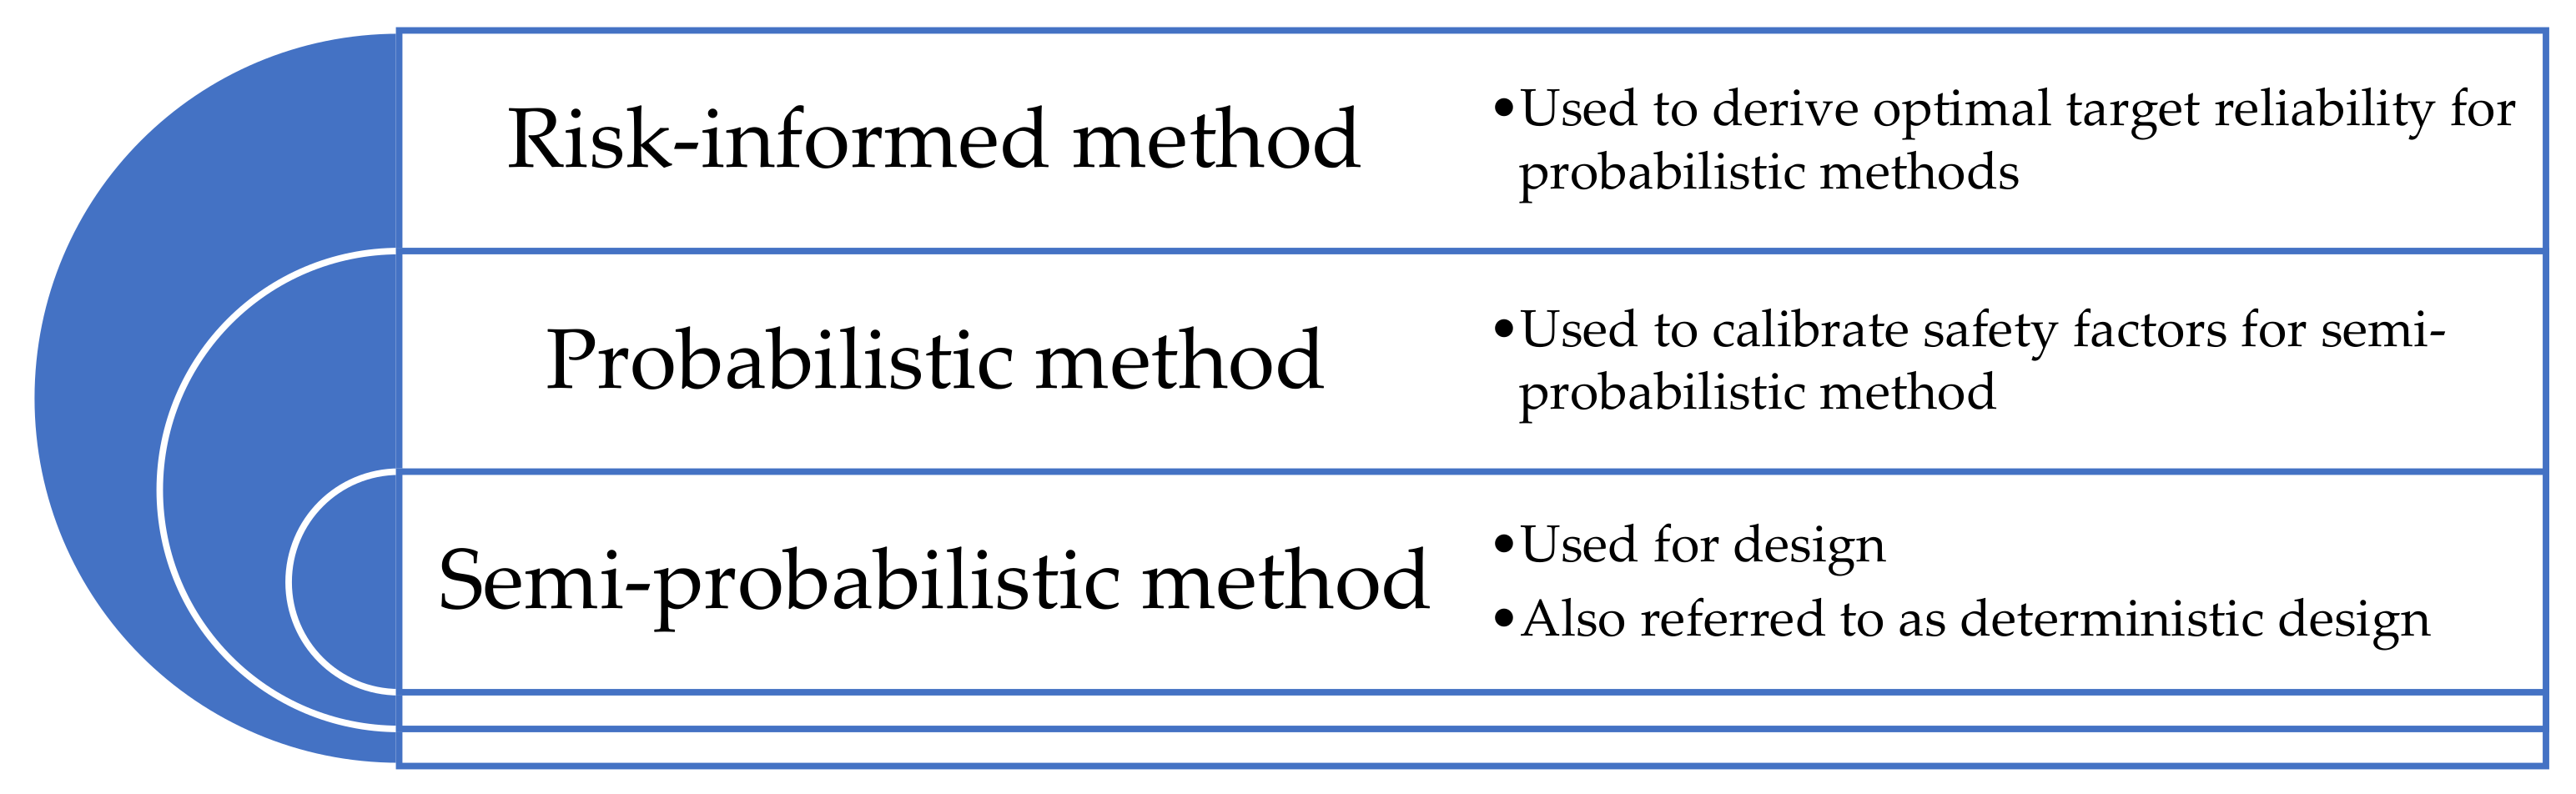
An alternative to the use of deterministic assessment methods is to use reliability or risk-based approaches directly. Figure 1 illustrates how the three methods for assessment are related. The risk-based approach includes probabilistic models and costs/consequences. The approach can be used directly for risk-informed assessment [35], or it can be used to derive optimal reliability targets for probabilistic assessment. Nielsen and Sørensen [36] used this approach and propose to reduce the reliability target from 3.3 to 3.1 for existing turbines, based on economic optimization and a generic cost model tailored for life extension of wind turbines.
Probabilistic assessment methods also use probabilistic models and can be used directly for assessment against a given reliability level. They can also be used for calibration of partial safety factors for semi-probabilistic/deterministic assessment. Going down to a less-advanced method means generalization, and generally results in a higher variation of the reliability level and risk.
This paper explores the benefit of using reliability and risk-informed methods in terms of additional years of fatigue life and the increased profit of longer life extension periods. It presents how the economic optimization model presented in [36] can be applied for a specific life extension project. The paper is organized as follows: Section 2 briefly outlines the background (for details see [29,36]), Section 3 presents the case study input and procedures, Section 4 presents and discusses the results, Section 5 provides a broader discussion of the implications of the results, and Section 6 concludes the paper.
2. Background
This section briefly outlines the background on deterministic, probabilistic, and risk-informed assessment. The deterministic and probabilistic models are based on the models used in [29] for calibration of partial safety factors for IEC 61400-1 ed. 4 [6], and the risk-informed assessment model was first presented in [36] for the derivation of a target reliability index for life extension. The models are briefly outlined for the sake of completeness, and the reader is directed to the references above for further details.
2.1. Deterministic/Semi-Probabilistic Assessment
Fatigue assessment is based on SN curves, where the relation between the number of cycles to failure under constant amplitude loading with stress range is given as:
for a linear SN curve with parameters and . For variable amplitude loading, Miner’s rule for linear damage accumulation is applied. The fatigue damage resulting from variable loading from stress ranges , , with each stress cycles is given by:
For a bilinear SN curve, the design equation for fatigue failure can be written as:
where
- is the number of load cycles per year.
- is the time in years.
- is the partial safety factor on the load effect (stress cycles).
- and are SN curve slopes.
- and are the characteristic values of the SN curve intercept parameters.
- and are the mean values of for each part of the SN curve divided by the proportion of cycles on the respective parts of the curve.
- is a design parameter (proportional to a cross-sectional parameter).
For the deterministic assessment, and are calculated based on the distribution for the mean wind speed, and the distribution for the stress ranges given mean wind speed, the characteristic value (90% quantile) of the turbulence standard deviation, and design parameter . In the design and assessment of wind turbines, this is generally evaluated using rainflow counting on time series from aeroelastic simulations for bins of the 10-min mean wind speed. For the results presented in this paper, the aeroelastic model is represented by the same surrogate model as used in [29], which is representative of a wind turbine tower.
2.2. Probabilistic Assessment
For probabilistic assessment, the limit state equation of fatigue failure for a bilinear SN curve can be written as:
where
- is the model uncertainty related to the use of Miner’s rule for damage accumulation, modeled by a normally distributed variable with mean value one and coefficient of variation .
- is the model uncertainty of the load effect modeled by a lognormal variable with mean value one and coefficient of variation .
- and are SN curve intercept parameters; and are modeled by normally-distributed, fully-correlated stochastic variables with standard deviations .
This probabilistic model is equal to the model used for calibration of partial safety factors for IEC61400-1 [28,29]. For the probabilistic assessment, and are calculated based on the distribution for the mean wind speed, the distribution for the turbulence standard deviation, and the distribution for the stress ranges given mean wind speed, turbulence, and design parameter z (see [29,36] for details). In probabilistic design and assessment of wind turbines, this is generally evaluated using rainflow counting on time series from aeroelastic simulations for bins of the 10-min mean wind speed and turbulence intensity. For the results presented in this paper, the aeroelastic model is represented by the same surrogate model as used in [29]. To evaluate the reliability, structural reliability methods are first used to evaluate the cumulative distribution function for the time to failure ; then the density function for the time to failure is evaluated, and the annual probability of failure given survival in all preceding years is evaluated:
The annual reliability index is related to the annual probability of failure by the relationship:
2.3. Risk-Informed Assessment
For the risk-informed assessment, the same probabilistic model as summarized in Section 2.2 is used to model the probability of failure. However, in the risk-informed assessment, decisions are made based on the expected present value of the profit, i.e., the expected present value of the benefits minus the costs, when the risk of structural failure is included in the assessment. The risk-based model for life extension was first presented in [36] and is included here for completeness.
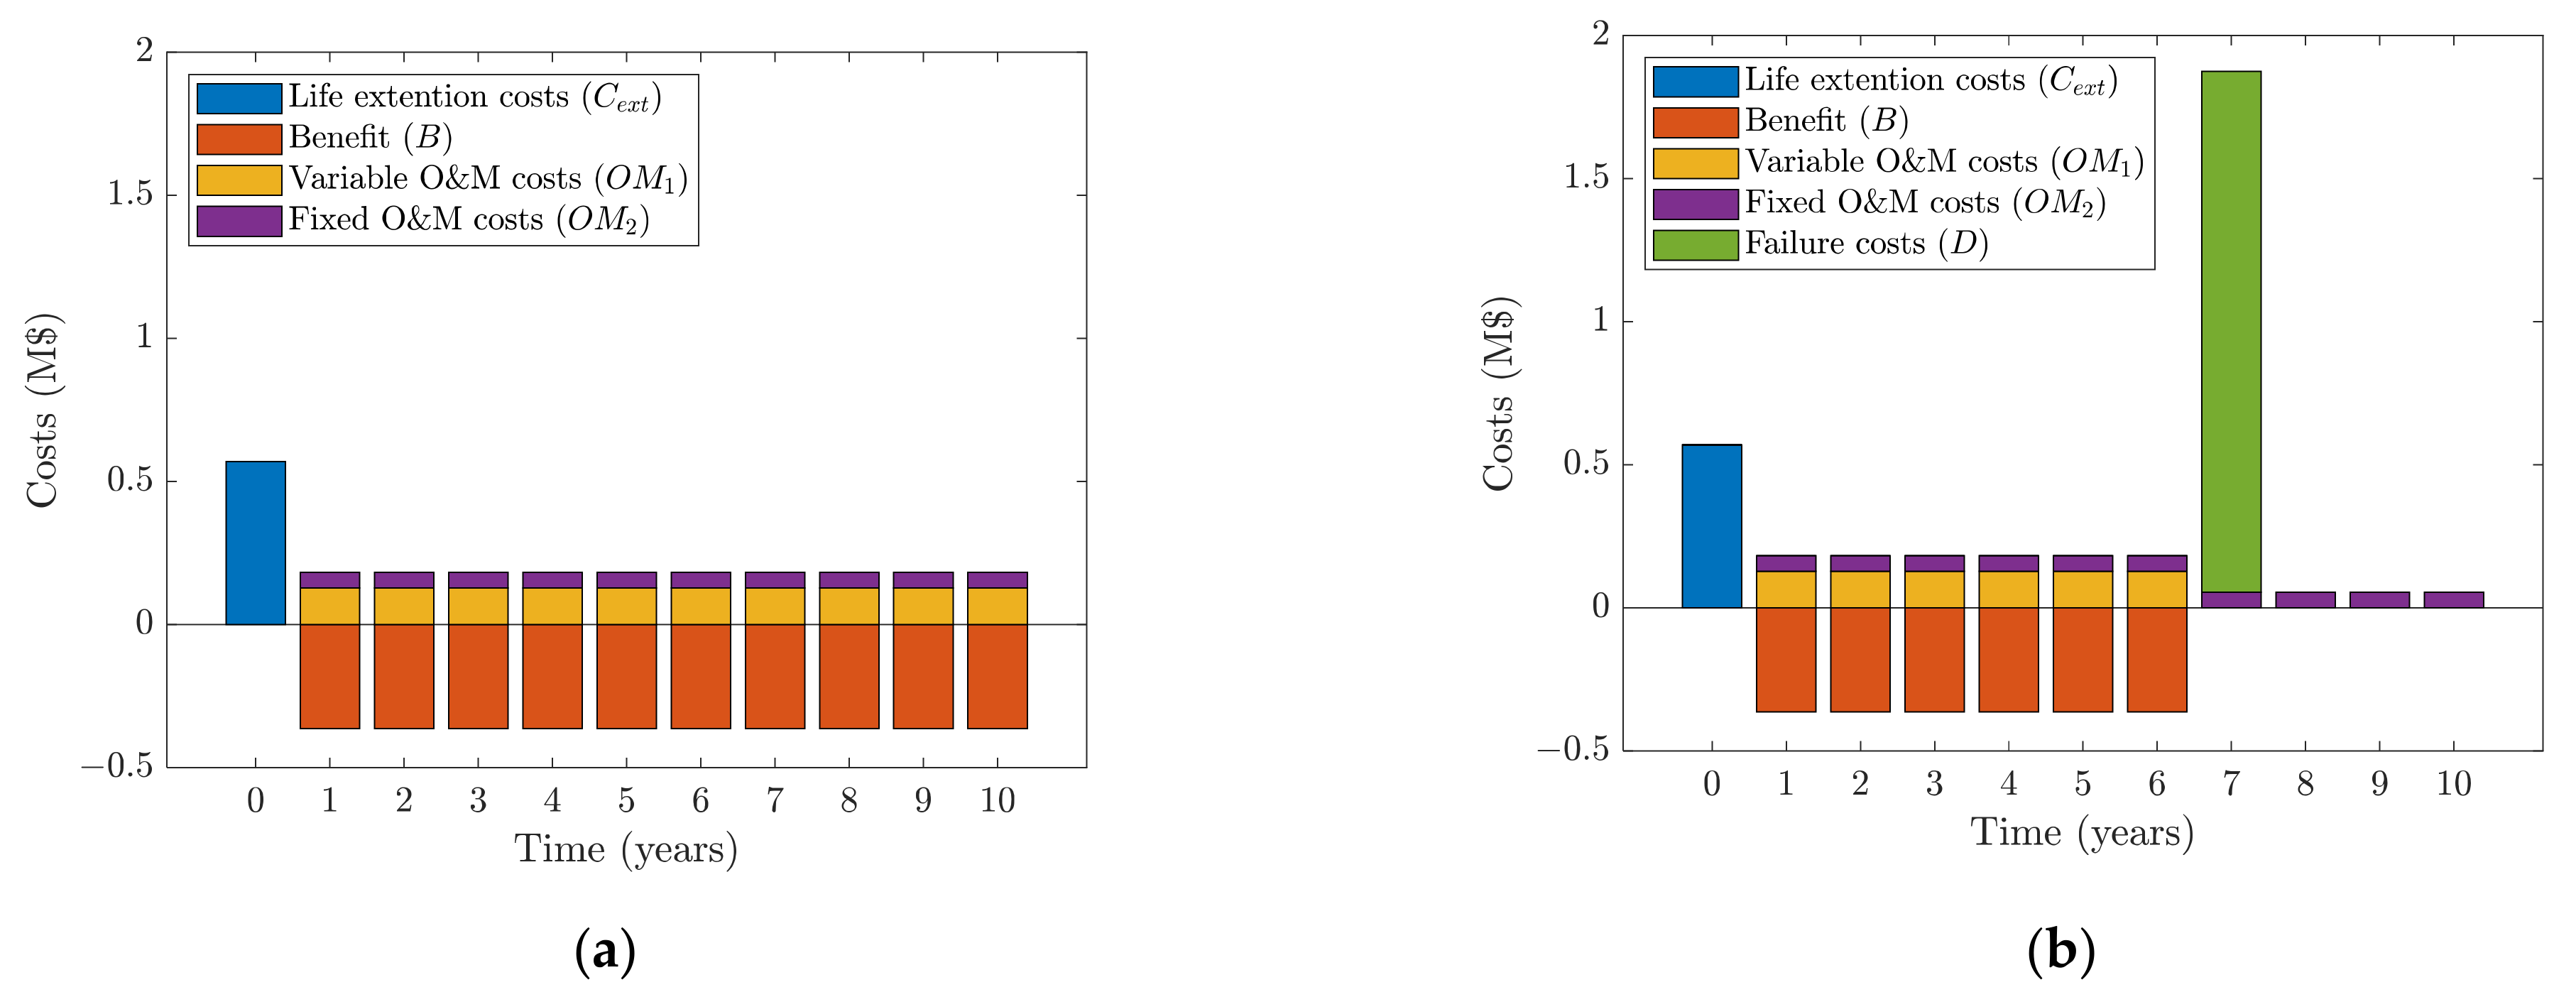
Figure 2 shows how the costs are distributed in time for the situation with and without a failure in the extended life. In both cases, there is an investment made in year zero; the life extension costs to inspections, analyses, and refurbishments. In the case of no failure, there will be a continuous benefit from selling power, and there will be continuous expenses to operation and maintenance (O&M) until the end of the extended life. In the case of failure in the extended life, the benefits and variable O&M costs will discontinue at the time of failure, whereas the fixed O&M costs will continue. Also, the failure will be associated with a consequence/cost at the time of failure.
The expected value of the profit as a function of the life extension period and design parameter is calculated from:
with the following expected present values of:
- : benefit (income from power production).
- : life extension cost.
- : variable O&M costs.
- : fixed O&M costs.
- : cost of structural failure.
Expressions of the expected present values of the benefits and costs are given below. They are calculated based on a shifted time scale starting at the time of life extension. Continuous discounting is performed using the discount rate . The expected present value of the benefit is calculated considering the risk of failure in the extended life as:
where are the annual benefits, and is an integration substitute for . Similarly, the expected present value of the variable O&M costs is calculated as:
where are the annual variable O&M costs. The expected present value of the fixed O&M costs are simply calculated as:
where are the annual fixed O&M costs. The expected present value of the costs of structural failure is calculated as:
where is the consequence of failure. The integrals are evaluated numerically with one-year intervals using the time to failure distribution evaluated using the probabilistic model, Equations (5) and (6).
3. Case Study
This paper aims to compare the deterministic, probabilistic, and risk-informed method for life extension assessment. We will consider a representative wind farm and assume that the wind turbine towers are designed according to the site conditions using the deterministic approach. We assume that the tower is the critical structural component in terms of fatigue loads. At the end of the original design lifetime of 25 years, the owner wishes to extend the life of the wind farm. The need for refurbishments of mechanical components and blades is assessed using an inspection. The structural integrity of the tower with respect to fatigue is to be verified using updated environmental and operational conditions based on measurements. The baseline assessment is made using the deterministic method, and the economic feasibility is estimated without considering the risk of structural failure, by calculation of the expected present value of the profit :
As an alternative to the deterministic assessment, the probabilistic or risk-informed approach can be applied. In the probabilistic approach, it is required that the annual reliability index in the last year of the extended life is below the target value of 3.3 (or 3.1, if a reduced target is allowed, as suggested in [36]). In the risk-informed approach, it is required that the expected present value of the profit () is positive, when the interest rate is used as discount rate, and the risk of structural failure is included.
3.1. Case Wind Farm
The case study considers a wind farm with 44 2.3 MW turbines. The wind turbine tower is designed for a reference turbulence intensity of 14% and a 10-min mean wind speed at a hub height of 8 m/s. The economic data below are adapted from Carriveau and Miller [22].
The annual energy production (AEP) is 7280 MWh per turbine. The power purchase agreement (PPA) price is $50/MWh and the annual O&M costs () are $25/MWh. The proportion of the O&M costs that are variable () are 0.7 of the total O&M cost. This yields an annual profit () per turbine equal to:
If the PPA price was only $30/MWh, the annual profit would be per turbine.
However, in order to extend the life it is necessary to do a visual inspection, a loads analysis, and an operations analysis with the following costs per turbine (adapted from [37]):
- Visual inspection: .
- Loads analysis: .
- Operations analysis: .
Also, depending on the outcomes of the inspections, it may be necessary to do repairs and retrofits of various components. Four representative levels of retrofits are considered, with the following costs:
- No repairs: .
- Low level: 10,000,000 (50% of gearboxes).
- Medium level: 17,500,000 (50% of the blades).
- High level: 25,000,000 (40% each of blades, gearboxes, and generators).
The average costs per turbine for the four levels are then: $0, $227,000, $398,000, and $568,000, respectively. The life extension costs are then calculated as the sum of the costs to visual inspection, loads analysis, operations analysis, and repairs and retrofits. These costs occur at the start of the life extension period. All other costs are distributed in the extended life and are discounted to net present values using an interest rate of .
In case of a structural failure, the costs/consequences are assumed to be ten times the annual O&M costs ( per turbine).
3.2. Procedure
The procedure for deterministic, probabilistic, and risk-based assessment in the case study is described in the following.
3.2.1. Deterministic Assessment
The fatigue life resulting from the deterministic assessment can be different from the design fatigue life due to differences in the environmental or operational conditions compared to the design assumptions, e.g., differences in the turbulence intensity, the number of load cycles, or the mean wind speed. The conditions on the site could be more benign, similar to, or harsher than assumed in the design, leading to longer, the same, or shorter fatigue life. For the analysis, various outcomes of the fatigue life from the deterministic analysis are assumed, and the economic feasibility is assessed using Equation (14) for life extension periods corresponding to each assumed outcome, for the four different retrofit levels.
3.2.2. Probabilistic Assessment
To compare the probabilistic assessment with the deterministic assessment, the models in Section 2.1 and Section 2.2 are applied. First, the required design parameter is found using the deterministic method with the initial design assumptions such that the design life is equal to 25 years (Equation (3) is set equal to zero and is then solved for ). Then, updated deterministic fatigue lives are modeled by changing, one at a time, the design parameter , the turbulence intensity, the annual number of load cycles, and the mean wind speed.
For each combination, the probabilistic fatigue life is also estimated. The annual reliability index is found as a function of time using the procedure in Section 2.2. For the assessment of the cumulative distribution of the time to failure based on the limit state equation, an efficient implementation of crude Monte Carlo (MC) simulations was developed. Where traditional MC algorithms use loops, this implementation uses elementwise operations, which was found to reduce the computational time by a factor of 500. This approach can be applied when the limit state equation is a simple function, which is the case for equation (4), as and are evaluated before the reliability analysis. The maximum number of simulations is limited by the memory of the computer, but a larger number of simulations can be made by doing the simulations in blocks of, e.g., . For the results in this paper, crude Monte Carlo simulations were found sufficient to obtain sufficiently accurate results, although it resulted in minor year-to-year fluctuations.
To filter out these year-to-year fluctuations from the overall trend, a cubic smoothing spline algorithm was applied. The probabilistic fatigue life was derived as the point in time where the annual reliability index dropped below the target, which was found using interpolation in the filtered results. The probabilistic fatigue life was found for a target equal to 3.3 (the target for new wind turbines) and 3.1 (the target proposed by [36] for life extension of wind turbines).
For the deterministic fatigue lives assumed in Section 3.2.1, the corresponding probabilistic fatigue lives are found, and the economic feasibility is assessed using Equation (14) for an extended life corresponding to the additional fatigue life beyond 25 years.
3.2.3. Risk-Informed Assessment
In the risk-informed assessment, the procedure in Section 2.2 and Section 2.3 is applied to assess the feasibility, when the risk of structural failure is included directly in the assessment.
4. Results
This section presents the results of the analyses based on deterministic, probabilistic, and risk-based assessment methods. The expected present value of the profits is compared for the three analysis methods.
4.1. Deterministic Assessment
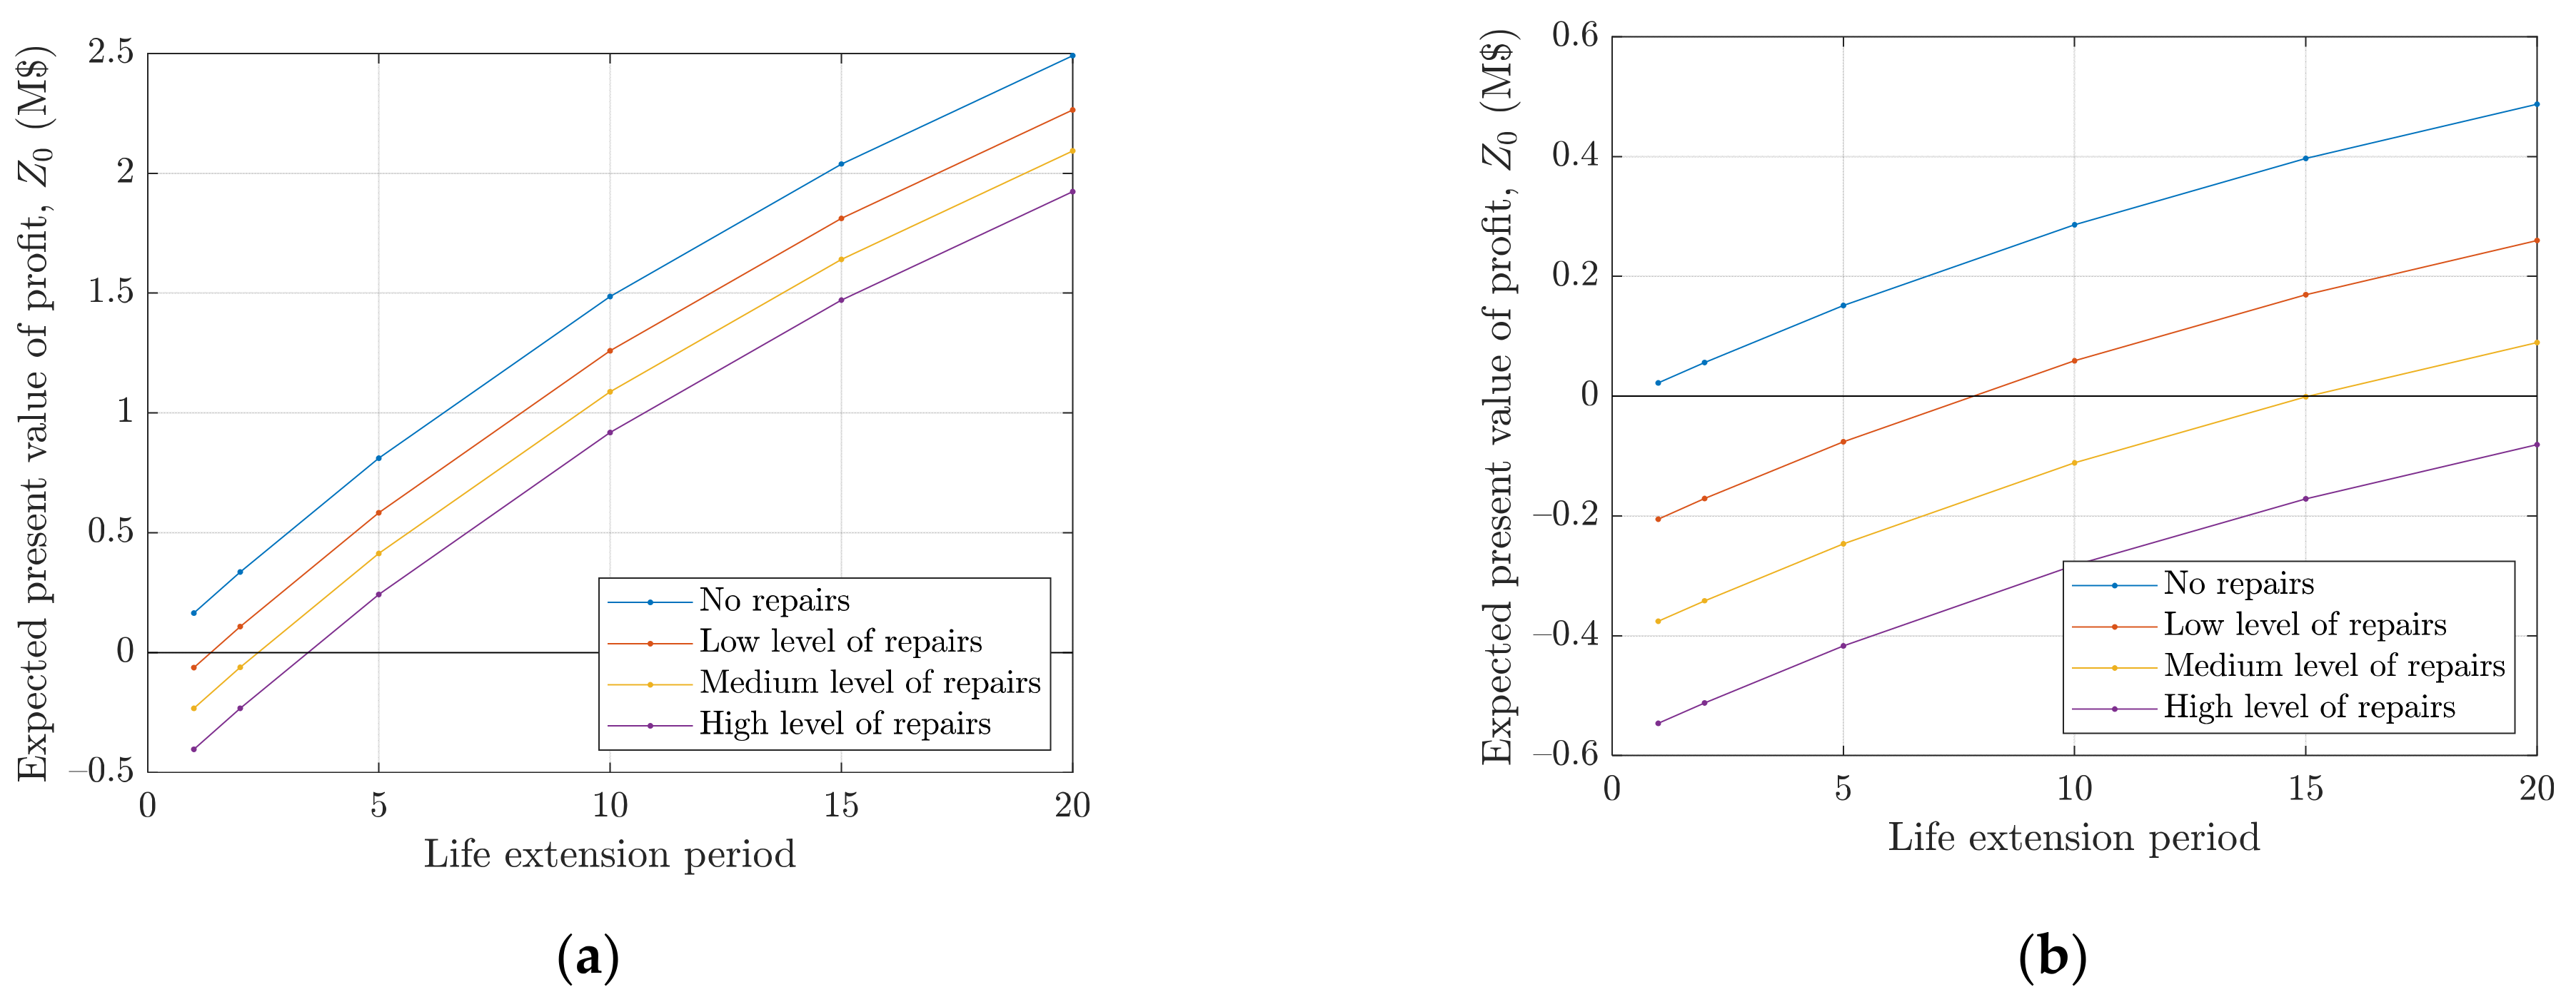
The starting point for the analyses is outcomes of fatigue lives from the deterministic method. Figure 3 shows the expected present value of the profit, , calculated using Equation (14) for life extension periods 1, 2, 5, 10, 15, and 20 years for the four levels of retrofits. In Figure 3a, the economic input presented in Section 3.1 is used, and in Figure 3b, the power price is reduced from $50/MWh to $30/MWh. For the case of no repairs, all life extension periods lead to a positive expected present value of the profit, but for the low power price, the margin is narrow. Increasing the costs of retrofits translates the graph downwards, and higher life extension periods are required to get a positive expected present value of the profit. For the high power price, all life extension periods above 5 years will lead to positive profit, but for the low power price, a 5 year life extension period is only feasible if no retrofits are necessary. For a 10-year life extension period, the low retrofit level is also feasible, whereas higher life extension periods are required for the medium retrofit level, and 20 years of life extension is not even sufficient for the high level of repairs.
4.2. Probabilistic Assessment
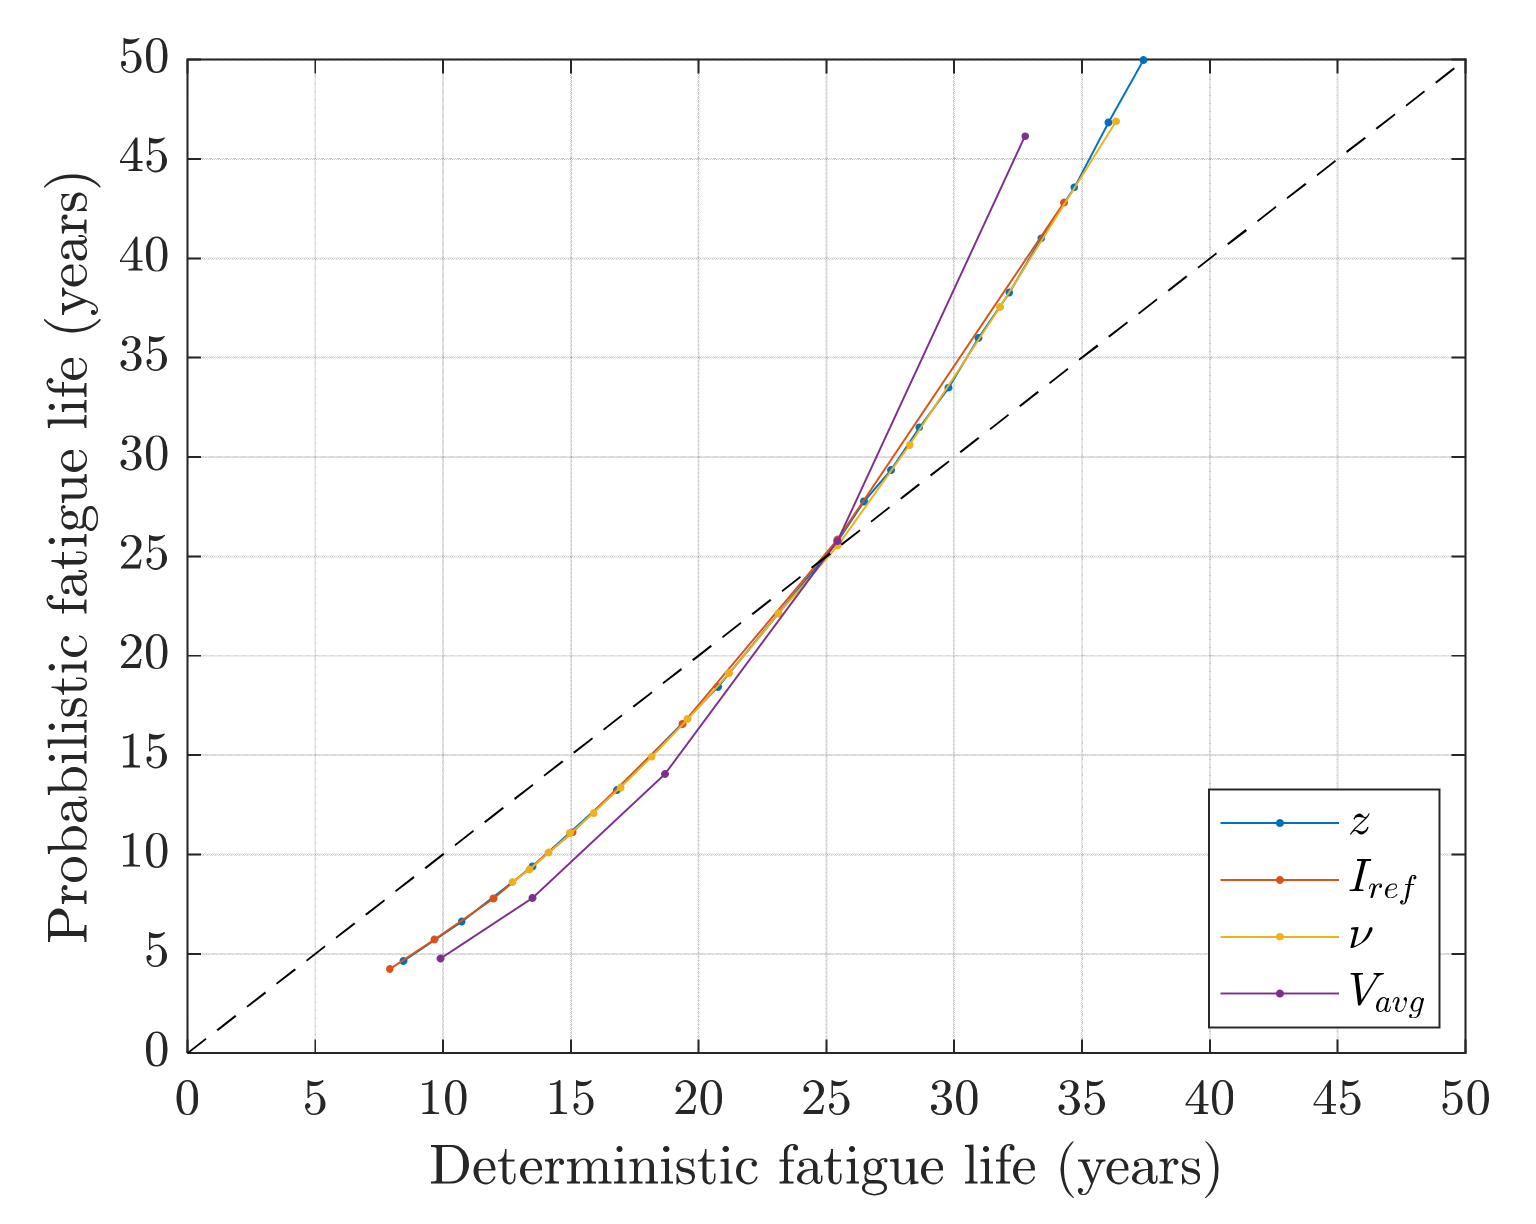
The outcome of the probabilistic assessment can be related to the outcomes of the deterministic assessment using the models in Section 2.1 and Section 2.2 with the same assumptions on input. The probabilistic fatigue life is here understood as the point in time where the annual reliability index drops below the target value for structural components in new wind turbines, . In Figure 4, the probabilistic fatigue life is shown as a function of deterministic fatigue life for variations of design parameter , reference turbulence intensity , the annual number of load cycles , and 10-min mean wind speed at hub height . The design assumptions correspond to a deterministic fatigue life period of 25 years, as the design parameter was determined to fulfill this. Here, the probabilistic model also gives a fatigue life of 25 years. However, for smaller or larger deterministic fatigue lives than 25 years, the probabilistic model results in a different result; for deterministic fatigue lives larger than 25 years, the probabilistic analysis gives larger fatigue lives than the deterministic model, and for deterministic fatigue lives below 25 years, the opposite is the case. Changes in design parameter, turbulence intensity, or the annual number of load cycles have a similar effect. A change that increases the deterministic fatigue life by 5 years to 30 years (e.g., lower turbulence intensity or fewer load cycles than expected in design) results in almost 10 years of additional lifetime beyond the 25 years for the probabilistic model. Changes in the mean wind speed result in even larger deviations of the fatigue life found by the deterministic and probabilistic model.
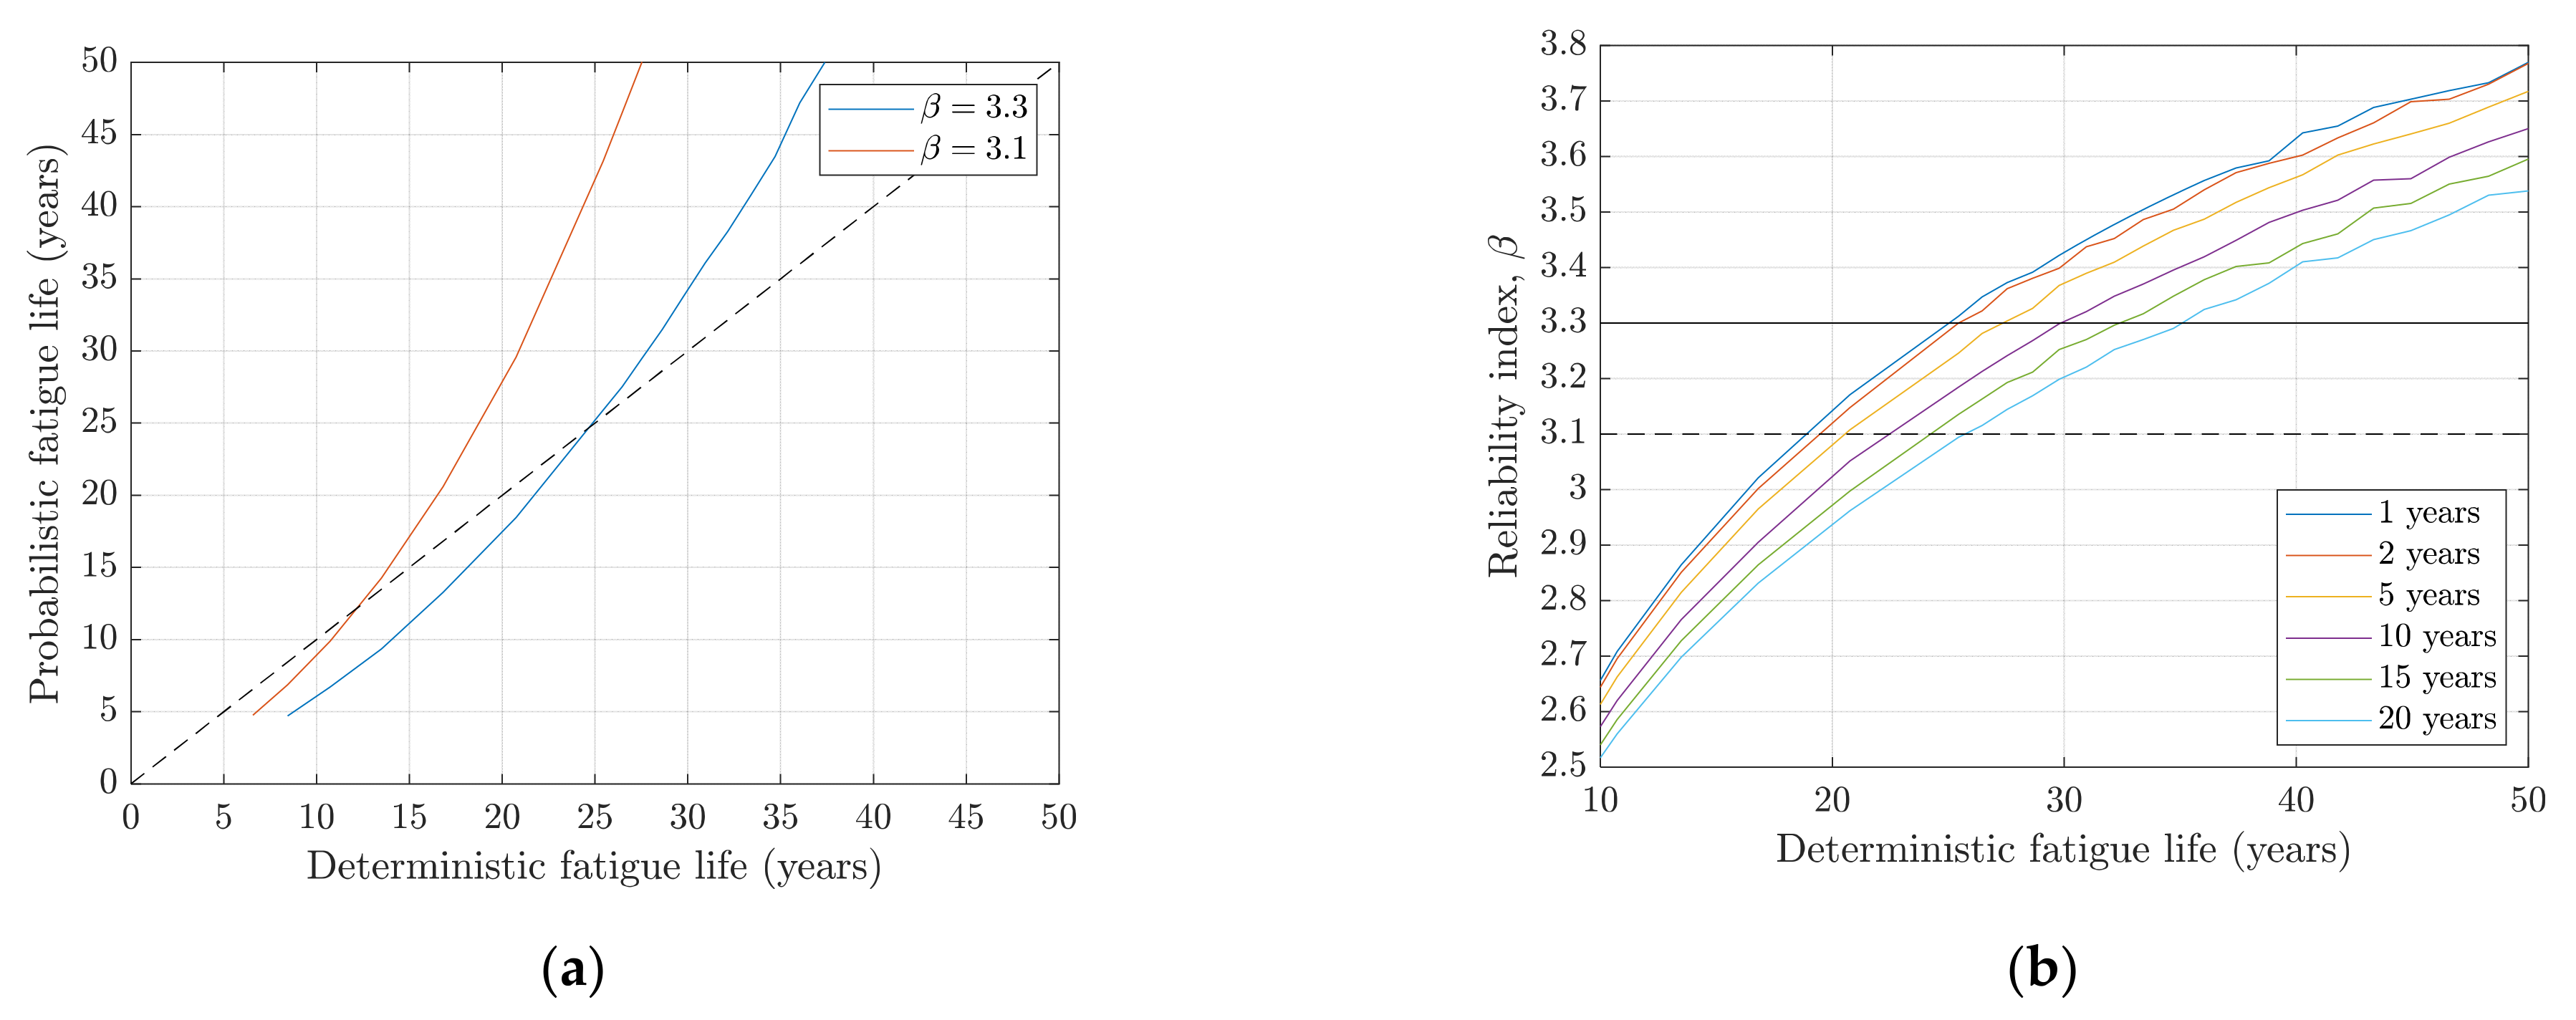
In Figure 5a, the relationship between deterministic and probabilistic fatigue life is shown for reliability index and for variations of design parameter (which gives the same result as variations in turbulence intensity and the number of load cycles). It is seen that acceptance of a reliability index of will generally result in more than 15 additional years of operation than for deterministic fatigue lives larger than 25 years. The same can be seen in Figure 5b, where the reliability index in the last years of the extended life is shown as a function of deterministic-assessed fatigue life for life extension periods 1, 2, 5, 10, 15, and 20 years. This figure more clearly shows the relationship between assessed deterministic fatigue life and reliability index.
We will now see how the expected present value of the profit increases due to longer life extension periods made possible by the use of a probabilistic model. Table 1 shows the remaining fatigue life estimated by the probabilistic model with and as the target for deterministic fatigue lives 1, 2, 5, 10, 15, and 20 years, and shows the expected present value of the profit for life extension periods corresponding to the remaining fatigue life for the four retrofit levels. In case the remaining fatigue life is more than 20 years, a life extension period of 20 years is used. When the deterministic assessment method predicts low fatigue lives (1, 2, or 5 years), the use of probabilistic models will lead to longer life extension periods with higher profit, and higher levels of retrofits do not make life extension infeasible.
4.3. Risk-Based Assessment
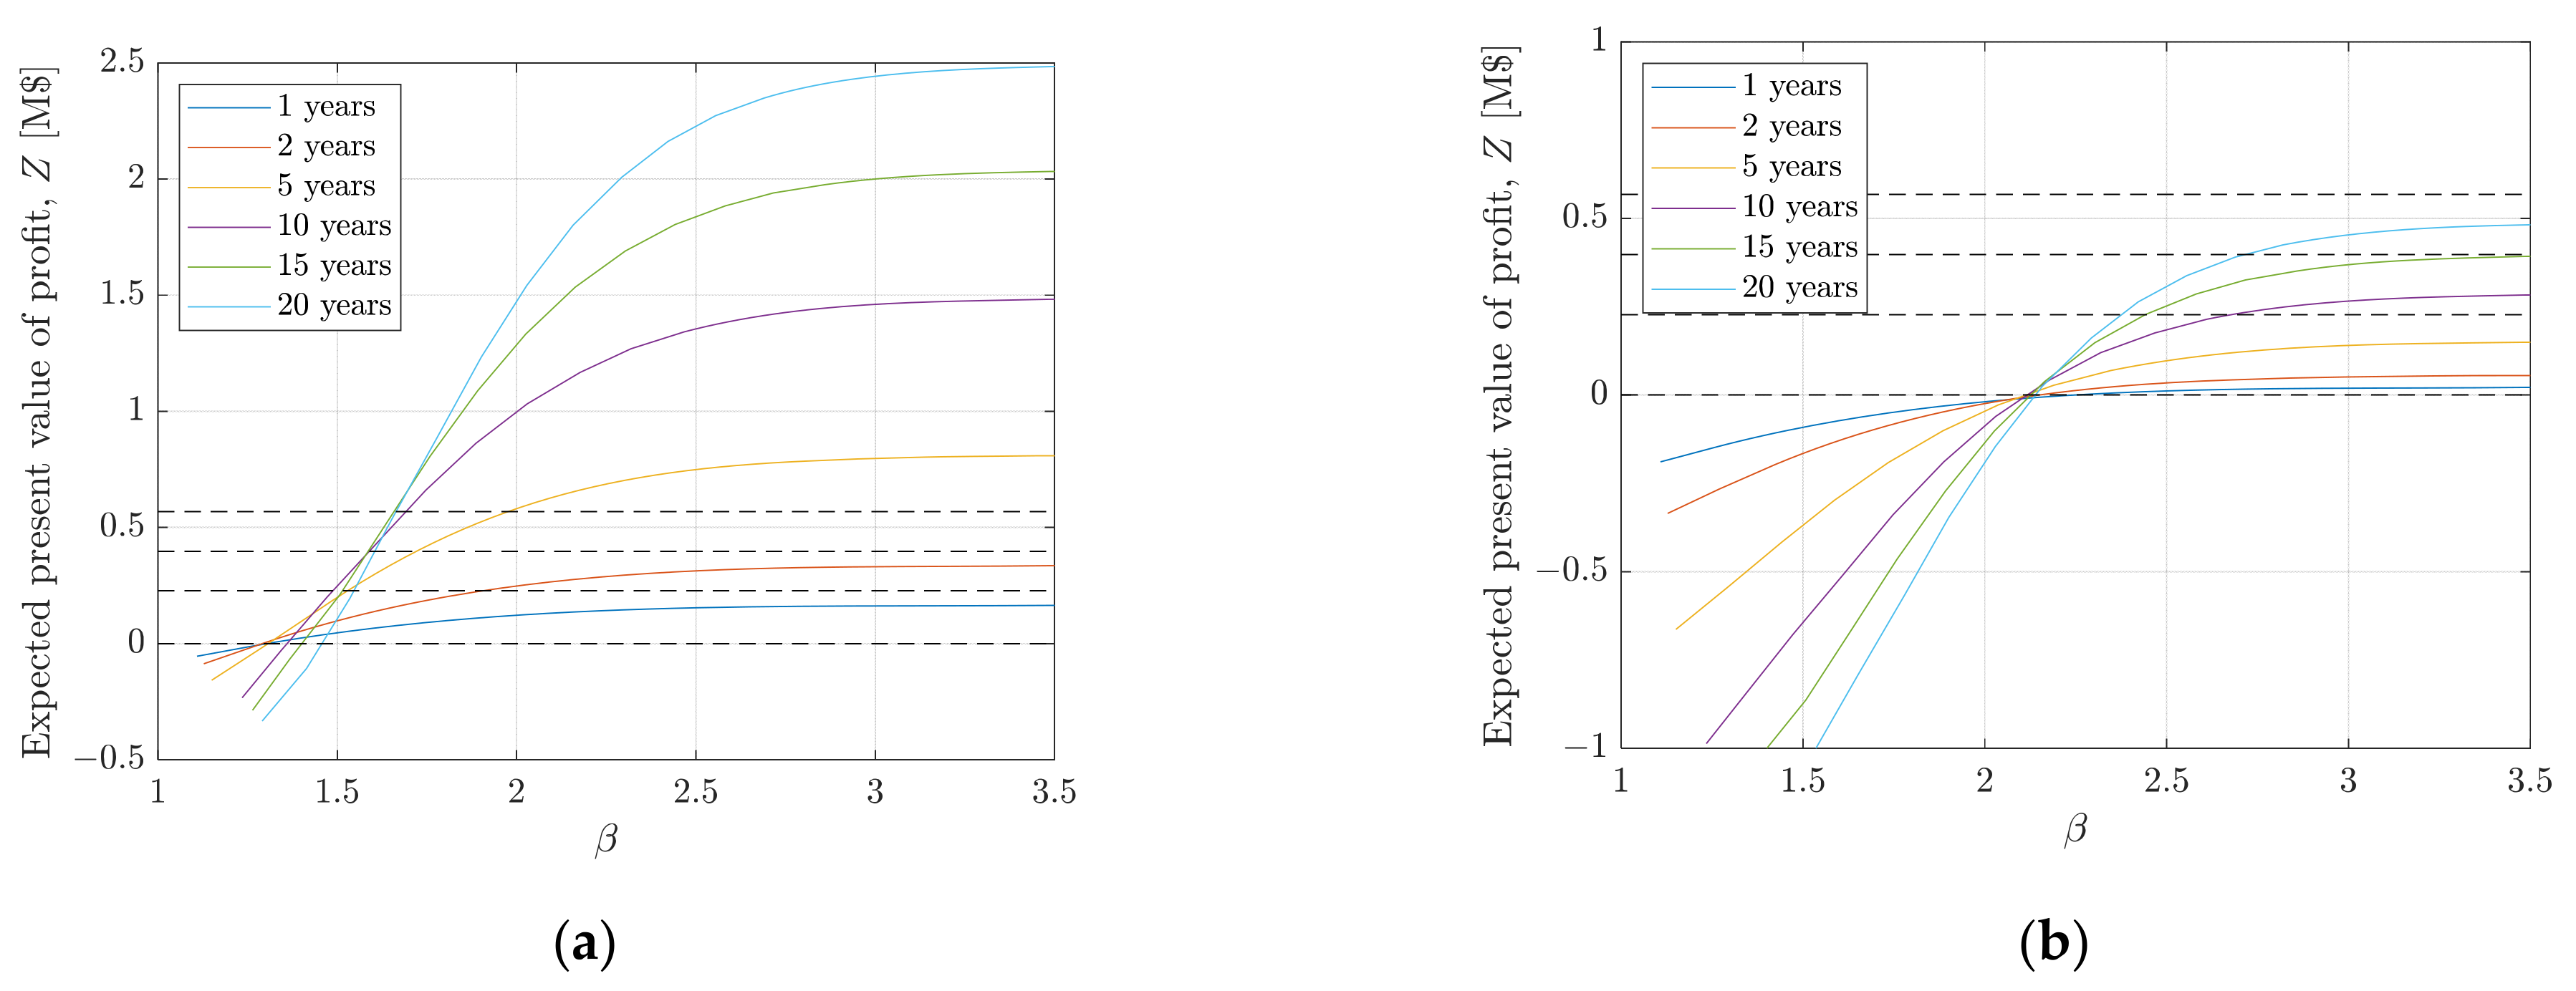
In the risk-based assessment, the probabilistic model is used, but no target for the reliability is applied. Instead, the expected present value of the profit is calculated by including directly the risk of structural failure. Figure 6a shows the expected present value of the profit as a function of the reliability index in the last year of the extended life for life extension periods 1, 2, 5, 10, 15, and 20 years for the base case economic input. Figure 6b shows the same for a power price reduced from $50/MWh to $30/MWh. The expected present value of the profit is shown for the case with no repairs. Curves for other retrofit levels can be obtained by vertical translation of the curves (as seen in Figure 3). To give a more compact representation, the costs for each of the four retrofit levels are indicated with dashed lines in Figure 6, the highest line corresponding to the high retrofit level. If the expected present value of the profit is less than the retrofit costs, that combination of life extension period, retrofit level, and reliability index is infeasible. For high reliability levels, the curves converge towards the values of in Figure 3; the expected present value of the costs when the risk of failure is not considered.
Figure 6 shows that the decrease in for a reliability index in the last year of the extended life being reduced from to is very minor, also for long life extension periods. For the high power price, the reliability index can be as low as 2.0 before an else feasible retrofit level becomes infeasible. The profit is reduced fastest for long life extension periods, but, as the initial margin is large, it generally leads to a higher expected value of the profit than the lower life extension periods, unless the reliability is very low. For the low power price, the profit margins are narrow, and for reliability indices less than 3.0, the risk of structural failure can be the tipping factor, making life extension for a given period and retrofit level infeasible.
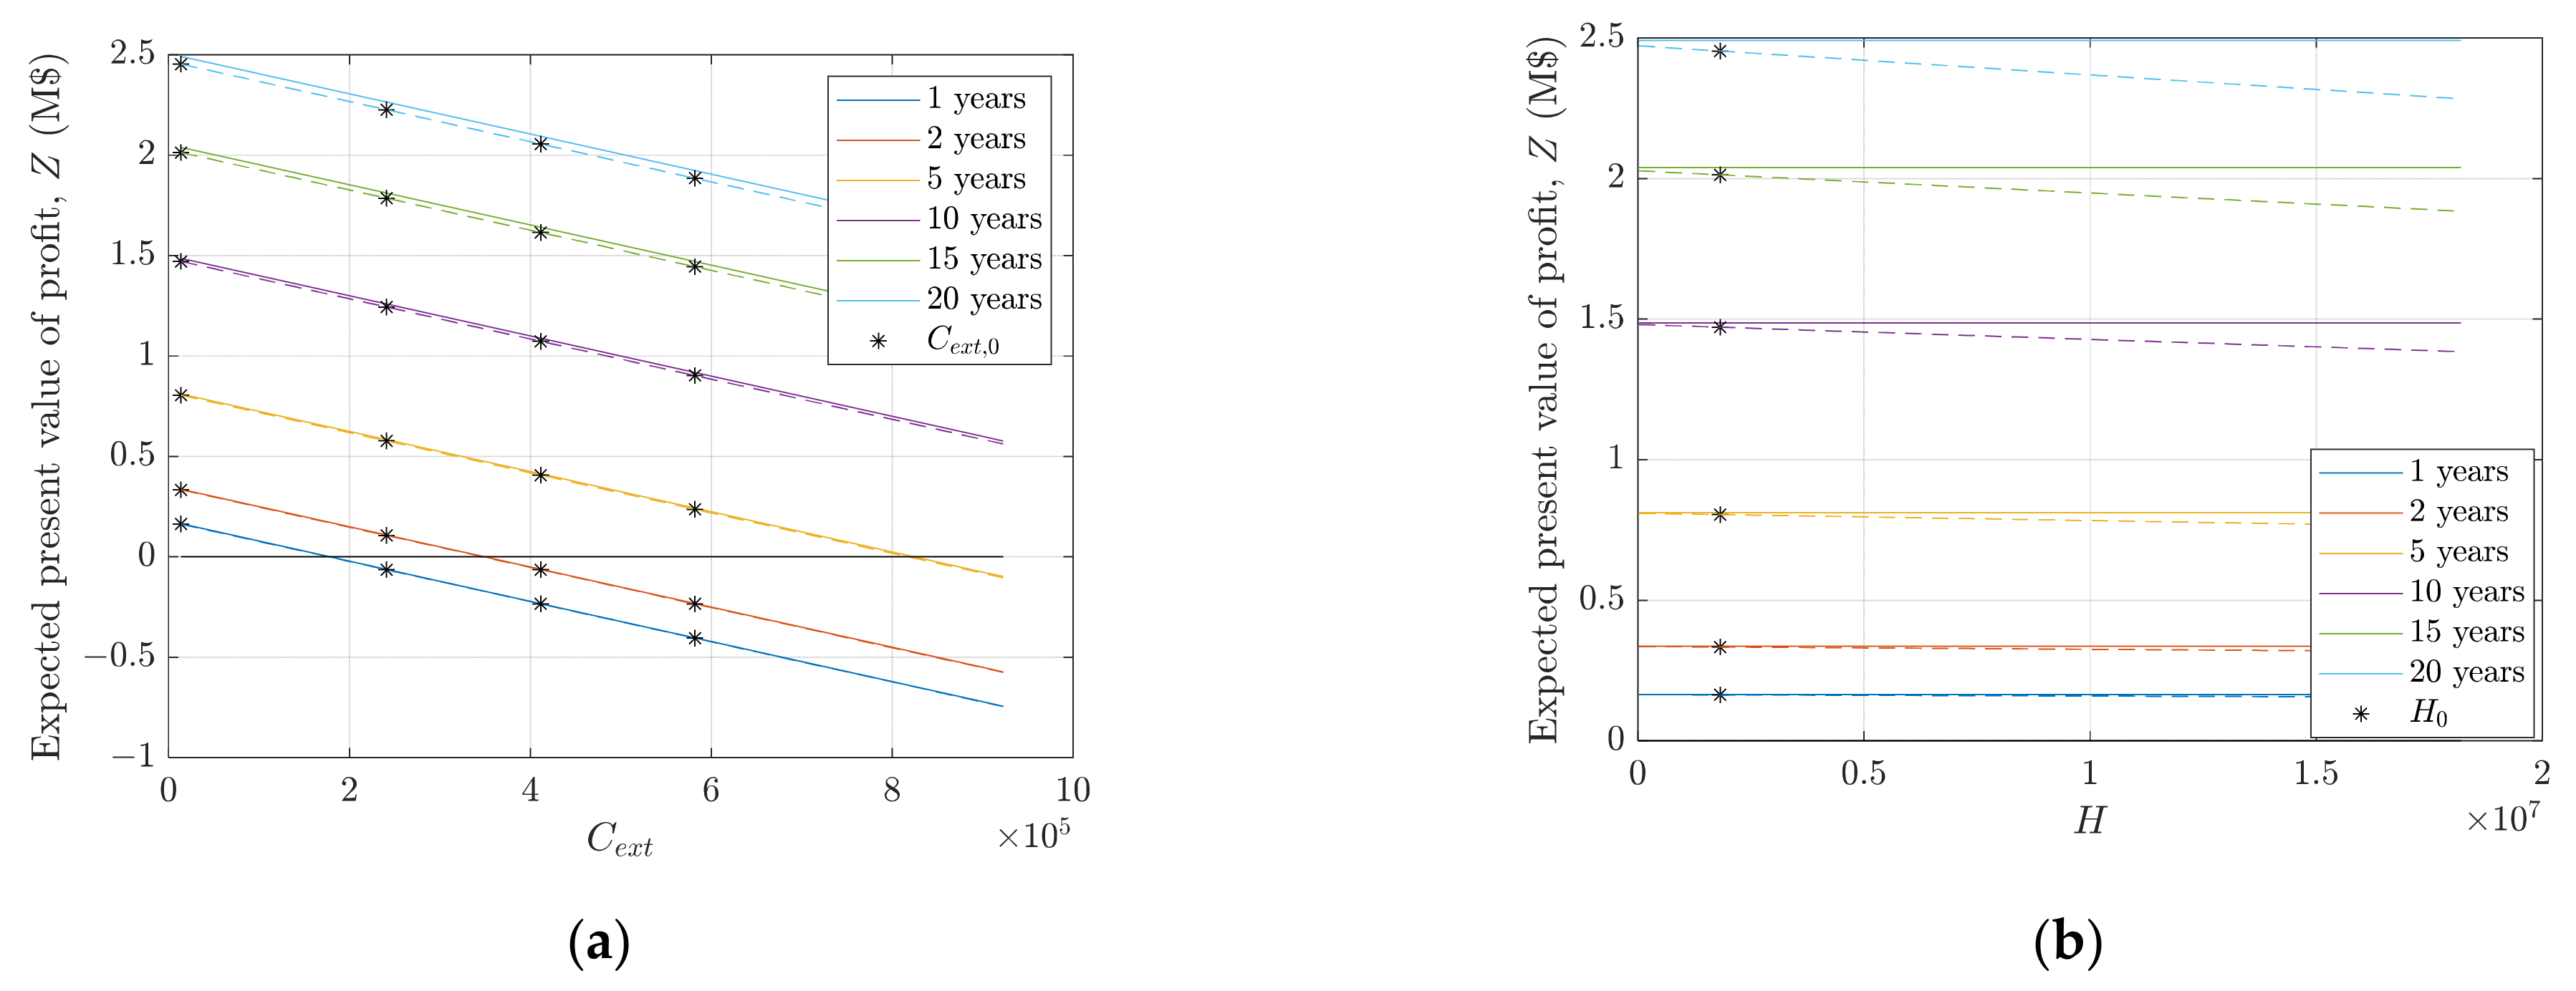
In Figure 7, each of the five economic input values is varied one at a time, while the other remains at their initial value. The varied economic input values are: (a) life extension costs , (b) failure costs , (c) annual operation and maintenance costs , (d) power price PPA, and (e) operation and maintenance costs variable proportion . The figures show the expected present value of the profit when the risk of failure is not considered (solid lines), and when it is considered (dashed lines), for a turbine with a deterministic design fatigue life of 25 years.
The life extension costs (a), annual operation and maintenance costs (c), and power price (d) affect both and . The difference between and is generally small, but it is highest for long life extension periods. The failure costs (b), and the operation and maintenance costs variable proportion (e) only affect (not ).
5. Discussion
A comparison of the outcome of the deterministic and probabilistic assessment methods showed that they were consistent when the fatigue life was 25 years. This was expected, as the partial safety factor used in the deterministic model was calibrated in [29] using the same deterministic and probabilistic models as used in this study under similar assumptions. However, the comparison in this paper shows that the deterministic model leads to nonconservative results for fatigue lives smaller than 25 years, and conservative for larger lives. For cases where the design assumptions differ from the assumptions originally used for calibration of partial safety factors, there could be variation also at 25 years of lifetime; and the models could coincide at another fatigue life. Preliminary investigations (not shown) suggest that the probabilistic and determination methods coincide at higher fatigue lives for larger mean wind speeds and lower fatigue lives for lower mean wind speed, whereas the point of coincidence is not changed for changes to the other examined environmental conditions. However, the use of other surrogate models than the model applied for calibration of partial safety factors might also influence the results.
The analyses assumed the same level of uncertainties for the original assessment and for the updated life extension assessment. For real projects, the updated assessment would often be based on operational data and possibly load monitoring. Here, it is important to remember that the 90% quantile of the turbulence intensity is to be used in deterministic assessment, in order to be consistent with the model used for calibration of partial safety factors. If load simulations are made for the measured wind speeds and turbulence intensities based on SCADA or met-mast data, or measured strains are used, this corresponds to using the full distribution of the turbulence standard deviation, as done in the probabilistic assessment. However, using this in a deterministic assessment could lead to lower reliability levels.
In reality, factors other than the fatigue life of structural components affect whether a wind turbine is fit for life extension. The required amount of retrofits will typically be larger for longer life extension periods, and even if the fatigue life was sufficient for, for example, 15 years of life extension, it could be better to extend the life for only 10 years, if large additional retrofits were required for the last 5 years of life extension.
6. Conclusions
This paper investigates how probabilistic and risk-based methods can be applied for life extension assessment; and examines how the use of these alternatives to deterministic assessment can enhance the economic feasibility of life extension by allowing for longer life extension periods.
For the considered case, it was found that the use of the probabilistic assessment method will generally lead to longer predicted fatigue lives than the deterministic analysis when the deterministic analysis results in additional fatigue life beyond the 25 years. If the target reliability is reduced from 3.3 to 3.1, it would lead to at least 15 additional years of fatigue life, if the deterministic assessment results in a lifetime of 25 years or more. The longer fatigue life gave a larger potential for profit generation.
The risk-informed model was applied to include the risk of structural failure in the feasibility assessment for a case wind farm. The risk of structural failure did not challenge the economic feasibility for life extension, unless the expected present value of the profit was already low; high life extension costs, high O&M costs, and low power price can challenge the business case, and including the risk of structural failure can at most be the tipping factor.
This analysis confirms that a reduced target reliability index of 3.1 generally does not affect the economic feasibility, and such a target could be included in standards on life extension to make life extension possible for more wind turbines for longer life extension periods.
Author Contributions
Conceptualization, methodology and software, J.S.N.; validation, L.M.-B. and R.C.; writing—original draft, J.S.N.; writing—review and editing, L.M.-B. and R.C. All authors have read and agreed to the published version of the manuscript.
Funding
The work on this paper has been supported by the Danish Energy Agency through the EUDP IEA WIND Task 42—Lifetime Extension Assessment (Grant Number 64019-0561). The support is greatly appreciated.
Institutional Review Board Statement
Not applicable.
Informed Consent Statement
Not applicable.
Data Availability Statement
Data is contained within the article.
Conflicts of Interest
The authors declare no conflict of interest.
References
- Ziegler, L.; Gonzalez, E.; Rubert, T.; Smolka, U.; Melero, J.J. Lifetime extension of onshore wind turbines: A review covering Germany, Spain, Denmark, and the UK. Renew. Sustain. Energy Rev. 2018, 82, 1261–1271. [Google Scholar] [CrossRef] [Green Version]
- Luengo, M.; Kolios, A. Failure Mode Identification and End of Life Scenarios of Offshore Wind Turbines: A Review. Energies 2015, 8, 8339–8354. [Google Scholar] [CrossRef] [Green Version]
- DNVGL-ST-0262 Lifetime Extension of Wind Turbines; DNV GL: Oslo, Norway, 2016.
- DNVGL-SE-0263 Certification of Lifetime Extension of Wind Turbines; DNV GL: Oslo, Norway, 2016.
- Ziegler, L.; Muskulus, M. Fatigue reassessment for lifetime extension of offshore wind monopile substructures. J. Phys. Conf. Ser. 2016, 753, 092010. [Google Scholar] [CrossRef]
- Bouty, C.; Schafhirt, S.; Ziegler, L. Lifetime extension for large offshore wind farms: Is it enough to reassess fatigue for selected design positions? Energy Procedia 2017, 137, 523–530. [Google Scholar] [CrossRef]
- Murcia, J.P.; Réthoré, P.-E.E.; Dimitrov, N.; Natarajan, A.; Sørensen, J.D.; Graf, P.; Kim, T. Uncertainty propagation through an aeroelastic wind turbine model using polynomial surrogates. Renew. Energy 2018, 119, 910–922. [Google Scholar] [CrossRef] [Green Version]
- Slot, R.M.M.; Sørensen, J.D.; Sudret, B.; Svenningsen, L.; Thøgersen, M.L. Surrogate model uncertainty in wind turbine reliability assessment. Renew. Energy 2019. [Google Scholar] [CrossRef] [Green Version]
- Schröder, L.; Dimitrov, N.K.; Verelst, D.R.; Sorensen, J.A. Wind turbine site-specific load estimation using artificial neural networks calibrated by means of high-fidelity load simulations. J. Phys. Conf. Ser. 2018, 1037, 062027. [Google Scholar] [CrossRef]
- Dimitrov, N. Surrogate models for parameterized representation of wake-induced loads in wind farms. Wind Energy 2019, 22, 1371–1389. [Google Scholar] [CrossRef]
- Dimitrov, N.; Natarajan, A. From SCADA to lifetime assessment and performance optimization: How to use models and machine learning to extract useful insights from limited data. J. Phys. Conf. Ser. 2019, 1222, 012032. [Google Scholar] [CrossRef]
- Natarajan, A.; Dimitrov, N.K.; William Peter, D.R.; Bergami, L.; Madsen, J.; Olesen, N.; Krogh, T.; Nielsen, J.S.; Sørensen, J.D.; Pedersen, M.; et al. Demonstration of Requirements for Life Extension of Wind Turbines Beyond Their Design Life (LifeWind): Project Final Report; No. E-0196; DTU Wind Energy: Roskilde, Denmark, 2020. [Google Scholar]
- Kazemi Amiri, A.; Kazacoks, R.; McMillan, D.; Feuchtwang, J.; Leithead, W. Farm-wide assessment of wind turbine lifetime extension using detailed tower model and actual operational history. J. Phys. Conf. Ser. 2019, 1222, 012034. [Google Scholar] [CrossRef]
- Slot, R.M.M.; Schwarte, J.; Svenningsen, L.; Sørensen, J.D.; Thøgersen, M.L. Directional fatigue accumulation in wind turbine steel towers. J. Phys. Conf. Ser. 2018, 1102, 012017. [Google Scholar] [CrossRef]
- Colone, L.; Natarajan, A.; Dimitrov, N. Impact of turbulence induced loads and wave kinematic models on fatigue reliability estimates of offshore wind turbine monopiles. Ocean Eng. 2018, 155, 295–309. [Google Scholar] [CrossRef]
- Ziegler, L.; Cosack, N.; Kolios, A.; Muskulus, M. Structural monitoring for lifetime extension of offshore wind monopiles: Verification of strain-based load extrapolation algorithm. Mar. Struct. 2019, 66, 154–163. [Google Scholar] [CrossRef]
- Smith, J.C.; Carriveau, R.; Ting, D.S.K. Inflow parameter effects on wind turbine tower cyclic loading. Wind Eng. 2014, 38, 477–488. [Google Scholar] [CrossRef]
- Mai, Q.A.; Weijtjens, W.; Devriendt, C.; Morato, P.G.; Rigo, P.; Sørensen, J.D. Prediction of remaining fatigue life of welded joints in wind turbine support structures considering strain measurement and a joint distribution of oceanographic data. Mar. Struct. 2019, 66, 307–322. [Google Scholar] [CrossRef]
- Natarajan, A.; Pedersen, T.F. Remaining Life Assessment of Offshore Wind Turbines subject to Curtailment. In Proceedings of the Twenty-Eighth (2018) International Ocean and Polar Engineering Conference, International Society of Offshore & Polar Engineers, Sapporo, Japan, 10–15 June 2018; pp. 527–532. [Google Scholar]
- Ilsted Bech, J.; Bay Hasager, C.; Bak, C. Extending the life of wind turbine blade leading edges by reducing the tip speed during extreme precipitation events. Wind Energy Sci. 2018, 3, 729–748. [Google Scholar] [CrossRef] [Green Version]
- Rubert, T.; McMillan, D.; Niewczas, P. A decision support tool to assist with lifetime extension of wind turbines. Renew. Energy 2018. [Google Scholar] [CrossRef] [Green Version]
- Carriveau, R.; Miller, L. Economic Sensitivities and Options Surrounding Wind Farm Life Extension. J. Phys. Conf. Ser. 2020, 1452, 012047. [Google Scholar] [CrossRef] [Green Version]
- Rubert, T.; McMillan, D.; Niewczas, P. The Effect of Upscaling and Performance Degradation on Onshore Wind Turbine Lifetime Extension Decision Making. J. Phys. Conf. Ser. 2017, 926, 012013. [Google Scholar] [CrossRef]
- Ziegler, L.; Lange, J.; Smolka, U.; Muskulus, M. The decision on the time to switch from lifetime extension to repowering. In Proceedings of the WindEurope Summit 2016, Hamburg, Germany, 27–29 September 2016. [Google Scholar]
- Rubert, T.; Zorzi, G.; Fusiek, G.; Niewczas, P.; McMillan, D.; McAlorum, J.; Perry, M. Wind turbine lifetime extension decision-making based on structural health monitoring. Renew. Energy 2019. [Google Scholar] [CrossRef]
- Nielsen, J.S.; Sørensen, J.D. Bayesian Estimation of Remaining Useful Life for Wind Turbine Blades. Energies 2017, 10, 664. [Google Scholar] [CrossRef] [Green Version]
- Nielsen, J.S.; Tcherniak, D.; Ulriksen, M.D. A case study on risk-based maintenance of wind turbine blades with structural health monitoring. Struct. Infrastruct. Eng. 2020. accepted. [Google Scholar] [CrossRef]
- IEC 61400-1 ed. 4 Wind Turbine Generator Systems-Part 1: Design Requirements; International Electrotechnical Commission: Geneva, Switzerland, 2019.
- Sørensen, J.D.; Toft, H.S. Safety Factors–IEC 61400-1 ed.; 4-Background Document, DTU Wind Energy-E-Report-0066(EN); DTU: Copenhagen, Denmark, 2014. [Google Scholar]
- Sørensen, J.D. Reliability assessment of wind turbines. In Safety, Reliability and Risk Analysis: Beyond the Horizon-Proceedings of the European Safety and Reliability Conference, ESREL 2013, Amsterdam, The Netherlands, 29 September–2 October 2013; Steenbergen, R.D.J.M., van Gelder, P.H.A.J.M., Miraglia, S., Vrouwenvelder, A.C.W.M., Eds.; CRC Press: Boca Raton, FL, USA, 2014. [Google Scholar]
- Sørensen, J.D.; Frandsen, S.; Tarp-Johansen, N.J. Effective turbulence models and fatigue reliability in wind farms. Probab. Eng. Mech. 2008, 23, 531–538. [Google Scholar] [CrossRef]
- ISO2394 General Principles on Reliability for Structures; International Organization for Standardization: Geneva, Switzerland, 2015.
- Rackwitz, R. Optimization—The basis of code-making and reliability verification. Struct. Saf. 2000, 22, 27–60. [Google Scholar] [CrossRef]
- Fischer, K.; Viljoen, C.; Köhler, J.; Faber, M.H. Optimal and acceptable reliabilities for structural design. Struct. Saf. 2019, 76, 149–161. [Google Scholar] [CrossRef]
- Nielsen, J.S.; Dimitrov, N.K.; Sørensen, J.D. Optimal decision making for life extension for wind turbines. In Proceedings of the 13th International Conference on Applications of Statistics and Probability in Civil Engineering, ICASP 2019, Seoul, Korea, 26–30 May 2019. [Google Scholar]
- Nielsen, J.S.; Sørensen, J.D. Risk-based derivation of target reliability levels for life extension of wind turbine structural components. Wind Energy 2021, 1–18. [Google Scholar] [CrossRef]
- Rubert, T.; Niewczas, P.; McMillan, D. Life Extension for Wind Turbine Structures and Foundations. In Proceedings of the International Conference on Offshore Renewable Energy, Glasgow, Scotland, UK, 12–14 September 2016; pp. 1–12. [Google Scholar]
Figure 1.
Overview of assessment methods.

Figure 2.
Illustration of how the benefits and costs are distributed in time in the extended life: (a) when there is no failure in the extended life; (b) when there is a failure in year seven.
Figure 2.
Illustration of how the benefits and costs are distributed in time in the extended life: (a) when there is no failure in the extended life; (b) when there is a failure in year seven.

Figure 3.
Expected present value of the profit as a function of life extension period (when the risk of failure is not included) for various levels of retrofits for: (a) power purchase agreement (PPA) = 50; (b) PPA = 30.
Figure 3.
Expected present value of the profit as a function of life extension period (when the risk of failure is not included) for various levels of retrofits for: (a) power purchase agreement (PPA) = 50; (b) PPA = 30.

Figure 4.
Fatigue life from probabilistic assessment for as a function of the fatigue life from the deterministic assessment for variations of input parameters: : design parameter, : reference turbulence intensity, : annual number of load cycles, and : 10-min mean wind speed at hub height.
Figure 4.
Fatigue life from probabilistic assessment for as a function of the fatigue life from the deterministic assessment for variations of input parameters: : design parameter, : reference turbulence intensity, : annual number of load cycles, and : 10-min mean wind speed at hub height.

Figure 5.
Effect of deterministic fatigue life on: (a) fatigue life from probabilistic assessment for and found by variation of the design parameter z; (b) reliability index in last year of the extended life for life extension periods: 1, 2, 5, 10, 15, and 20 years. The scatter for high reliability indices reflects the uncertainty related to the use of Monte Carlo simulations.

Figure 6.
Expected present value of the profit as a function of the reliability index in the last year of the extended life, for life extension periods: 1, 2, 5, 10, 15, and 20 years for: (a) PPA = 50; (b) PPA = 30. The dashed lines correspond to the costs of retrofits for (from the bottom): no repairs, low level, medium level, and high level.

Figure 7.
Expected present value of profit as a function of: (a) life extension costs ; (b) failure costs ; (c) annual operation and maintenance costs ; (d) power price PPA; (e) operation and maintenance costs variable proportion . The stars indicate the base case values. For (a), the stars indicate for the four retrofit levels. The solid lines show and the dashed lines show .


Table 1.
Expected present value of the profit for four levels of retrofits: no repairs, low level, medium level, and high level for life extension periods equal to the assessed remaining fatigue life using the deterministic analysis method, and for the probabilistic analysis method for target reliability levels and .
| Analysis Method | Remaining Fatigue Life/Life Extension Period (Years) | Expected Present Value of Profit (M$) | |||
|---|---|---|---|---|---|
| No Repairs | Low Level | Medium Level | High Level | ||
| Deterministic | 1 | 0.165 | −0.063 | −0.233 | −0.404 |
| Prob. | 1.8 | 0.300 | 0.072 | −0.098 | −0.268 |
| Prob. | >20.0 | 2.492 | 2.264 | 2.094 | 1.923 |
| Deterministic | 2 | 0.336 | 0.109 | −0.062 | −0.232 |
| Prob. | 3.5 | 0.574 | 0.347 | 0.177 | 0.006 |
| Prob. | >20.0 | 2.492 | 2.264 | 2.094 | 1.923 |
| Deterministic | 5 | 0.811 | 0.584 | 0.413 | 0.243 |
| Prob. | 9.2 | 1.381 | 1.154 | 0.984 | 0.813 |
| Prob. | >20.0 | 2.492 | 2.264 | 2.094 | 1.923 |
| Deterministic | 10 | 1.486 | 1.259 | 1.088 | 0.918 |
| Prob. | 19.3 | 2.431 | 2.204 | 2.034 | 1.863 |
| Prob. | >20.0 | 2.492 | 2.264 | 2.094 | 1.923 |
| Deterministic | 15 | 2.039 | 1.812 | 1.641 | 1.471 |
| Prob. | >20.0 | 2.492 | 2.264 | 2.094 | 1.923 |
| Prob. | >20.0 | 2.492 | 2.264 | 2.094 | 1.923 |
| Deterministic | 20 | 2.492 | 2.264 | 2.094 | 1.923 |
| Prob. | >20.0 | 2.492 | 2.264 | 2.094 | 1.923 |
| Prob. | >20.0 | 2.492 | 2.264 | 2.094 | 1.923 |
Publisher’s Note: MDPI stays neutral with regard to jurisdictional claims in published maps and institutional affiliations. |
© 2021 by the authors. Licensee MDPI, Basel, Switzerland. This article is an open access article distributed under the terms and conditions of the Creative Commons Attribution (CC BY) license (http://creativecommons.org/licenses/by/4.0/).
Share and Cite
MDPI and ACS Style
Nielsen, J.S.; Miller-Branovacki, L.; Carriveau, R. Probabilistic and Risk-Informed Life Extension Assessment of Wind Turbine Structural Components. Energies 2021, 14, 821. https://doi.org/10.3390/en14040821
AMA Style
Nielsen JS, Miller-Branovacki L, Carriveau R. Probabilistic and Risk-Informed Life Extension Assessment of Wind Turbine Structural Components. Energies. 2021; 14(4):821. https://doi.org/10.3390/en14040821
Chicago/Turabian StyleNielsen, Jannie Sønderkær, Lindsay Miller-Branovacki, and Rupp Carriveau. 2021. "Probabilistic and Risk-Informed Life Extension Assessment of Wind Turbine Structural Components" Energies 14, no. 4: 821. https://doi.org/10.3390/en14040821
Note that from the first issue of 2016, this journal uses article numbers instead of page numbers. See further details here.