Article

Challenges in Treatment of Digestate Liquid Fraction from Biogas Plant. Performance of Nitrogen Removal and Microbial Activity in Activated Sludge Process

by
Aleksandra Chuda
and
Krzysztof Ziemiński
*
Department of Environmental Biotechnology, Lodz University of Technology, Wolczanska 171/173 Street, 90-924 Lodz, Poland
*
Author to whom correspondence should be addressed.
Energies 2021, 14(21), 7321; https://doi.org/10.3390/en14217321
Submission received: 23 September 2021 / Revised: 28 October 2021 / Accepted: 1 November 2021 / Published: 4 November 2021
(This article belongs to the Topic Anaerobic Digestion Processes)

Abstract

:
Even thoughdigestate, which is continually generated in anaerobic digestion process, can only be used as fertilizer during the growing season, digestate treatment is still a critical, environmental problem. That is why the present work aims to develop a method to manage digestate in agricultural biogas plant in periods when its use as fertilizer is not possible. A lab-scale system for the biological treatment of the digestate liquid fraction using the activated sludge method with a separate denitrification chamber was constructed and tested. The nitrogen load that was added tothe digestate liquid fraction accounted for 78.53% of the total nitrogen load fed into the reactor. External carbon sources, such as acetic acid, as well as flume water and molasses, i.e., wastewater and by-products from a sugar factory, were used to support the denitrification process. The best results were obtained using an acetic acid and COD (Chemical Oxygen Demand)/NO3–N (Nitrate Nitrogen) ratio of 7.5. The removal efficiency of TN (Total Nitrogen), NH4–N (Ammonia Nitrogen) and COD was 83.73%, 99.94%, 86.26%, respectively. It was interesting to see results obtained that were similar to those obtained when using flume water and COD/NO3–N at a ratio of 8.7. This indicates that flume water can be used as an alternative carbon source to intensify biological nitrogen removal from digestate.

1. Introduction

The increase in organic waste generated in food industry plants observed in recent years and the emphasis on sustainability has significantly contributed to the growing interest in anaerobic digestion as a method for waste management. Apart from biogas, digestate is generated as the main by-product of anaerobic digestion (AD) [1,2,3]. A 1 MW biogas plant produces about 20,000–30,000 m3 of digestate per year [4]. Digestate, which constitutes 90–95% of the substrate volume fed into a reactor, has become a major bottleneck in the development of the methane fermentation industry [1]. Many industrial biogas plants struggle with digestate processing on account of its large amounts. digestate is often used in land spreading as a fertilizer with a high nutrient content. Digestate, which is continually generated through the AD process, can only be used as a fertilizer during the growing season or during vegetative growth in order to avoid nutrient infiltration into the groundwater, soil acidification as well as the eutrophication of surface waters [2,5]. For this reason, biogas plants must have proper facilities with enough storage capacity for a 3- to 6-month period. This generates problems for biogas plants, as ammonia nitrogen is emitted during storage [6]. Therefore, alternative methods for digestate treatment, in particular nitrogen removal, are still being sought after. The first step in such a process is typically mechanical separation into a solid and liquid fraction [5]. Separation technologies allow better digestate management but do not change the total amount of nitrogen in the liquid fraction [7,8]. The treatment of the digestate liquid fraction can be performed by ammonia stripping, membrane filtration, evapo-concentration, or drying [5,6,9]. However, due to the moderate effectiveness and high costs of these methods, which can range between 5.4–7.0 EUR/m3 of digestate for membrane drying and stripping, their full-scale applications are limited [7,9]. This is the reason why if the agricultural management of digestate is not possible, then its biological treatment, which is regarded as the most economical process for nitrogen removal, may be a rational solution [7,10]. Currently, researchers are attracted to technologies that can be used for anaerobic ammonium oxidizing (anammox), which enables the treatment of wastewater with a high NH4–N content [11]. However, the problems associated with the fragile resistance of anammox bacteria to environmental changes, the low growth rate of these bacteria, and limits placed on maximum nitrogen removal efficiency constitute major obstacles to the wide range application for these processes [12]. For this reason, the most commonly used biological method in industrial wastewater treatment plants is still a conventional activated sludge process that involves autotrophic nitrification and heterotrophic denitrification [13,14,15]. The stability of this process and the treatment outcome depend on the microbial community structure, the amount of functional groups belong to the activated sludge (denitrifiers, nitrifiers, heterotrophic microorganisms), their activity (Nitrate Utilization Rate—NUR, Ammonia Utilization Rate—AUR, Oxygen Utilization Rate—OUR), and the ratio of AOB (Ammonia–Oxidizing Bacteria) to NOB (Nitrite–Oxidizing Bacteria) [14,16,17], while the microbial activity is influenced by operating parameters, such as pH, temperature, and oxygen concentration as well as the nitrogen and COD loading rate and COD/TN ratio in the influent [1,13,15,18]. The increase in biological nitrogen removal efficiency in wastewater with a low COD/TN ratio can be achieved by adding an external carbon source [18]. The most frequently used carbon sources are easily biodegradable organics, such as ethanol [19,20], methanol [20,21,22] and acetic acid [15,20,21,23]. However, due to their high prices, the extensive use of these carbon sources on an industrial scale significantly increases operating costs [18,20]. Hence, many researchers are currently investigating the use of various types of organic waste from the agro–food industry as alternative external carbon sources [23,24,25,26,27]. This may allow them to not only enhance denitrification but to also reduce the amount of industrial waste that is subject to treatment [24]. Several factors have to be considered when selecting a carbon source, including the costs, denitrification rate, degree of utilization, sludge production, and adaptation time of the activated sludge [19,20].
The present study attempted to biologically treat the digestate liquid fraction in a conventional activated sludge system to help better manage digestate during periods when it cannot be used as a fertilizer. This was verified using flume water and molasses, so the industrial wastewater and the by–products generated in sugar factories can be used as alternative carbon sources to intensify biological nitrogen removal from digestate. The aim was to create a system where organic waste would be converted into energy in an anaerobic digestion process and where digestate can be biologically treated in an on–site wastewater treatment plant. These results can bring new ideas to digestate management practices.

2. Materials and Methods

2.1. Substrates Characteristics

2.1.1. Digestate

The liquid fraction of the digestate obtained after its mechanical separation in the UCD 305–00–32 decanter centrifuge (GEA, Warsaw, Poland) was used for test purposes. The digestate was taken from an agricultural biogas plant where sugar beet pulp (SBP) is a substrate for biogas production. The biogas plant is located on the property of the sugar factory belonging to the Südzucker company. The liquid fraction was stored at 4 °C. Its chemical composition is summarised in Table 1.

2.1.2. Activated Sludge

The activated sludge was obtained from an industrial sugar wastewater treatment plant (WWTP) that uses the activated sludge method in a system with preliminary denitrification. The wastewater treatment plant was located on the premises of the Südzucker sugar factory.

2.1.3. External Carbon Sources

Various external carbon sources were subject to tests. Their chemical characteristics are summarised in Table 1.

Acetic Acid

In the study, 80% acetic acid was used with a COD concentration of 913 g O2/L, which is an easily biodegradable, conventional carbon source that is frequently used to intensify the denitrification process [18,21,24].

Flume Water

The flume water used for hydraulic transport and sugar beet washing was tested. It was supplied by the Südzucker sugar factory. During a sugar campaign, about 4 m3 of flume water is produced per 1 ton of sugar beet, which accounts for about 72% of the total wastewater volume that is generated in the sugar factory [28].

Molasses

Thick, dark brown molasses syrup that was obtained after centrifuging crystallized sugar from concentrated beet juice was used. The molasses was also supplied by the Südzucker sugar factory. The processing of 100 kg of beet produces approx. 2.5–4 kg of molasses.

2.2. Experimantal Set-Up

The research on the biodegradation of the digestate liquid fraction was conducted in cooperation with the biogas plant and wastewater treatment plant located next to the Südzucker sugar factory. Studies were conducted under lab–scale conditions using the activated sludge method in three parallel systems (Figure 1). Each of them reflected the layout of the wastewater treatment plant in the sugar factory and consisted of a denitrification chamber with a volume of 0.013 m3 and a diameter of 0.24 m, a nitrification chamber with a volume of 0.033 m3 and a diameter of 0.39 m, and a secondary settling tank with a volume of 0.002 m3 and a diameter of 0.1 m. Individual chambers were cylindrical in shape. A mechanical stirrer was placed in the denitrification chamber, allowing the chamber content to mix at an intensity of 200 rpm. The nitrification chamber was aerated using Akwatech 50 PG membrane diffusers connected to a HIBLOW HP–80 air blower. The dissolved oxygen (DO) concentration in the nitrification chamber was maintained at 3.0 ± 0.2 mg O2/L. The rate of internal recirculation between the nitrification and the denitrification chambers was 500% in relation to the inflow rate into the system. This was determined in previous unpublished studies by using Equation (1) [29]:
R = [ ( NH 3 N ) o ( NH 3 N ) e ( NO 3 N ) e ] 1 ,
where R—rate of internal recirculation;
(NH3–N)o—NH3–N concentration in the influent (g NH3–N/m3);
(NH3–N)e—NH3–N concentration in the effluent (g NH3–N/m3);
(NO3–N)e—NO3–N concentration in the effluent (g NO3–N/m3).
Influents containing the digestate liquid fraction, external carbon source, and treated wastewater were fed into the denitrification chambers. The aim of adding treated wastewater was to maintain the nitrogen loading rate at the assumed level of 21 mg N/g MLVSS d. The nitrogen load added to digestate accounted for 78.53 ± 8.81% of the total nitrogen load fed into denitrification chambers. Three study stages were conducted that differed in terms of the type of external carbon source that was used. In the first stage, including series DAA1, DAA2, and DAA3, the external carbon source was acetic acid; in the second stage in series DFW1, DFW2, and DFW3, flume water was used as the carbon source; and in the third stage in series DMS1, DMS2, and DMS3, molasses was used as the carbon source. The test series differed in terms of the COD/NO3–N ratio, and each series lasted 30 days. The composition of the influents was analysed using the methods described in Section 2.3. on each day during each series. Each influent sample was taken in triplicate. The data shown in Table 2 are the mean of the 90 results obtained in the given series. The study began with series DAA1, DFW1, and DMS1, in which the COD/NO3–N ratio was determined from the Equation 2.86/(1 − YHD) [30,31] by taking into account the heterotrophic anoxic growth yield (YHD) that is equal to 0.45 for acetic acid as a carbon source [32], 0.53 for flume water (wastewater) [33], and 0.57 for molasses (glucose) [32]. The nitrate concentration to be denitrified was calculated from the equation described in [34]. The demand for the external carbon source necessary to reduce nitrate nitrogen may be higher than the values calculated from the equation [25]. Therefore, in subsequent series the COD/NO3–N ratio, and thus the COD/TN ratio, was gradually increased until a stable course of the denitrification process was obtained during the research. The COD/NO3–N and COD/TN ratios used in the studies are presented in Table 2. The adaptation period for the activated sludge to laboratory conditions and carbon sources in series DAA1, DFW1, and DMS1 lasted 30 days. During the adaptation period, the load of the organic matter and nitrogen was increased by approximately 33% every 10 days. For the first 10 days, the average COD loading rate was at 60.17 ± 10.15 mg COD/g MLVSS d, and the average, total nitrogen loading rate was at 6.65 ± 0.76 mg N/g MLVSS d. After the first series of tests, for 14 days, the activated sludge was adapted to higher COD/NO3–N ratios, and thus to the changed composition of the influents in series DAA2, DFW2, and DMS2 and next in DAA3, DFW3, and DMS3. In order to maintain a constant concentration of mixed liquor suspended solids (MLSS) at 5.0 ± 0.4 g/L in the reactor, 120% external recirculation was applied between the secondary settling tank and the denitrification chamber. The mixed liquor volatile suspended solids (MLVSS) were at 3.0 ± 0.5 g/L, and the sludge age was at 30.00 ± 0.10 days. The temperature in the reactors was 25 ± 1.56 °C. The influence of the type of external carbon source and the COD/NO3–N ratio on the treatment efficiency of the digestate liquid fraction is shown in Figure 2.

2.3. Analytical Methods

The concentrations of COD, TN, NH4–N, total phosphorus (TP), and nitrate and nitrite nitrogen (NO3–N, NO2–N) were measured using HACH tests (Hach–Lange, DR 6000 UV–VIS Spectrophotometer). The analytical procedures adopted by Hach Lange GmbH (Düsseldorf, Germany) followed the Standard Methods [35]. The concentration of the biochemical oxygen demand (BOD5) was analysed using the OxiTop system, WTW. The COD fractional composition was determined based on the ASM1 model [36] as well as on the methodology presented by [37]. According to these methods, soluble COD and biodegradable COD can be defined as:
SCOD/CODmf—soluble COD from raw wastewater filtrated after coagulation with zinc chloride using 0.45 µm membrane filters;
BDCOD—biodegradable fraction of COD; BDCOD = BODtot/(1 −fBOD) with the correction factor fBOD = 0.15;
BODtot—total Biochemical Oxygen Demand assumed as 1.47 × BOD5.
The concentrations of VSS, MLSS, and MLVSS in the reactors were determined following the procedures described in the Standard Methods [35]. The pH was measured with a CPI–505 pH meter (ELMENTRON, Poland). The concentration of oxygen in the reactor was measured using a CO–411 oxygen meter (ELMETRON, Poland).

2.4. Batch Tests (NUR, AUR, OUR)

The activity of the functional groups of the activated sludge (denitrifiers, nitrifiers, heterotrophic microorganisms) was determined by performing biochemical tests on the 30th day of each series: the specific denitrification rate (SNUR test–Specific Nitrate Utilization Rate), the specific nitrification rate (SAUR test–Specific Ammonia Utilization Rate), and the specific oxygen utilization rate (SOUR test–Specific Oxygen Utilization Rate). The methodology described by [17,30,38] was used in the tests.
The volumetric denitrification rates rD and specific denitrification rates of the SNUR were calculated from Equations (2) and (3), respectively:
r D   =   NO x N / τ   [ mg   N / L   h ] ,
SNUR = rD/XV [mg N/g MLVSS h],
where NOx–N = NO3–N + 0.6 NO2–N—the sum of nitrate and so-called nitrite–nitrate equivalent, which is also the sum of oxygenated nitrogen compounds, which is reduced to gaseous nitrogen (mg N/L);
τ   —time of test (h);
XV—volatile activated sludge concentration (g MLVSS/L).
The volumetric nitrification rate rN (mg NH4–N/L h) was calculated from the slope of the resulting ammonia utilization curve. The specific nitrification rate SAUR was calculated from Equation (4) by dividing the volumetric nitrification rate by the sludge concentration XV:
SAUR = rN/XV [mg N/g MLVSS h],
The volumetric total oxygen utilization rate rO2,tot(mg O2/L h) was calculated from the slope of the resulting oxygen utilization curve. The specific oxygen utilization rate SOUR was obtained by Equation (5) by dividing the rO2,tot by the concentration of VSS in the batch experiment:
SOUR = rO2,tot/XV [mg O2/g MLVSS h],
The specific oxygen utilization rate in the presence of NaClO3 and ATU (the nitrification inhibitors) is an indicator of heterotrophic oxygen activity.

2.5. Molecular Studies

The activated sludge in the reactors was characterised by determining the total amount of bacteria, the amount of nitrifying bacteria, including AOB and NOB bacteria, and the growth balance between AOB and NOB as well as the number of denitrifying bacteria.
Genomic DNA from the activated sludge samples collected directly from separately working denitrification and nitrification chambers on the 30th day of each series was isolated using the Genomic Mini AX Bacteria kit (A&A Biotechnology) in accordance with the manufacturer’s protocols. A Real–Time PCR reaction was set up for each sample of the isolated DNA. Target genes were 16SrDNA (corresponding to the total bacterial DNA) and the amoA gene (AOB characteristic gene), nxrA gene (NOB characteristic gene), and the nirS and nirK genes (two nitrite reductase genes nirS and nirK characteristic of denitrifying bacteria). The Real–Time PCR reactions were performed in a Stratagene Mx3000P thermocycler (Agilent Technologies) using SYBR Green dye as the fluorochrome (A&A Biotechnology). Prior to setting up the reaction, the isolated DNA samples were diluted to 10 ng/μL; thus, a total of 10 ng of each DNA extract was used as the template in each reaction mixture. The oligonucleotide sequences of the primers, the composition of the reaction mixtures, and the description of the PCR programs are shown in Table 3. For each target gene, a melting curve was determined by measuring the fluorescence at each temperature (65 °C -> 95 °C). The efficiencies of the real–time PCR reactions in the amplification of the analysed genes were from 90 to 100%, and the correlation coefficient of the determined curves was higher than 0.997. The results of the analyses are shown in Figure 3.

2.6. Statistics

In order to verify the difference between the COD, TN, and NH4–N removal efficiencies and the NO3–N concentrations for different COD/NO3–N ratios, an Anova test followed by Tukey’s post hoc test was conducted. For all of the tests, the differences were only considered significant if p < 0.05. All statistical analyses were conducted using Statistica 12 (StatSoft, Krakow, Poland).

3. Results and Discussion

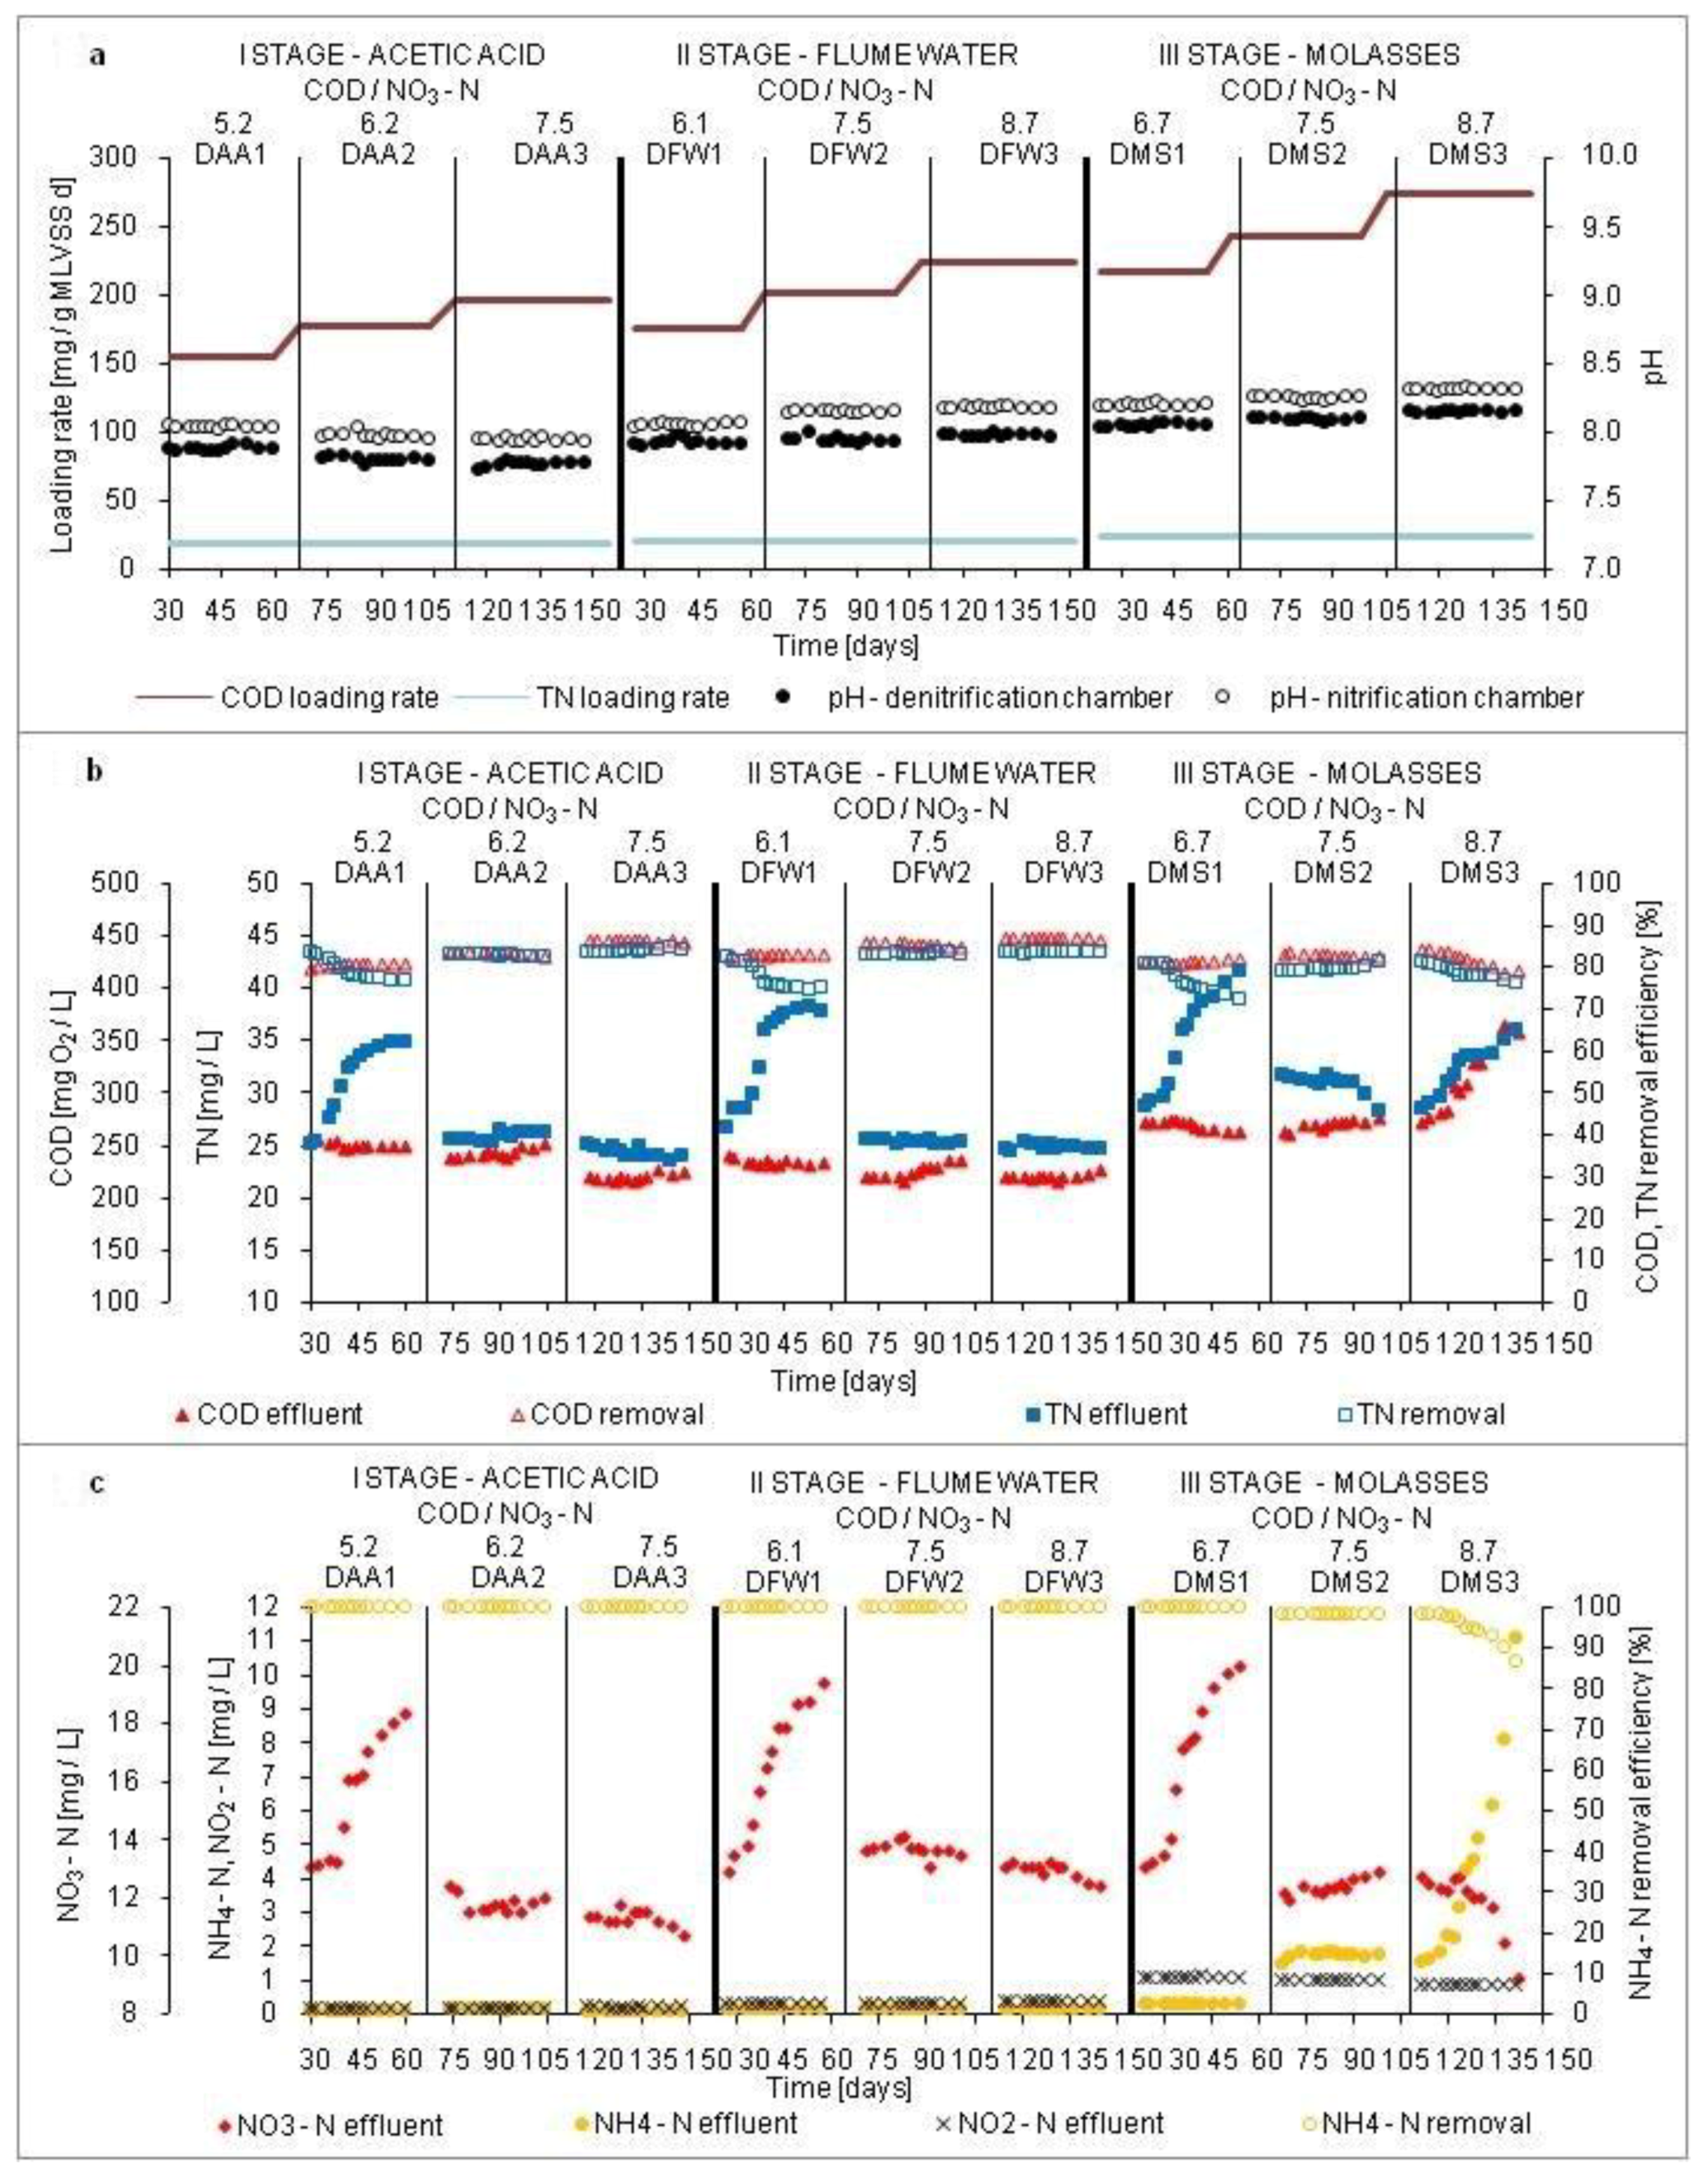
3.1. Treatment Efficiency of the Digestate Liquid Fraction

The treatment efficiency results of the digestate liquid fraction in a conventional activated sludge system with the addition of external carbon sources are presented in Figure 2a–c. The studies were conducted with a constant TN loading rate, which was 20.49 ± 2.31 mg N/g MLVSS d (Figure 2a), while the COD loading rate was dependent on the type of carbon source and rose when the COD/NO3–N ratio increased (Figure 2a). The pH in the biological reactors in the DAA and DFW series was within the optimal range for biological wastewater treatment, which is equal to 6.0–8.0 in the denitrification chamber and to 7.5–8.5 in the nitrification chamber [43]. The pH in the denitrification chambers in the DMS series slightly exceeded the values demonstrated by Meng et al. [43], standing at 8.09 ± 0.05 (Figure 2a). Analysing the results presented in Figure 2b,c, it was observed that the COD/NO3–N ratio and the type of carbon source had a significant impact on the treatment efficiency of the digestate liquid fraction. The best results were obtained in the DAA3 series, in which acetic acid was used as a conventional carbon source and where the COD/NO3–N ratio was 7.5. Comparable results were achieved in the DFW3 series when using the flume water as a carbon source when the COD/NO3–N ratio was 8.7. The removal efficiency of TN and COD in the DAA3 series was 83.73 ± 0.34% and 86.26 ± 0.21%, respectively, and in DFW3 series at 83.35 ± 0.18% and 86.83 ± 0.15% (Figure 2b). The mean concentrations of NO3–N in the effluent in the DAA3 and DFW3 series remained stable at 11.28 ± 0.26 mg/L and 12.90 ± 0.25 mg/L, respectively (Figure 2c). These values were significantly lower (p < 0.05) than those obtained in the DAA1 and DFW1 series at the COD/NO3–N ratios equal to 5.2 and 6.1, respectively. Nitrate concentrations in the effluent in DAA1 and DFW1 series reached 18.30 ± 0.65 and 19.40 ± 0.79 mg/L. The mean TN and COD removal efficiencies in the DAA1 series were 79.16 ± 2.42% and 80.31 ± 0.28%, respectively, and in DFW1 series, they were 77.39 ± 2.94 and 82.71 ± 0.24%. Analysing Figure 2c, it can be noted that in all of the test series in which acetic acid and flume water were used as the carbon sources, the NH4–N removal efficiency averaged at 99.89 ± 0.13%. Changes in the COD/NO3–N ratio in the range of 5.2–7.5 and 6.1–8.7, respectively, did not significantly (p > 0.05) affect the NH4–N concentrations in the effluents, which in the DAA series, averaged at 0.09 ± 0.02 mg/L, and in DFW series, averaged at 0.15 ± 0.03 mg/L. The NO2–N concentrations were 0.16 ± 0.03 mg/L and 0.32 ± 0.03 mg/L, respectively. The lowest treatment efficiency of the digestate liquid fraction was determined in the DMS series using molasses as an external carbon source. In the DMS3 series, in which the COD/NO3–N ratio was identical to that of DFW3 series and amounted to 8.7, lower COD and TN removal efficiencies equal to 81.67 ± 1.86% and 78.46 ± 1.59%, respectively, were obtained (Figure 2b). Subjecting the results presented in Figure 2c to an analysis, it was observed that in the DMS3 series, the concentration of NH4–N in the effluent increased to 11.10 ± 0.67 mg/L, and thus its removal efficiency significantly (p < 0.05) decreased to 86.56 ± 0.89%. In contrast, in the DMS1 series in which the COD/NO3–N ratio was 6.7, the NH4–N removal efficiency was higher and amounted to 99.69 ± 0.56%. The NH4–N concentration in the effluent was 0.27 ± 0.08 mg/L, and NO2–N was 1.05 ± 0.24 mg/L. When conducting the process of synthetic wastewater treatment with glucose as a carbon source in an Integrated Fixed–Film Activated Sludge reactor, Machat et al. [44] also found that an increase in the C (carbon)/N (nitrogen) ratio contributed to a reduction in the nitrification process efficiency. The authors found that the NH4–N removal efficiency was equal to 96.54 ± 2.44% when the C/N ratio was 10. Increasing the C/N ratio to 12 resulted in the reduction of the NH4–N removal efficiency to 88.20 ± 10.84%.
No literature data were found on the biological treatment of the digestate liquid fraction in a conventional activated sludge system with a separate denitrification chamber. However, Dosta et al. [45], when carrying out a treatment process for centrifuged reject water from an anaerobic digester of a WWTP with the addition of acetate as a carbon source in a lab–scale SBR (Sequencing Batch Reactor) seeded with the activated sludge, obtained a nitrogen removal efficiency of almost 100%. Obaja et al. [15], using acetic acid as a carbon source during the treatment of the liquid fraction after centrifuging digested piggery wastewater in a lab–scale SBR reactor filled with activated sludge, obtained NH4–N, NO3–N, and COD removal efficiencies equal to 99.7%, 99.9%, 64.1%, respectively. Yan et al. [18], when treating manure landfill leachate with the addition of acetate as a carbon source in a lab–scale membrane bioreactor, determined TN, NO3–N, and COD removal efficiencies of 90%, 94.6% and 95.1%, respectively. However, when the centrifuged liquids fermented from food waste were used as a carbon source, the removal efficiencies were 92.8%, 99.9%, and 96.5%, respectively. The results obtained in the DAA3 and DFW3 series are similar to those described in the literature, which indicates the possibility of using a conventional activated sludge system with a separate denitrification chamber for digestate treatment.

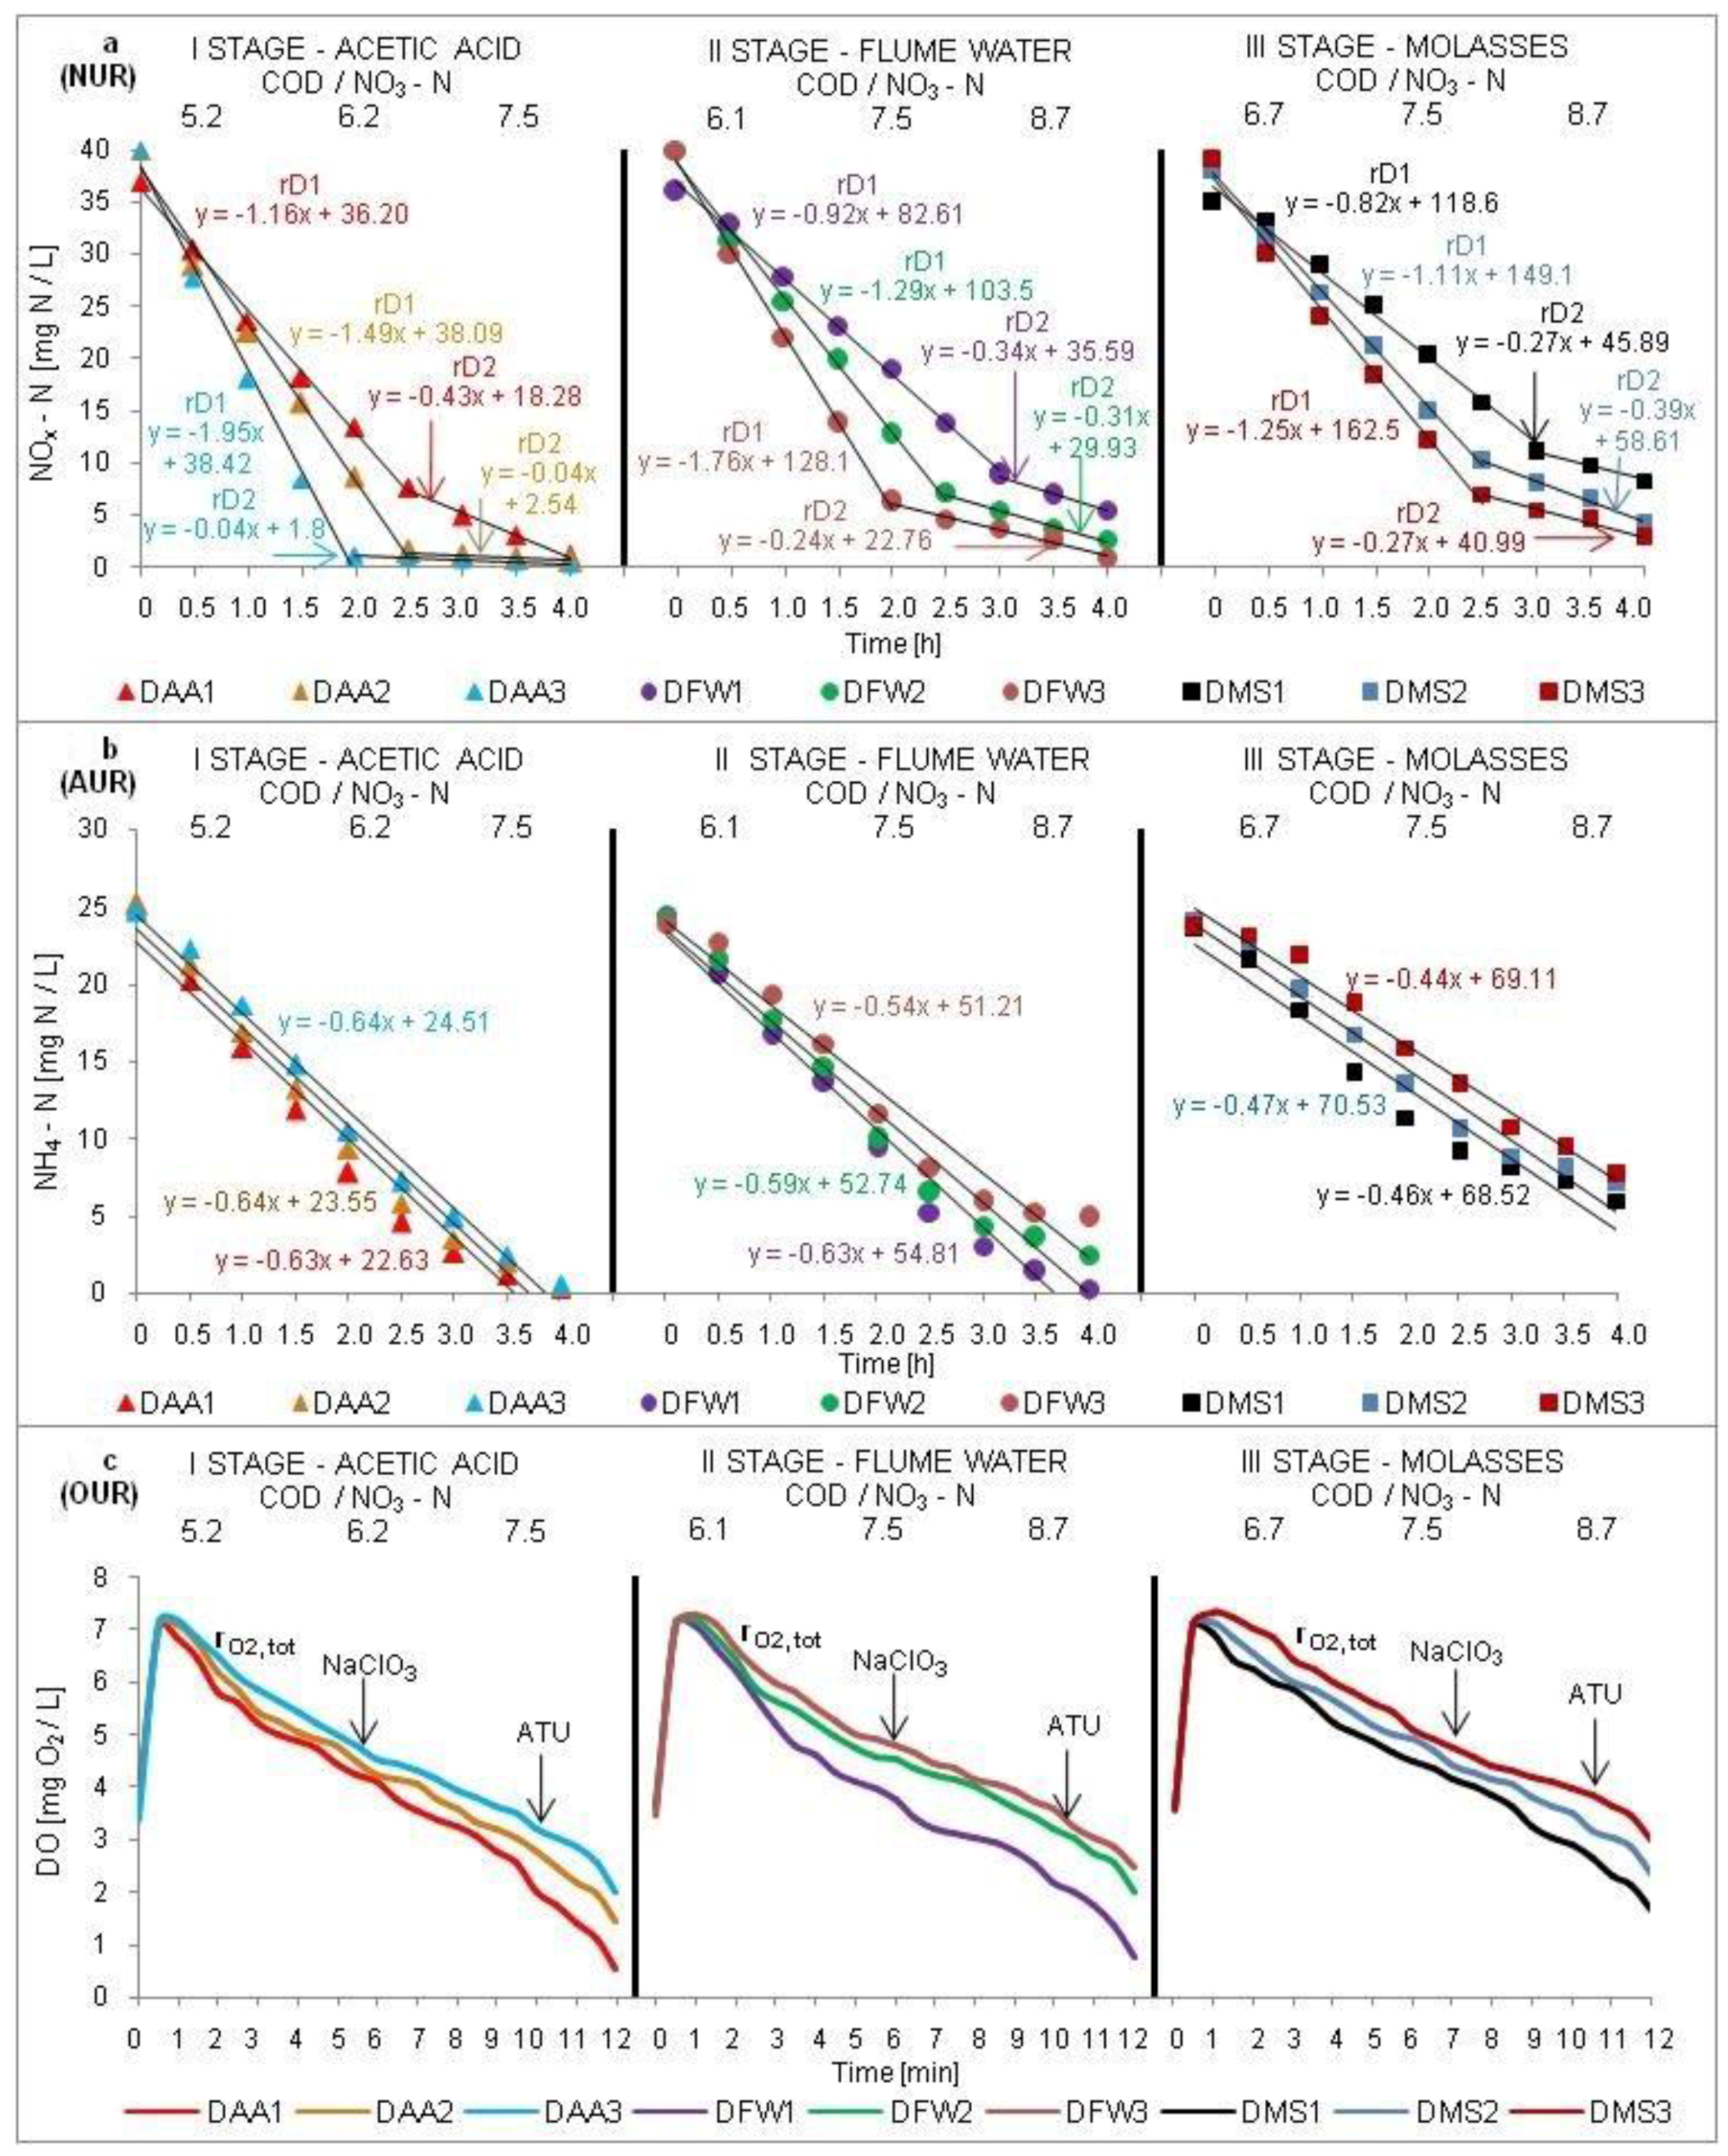
3.2. Amount and Activity of Denitrifying Bacteria

The type of carbon source and the C/N ratio influence not only the efficiency of the nitrification and denitrification processes but also influences the amount and activity of the bacteria in the activated sludge [13,19,46]. In our study, following the analysis of the results presented in Figure 3a,c, it was found that the amount and activity of denitrifying bacteria in the activated sludge increased as the COD/NO3–N ratio rose in the influents at each stage of the research. Furthermore, it was noted that not only the COD/NO3–N ratio, but also the biodegradability of the carbon source used, is essential in the denitrification process. The activity of denitrifiers and thus the denitrification rate were defined as the SNUR. The curves for the changes in the NOx–N concentrations used to calculate the SNUR values are shown at Figure 4a. The observed SNUR1 rates were associated with the utilization of soluble, readily biodegradable organic compounds and the SNUR2 rates with slowly biodegradable organic compounds [26].
The highest amount of denitrifying bacteria and the highest SNUR were determined in the DAA3 series, in which the COD/NO3–N ratio was 7.5 and where the carbon source was acetic acid characterized by a biodegradable fraction (BDCOD) accounting for 99.98 ± 0.02% of the total COD (Table 1). In DAA3 series, the amount of denitrifying bacteria was equal to 8.8 × 10¹⁰ cells/L (3.4% of the total bacteria amount), and the SNUR was 6.28 ± 0.85 mg N/g VSS h. Due to high biodegradability of acetic acid, the SNUR1 in the DAA3 series was the highest at 12.26 ± 1.06 mg N/g VSS h, and the SNUR2 was 0.25 ± 0.08 mg N/g VSS h (Figure 3c). In the DFW3 series in which the carbon source was flume water and where the COD/NO3–N ratio was 8.7, a lower amount of denitrifying bacteria was determined than it was in the DAA3 series, which was equal to 6.8 × 10¹⁰ cells/L (3.1% of the total bacteria amount). The reason for this could have been the lower content of the BDCOD fraction in the flume water than in acetic acid, which is equal to 79.88 ± 1.17% of the total COD (Table 1). As a consequence of this, the SNUR1 was 15.99 ± 0.87% lower than it was in the DAA3 series and stood at 10.30 ± 1.14 mg N/g VSS h, and the SNUR2 was 1.59 ± 0.48 mg N/g VSS h (Figure 3c). Analysing the obtained results, a clear correlation was noted between the amount and the activity of the denitrifying bacteria and efficiency of the denitrification process. The amount of denitrifying bacteria and their activity determined in the DAA3 and DFW3 series ensured a high efficiency of the reduction of NO3–N and COD concentrations in effluents (Figure 2b,c). In our study, the lowest amounts of denitrifying bacteria were obtained in the series in which molasses was used to enhance the denitrification process. Molasses was characterized as being the lowest among the analysed carbon sources, with a BDCOD fraction accounting for 69.92 ± 1.45% of the total COD (Table 1). The SNUR1 and SNUR2 in the DMS3 series at the COD/NO3–N ratio of 8.7 were 7.03 ± 0.94 and 1.53 ± 0.36 mg N/g VSS h, respectively (Figure 3c), while the amount of denitrifying bacteria was 3.4 × 10¹⁰ cells/L (2.6% of the total bacteria amount). The SNUR was 4.97 ± 0.87 mg N/g VSS h and was 16.47 ± 0.82% lower than it was in the DFW3 series, which also used the COD/NO3–N ratio of 8.7. In the DMS1 series at the COD/NO3–N ratio of 6.7, the amount of denitrifying bacteria and the SNUR were the lowest among those determined in the study and were at 9.9 × 10⁹ cells/L (1.1% of total bacteria amount) and 3.7 ± 0.81 mg N/g VSS h, respectively. This resulted in an increase of the NO3–N concentration in the effluent (Figure 2c).
The impact of the biodegradability of the carbon source on the denitrification process was also observed by comparing the results of the DAA3, DFW2, and DMS2 series in which the COD/NO3–N ratio was 7.5. The highest SNUR was obtained in the DAA3 series. By contrast, in the DFW2 and DMS2 series, the SNURs were lower by 9.87 ± 1.12% and 26.11 ± 1.43%, respectively. These results show that the denitrification process mainly uses readily biodegradable organic matter. Choubert et al. [47] also pointed out that the concentration of biodegradable COD is among the main factors affecting the denitrification process. Quan et al. [26] found that the highest denitrification rates are obtained when readily biodegradable organic matter is used.
The results of the NUR tests obtained by other authors are presented in Table 4. The SNURs described in the literature with the addition of acetic acid or acetate range from 3 [48] to 40 mg N/g VSS h [45]. The differences in the rates probably result from the type of reactors, sludge sources, and environmental factors. The SNURs determined in the study in the DAA1 series (4.9 mg N/g VSS h) were similar to those determined by Rodriguez et al. [25] when using acetate as a carbon source in a lab–scale SBR reactor. The highest rates, which were equal to 31.1 and 40 mg N/g VSS h, were determined by Obaja et al. [15] and Dosta et al. [45], respectively, by dosing acetic acid and acetate directly into the anoxic chambers of lab–scale SBR reactors. Such high rates may confirm the good adaptation of the activated sludge to the carbon source. The SNURs obtained with acetic acid or acetate are higher than those obtained in the case of alternative external carbon sources. Cappai et al. [24] and Rodriguez et al. [25], using wastewater from the sugar industry as a carbon source in lab–scale SBR reactors, determined SNURs of 2.7 mg N/g VSS h and 1.75 mg N/g VSS h, respectively. By contrast, Quan et al. [26], using hydrolyzed molasses as a carbon source in an SBR reactor and at a COD/NO3–N ratio of 5, determined an SNUR of 3.6 mg N/g VSS h. This value was comparable to the one obtained in the DMS1 series at the COD/NO3–N ratio of 6.7. This shows that the hydrolysis improved the uptake of molasses by bacteria, so similar SNURs were obtained at a lower COD/NO3–N ratio. A low SNUR value of 0.43 mg N/g VSS h was determined by Yu et al. [49] when treating synthetic domestic wastewater containing glucose in a lab–scale SBR reactor. Zhao et al. [50], analysing the influence of three carbon sources on nitrogen transformation in an aerobic granular sludge system, also found that bacteria hardly used saccharides, whereas the nitrogen removal rate was the highest when using sodium acetate.

3.3. Amount and Activity of Nitrifying Bacteria

Data on the amounts of nitrifying bacteria, the activity of nitrifiers (SAUR) as well as the heterotrophic activity (SOUR) are plotted on Figure 3a–c. Curves of changes in NH4–N and the DO concentrations used to calculate the SAUR and SOUR values are shown at Figure 4b,c, respectively. In order to fully characterise the nitrification process, apart from the amount of nitrifying bacteria, the interaction of the AOB and NOB bacteria was also determined (Figure 3b). The AOB bacteria activity in the activated sludge is closely related to the NH4+–N removal rate [51]. Maintaining the proper interaction of these bacteria plays a key role in optimizing the nitrification process in a biological wastewater treatment plant [46,52].
Upon the analysis of the results shown in Figure 3a–c, it was found that the highest amount of nitrifying bacteria and their highest activity were determined in the series in which acetic acid was used as a carbon source. In the DAA1 series, in which the COD/NO3–N ratio was 5.2, the nitrifying bacteria accounted for 7.7% of the total bacteria amount (10.8 × 10¹⁰ cells/L), with the amount of AOB bacteria being equal to 8.0 × 10¹⁰ cells/L and NOB 2.8 × 10¹⁰ cells/L. The AOB/NOB ratio was 2.9, which was higher than the theoretical value, which should be 2 in a balanced nitrifying system, which is in accordance with thermodynamics and electron transfer [52]. The SAUR was 3.17 ± 0.25 mg NH4–N/g VSS h, and the SOUR was 11.05 ± 1.12 mg O2/g VSS h. In the DFW series in which flume water was used to enhance the denitrification process, lower amounts of nitrifying bacteria and their lower activity were determined. In the DFW1 series, at the COD/NO3–N ratio of 6.1, the amount of AOB bacteria was 5.6 × 10¹⁰ cells/L, NOB 2.3 × 10¹⁰ cells/L, and the AOB/NOB ratio was 2.5. The total amount of nitrifying bacteria was 7.9 × 10¹⁰ cells/L (6.6% of the total bacteria amount), the SAUR was 2.92 ± 0.34 mg NH4–N/g VSS h, and the SOUR was 9.52 ± 1.02 mg O2/g VSS h. The nitrification rates determined in the DAA and DFW series as well as the amounts and interactions of AOB and NOB bacteria were sufficient for an efficient and stable nitrification process, which was evident from the comparatively low concentrations of NH4–N and NO2–N in the effluents (Figure 2c). The lowest amounts of the nitrifying bacteria were obtained in the DMS series during the treatment of the digestate liquid fraction with molasses as a carbon source. In the DMS1 series at the COD/NO3–N ratio of 6.7, the nitrifying bacteria accounted for 3.6% of the total bacteria amount (3.3 × 10¹⁰ cells/L), and the SAUR was 2.14 ± 0.37 mg NH4–N/g VSS h. The amount of AOB bacteria was 2.0 × 10¹⁰ cells/L, whereas the NOB was 1.3 × 10¹⁰ cells/L. In the DMS3 series, at the COD/NO3–N ratio of 8.7, the amount of nitrifiers decreased to 2.0 × 10¹⁰ cells/L (1.5% of the total bacteria amount), including the AOB bacteria to 9 × 10⁹ cells/L and NOB to 1.1 × 10¹⁰ cells/L. The AOB/NOB ratio was 0.9, the SAUR was 1.87 ± 0.52 mg NH4–N/g VSS h, and the SOUR was 9.20 ± 1.09 mg O2/g VSS h. According to Nielsen et al. [53], the proportion of the nitrifying bacteria should be 4–6% of the total bacterial biomass in the efficient nitrification process. The amounts determined in the DMS series were too low, resulting in increased concentrations of NH4–N and NO2–N in the effluents (Figure 2c).
The analysis of the results led to the observations that in all of the test series, an increase in the COD/NO3–N ratio in the influents resulted in a decrease in the amounts of the nitrifying bacteria and the SAURs and an increase in the SOURs. This was probably caused by a weaker ability of the nitrifiers to compete for oxygen with heterotrophs at high COD concentrations. This was evidenced by the increase in the SOUR, which constituted an indicator of heterotrophic oxygen activity. Ma et al. [54] point out that at higher C/N ratios in the influents, the inhibition of the nitrifying bacteria occurs, with AOB amounts decreasing more intensively than NOB. Carrera et al. [55] claim that increasing the COD/N ratio in the influent from 2.6 to 3.4 in a biological nitrogen removal process involving nitrification and denitrification resulted in a reduction of the amount of autotrophic bacteria from 2 to 1.5%. Mota et al. [56] and Sepehri and Sarrafzadeh [57] pointed out that the low C/N ratio in the influent to the wastewater treatment plant is probably the most important factor that has an influence on the high proportion of the nitrifying bacteria in the activated sludge and thus on the stability of the nitrification process.
The results of the AUR tests obtained by different authors are summarized in Table 4. These values range from 1.65 [49] to 27.5 mg N/g VSS h [15]. The highest SAURs of 27.5 and 19 mg N/g VSS h were obtained by Obaja et al. [15] and Dosta et al. [45] during the treatment of wastewater with a high ammonia nitrogen content, liquid fraction of digested piggery wastewater, and centrifuged reject water from an anaerobic digester in lab–scale SBR reactors. This means that a high concentration of ammonia nitrogen in the influent stimulates high nitrifier activity in the activated sludge [49,58]. By contrast, Cappai et al. [24], when conducting a municipal wastewater treatment process with the addition of wastewater from a sugar factory as a carbon source, and Yu et al. [49], when treating synthetic domestic wastewater containing glucose in lab–scale SBR reactors, obtained SAURs equal to 2.82 and 1.65 mg N/g VSS h, respectively. These values were comparable to those determined in the described studies for the DFW1 and DMS3 series, which amounted to 2.92 and 1.87 mg N/g VSS h, respectively.

4. Conclusions

Studies have indicated that the digestate liquid fraction can be treated in a conventional activated sludge system. This has been found that flume water and molasses, so industrial wastewater and by–products generated in a sugar factory can be used as alternative carbon sources to intensify the biological nitrogen removal from digestate. It has been shown that the type of external carbon source, and especially its biodegradability as well as the COD/NO3–N ratio, had a significant impact on the amount and activity of activated sludge bacteria and thus on the nitrogen removal efficiency and organic compound removal. The best results for the treatment of the digestate liquid fraction were obtained when the acetic acid was a carbon source and when the COD/NO3–N ratio was 7.5. Comparable results were achieved in the DFW3 series using flume water as a carbon source and at the COD/NO3–N ratio of 8.7. The use of molasses as an alternative carbon source resulted in lower nitrification and denitrification efficiency compared to acetic acid and flume water.

Author Contributions

Conceptualization, A.C. and K.Z.; methodology, A.C. and K.Z.; software, K.Z.; validation, A.C. and K.Z.; formal analysis, A.C. and K.Z.; investigation, A.C. and K.Z.; resources, A.C. and K.Z.; data curation, A.C. and K.Z.; writing—original draft preparation, A.C. and K.Z.; writing—review and editing, A.C. and K.Z.; visualization, A.C. and K.Z.; supervision, K.Z.; project administration, A.C. and K.Z.; funding acquisition, K.Z. All authors have read and agreed to the published version of the manuscript.

Funding

This research received no external funding.

Institutional Review Board Statement

Not applicable.

Informed Consent Statement

Not applicable.

Data Availability Statement

Not applicable.

Acknowledgments

We would like to express our great acknowledgements to the wastewater treatment plant and the biogas plant located next to Strzelin sugar factory belong to the Südzucker company for their technical assistance in our research.

Conflicts of Interest

The authors declare no conflict of interest.

Abbreviations

The following abbreviations are used in this manuscript:
ADAnaerobic Digestion
AOBAmmonia Oxidizing Bacteria
BDCODBiodegradable COD/biodegradable fraction
BOD5Biochemical Oxygen Demand
C/NCarbon/Nitrogen
CODChemical Oxygen Demand
DODissolved Oxygen
MLVSSMixed Liquor Volatile Suspended Solids
MLSSMixed Liquor Suspended Solid
NH4–NAmmonia Nitrogen
NOBNitrite Oxidizing Bacteria
NO2–NNitrite Nitrogen
NO3–NNitrate Nitrogen
SAURSpecific Ammonia Utilization Rate/Specific Nitrification Rate
SBPSugar Beet Pulp
SBRSequencing Batch Reactor
SCODSoluble COD
SNURSpecific Nitrate Utilization Rate/Specific Denitrification Rate
SOURSpecific Oxygen Utilization Rate
TNTotal Nitrogen
TPTotal Phosphorus
VSSVolatile Suspended Solids
WWTPWastewater Treatment Plant

References

  1. Świątczak, P.; Cydzik–Kwiatkowska, A.; Zielińska, M. Treatment of the liquid phase of digestate from a biogas plant for water reuse. Bioresour. Technol. 2019, 276, 226–235. [Google Scholar] [CrossRef]
  2. Jurgutis, L.; Šlepetienė, A.; Šlepetys, J.; Cesevičienė, J. Towards a Full Circular Economy in Biogas Plants: Sustainable Management of Digestate for Growing Biomass Feedstocks and Use as Biofertilizer. Energies 2021, 14, 4272. [Google Scholar] [CrossRef]
  3. Peyrelasse, C.; Barakat, A.; Lagnet, C.; Kaparaju, P.; Monlau, F. Anaerobic Digestion of Wastewater Sludge and Alkaline–Pretreated Wheat Straw at Semi–Continuous Pilot Scale: Performances and Energy Assessment. Energies 2021, 14, 5391. [Google Scholar] [CrossRef]
  4. European Commission. Digestate and Compost as Fertilisers: Risk Assessment and Risk Management Options; Wood Environment & Infrastructure Solutions UK Limited: London, UK, 2019. [Google Scholar]
  5. Guilayn, F.; Jimenez, J.; Rouez, M.; Crest, M.; Patureau, D. Digestate mechanical separation: Efficiency profiles based on anaerobic digestion feedstock and equipment choice. Bioresour. Technol. 2019, 274, 180–189. [Google Scholar] [CrossRef] [PubMed]
  6. Duan, N.; Khoshnevisan, B.; Lin, C.; Liu, Z.; Liu, H. Life cycle assessment of anaerobic digestion of pig manure coupled with different digestate treatment technologies. Environ. Int. 2020, 137, 105522. [Google Scholar] [CrossRef] [PubMed]
  7. Świątczak, P.; Cydzik–Kwiatkowska, A.; Zielińska, M. Treatment of Liquid Phase of Digestate from Agricultural Biogas Plant in a System with Aerobic Granules and Ultrafiltration. Water 2019, 11, 104. [Google Scholar] [CrossRef] [Green Version]
  8. Chuda, A.; Ziemiński, K. Digestate mechanical separation in industrial conditions: Efficiency profiles and fertilising potential. Waste Manag. 2021, 128, 167–178. [Google Scholar] [CrossRef]
  9. Bolzonella, D.; Fatone, F.; Gottardo, M.; Frison, N. Nutrients recovery from anaerobic digestate of agro–waste: Techno–economic assessment of full scale applications. J. Environ. Manag. 2018, 216, 111–119. [Google Scholar] [CrossRef]
  10. Lin, J.; Zhang, P.; Li, G.; Yin, J.; Li, J.; Zhao, X. Effect of COD/N ratio on nitrogen removal in a membrane–aerated biofilm reactor. Int. Biodeterior. Biodegrad. 2016, 113, 74–79. [Google Scholar] [CrossRef]
  11. Gong, X.; Wang, B.; Qiao, X.; Gong, Q.; Liu, X.; Peng, Y. Performance of the anammox process treating low–strength municipal wastewater under low temperatures: Effect of undulating seasonal temperature variation. Bioresour. Technol. 2020, 312, 123590. [Google Scholar] [CrossRef]
  12. Guo, Y.; Chen, Y.; Webeck, E.; Li, Y.-Y. Towards more efficient nitrogen removal and phosphorus recovery from digestion effluent: Latest developments in the anammox-based process from the application perspective. Bioresour. Technol. 2020, 299, 122560. [Google Scholar] [CrossRef]
  13. Xu, J.; Wang, P.; Li, Y.; Niu, L.; Xing, Z. Shifts in the Microbial Community of Activated Sludge with Different COD/N Ratios or Dissolved Oxygen Levels in Tibet, China. Sustainability 2019, 11, 2284. [Google Scholar] [CrossRef] [Green Version]
  14. Yang, Y.; Wang, L.; Xiang, F.; Zhao, L.; Qiao, Z. Activated Sludge Microbial Community and Treatment Performance of Wastewater Treatment Plants in Industrial and Municipal Zones. Int. J. Environ. Res. Public Health 2020, 17, 436. [Google Scholar] [CrossRef] [Green Version]
  15. Obaja, D.; Macé, S.; Costa, J.; Sans, C.; Mata–Alvarez, J. Nitrification, denitrification and biological phosphorus removal in piggery wastewater using a sequencing batch reactor. Bioresour. Technol. 2003, 87, 103–111. [Google Scholar] [CrossRef]
  16. Yao, R.; Yuan, Q.; Wang, K. Enrichment of Denitrifying Bacterial Community Using Nitrite as an Electron Acceptor for Nitrogen Removal from Wastewater. Water 2019, 12, 48. [Google Scholar] [CrossRef] [Green Version]
  17. Kristensen, G.H.; Jorgensen, P.E.; Henze, M. Characterization of functional microorganism groups and substrate in activated sludge and wastewater by AUR, NUR and OUR. Water Sci. Technol. 1992, 25, 43–57. [Google Scholar] [CrossRef]
  18. Yan, F.; Jiang, J.; Zhang, H.; Liu, N.; Zou, Q. Biological denitrification from mature landfill leachate using a foodwaste–derived carbon source. J. Environ. Manag. 2018, 214, 184–191. [Google Scholar] [CrossRef] [PubMed]
  19. Peng, Y.-Z.; Ma, Y.; Wang, S.-Y. Denitrification potential enhancement by addition of external carbon sources in a pre–denitrification process. J. Environ. Sci. 2007, 19, 284–289. [Google Scholar] [CrossRef]
  20. Xue, Z.; Wang, C.; Cao, J.; Luo, J.; Feng, Q.; Fang, F.; Li, C.; Zhang, Q. An alternative carbon source withdrawn from anaerobic fermentation of soybean wastewater to improve the deep denitrification of tail water. Biochem. Eng. J. 2018, 132, 217–224. [Google Scholar] [CrossRef]
  21. Liu, F.; Tian, Y.; Ding, Y.; Li, Z. The use of fermentation liquid of wastewater primary sedimentation sludge as supplemental carbon source for denitrification based on enhanced anaerobic fermentation. Bioresour. Technol. 2016, 219, 6–13. [Google Scholar] [CrossRef] [PubMed]
  22. Cherchi, C.; Onnis–Hayden, A.; El–Shawabkeh, I.; Gu, A.Z. Implication of using different carbon sources for denitrification in wastewater treatments. Water Environ. Res. 2009, 81, 788–799. [Google Scholar] [CrossRef]
  23. Feng, X.-C.; Bao, X.; Che, L.; Wu, Q.-L. Enhance biological nitrogen and phosphorus removal in wastewater treatment process by adding food waste fermentation liquid as external carbon source. Biochem. Eng. J. 2021, 165, 107811. [Google Scholar] [CrossRef]
  24. Cappai, G.; Carucci, A.; Onnis, A. Use of industrial wastewaters for the optimization and control of nitrogen removal processes. Water Sci. Technol. 2004, 50, 17–24. [Google Scholar] [CrossRef]
  25. Rodríguez, L.; Villaseñor, J.; Fernández, F.J. Use of agro–food wastewaters for the optimisation of the denitrification process. Water Sci. Technol. 2007, 55, 63–70. [Google Scholar] [CrossRef] [PubMed]
  26. Quan, Z.; Jin, Y.; Yin, C.; Lee, J.J.; Lee, S. Hydrolyzed molasses as an external carbon source in biological nitrogen removal. Bioresour. Technol. 2005, 96, 1690–1695. [Google Scholar] [CrossRef] [PubMed]
  27. Fernández, F.J.; Castro, M.C.; Villasenor, J.; Rodríguez, L. Agro–food wastewaters as external carbon source to enhance biological phosphorus removal. Chem. Eng. J. 2011, 166, 559–567. [Google Scholar] [CrossRef]
  28. Atimtay, A.T.; Sikdar, S.K. Security of Industrial Water Supply and Management; Springer: Dordrecht, The Netherlands, 2011. [Google Scholar]
  29. Sedlak, R. Phosphorus and Nitrogen Removal from Municipal Wastewater: Principles and Practice, 2nd ed.; Routledge: Boca Raton, FL, USA, 2018; p. 256. [Google Scholar]
  30. Kujawa–Roeleveld, K. Estimation of Denitrification Potential with Respiration Based Techniques. Ph.D. Thesis, Wageningen University, Wageningen, The Netherlands, 2000. [Google Scholar]
  31. Hartley, K. Tuning Biological Nutrient Removal Plants; IWA Publishing: London, UK, 2013. [Google Scholar]
  32. Sperandio, M.; Urbain, V.; Audic, J.M.; Paul, E. Use of carbon dioxide evolution rate for determining heterotrophic field and characterising denitrifying biomass. Water Sci. Technol. 1999, 39, 139–146. [Google Scholar] [CrossRef]
  33. Muller, A.; Wentzel, M.C.; Loewenthal, R.E.; Ekama, G.A. Heterotroph anoxic yield in anoxic aerobic activated sludge systems treating municipal wastewater. Water Res. 2003, 37, 2435–2441. [Google Scholar] [CrossRef]
  34. Standard ATV-DVWK-A 131P. Dimensioning of Single–Stage Activated Sludge Plants, German ATV–DVWK Rules and Standards; GFA Publishing Company of ATV–DVWK Water, Wastewater and Waste: Hennef, Germany, 2000. [Google Scholar]
  35. American Public Health Association; American Water Works Association; Water Environment Federation. Standard Methods for the Examination of Water and Wastewater, 21st ed.; American Public Health Association (APHA); American Water Works Association (AWWA); Water Environment Federation (WEF): Washington, DC, USA, 2005. [Google Scholar]
  36. Henze, M.; Gujer, W.; Mino, T.; Van Loosdrecht, M.C. Activated Sludge Models ASM1, ASM2, ASM2d and ASM3; IWA Publishing: London, UK, 2000. [Google Scholar]
  37. Zawilski, M.; Brzezinska, A. Variability of COD and TKN fractions of combined wastewater. Pol. J. Environ. Stud. 2009, 18, 501–505. [Google Scholar]
  38. Van Loosdrecht, M.C.M.; Nielsen, P.H.; Lopez–Vazquez, C.M.; Brdjanovic, D. Experimental Methods in Wastewater Treatment; IWA Publishing: London, UK, 2016. [Google Scholar]
  39. Ferris, M.J.; Muyzer, G.; Ward, D.M. Denaturing Gradient Gel Electrophoresis Profiles of 16S rRNA–Defined Populations Inhabiting a Hot Spring Microbial Mat Community. Appl. Environ. Microbiol. 1996, 62, 340–346. [Google Scholar] [CrossRef] [PubMed] [Green Version]
  40. Li, X.R.; Xiao, Y.P.; Ren, W.W.; Liu, Z.F.; Shi, J.H.; Quan, Z.X. Abundance and composition of ammonia–oxidizing bacteria and archaea in different types of soil in the Yangtze River estuary. J. Zhejiang Univ. Sci. B 2012, 13, 769–782. [Google Scholar] [CrossRef] [Green Version]
  41. Gerbl, F.W.; Weidler, G.W.; Wanek, W.; Erhardt, A.; Stan–Lotter, H. Thaumarchaeal ammonium oxidation and evidence for a nitrogen cycle in a subsurface radioactive thermal spring in the Austrian Central Alps. Front. Microbiol. 2014, 5, 225. [Google Scholar] [CrossRef] [Green Version]
  42. Kim, Y.M.; Lee, D.S.; Park, C.; Park, D.; Park, J.M. Effects of free cyanide on microbial communities and biological carbon and nitrogen removal performance in the industrial activated sludge process. Water Res. 2011, 45, 1267–1279. [Google Scholar] [CrossRef]
  43. Meng, J.; Li, J.; Li, J.; Astals, S.; Nan, J.; Deng, K.; Antwi, P.; Xu, P. The role of COD/N ratio on the start–up performance and microbial mechanism of an upflow microaerobic reactor treating piggery wastewater. J. Environ. Manag. 2018, 217, 825–831. [Google Scholar] [CrossRef] [PubMed]
  44. Machat, H.; Boudokhane, C.; Roche, N.; Dhaouadi, H. Effects of C/N Ratio and DO concentration on Carbon and Nitrogen removals in a Hybrid Biological Reactor. Biochem. Eng. J. 2019, 151, 107313. [Google Scholar] [CrossRef]
  45. Dosta, J.; Galí, A.; Benabdallah El–Hadj, T.; Macé, S.; Mata–Alvarez, J. Operation and model description of a sequencing batch reactor treating reject water for biological nitrogen removal via nitrite. Bioresour. Technol. 2007, 98, 2065–2075. [Google Scholar] [CrossRef] [PubMed]
  46. Cai, Y.; Yan, Z.; Ou, Y.; Peng, B.; Zhang, L.; Shao, J.; Lin, Y.; Zhang, J. Effects of different carbon sources on the removal of ciprofloxacin and pollutants by activated sludge: Mechanism and biodegradation. J. Environ. Sci. 2022, 111, 240–248. [Google Scholar] [CrossRef]
  47. Choubert, J.-M.; Marquot, A.; Stricker, A.-E.; Racault, Y.; Gillot, S.; Heduit, A. Anoxic and aerobic values for the yield coefficient of the heterotrophic biomass: Determination at full–scale plants and consequences on simulations. Water SA 2009, 35, 103–110. [Google Scholar] [CrossRef] [Green Version]
  48. Morgan-Sagastume, F.; Nielsen, J.L.; Nielsen, P.H. Substrate–dependent denitrification of abundant probe–defined denitrifying bacteria in activated sludge. FEMS Microbiol. Ecol. 2008, 66, 447–461. [Google Scholar] [CrossRef] [PubMed] [Green Version]
  49. Yu, L.; Peng, D.; Pan, R. Shifts in Nitrification Kinetics and Microbial Community during Bioaugmentation of Activated Sludge with Nitrifiers Enriched on Sludge Reject Water. J. Biomed. Biotechnol. 2012, 2012, 691894. [Google Scholar] [CrossRef] [Green Version]
  50. Zhao, L.; Su, C.; Wang, A.; Fan, C.; Huang, X.; Li, F.; Li, R. Comparative study of aerobic granular sludge with different carbon sources: Effluent nitrogen forms and microbial community. J. Water Process Eng. 2021, 43, 102211. [Google Scholar] [CrossRef]
  51. Jiang, X.; Wang, H.; Wu, P.; Wang, H.; Deng, L.; Wang, W. Nitrification performance evaluation of activated sludge under high potassium ion stress during high–ammonia nitrogen organic wastewater treatment. J. Environ. Sci. 2022, 111, 84–92. [Google Scholar] [CrossRef]
  52. Yao, Q.; Peng, D. Nitrite oxidizing bacteria (NOB) dominating in nitrifying community in full–scale biological nutrient removal wastewater treatment plants. AMB Express 2017, 7, 1–11. [Google Scholar] [CrossRef] [Green Version]
  53. Nielsen, P.H.; Thomsen, T.R.; Nielsen, J.L. Bacterial composition of activated sludge–importance for floc and sludge properties. Water Sci. Technol. 2004, 49, 51–58. [Google Scholar] [CrossRef]
  54. Ma, J.; Wang, Z.; Zhu, C.; Liu, S.; Wang, Q.; Wu, Z. Analysis of Nitrification Efficiency and Microbial Community in a Membrane Bioreactor Fed with Low COD/N–Ratio Wastewater. PLoS ONE 2013, 8, e63059. [Google Scholar] [CrossRef]
  55. Carrera, J.; Vicent, T.; Lafuente, J. Effect of influent COD/N ratio on biological nitrogen removal (BNR) from high–strength ammonium industrial wastewater. Process Biochem. 2004, 39, 2035–2041. [Google Scholar] [CrossRef]
  56. Mota, C.; Ridenoure, J.; Cheng, J.; Reyes, F.L. High levels of nitrifying bacteria in intermittently aerated reactors treating high ammonia wastewater. FEMS Microbiol. Ecol. 2005, 54, 391–400. [Google Scholar] [CrossRef]
  57. Sepehri, A.; Sarrafzadeh, M.-H. Activity enhancement of ammonia–oxidizing bacteria and nitrite–oxidizing bacteria in activated sludge process: Metabolite reduction and CO2 mitigation intensification process. Appl. Water Sci. 2019, 9, 131. [Google Scholar] [CrossRef] [Green Version]
  58. Dinçer, A.R.; Kargi, F. Kinetics of sequential nitrification and denitrification processes. Enzym. Microb. Technol. 2000, 27, 37–42. [Google Scholar] [CrossRef]
Figure 1. Schematic view of the laboratory wastewater treatment plant.
Energies 14 07321 g001
Figure 2. Operating parameters of reactors (a); COD and TN concentration in effluents and COD and TN removal efficiency (b); NH4–N, NO3–N, and NO2–N concentration in effluents and NH4–N removal efficiency (c).
Energies 14 07321 g002
Figure 3. The amount (a,b) and activity (c) of bacteria in the activated sludge depending on the type of external carbon source and the COD/NO3–N ratio. Means (n = 3) within each kind of bacteria and each batch test and each kind of external carbon source followed by the same letter are not statistically different according to Tukey’s test.
Energies 14 07321 g003
Figure 4. Profiles of changes in concentrations of NOx–N (a), NH4–N (b), and DO (c) used to calculate SNUR, SAUR, and SOUR values, respectively; where, rD1 is the denitrification rate on Ss (the readily biodegradable COD fraction), Xs (the particulate COD fraction), and endogenous respiration rD2 is the denitrification rate on Xs and endogenous respiration.
Energies 14 07321 g004
Table 1. Substrate characteristics.
IndicatorLiquid Fraction of DigestateFlume WaterMolassesAcetic Acid
COD
(g O2/L)
7.96 ± 0.556.38 ± 0.281014.00 ± 3.22913.00 ± 0.00
SCOD
(g O2/L)
1.97 ± 0.054.32 ± 0.16650.64 ± 0.86913.00 ± 0.00
BDCOD
(g O2/L)
2.03 ± 0.025.13 ± 0.12709.06 ± 0.94912.84 ± 0.15
BOD5
(g O2/L)
1.18 ± 0.082.97 ± 0.10410.00 ± 0.35527.83 ± 0.26
TN
(g/L)
2.32 ± 0.060.08 ± 0.0025.38 ± 0.36
NH4–N
(g/L)
1.95 ± 0.070.04 ± 0.000.53 ± 0.03
TP
(mg/L)
23.12 ± 1.592.20 ± 0.0768.40 ± 1.13
pH8.07 ± 0.166.83 ± 0.097.33 ± 0.032.50 ± 0.00
Table 2. Composition of influents.
Stage of StudyI StageII StageIII Stage
External Carbon SourceAcetic AcidFlume WaterMolasses
Indicator/SeriesDAA1DAA2DAA3DFW1DFW2DFW3DMS1DMS2DMS3
COD
(mg O2/L)
1268.38 ± 8.541440.98
± 8.02
1592.54
± 8.08
1348.78
± 8.08
1519.53
± 9.02
1663.01
± 11.02
1423.74
± 5.86
1555.49
± 6.43
1699.82
± 6.81
BDCOD
(mg O2/L)
821.70 ± 8.12955.32
± 6.48
1126.39
± 7.25
757.07
± 6.78
916.49
± 8.09
1037.08
± 9.23
737.79
± 7.56
811.95
± 5.42
926.90
± 5.95
BOD5
(mg O2/L)
475.14 ± 7.02552.40
± 7.00
651.32
± 7.21
437.76
± 8.19
529.94
± 9.02
599.67
± 9.50
426.62
± 6.03
469.50
± 5.69
535.96
± 6.00
TN
(mg/L)
149.19 ± 0.75149.22
± 0.72
149.30
± 0.70
149.72
± 0.90
148.83
± 0.95
148.82
± 0.92
149.81
± 0.81
149.58
± 0.88
149.73
± 0.92
NH4–N
(mg/L)
107.95 ± 0.68107.74
± 0.64
107.34
± 0.68
106.84
± 0.81
106.68
± 0.85
106.57 ± 0.8187.67 ± 0.9085.06 ± 0.9582.61 ± 0.85
TP
(mg/L)
1.76 ± 0.021.75 ± 0.021.75 ± 0.021.68 ± 0.011.72 ± 0.021.75 ± 0.021.49 ± 0.021.47 ± 0.031.45 ± 0.03
pH6.71 ± 0.216.72 ± 0.196.75 ± 0.287.56 ± 0.207.61 ± 0.147.65 ± 0.107.79 ± 0.177.83 ± 0.247.89 ± 0.15
CODext */NO3–N5.206.207.506.107.508.706.707.508.70
BDCODext */NO3–N5.106.107.504.806.007.004.705.206.10
COD/TN8.509.7010.709.0010.2011.209.5010.4011.40
* ext—external carbon source.
Table 3. Primers and PCR programs.
TargetPrimerSequence
(5′—3′)
The Composition of Reaction MixturePCR ProgramReferences of Primers Seguence
Bacterial 16SrDNA1055FATGGCTGTCGTCAGCT1 μL
10 μL
0.4 μL
0.4 μL
8.2 μL
DNA template (10 ng/μL)
Real Time 2xRT–PCR Mix SYBR A
(A&A Biotechnology)
Primer 1055F (10 μM)
Primer 1392R (10 μM)
Nuclease–free water
3 min at 95 °C;
40 cycles of 15 s at 95 °C, 30 s at 58 °C, 30 s at 72 °C;
65 °C → 95 °C
[39]
1392RACGGGCGGTGTGTAC
AOB—amoA geneamoA–1FGGGGTTTCTACTGGTGGT1 μL
10 μL
0.4 μL
1.0 μL
7.6 μL
DNA template (10 ng/μL)
Real Time 2xRT-PCR Mix SYBR A
(A&A Biotechnology)
Primer amoA–1F (10 μM)
Primer amoA–2R (10 μM)
Nuclease–free water
3 min at 95 °C;
40 cycles of 15 s at 95 °C, 30 s at 55 °C, 30 s at 72 °C;
65 °C → 95 °C
[40]
amoA–2RCCCCTCKGSAAAGCCTTCTTC
NOB—nxrA genenxrA–RT–FGTGGTCATGCGCGTTGAGCA1 μL
10 μL
0.4 μL
0.4 μL
8.2 μL
DNA template (10 ng/μL)
Real Time 2xRT–PCR Mix SYBR A
(A&A Biotechnology)
Primer nxrA–RT–F (10 μM)
Primer nxrA–RT–R (10 μM)
Nuclease–free water
3 min at 95 °C;
40 cycles of 15 s at 95 °C, 30 s at 60 °C, 30 s at 72 °C;
65 °C → 95 °C
[41]
nxrA–RT–RTCGGGAGCGCCATCATCCAT
Denitrifying bacteria—nirS genenirS 1fTACCACCCSGARCCGCGCGT1 μL
10 μL
0.1 μL
0.1 μL
8.8 μL
DNA template (10 ng/μL)
Real Time 2xRT–PCR Mix SYBR A
(A&A Biotechnology)
Primer nirS 1f (10 μM)
Primer nirS 3r (10 μM)
Nuclease–free water
3 min at 95 °C;
40 cycles of
15 s at 95 °C, 30 s at 58 °C, 30 s at 72 °C;
65 °C → 95 °C
[42]
nirS 3rGCCGCCGTCRTGVAGGAA
Denitrifying bacteria—nirK genenirK 876ATYGGCGGVCAYGGCGA1 μL
10 μL
0.1 μL
0.1 μL
8.8 μL
DNA template (10 ng/μL)
Real Time 2xRT–PCR Mix SYBR A
(A&A Biotechnology)
Primer nirK 876 (10 μM)
Primer nirK 1040 (10 μM)
Nuclease–free water
3 min at 95 °C;
40 cycles of 15 s at 95 °C, 30 s at 58 °C, 30 s at 72 °C;
65 °C → 95 °C
[42]
nirK 1040GCCTCGATCAGRTTRTGGTT
Table 4. Specific denitrification and nitrification rates for different substrates and different reactors type in the literature.
Carbon SourceDenitrification Rate SNURNitrification Rate SAURReactor TypeReference
[mg N/g VSS h]
octan3–4full–scale reactor removing N and P[48]
octan4.7lab–scale
SBR reactor
[25]
acetic acid31.127.5lab–scale
SBR reactor
[15]
octan4019lab–scale
SBR reactor
[45]
wastewater from beet—sugar factory2.72.82lab–scale
SBR reactor
[24]
wastewater from beet—sugar processing1.75lab–scale
SBR reactor
[25]
hydrolyzed molasses3.6lab–scale SBR reactor; COD/NO3–N ratio of 5[26]
glucose2.4–3.1full–scale reactor removing N and P[48]
glucose0.431.65lab–scale
SBR reactor
[49]
acetic acid4.9–6.32.6–3.2lab–scale conventional activated sludge reactorThis study
flume water from beet—sugar factory4.5–6.02.3–2.9lab–scale conventional activated sludge reactorThis study
molasses3.7–5.01.9–2.1lab–scale conventional activated sludge reactorThis study
Publisher’s Note: MDPI stays neutral with regard to jurisdictional claims in published maps and institutional affiliations.

