
Cyber Risks to Critical Smart Grid Assets of Industrial Control Systems


1
School of Computer Science and Informatics, Cardiff University, Cardiff CF10 3AT, UK
2
CEMSE Division, King Abdullah University of Science and Technology (KAUST), Thuwal 23955, Saudi Arabia
*
Author to whom correspondence should be addressed.
Energies 2021, 14(17), 5501; https://doi.org/10.3390/en14175501
Submission received: 27 July 2021
/
Revised: 23 August 2021
/
Accepted: 26 August 2021
/
Published: 3 September 2021
(This article belongs to the Special Issue Big Data and Advanced Analytics in Energy Systems and Applications)
Abstract
:Cybersecurity threats targeting industrial control systems (ICS) have significantly increased in the past years. Moreover, the need for users/operators to understand the consequences of attacks targeting these systems and protect all assets is vital. This work explores asset discovery in ICS and how to rank these assets based on their criticality. This paper also discusses asset discovery and its components. We further present existing solutions and tools for asset discovery. We implement a method to identify critical assets based on their connection and discuss related results and evaluation. The evaluation utilises four attack scenarios to stress the importance of protecting these critical assets since the failure to protect them can lead to serious consequences. Using a 12-bus system case, our results show that targeting such a system can increase and overload transmission lines values to 120% and 181% MVA, which can affect the power supply and disrupt service, and it can increase the cost up to 60%, affecting the productivity of this electric grid.
1. Introduction
In recent years, industrial control systems (ICS) have used information and communication technologies to control and automate the stable operation of industrial processes [1]. A series of attacks have attacked critical infrastructure [2], for instance, smart grid distribution networks. Moreover, to talk about cyber-attacks in these systems, there is a need to understand how ICS, asset discovery, and critical assets operate. Firstly, ICS is a general term that covers several types of control systems and related instruments for industrial process control. Second, asset discovery is the process of discovering and collecting data on technical assets connected to the network for management and tracking. These assets range from hardware devices such as servers to software licenses. Finally, critical assets refer to assets that play a key role in the ICS system and are extremely easy targets for hackers [3]. For example, if hackers attack a key asset in the ICS system, it may cause hundreds of millions of dollars in direct losses and incur huge losses in subsequent maintenance costs. This paper focuses on critical asset discovery to identify the key devices connected on a smart grid system and the processes and services that are running on the ICSs, discover gaps in the existing literature, explore possible vulnerabilities within the developed prototype, and suggest any recommendations.
1.1. Motivation
The high rise of cyber-attacks on ICS can lead to a huge cost for governments and industries. Additionally, more and more ICS devices are connected to the Internet, despite their existing weak security practices. In most attacks, forensic analysis often attributes the success of such attacks to the fact that most of the existing ICS technologies are designed with reliability in mind, and security is a secondary priority. In May 2021, the Colonial Pipeline located in the United States was forced to shut down its entire fuel distribution pipeline due to a ransomware attack. Moreover, based on the pipeline company, the attack consequences have lasted for around one weak, which affected the gasoline and jet fuel distribution across the US east coast [4]. Based on the investigations, the attackers gained unauthorised access through compromised passwords that were possibly found in a batch of leaked passwords on the dark web. Then, the hackers accessed the networks of the pipeline company through a virtual private network account with the compromised password [5]. Similarly, another famous attack on such a system is the Ukraine power grid cyber-attack, which targeted three different distribution substations due to unauthorised entry into the company’s supervisory control and data acquisition system (SCADA) and caused a blackout affecting 225,000 customers for several hours in 103 cities [6]. Lastly, in March 2000, the newly built Maroochydore sewage treatment plant in Queensland, Australia, failed. The wireless connection signal was lost, the sewage pump worked abnormally, and the alarm did not work [1]. It was later discovered that a former engineer of the plant deliberately retaliated because he was dissatisfied with his new contract. It was reported that the former engineer used a laptop and a wireless transmitter to control approximately 140 sewage pumping stations for more than three months. Additionally, 1 million litres of sewage were discharged directly into the local park through the rainwater channel without treatment, which caused serious damage to the local environment. Janelle Bryant, investigation manager of the Australian Environmental Protection Agency, said at the time, “The accident caused many deaths of marine life, and the river began to become polluted and darkened. The foul smell made nearby residents unbearable and even endangered the health of residents” [1]. Therefore, it is vital to understand critical assets in the system and improve its security by prioritising the cybersecurity aspect for critical infrastructure, starting from identifying what needed to be secure, how critical it is, and how to secure it.
1.2. Related Case Studies
The smart grid, which can be considered the new model of the old-style power system, is used in this paper as a case study. In smart grid implementations, frequency, power, voltage, and current measurements are monitored in real-time, providing situational awareness of the system. Attackers who target such systems are classified according to their goals and motivations, which can be listed as cyber warfare, terrorism, industrial espionage, activism, and economic and commercial interests. This paper considers that cyber-attacks in smart grids can be divided into two situations—(1) passive attack: the attacker aims to obtain the transmitted data to understand the system configuration, architecture, and normal system operation status. Since the system’s data has not changed during the attack, it is difficult to detect this type of attack. Therefore, the focus should be on preventing passive attacks rather than detecting passive attacks. Examples of passive attacks are eavesdropping attacks and traffic analysis attacks. (2) Active attack: the attacker affects the system’s operation by modifying the transmitted data or adding manipulation instructions. In the smart grid, most attackers will attack the operating interface of the system, causing false alarms and data delays. This can confuse the operator and make it impossible to discover the system’s operation in time, leading to incorrect substations, sensors, and other equipment. An example of different active attacks that can occur in power systems can be described as follows: replay attacks [7], false data injection [8], and denial of service [9]. Moreover, the most famous attack was the Stuxnet attack on Iran’s nuclear power facility. In 2011, the attackers used a USB hard drive to plant malicious software into the control system of a nuclear power facility, causing the system to malfunction [2]. Therefore, real-time scanning of network devices connected to the smart grid, monitoring whether their activities on the system are normal or the devices on the system have the authority to connect to the system, is very important to ensure the safety of critical infrastructures.
1.3. Associated Challenges
There are existing asset discovery tools available that find the devices connected to ICS. Most of these tools do not provide the needed service for critical assets, important assets, and common assets. Consequently, there are not many accessible resources to search for this kind of information. Vulnerability scanners are also in the same situation as asset discovery tools. The key challenge is that, in critical asset discovery solutions, there are very few key asset rankings. Moreover, finding critical assets is described in detail in these solutions, but it is not mentioned how to rank them in order of importance. This can be due to the fact that it is more difficult to determine the attributes of those critical assets as the evaluation criteria.
1.4. Impact of Cyber-Attacks on Industrial Control Systems
Cyber-attacks can lead to the leakage of sensitive data in industrial settings, the theft of intellectual property rights, and even interrupt production or operation and make it impossible to deliver services to customers. In extreme cases, the most severe attack may cause permanent damage to the system or its components and equipment, resulting in loss of market share and even the company’s bankruptcy. At present, attacks on OT equipment in industrial systems are the most destructive cyber threat to utilities.
The purpose of this paper is to propose a solution for critical asset discovery and critical asset ranking. Since most of the literature now has very few solutions for ranking critical assets, network security engineers can only rely on their work of experience to judge which facilities are key facilities in the ICS system and which facilities are important to protect. Hence, the main contributions of this work can be surmised as follows:
- To provide a comprehensive overview on all available ICS asset discovery tools, vulnerability scanners, and used solutions.
- To propose a methodology to evaluate assets criticality based on their connection inside the smart grid.
- To evaluate the proposed methodology using a list that contains 18 assets to determine and classify their criticality.
- Explore different attack scenarios from a power measurements perspective when a system is compromised to emphasise the importance of protecting such a system.
2. Background and Related Works
This section introduces the basic terminologies used in ICS and other related works that have been done in this field.
2.1. Related Terminology
Industrial Control System. ICS is mainly used in electric power, water conservancy, oil, natural gas, and data industries [3]. It includes several types of control systems used in industrial production, including supervisory control and data acquisition (SCADA) system, distributed control system (DCS), and other smaller control system configurations, e.g., programmable logic controllers (PLC).
SCADA. Supervisory Control and Data Acquisition System (SCADA) is the core ICS that monitors and controls the field equipment in real-time [3].
RTU. Remote terminal unit (RTU) [10] is a special computer measurement and control unit with a modular structure designed for long communication distances and harsh industrial site environments [10,11]. It connects the terminal detection instrument and actuator with the main computer of the remote-control centre. It has the functions of remote data acquisition, control, and communication and can receive operating instructions from the host computer to control the actions of the terminal actuators. RTU can be implemented with various hardware and software, depending on the nature of the site to be controlled, site environmental conditions, system complexity, data communication requirements, real-time alarm reports, analogue signal measurement accuracy, status monitoring, and equipment regulation and switch control. Because the data transmission protocol, information structure, and error detection technology adopted by each manufacturer are different, each manufacturer generally produces dedicated RTUs supporting the SCADA system.
PLC. Programmable logic controller (PLC) is a digital operation controller with a microprocessor for automatic control, which can load control instructions into the memory at any time for storage and execution [3]. The PLC comprises functional units such as CPU, instruction and data memory, input/output interface, power supply, and digital-to-analogue conversion. The early PLCs had only logic control functions. Later, with continuous development, these computer modules with simple functions have included logic control, timing control, and analogue control. The name of various functions, such as multi-computer communication, has also been changed to programmable controller. However, due to the conflict between its abbreviation PC and the abbreviation of Personal Computer (PC), and for reasons of habit, people still often use it. The term “programming logic controller” still uses the acronym PLC. The PLCs used in the industry are now equivalent to or close to the host of a compact computer. Its advantages in scalability and reliability have made it widely used in various industrial control fields.
DCS. Distributed control system (DCS) is applied in the process-based control industry to realise the overall control of the operation process of each subsystem [3].
2.2. Assets and Asset Discovery
Asset. Industrial systems classify assets as personnel assets, technology patent assets, information assets, etc. [12]. Equipment assets in smart grid systems include elements such as substations, generators, high-voltage transmission lines, etc. Personnel assets include network security engineers, power engineers, and nuclear energy engineers. Technology patent assets include ultra-high voltage power transmission patents and nuclear power generation patents. Information assets are, for example, product information in industrial systems, database information, and enterprise architecture information.
Asset discovery. Asset discovery involves checking the existence of active and inactive assets in the network. The tools used for this purpose usually analyse the asset cluster and identify the relationship between the network and the device. Asset discovery is divided into active and passive. The passive method analyses the network traffic in a specific subnet and infers device characteristics, such as the brand and model of the asset, from the passing data packets. The active method sends targeted detections to devices on the network. It asks operational technology (OT) devices that use industrial legal protocols for detailed information about the configuration of assets, such as the brand and model of the asset and the installed hardware [12].
2.3. Assets Rating
Critical asset. Failure of this equipment will stop the process. Online status monitoring is essential [10].
Important asset. Important assets that redundant or restricted operating conditions may cover. Online status monitoring is reasonable. Periodic status monitoring can be performed.
General asset. It can tolerate some inconvenience caused by the failure of common equipment. Regular condition monitoring is reasonable. This can be done using a portable monitor.
2.4. Asset Discovery Existing Tools
Table 1 describes the advantages and disadvantages of existing asset discovery tools that can be used for ICS. Firstly, the Tenable tool [13] can completely display device information and vulnerability information in the industrial system in this direction. It can identify devices that are not communicating on the network, predict possible threats, and provide a good visual interface. Yet, it does not identify the critical asset ranks. Further, Axonius [14] tool is an asset discovery tool that focuses on discovery. It can automatically scan assets and discover unmanaged devices. However, the disadvantage of this tool is that it does not provide additional vulnerability risk reminders. The operator can only learn what assets show on the interface from this tool, but the importance and risks of the assets are not known.
The Scrutiny tool [15] can completely display equipment information in the industrial system and can generate network connection diagrams and asset summary reports between equipment. The operator can only learn what assets are available from this tool, but the importance and risks of the assets are unknown. The Claroty tool [16] can provide comprehensive asset information and summary reports of vulnerability risk information. Moreover, it can be a very powerful asset discovery tool, and there are no major disadvantages. Its only downside is that it does not sort the assets, but this tool provides a summary report of any risky assets. Further, the Nozomi [17] tool can completely display the equipment information in the industrial system and notify the operator when some illegal changes occur to the equipment to prevent risks. However, it was hard to find any feature of ranking critical assets based on their importance during research on this tool.
CyberX [18] can completely display the equipment information in the industrial system and establish a topological diagram showing the connection between the various equipment. CyberX displays all alerts that can be filtered by severity and alert type. It can also provide vulnerability management and threat prediction. It can predict many forms of threats, including destructive malware such as WannaCry and NotPetya, targeted zero-day attacks such as TRITON and Industroyer, Cyberespionage tools such as Havex and Black Energy, malicious or careless insiders, rogue or compromised third-party suppliers, and hacktivists. AT&T can completely display equipment information in industrial systems and sort critical assets and vulnerabilities [19]. This tool helps the operator to understand the asset situation in the industrial system and the corresponding vulnerability risk situation of the asset. Furthermore, it has corresponded vulnerability information and a security risk level for each asset, which can more intuitively display the asset risk situation that the operator wants to obtain. Moreover, the Applied Risk tool can help us receive a comprehensive mapping of OT devices and networks, allowing you to identify anomalies or suspicious activities and mitigate risk to your operations and enhance the visibility of your critical industrial assets [20]. Shodan [21] is an Internet search engine that indexes devices and services connected to the Internet, while traditional search engines only index websites. Shodan has been used to identify Internet components for ICS. When Shodan scans the asset, it will display its detailed information, including location, name, IP address, etc., and can generate network connection diagrams and asset summary reports between equipment. However, this tool does not provide details on the risk of network vulnerabilities.
2.5. Vulnerability Scanner Existing Tools
Table 2 describes the names, respective companies, advantages, and disadvantages of existing vulnerability scanner tools primarily used in ICS.
Nessus tool is fast, the accuracy rate is high, the vulnerability rule base is comprehensive, and the vulnerability summary report function is powerful [22]. Although Nessus can proactively probe each service to report potential vulnerabilities, this may cause unexpected DoS on the SCADA system. The Tenable tool [13] can fully display the vulnerability information in the industrial system and identify devices that are not communicating on the network, predict possible threats, and provide a good visual interface. Nevertheless, in the process of researching the tool, this tool focuses on the vulnerability information of assets. Further, Nmap [23] is mainly used for port scanning and host discovery, which helps in penetration testing. Use a combination of ping scan, SYN scan, and TCP connection to determine which hosts reside on the network and their running services.
Furthermore, Qualys [24] can automatically scan all asset vulnerabilities and has an extremely powerful knowledge base that can understand the threats of your assets around the clock and monitor the information of asset vulnerabilities in real-time. Moreover, it provides a highly visible page report, allowing users to understand the vulnerability information quickly. Wang et al. [23] discussed a vulnerability management solution, Nexpose, which helps you reduce the emergence of vulnerability threats by enabling the user to assess and respond to changes in the environment in real-time and determine the risk priority between vulnerabilities, configurations and controls. Nexpose gives the user enough confidence to understand the attack, focus on the important aspects, and create better security results. Zhou et al. [25] described a vulnerability assessment system that can prioritise vulnerabilities. Verve’s risk prioritisation includes proprietary scores of dozens of risk dimensions. Additionally, verve supports multiple bug fixes. Moreover, it can provide services that display the risks of potential vulnerabilities in real-time.
2.6. Existing Solutions for Asset Discovery
Table 3 describes the existing literature and solutions for asset discovery in ICS, providing the research studies, advantages, disadvantages, and gaps.
McLaughlin et al. [26] introduced the various attack types and vulnerability scanning methods of ICS and its structure. The steps are simple and clear when introducing the method, which is easy for readers to understand. The key research directions and advantages are listed in summary, which can help people without relevant knowledge to understand the paper’s content better. However, there is not too much introduction in the aspect of critical infrastructure discovery. Further, Sulaiman [27] introduced in detail how to rank the critical infrastructure asset in ICS. This work also introduces the possible network attacks and some well-known vulnerabilities in ICS. It also introduced the principle of the key asset ranking method. However, the disadvantage is that it lacks in relevant content about asset discovery and vulnerability scanning. If readers with relevant knowledge gaps read this article, the reader may not understand the article’s content very well. Moreover, Jonathan et al. [28] described identifying the critical infrastructure asset in the ICS. Moreover, this article also introduces the specific implementation steps and related steps for identifying the key infrastructure in the ICS system. Peter Hart [29] introduced the practical application process of the critical infrastructure asset discovery method in the ICS of smart grid systems. The method introduced in this article uses a continuous monitoring method to discover critical infrastructure assets dynamically. In the introduction of this article, the steps and principles of this method are emphasised. Its advantage is that it can continuously pay attention to the facilities in the system and update it in real-time, which can minimise the impact of system delay. The flaw of this work lies in the lack of a description of the method of ranking assets.
Furthermore, Farzan et al. [30] introduced critical infrastructure asset discovery and vulnerability risk scanning methods. This article introduces two models. One is to perform asset scanning and vulnerability risk assessment. The other is to perform asset scanning and vulnerability risk assessment at the substation level. In the introduction of this article, the two methods’ steps and principles are described in detail. The flaw of this article lies in the lack of a description of the method of sorting assets. Abdulrazzaq et al. [31] introduced the critical infrastructure asset discovery method and the actual application process in the ICS system. This article subdivides key assets into human assets, information assets, technology assets, facility assets, and the types of vulnerabilities that may exist in these assets. It also focuses on the organisational framework of the ICS system, which helps readers quickly understand the ICS system in detail. Audrey [32] introduced in detail how to rank the critical infrastructure asset in ICS. The layered comparison method it uses can quickly compare the importance of different assets in the ICS system. The principle is first to divide critical infrastructure assets into three levels. They are Less critical, equally critical, and more critical, and then compare the two key assets. Each time the two assets are compared, one point is added to the more critical asset. After the comparison, the total score is calculated. The higher the score, the higher the critical infrastructure assets are more important in the system.
Moreover, Boyer [33] introduced how to identify the critical infrastructure asset in the ICS system in detail and make readers better understand the article’s content. This paper also introduces the specific implementation steps of identifying the critical infrastructure asset in the ICS system and the related practical application test results. However, the work lacks relevant content about asset ranking. Wedgbury et al. [34] described how to identify the critical infrastructure asset. The principles of the key asset discovery methods are introduced in the work. Nevertheless, the shortcoming of this article is the lack of relevant content about asset ranking. Liu et al. [35] introduced in detail how to identify the critical infrastructure asset in ICS. However, the work does not discuss critical asset ranking.
3. System and Threat Models
This section illustrates the cybersecurity objectives of this research. Moreover, it covers the system model used in this study as well as the threat model in terms of predefined attack scenarios.
3.1. Security Objectives and Goals
The main security objective is availability, which can be defined as assuring that authorised parties can access information when needed. Secondly, confidentiality can ensure that the relevant recipients can access the stored and transmitted data and prevent unauthorised users from accessing data to protect personal privacy and security. Lastly, integrity prevents tampering with critical data in sensors, control commands, software, and electronic devices, thereby disrupting data exchange and decision-making. The key task of this work is to study the solution of asset discovery and critical infrastructure, asset ranking. Although existing asset definitions come from different fields, there are certain differences in the specific definition and attributes of assets within the scope of ICS and security. Another task in this research is to study the types of vulnerabilities of assets in ICS and the role of assets to find the necessary attributes that help achieve the ranking of key assets.
3.2. System Model and Problem Formulation
Figure 1 presents a smart grid system model scenario that contains one substation and a control centre. Moreover, both the device/server control centre and remote access server can be used to send or retrieve information from/to the substation.
Furthermore, based on IEC 61850, the substation can be divided into three levels, and each level has its own connection protocols and devices. Firstly, the station level is where the user interface, operator workstation, database, and GPS connection enabler are located. Secondly, the bay level contains most of the intelligent electronic devices (IED), such as phasor measurement unit (PMU) and protection and control. Lastly, the process level, which is the lowest level in the architecture, has physical devices, such as circuit breakers and the merging unit, that can be used to open/close transmission lines and generators.
It is vital to understand the importance of discovering asset criticality and associated cyber risks in the given scenarios. This helps us detect potential threats in time and measure their impact on the physical systems. Existing works utilise methods to discover assets, but do not highlight asset criticality, their ranks, and associated cyber risks and their impact on the physical systems.
3.3. Threat Model
In this work, we considered the scenario of an adversary gaining unauthorised remote access through a virtual private network account using a compromised username and password that appeared inside a batch of leaked passwords. Moreover, we assumed that the adversary knows the system model and has the capability to inject malicious traffic or simply perform control operations to create disruption and damage in the system. More specifically, the adversary can trip critical assets such as circuit breakers and generators at a substation of a smart grid system. The adversary can achieve this when they have the capability to send a malicious control signal to perform an operation, or the communication link is compromised as it provides weak security.
4. Our Approach
Asset discovery allows the user to clearly understand the connection of assets in ICS, such as the asset’s name and the direction of data transfer between assets. Additionally, ranking critical assets is important to observe which assets are more prone to cyber-attacks.
In terms of user requirements, technological options, and support for the decision made, our approach helps industry users, such as system operators, to understand the criticality of assets and their ranks in the system. In this work, we show how targeting cyber-attacks on physical energy systems can impact the system operations using a 12-bus system case through the PowerWorld simulation. The results obtained will help industry users to make constructive and accurate decision based on impact-analysis we presented in this work. A workflow of our approach is shown in Figure 2.
4.1. Assets in ICS
The concept of assets in the ICS field is unclear, and there is no clear agreement on its definition, which cause many serious security consequences. Through this research, it has been found that the first definition of assets is that an asset is a resource, and it will directly or indirectly participate in the ICS process. In addition to assets that exist, there are also intangible assets. For example, software or data transmitted between PLC and sensors in ICS should also be counted as assets. These assets are intangible, but they are essential to the production process. The second definition of assets will be more detailed, and there will be more types of assets. This definition divides assets into five categories: computers, people, processes, intangible, and stepping-stone. Firstly, computer mainly refers to computing hardware, such as firewalls, substations, operation centres, etc. Secondly, human assets involve core developers, related personnel, and users. Thirdly, process assets are very dense, involving various industrial processes. An intangible asset is an asset that lacks physical substance and is difficult to evaluate.
The stepping-stone asset is the most interesting because it considers the entry or connection assets in this category—for example, authentication data, network access and access to specific computers. The third definition of assets is like the second. It is about four types: personnel, information, technology, and facilities. Firstly, human assets are those key employees who operate and monitor the organisation’s services. Secondly, information assets are the assets required for the successful operation of the service. Thirdly, technical assets cover hardware and software. Finally, facility assets are facilities in factories that an organisation uses to provide services.
4.2. Critical Assets
Regarding whether or not an asset can be considered critical, one must first consider the type of asset and then consider the role of the asset in the entire system, as its connection with other assets. For example, in the smart grid, a transformer is a very critical asset. For another example, in the control centre of a smart grid, if a cyber-attack on an engineer’s operation interface causes data errors or data delays, it will cause the entire power plant to stall production. Additionally, these devices are connected to more assets, so their importance is higher. Table 4 presents a comparative analysis of our approach against existing works.
Steps of Identifying Critical Assets: An algorithm for calculating criticality for ICS assets is shown in Algorithm 1. The first step needed towards identifying critical assets is the discovery process. This can be implemented by choosing the appropriate discovery approach or using the different tools. Secondly, criticality should be identified at the beginning by the role of the asset; for example, transformers in these systems are always considered critical assets. Then, it should be based on the connection an asset has, which means that, sometimes, assets can be considered critical. An example of this can be a single generator with a single link in a system is always critical, because if the link goes down, it will cause a blackout. However, a single generator with several links and one link goes down; the system will still manage to supply power.
Furthermore, there were similar studies that focus on ranking critical assets in energy systems. Yet, these studies were either more specific on the physical level only or in failure analysis and maintenance decisions without considering cyberattacks. The following table shows a brief comparison between our method and other methods for ranking critical assets.
4.3. Ranking of Critical Assets
During this research, two solutions have been found on ranking critical assets, which can be implemented to rank critical assets. Firstly, start with the “key assets” candidate list and determine each asset’s “worst-case loss event”. Then, rating assets based on the severity of the worst-case loss event’s impact on the business, compare each asset with the other assets. Lastly, the asset with the highest score is the most critical.
The second solution is to judge the number of connections between critical assets and other critical assets. If the number of connections is larger, then the key asset is more critical. The sort of critical assets must first consider the types of assets. Transformers, generators, and loads in smart grid ICS are all key infrastructures. Next, consider the connection between the asset and other assets. In the ranking of critical assets, the more the asset is connected to other assets, the greater connectivity and links with other assets (provide alternative routes in case of attacking a link). Suppose there is a single link connecting to an important asset. In that case, it is considered more critical, as targeting an attack over the link can create disruption or stop service completely in that part of the system. Hence, its ranking will be higher.
| Algorithm 1 Calculate Criticality for ICS Asset list |
| Input: An asset list defined based on the asset discovery tool/technique used. Output: An asset list with their connections organised in descending order to did determine the criticality
2: Create Edges using the Plotly library 3: Output is output_list[ ] that contains the connections of all assets
5: let temp present temporary value in order to organise the list in descending order 6: For i in range(0, len(output_list)): 7: for j in range(i+1, len(output_list)): 8: if(output_list [i] < output_list [j]): 9: temp = output_list [i]; 10: output_list [i] = output_list [j]; 11: output_list [j] = temp; |
5. Results and Evaluation
This section demonstrates the results and evaluation of the proposed solution. Moreover, it illustrates the setup used for this experiment and presents a discussion on the identified assets obtained from the results list. We explore different attack scenarios on the 12-bus system test case. Finally, we analyse the obtained measurements to identify the system impact if critical assets are compromised.
5.1. Experiment Setup
We used Intel Core i5-9500H, 8GB RAM, and Windows 10 (64 bits). Python Version 3.7.0 is used for the implementation. Plotly library is employed to show the connection of each asset in the experiments. We have also used the PowerWorld simulator for creating attack scenarios and reflecting their impact on the smart grid ICS.
5.2. Results and Discussion
To achieve the purpose of assets discovery, a simulation of various critical assets in ICS is needed. Therefore, this simulation can be used for asset discovery and show the user what assets exist at any current time within the ICS. ‘Plotly’ is a library for displaying network graphs in python language, and it can visualise the network graph, so it simulates the connection of various critical assets in the industrial control system.
In ranking critical assets, the number of connections with other assets has been the judging criteria. Moreover, the ‘sort’ function in python is used to sort the value of the number of connections and then rank the critical assets. As shown in Figure 3, the connection of critical assets in the whole system is simulated, and arrows indicate their connection. The direction arrows on each connection line represent the data transmission direction of two critical assets. For example, these critical assets can be a transformer, generator, circuit breaker, load, sensor, etc. A bar shape can be observed on the right side of the interface, where the colour changes from dark to light, representing the increasing importance of critical assets.
In Figure 4, after showing the connections of critical assets, the tool ranks the result into a ‘txt’ file. The following picture shows the results of ranking critical assets. Additionally, it also shows the number of connections of each critical asset. In the interface, there are nine critical assets, because there is one asset that is not critical. Therefore, there is no need to rank it. The assets became more critical from bottom to top.
We do not need to rank any assets that are not critical. Moreover, the names of important assets are simulated by node and the number of connections between other nodes. Due to the increase in the number of connections, the more assets connected, the more critical. At the same time, they are at the greatest risk of network attacks because the attacker wants to achieve the goal of attacking an asset to paralyse the entire system. Therefore, those assets that have more connections with other assets will be the first targets of attackers.
Figure 5 shows the normal scenario in the 12-bus system. It is an example of the PowerWorld system. Moreover, it shows the connection between the generators, lines, and buses. Additionally, the power value of each transmission line and the hourly cost of this system is also shown.
5.3. Evaluation under Normal vs. Attack Scenarios
We present impact results and discuss physical measurements of the power system when the system is not under attack versus under attack scenarios.
5.3.1. Impact under Normal Scenario
5.3.2. Impact under Attack Scenario
Scenario-I: An Adversary Trips Generator #10
From Figure 7, it can be found that, when a generator is turned on in the 12-bus system, a transmission line will be overloaded. The overload value reached 120% MVA. Therefore, it will cause exceeding thermal limits of transmission lines. Moreover, this will affect the power supply and disrupt service or even stopping the service completely.
Scenario-II: Adversary Trips Generator #20 and #30
The operations and activities performed on physical systems should be in such a way that led to the least cost incurred. As shown in Figure 7, if two generators are simultaneously tripped, the transmission lines are still under the safe range of values. However, this scenario will increase the cost from 1800 GBP/h to 2880 GBP/h since the scenario creates a long path, which causes an increase in the overall cost.
Scenario-III: Adversary Trips Two Circuit Breakers: 21–20 and 33–35 Breakers
From Figure 8, it can be observed that two circuit breakers have been tripped, and as a result, the transmission line from No. 11 to No. 31 was seriously overloaded, and the overload value reached 181% MVA. Therefore, it will cause great damage to the transmission line, and such a large overload will cause much power to flow during the power transmission, and much reactive power will be lost. This will affect the power supply of the power system and cause the power system to stop supplying power.
Figure 9 shows the values of each transmission line after two circuit breakers are attacked in the 12-bus system. From the comparison of Figure 8, we can find that the value of “Mvar Loss” on the transmission line from No. 11 to No. 31 has increased. That is to say, the power loss in the process of power transmission becomes larger. Therefore, to achieve the same power supply efficiency, the power system must consume more resources. This also leads to greater energy waste and resource waste and will also cause greater economic losses to the power system.
Scenario-IV: Adversary Trips One Circuit Breaker: 11–10 Breakers
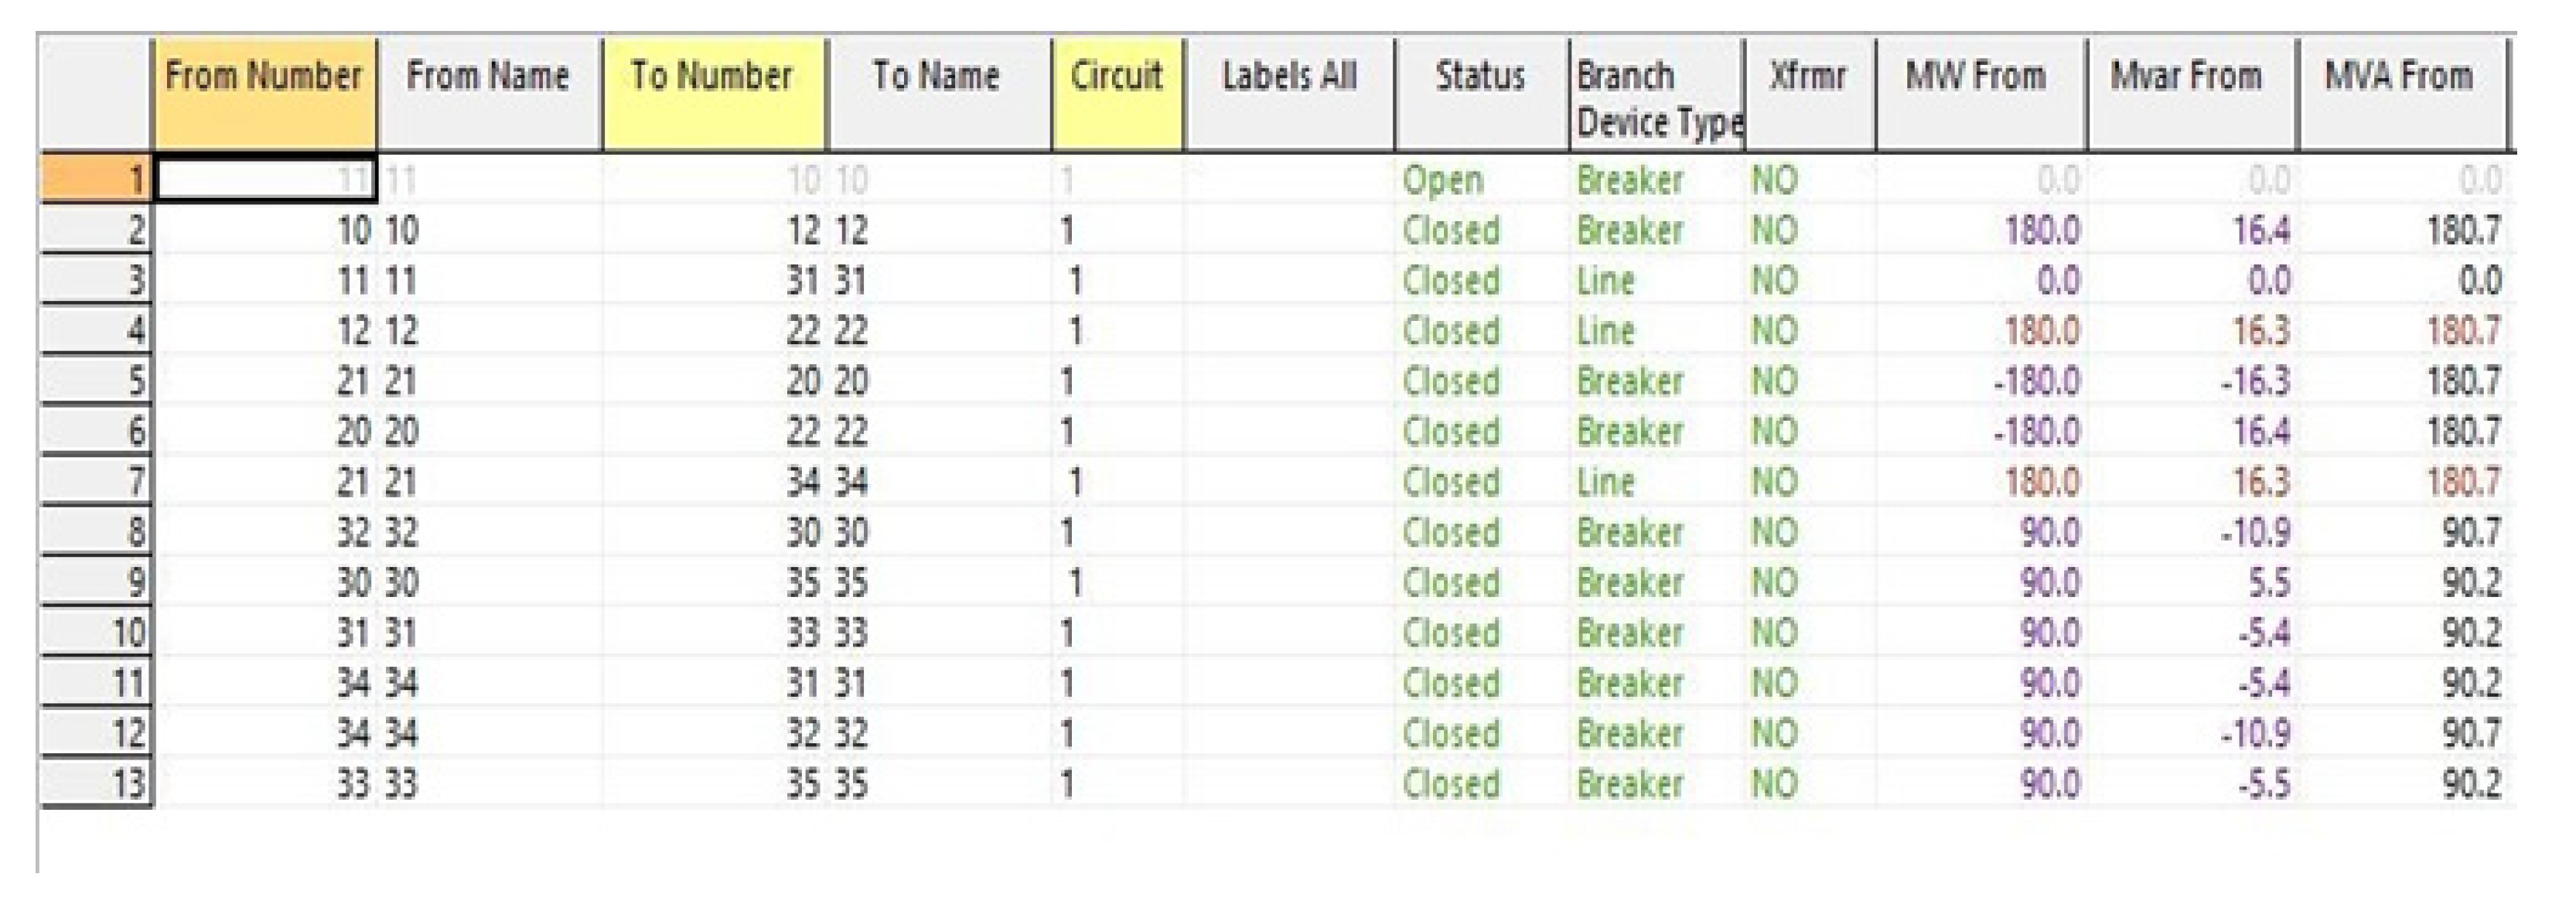
When the equipment and circuit are attacked by the network and break down, the circuit breaker can quickly cut off the fault circuit to ensure the normal operation of the non-faulty part and play a protective role. From Figure 10, it can be found that one circuit breaker has been attacked in the 12-bus system. As a result, the transmission lines from No. 12 to No. 22 and No. 21 to No. 32 were seriously overloaded, and the overload value reached 181% MVA. Therefore, it will cause great damage to the transmission line, and such a large overload will cause much power to flow during the power transmission, and a lot of reactive power will be lost. This will affect the power supply of the power system and cause the power system to stop supplying power.
Figure 11 shows the values of each transmission line after one circuit breaker is attacked in the 12-bus system. Moreover, it can be found that the value of “Mvar loss” has increased on the transmission lines from 12 to 22 and from 21 to 34. The power loss in transmission is much greater than the attack of two circuit breakers. Therefore, to achieve the same power efficiency, the power system must consume more resources. This will also lead to greater energy waste and resource waste and cause greater economic losses to the power system.
6. Conclusions
In conclusion, this paper aimed to review asset discovery tools, techniques, and solutions in ICS. Such a review is needed for these systems, giving the reader comprehensive information on one resource of tools lacking context, guide, or advantages and disadvantages. Moreover, it covers the importance of protecting assets in smart grid systems by exploring several vulnerability scanners that existed in this field and emphasising that there is a need to define the most critical assets based on their connection. Protecting these critical assets is significant due to the fact that the failure to operate these systems can lead to serious consequences.
This paper also proposed a method to identify critical assets based on their connection to each other. The developed solution was tested on a 12-bus system test case. Moreover, the evaluation illustrated 14 assets in the system and their connection, which shows the most critical assets in the proposed system.
Lastly, this paper covers an experimental evaluation by listing four attack scenarios in such a system to emphasise the importance of protecting critical assets in a smart grid. The evaluation shows that compromising critical assets can lead to serious consequences, such as blackout, overloaded transmission lines, or even economic losses.
While conducting this study and exploring different attack scenarios, there were several limitations. The first limitation was that all attack scenarios implemented focuses on the physical level in the cyber–physical system, assuming that an attacker has already compromised the system using the threat model mentioned. The second limitation is that, due to the use of the PowerWorld simulator, this experiment only provides impact analysis on the power system to emphasise the importance of protecting such a system. Lastly, another limitation is that the study uses a 12-bus test case; it needs to be implemented in the future with a larger number of cases to simulate similar real-world power distribution examples.
Author Contributions
Conceptualisation, N.S. and C.L.; methodology, C.L., Y.A., and N.S.; writing—original draft preparation, C.L.; writing—review and editing Y.A., C.K., and N.S.; supervision, N.S. All authors have read and agreed to the published version of the manuscript.
Funding
This research received no external funding.
Conflicts of Interest
The authors declare no conflict of interest.
References
- Paridari, K.; O’Mahony, N.; Mady, A.E.-D.; Chabukswar, R.; Boubekeur, M.; Sandberg, H. A Framework for Attack-Resilient Industrial Control Systems: Attack Detection and Controller Reconfiguration. Proc. IEEE 2018, 106, 113–128. [Google Scholar] [CrossRef]
- Gunduz, M.Z.; Das, R. Analysis of Cyber-Attacks on Smart Grid Applications. In Proceedings of the IEEE International Conference on Artificial Intelligence and Data Processing, IDAP, Malatya, Turkey, 28–30 September 2018. [Google Scholar] [CrossRef]
- Stouffer, K.; Falco, J.; Scarfone, K. GUIDE to Industrial Control Systems (ICS) Security. NIST 2011, 800, 16. Available online: https://nvlpubs.nist.gov/nistpubs/SpecialPublications/NIST.SP.800-82r2.pdf (accessed on 20 March 2021).
- Panettieri, J. Colonial Pipeline Cyberattack: Timeline and Ransomware Attack Recovery Details—MSSP Alert. Available online: https://www.msspalert.com/cybersecurity-breaches-and-attacks/ransomware/colonial-pipeline-investigation/ (accessed on 17 June 2021).
- Turton, W.; Mehrotra, K. Colonial Pipeline Cyber Attack: Hackers Used Compromised Password—Bloomberg. Available online: https://www.bloomberg.com/news/articles/2021-06-04/hackers-breached-colonial-pipeline-using-compromised-password (accessed on 17 June 2021).
- Lee, R.M.; Assante, M.J.; Conway, T. Analysis of the Cyber Attack on the Ukrainian Power Grid Defense Use Case. Electr. Inf. Shar. Anal. Cent. 2016, 36, 1–29. [Google Scholar]
- Wei, D.; Ji, K. Resilient industrial control system (RICS): Concepts, formulation, metrics, and insights. In Proceedings of the 3rd International Symposium on Resilient Control Systems, Idaho Falls, ID, USA, 10–12 August 2010; pp. 15–22. [Google Scholar]
- Liu, Y.; Ning, P. False Data Injection Attacks against State Estimation in Electric Power Grids. ACM Trans. Inf. Syst. Secur. 2011, 14, 33. [Google Scholar] [CrossRef]
- Chen, W.; Ding, D.; Dong, H.; Wei, G. Distributed Resilient Filtering for Power Systems Subject to Denial-of-Service Attacks. IEEE Trans. Syst. Man Cybern. Syst. 2019, 49, 1688–1697. [Google Scholar] [CrossRef]
- Incibe. Guide for an Asset Inventory Management in Industrial Control Systems. 2020. Available online: https://www.incibe-cert.es/en/blog/guide-asset-inventory-management-industrial-control-systems (accessed on 17 May 2021).
- RTU. Introduction of Remote Terminal Unit. Available online: https://www.sciencedirect.com/topics/engineering/remote-terminal-unit (accessed on 3 April 2021).
- Stouffer, K.; Zimmerman, T.; Tang, C.; Lubell, J.; Cichonski, J.; McCarthy, J. Cybersecurity Framework Manufacturing Profile. NIST Intern. Rep. 2017, 2017, 8183. Available online: https://www.nist.gov/publications/cybersecurity-framework-manufacturing-profile (accessed on 4 April 2021).
- Tenable, OT. Available online: https://zh-cn.tenable.com/products/tenable-ot?tns_redirect=true (accessed on 12 May 2021).
- Axonius. Cybersecurity Asset Management Platform. Available online: https://www.axonius.com/ (accessed on 9 May 2021).
- Bayshore Networks. Bayshore Networks—Industrial Control Cyber. Available online: https://bayshorenetworks.com/products/scrutiny/ (accessed on 9 May 2021).
- THE INDUSTRIAL CYBERSECURITY COMPANY. Available online: https://www.claroty.com/ (accessed on 21 March 2021).
- The Leader in OT & IoT Security and Visibility. Available online: https://www.nozominetworks.com/?gclid=EAIaIQobChMIoa2B3oHI8AIVgyRgCh0vDQPTEAAYASAAEgKTFPD_BwE (accessed on 18 June 2021).
- CyberX. Available online: https://cyberx-labs.com/ (accessed on 24 March 2021).
- Park, Y.; Teiken, W.; Rao, J.R.; Chari, S.N. Data classification and sensitivity estimation for critical asset discovery. IBM J. Res. Dev. 2016, 60, 2:1–2:12. [Google Scholar] [CrossRef]
- Liu, X.; Qian, C.; Hatcher, W.G.; Xu, H.; Liao, W.; Yu, W. Secure Internet of Things (IoT)-Based Smart-World Critical Infrastructures: Survey, Case Study and Research Opportunities. IEEE Access. 2019, 7, 79523–79544. [Google Scholar] [CrossRef]
- Shodan Search Engine. Available online: https://www.shodan.io/ (accessed on 18 May 2021).
- Malzahn, D.; Birnbaum, Z.; Wright-Hamor, C. Automated Vulnerability Testing via Executable Attack Graphs. In Proceedings of the International Conference on Cyber Security and Protection of Digital Services (Cyber Security), Dublin, Ireland, 15–19 June 2020; pp. 1–10. [Google Scholar] [CrossRef]
- Wang, W.; Chen, L.; Han, L.; Zhou, Z.; Xia, Z.; Chen, X. Vulnerability Assessment for ICS system Based on Zero-day Attack Graph. In Proceedings of the International Conference on Intelligent Computing, Automation and Systems (ICICAS), Chongqing, China, 11–13 December 2020; pp. 1–5. [Google Scholar] [CrossRef]
- Qualys, Inc. Qualys Community Edition. Available online: https://www.qualys.com/community-edition/ (accessed on 9 May 2021).
- Zhou, C.; Li, X.; Yang, S.; Tian, Y. Risk-Based Scheduling of Security Tasks in Industrial Control Systems with Consideration of Safety. IEEE Trans. Ind. Inform. 2020, 16, 3112–3123. [Google Scholar] [CrossRef] [Green Version]
- McLaughlin, S.; Konstantinou, C.; Wang, X.; Davi, L.; Sadeghi, A.R.; Maniatakos, M.; Karri, R. The Cybersecurity Landscape in Industrial Control Systems. Proc. IEEE 2016, 104, 1039–1057. [Google Scholar] [CrossRef]
- Alhasawi, S. ICSrank: A Security Assessment Framework for Industrial Control Systems (ICS). August 2020. Available online: http://researchonline.ljmu.ac.uk/id/eprint/13480/1/2020AlhasawiPhD.pdf (accessed on 11 April 2021).
- West, J.; Hale, J.; Papa, M.; Hawrylak, P. Automatic Identification of Critical Digital Assets. In Proceedings of the International Conference on Data Intelligence and Security (ICDIS), South Padre Island, TX, USA, 28–30 June 2019; pp. 219–224. [Google Scholar] [CrossRef]
- Hart, P.M. Continuous Asset Monitoring on the Smart Grid. In Proceedings of the IEEE PES Innovative Smart Grid Technologies, ISGT Asia Conference: Smarter Grid for Sustainable and Affordable Energy Future, Perth, WA, Australia, 13–16 November 2011. [Google Scholar] [CrossRef]
- Farzan, F.; Jafari, M.A.; Wei, D.; Lu, Y. Cyber-Related Risk Assessment and Critical Asset Identification in Power Grids. ISGT Conf. 2014, 2014, 14319525. [Google Scholar] [CrossRef]
- Abdulrazzaq, M.; Wei, Y. Industrial Control System (ICS) Network Asset Identification and Risk Management. 2018. Available online: https://www.aveva.com/content/dam/aveva/documents/support/customer-first/ServicesProfile_AVEVA_ICSSecurityAndRiskAssessments_09-19.pdf (accessed on 26 April 2021).
- Ranking Critical Assets. Available online: http://www.thesecurityminute.com/ranking-critical-assets (accessed on 26 March 2021).
- Boyer, B. Identification and Ranking of Critical Assets within an Electrical Grid under Threat of Cyber Attack; Rutgers The State University of New Jersey-New Brunswick: New Brunswick, NJ, Canada, 2011; Available online: https://rucore.libraries.rutgers.edu/rutgers-lib/33591/PDF/1/play/ (accessed on 4 May 2021).
- Wedgbury, A.; Jones, K. Automated Asset Discovery in Industrial Control Systems—Exploring the Problem. In Proceedings of the 3rd International Symposium for ICS & SCADA Cyber Security Research (ICS-CSR’15), Ingolstadt, Germany, 17–18 September 2015. [Google Scholar] [CrossRef] [Green Version]
- Liu, C.; Huang, G.; Zhang, K.; Wen, F.; Salam, M.A.; Ang, S.P. Asset Management in Power Systems. In Proceedings of the 10th International Conference on Advances in Power System Control, Operation & Management (APSCOM 2015), Hong Kong, China, 8–12 November 2015; pp. 1–5. [Google Scholar] [CrossRef]
- Beyza, J.; Garcia-Paricio, E.; Yusta, J.M. Ranking Critical Assets in Interdependent Energy Transmission Networks. Electr. Power Syst. Res. 2019, 172, 242–252. [Google Scholar] [CrossRef]
- Bhandari, H.N.; Vittal, V.; Heydt, G.T.; Quintanilla, F.L.; Knuth, W.B. Ranking of Bulk Transmission Assets for Maintenance Decisions. In Proceedings of the 51st North Am. Power Symp. NAPS 2019, Wichita, KS, USA, 13–15 October 2019. [Google Scholar] [CrossRef] [Green Version]
Figure 1.
System model representing smart grid substation.
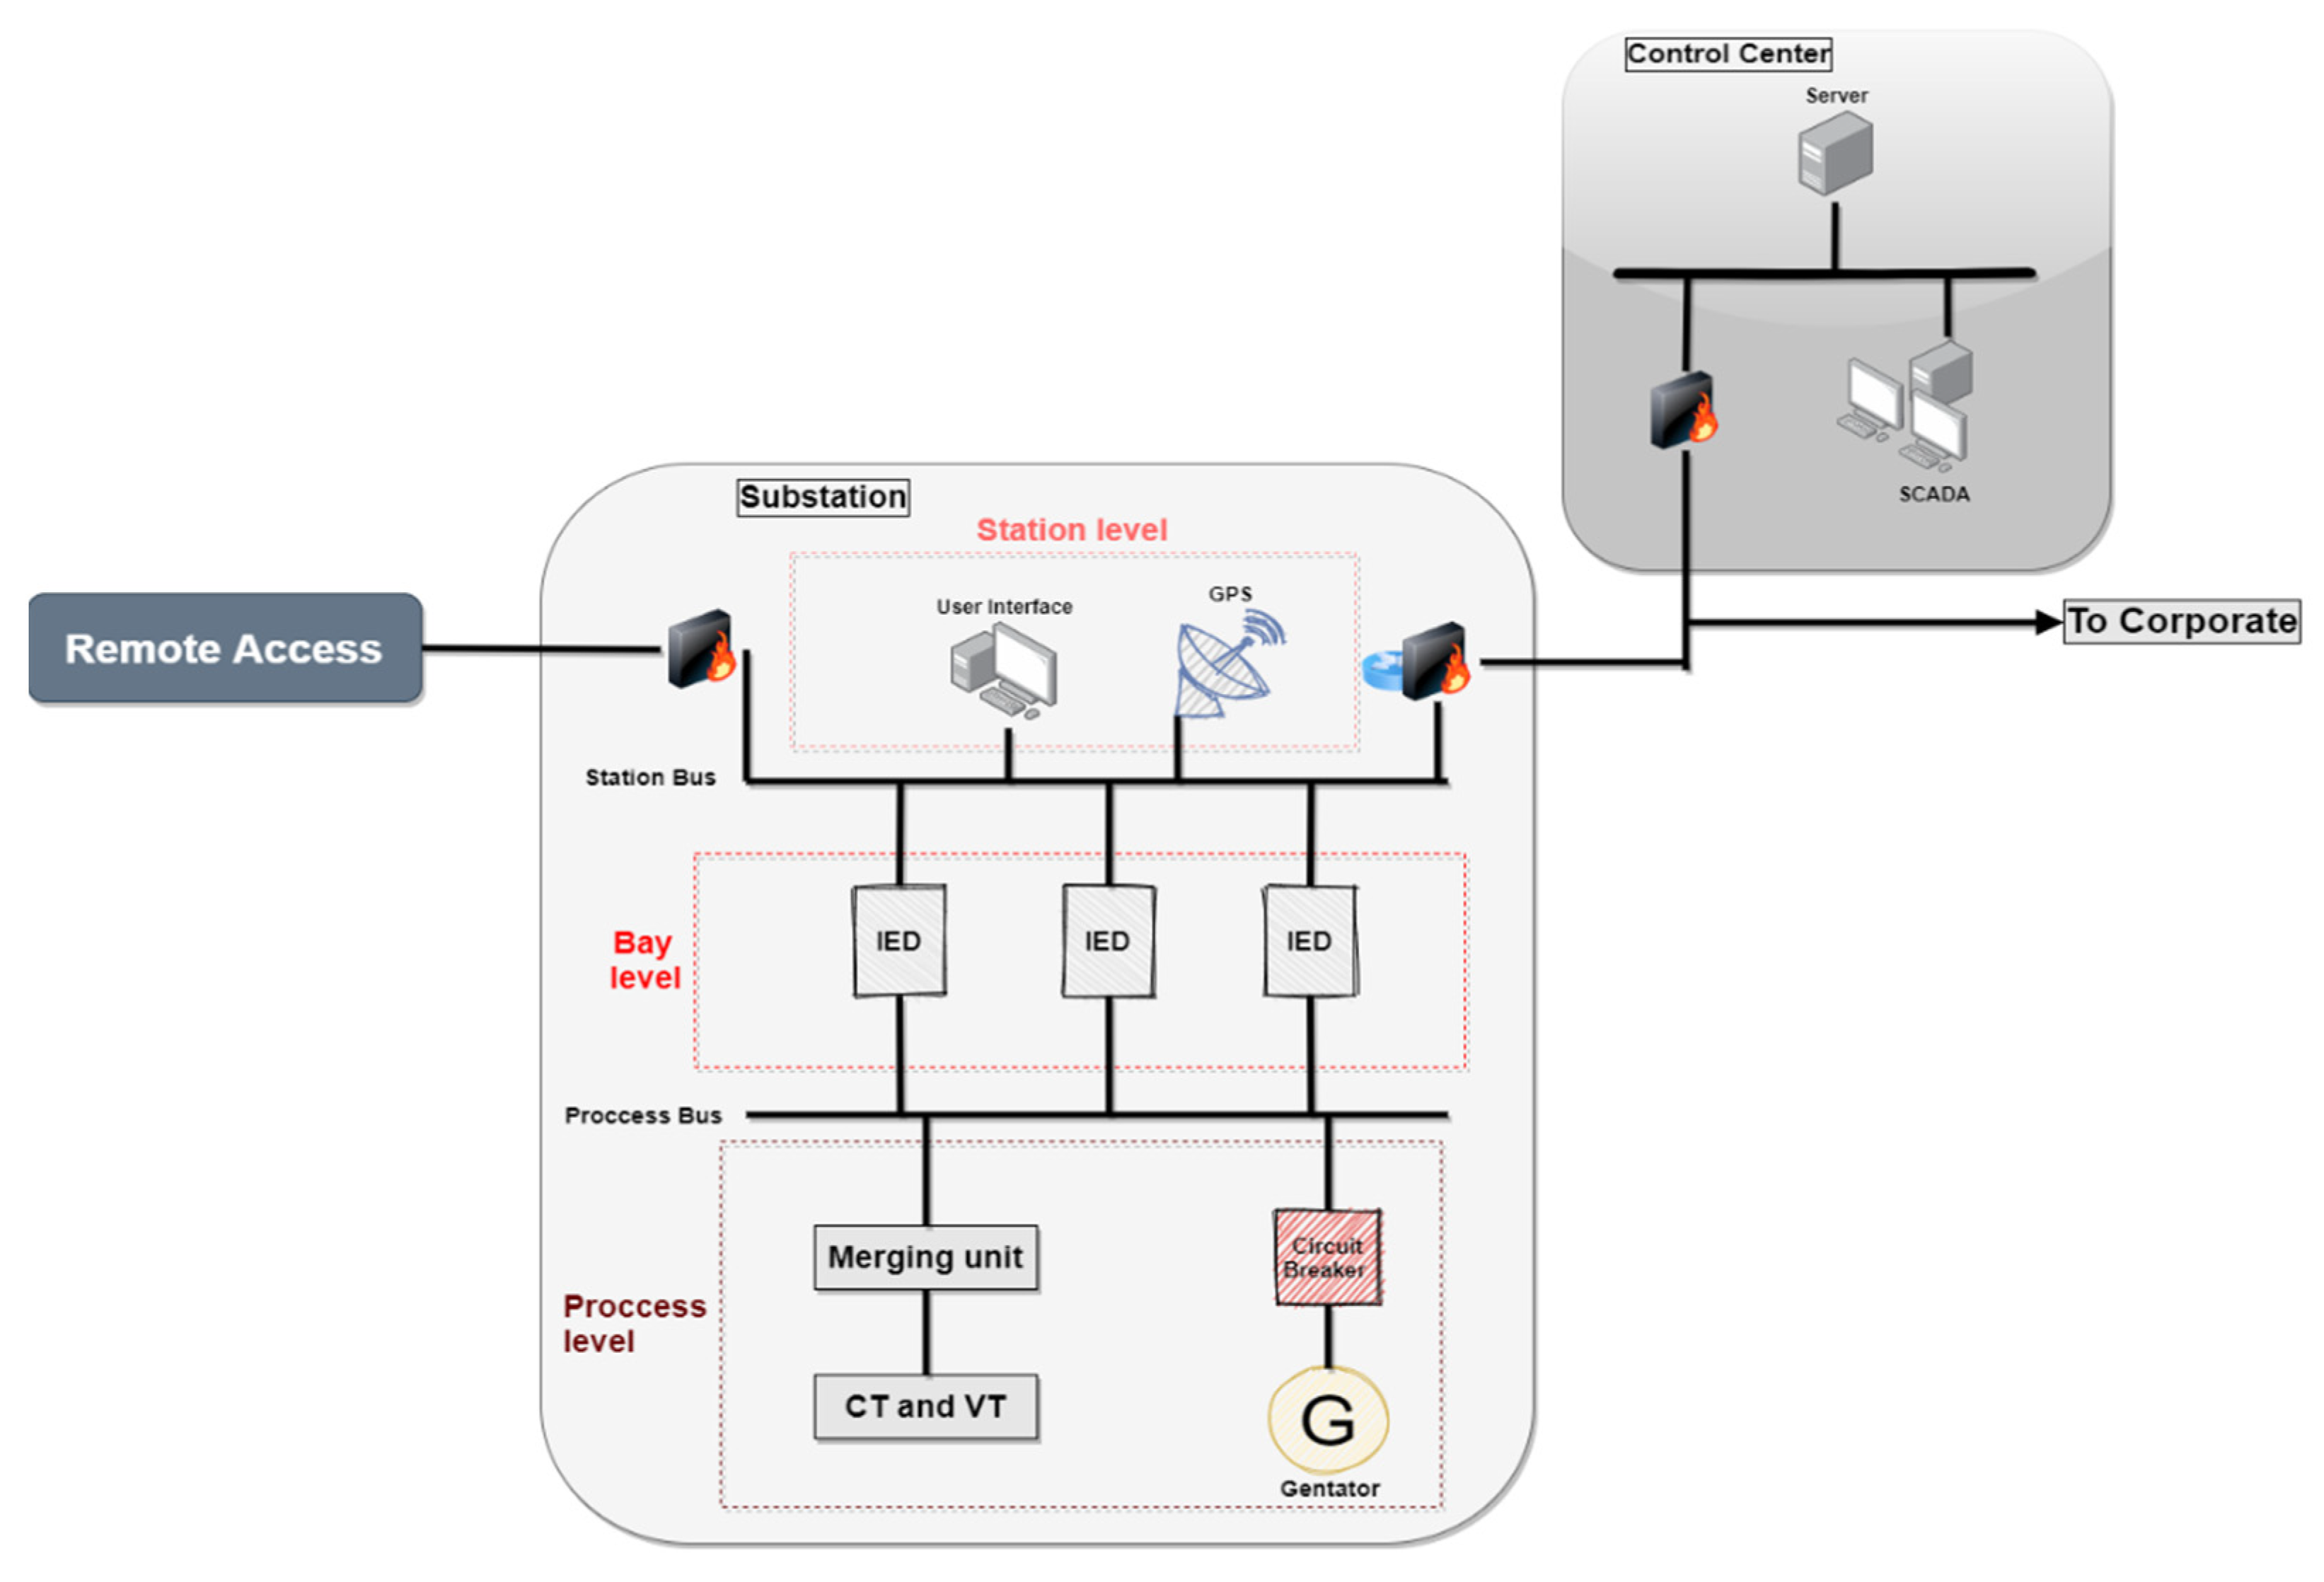
Figure 2.
Workflow of our approach.
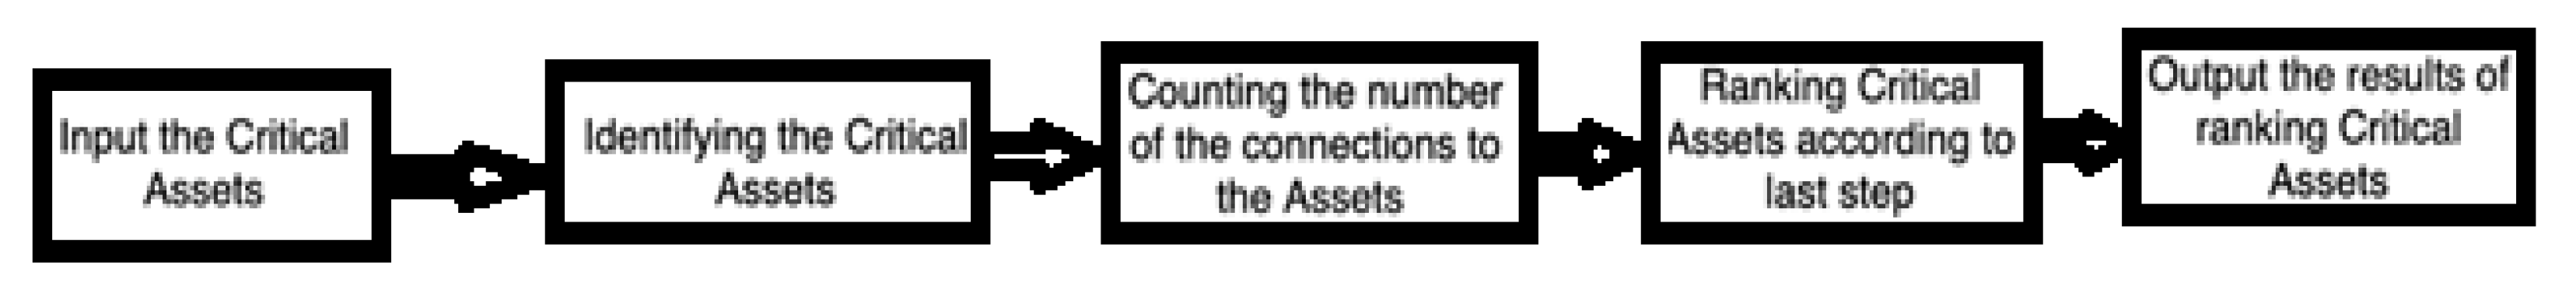
Figure 3.
Connections of Critical Assets.

Figure 4.
Ranking critical assets result.
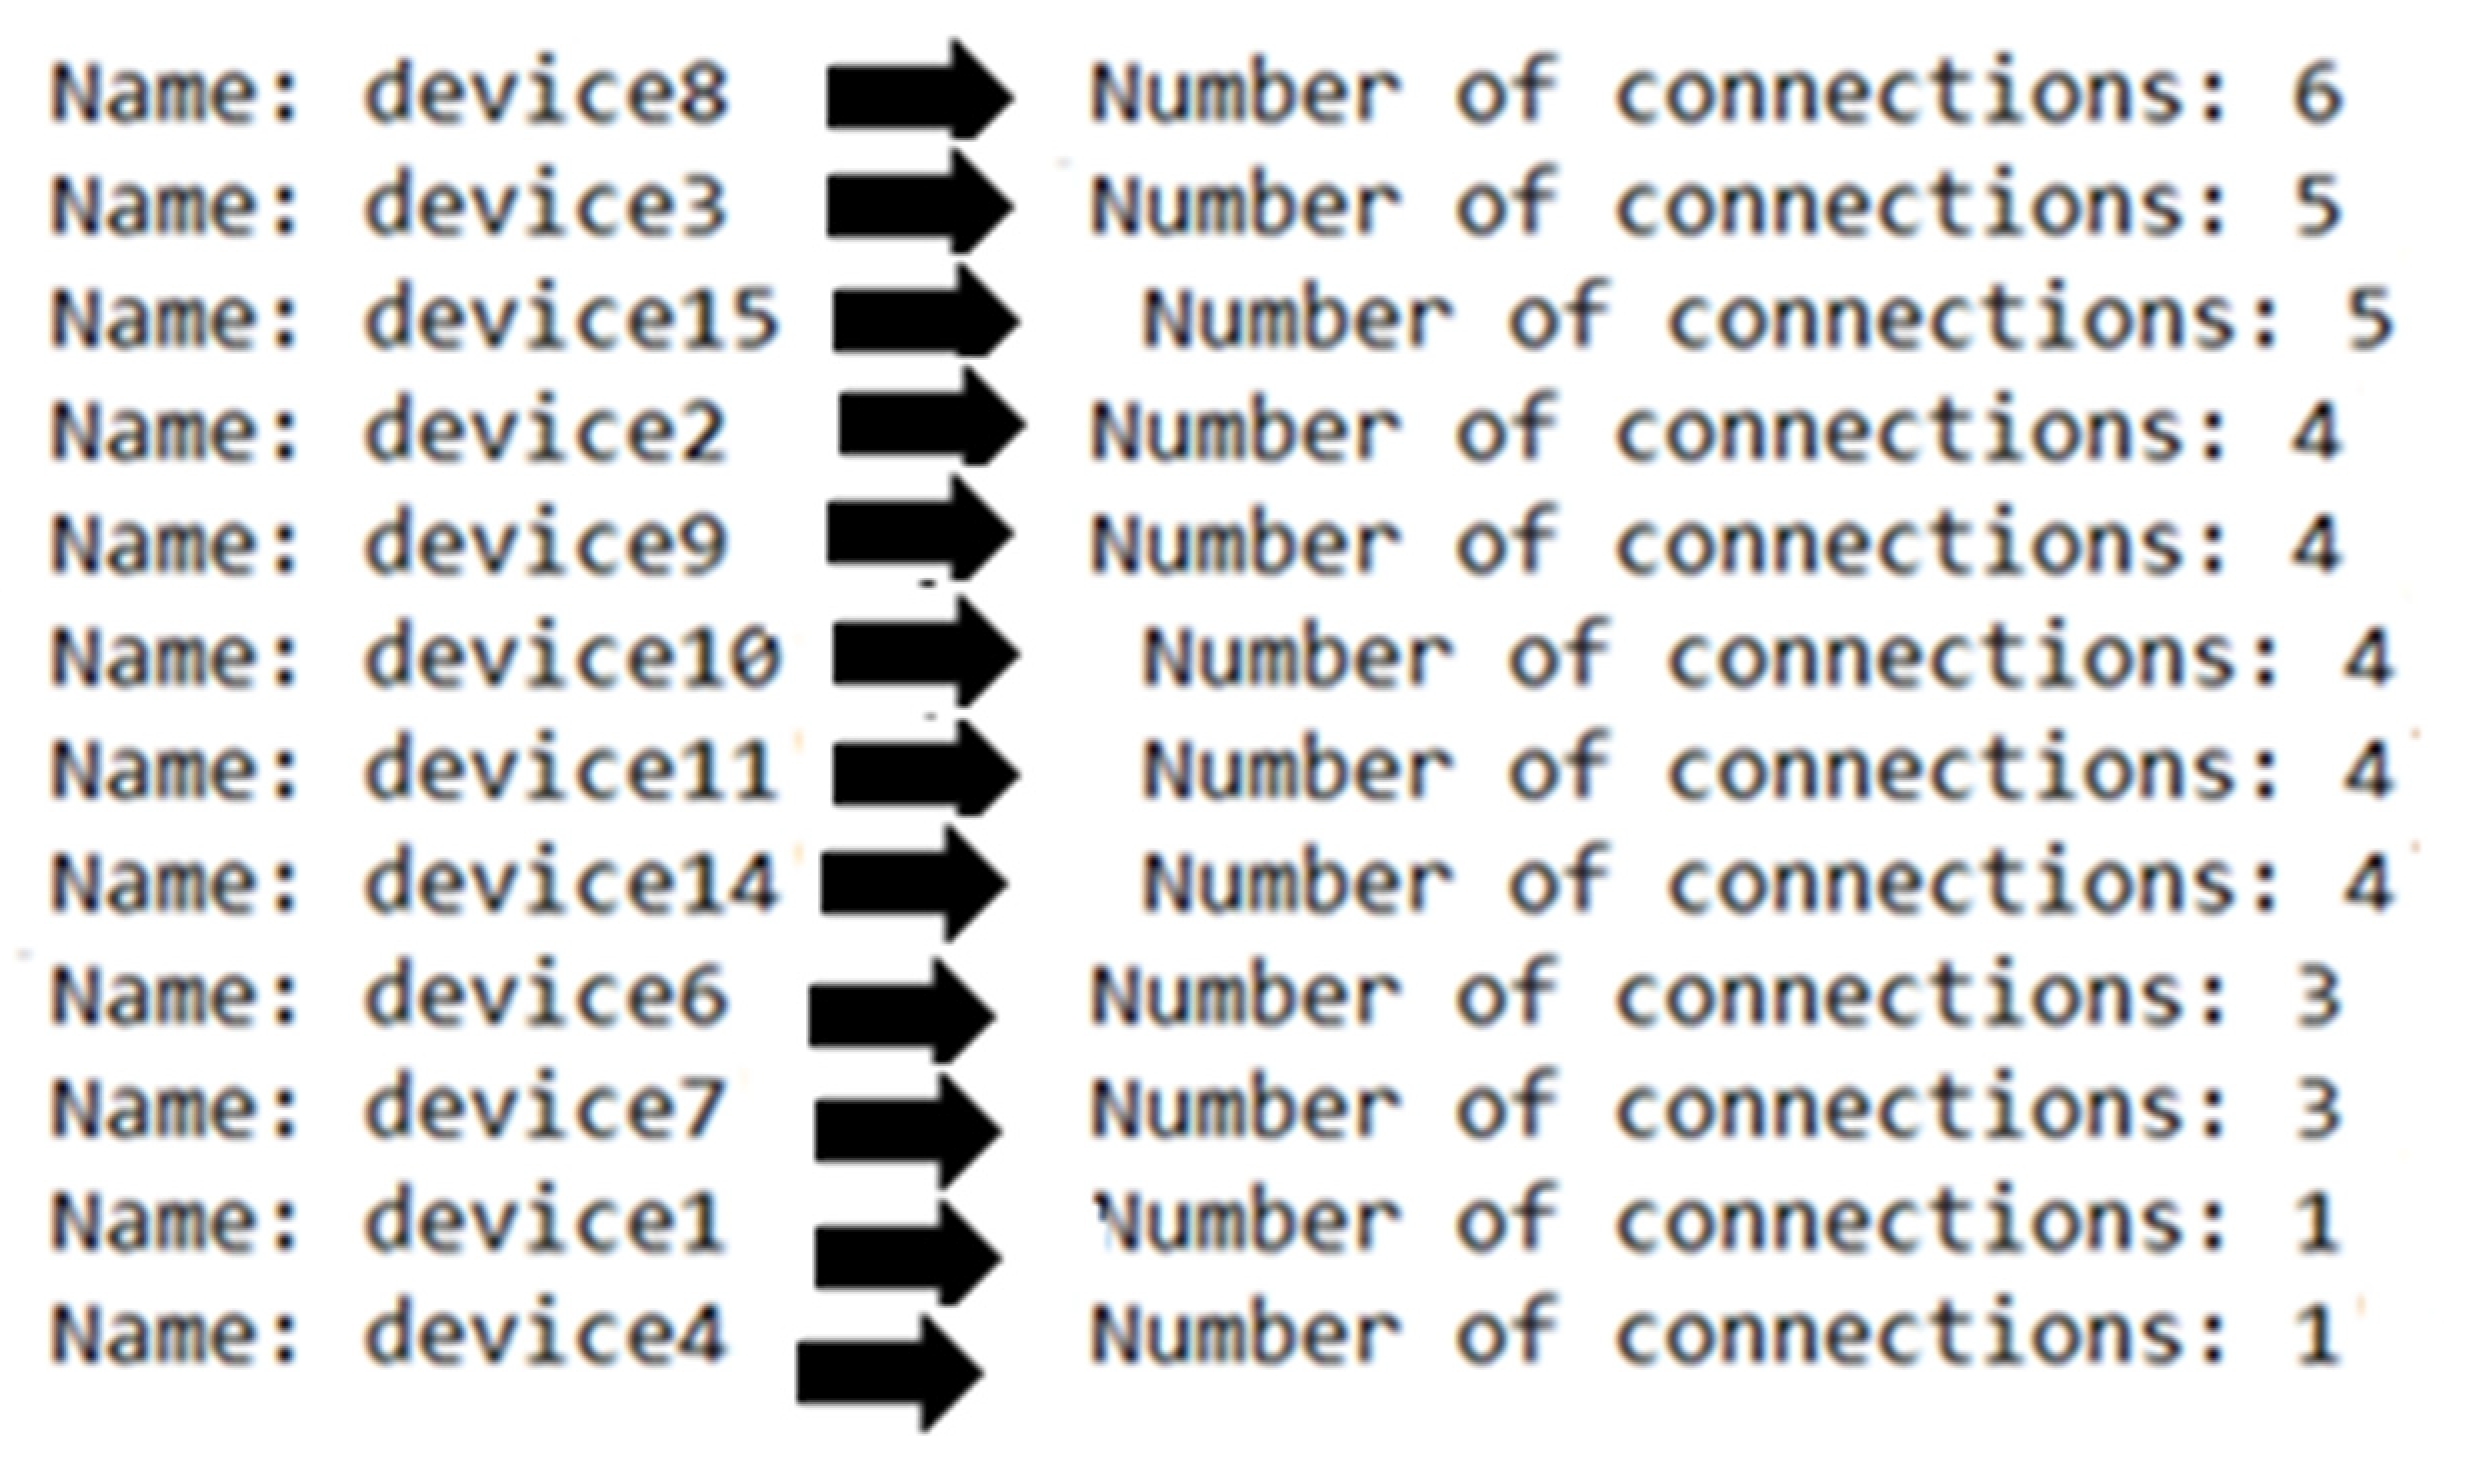
Figure 5.
Attack scenario when a generator is tripped.
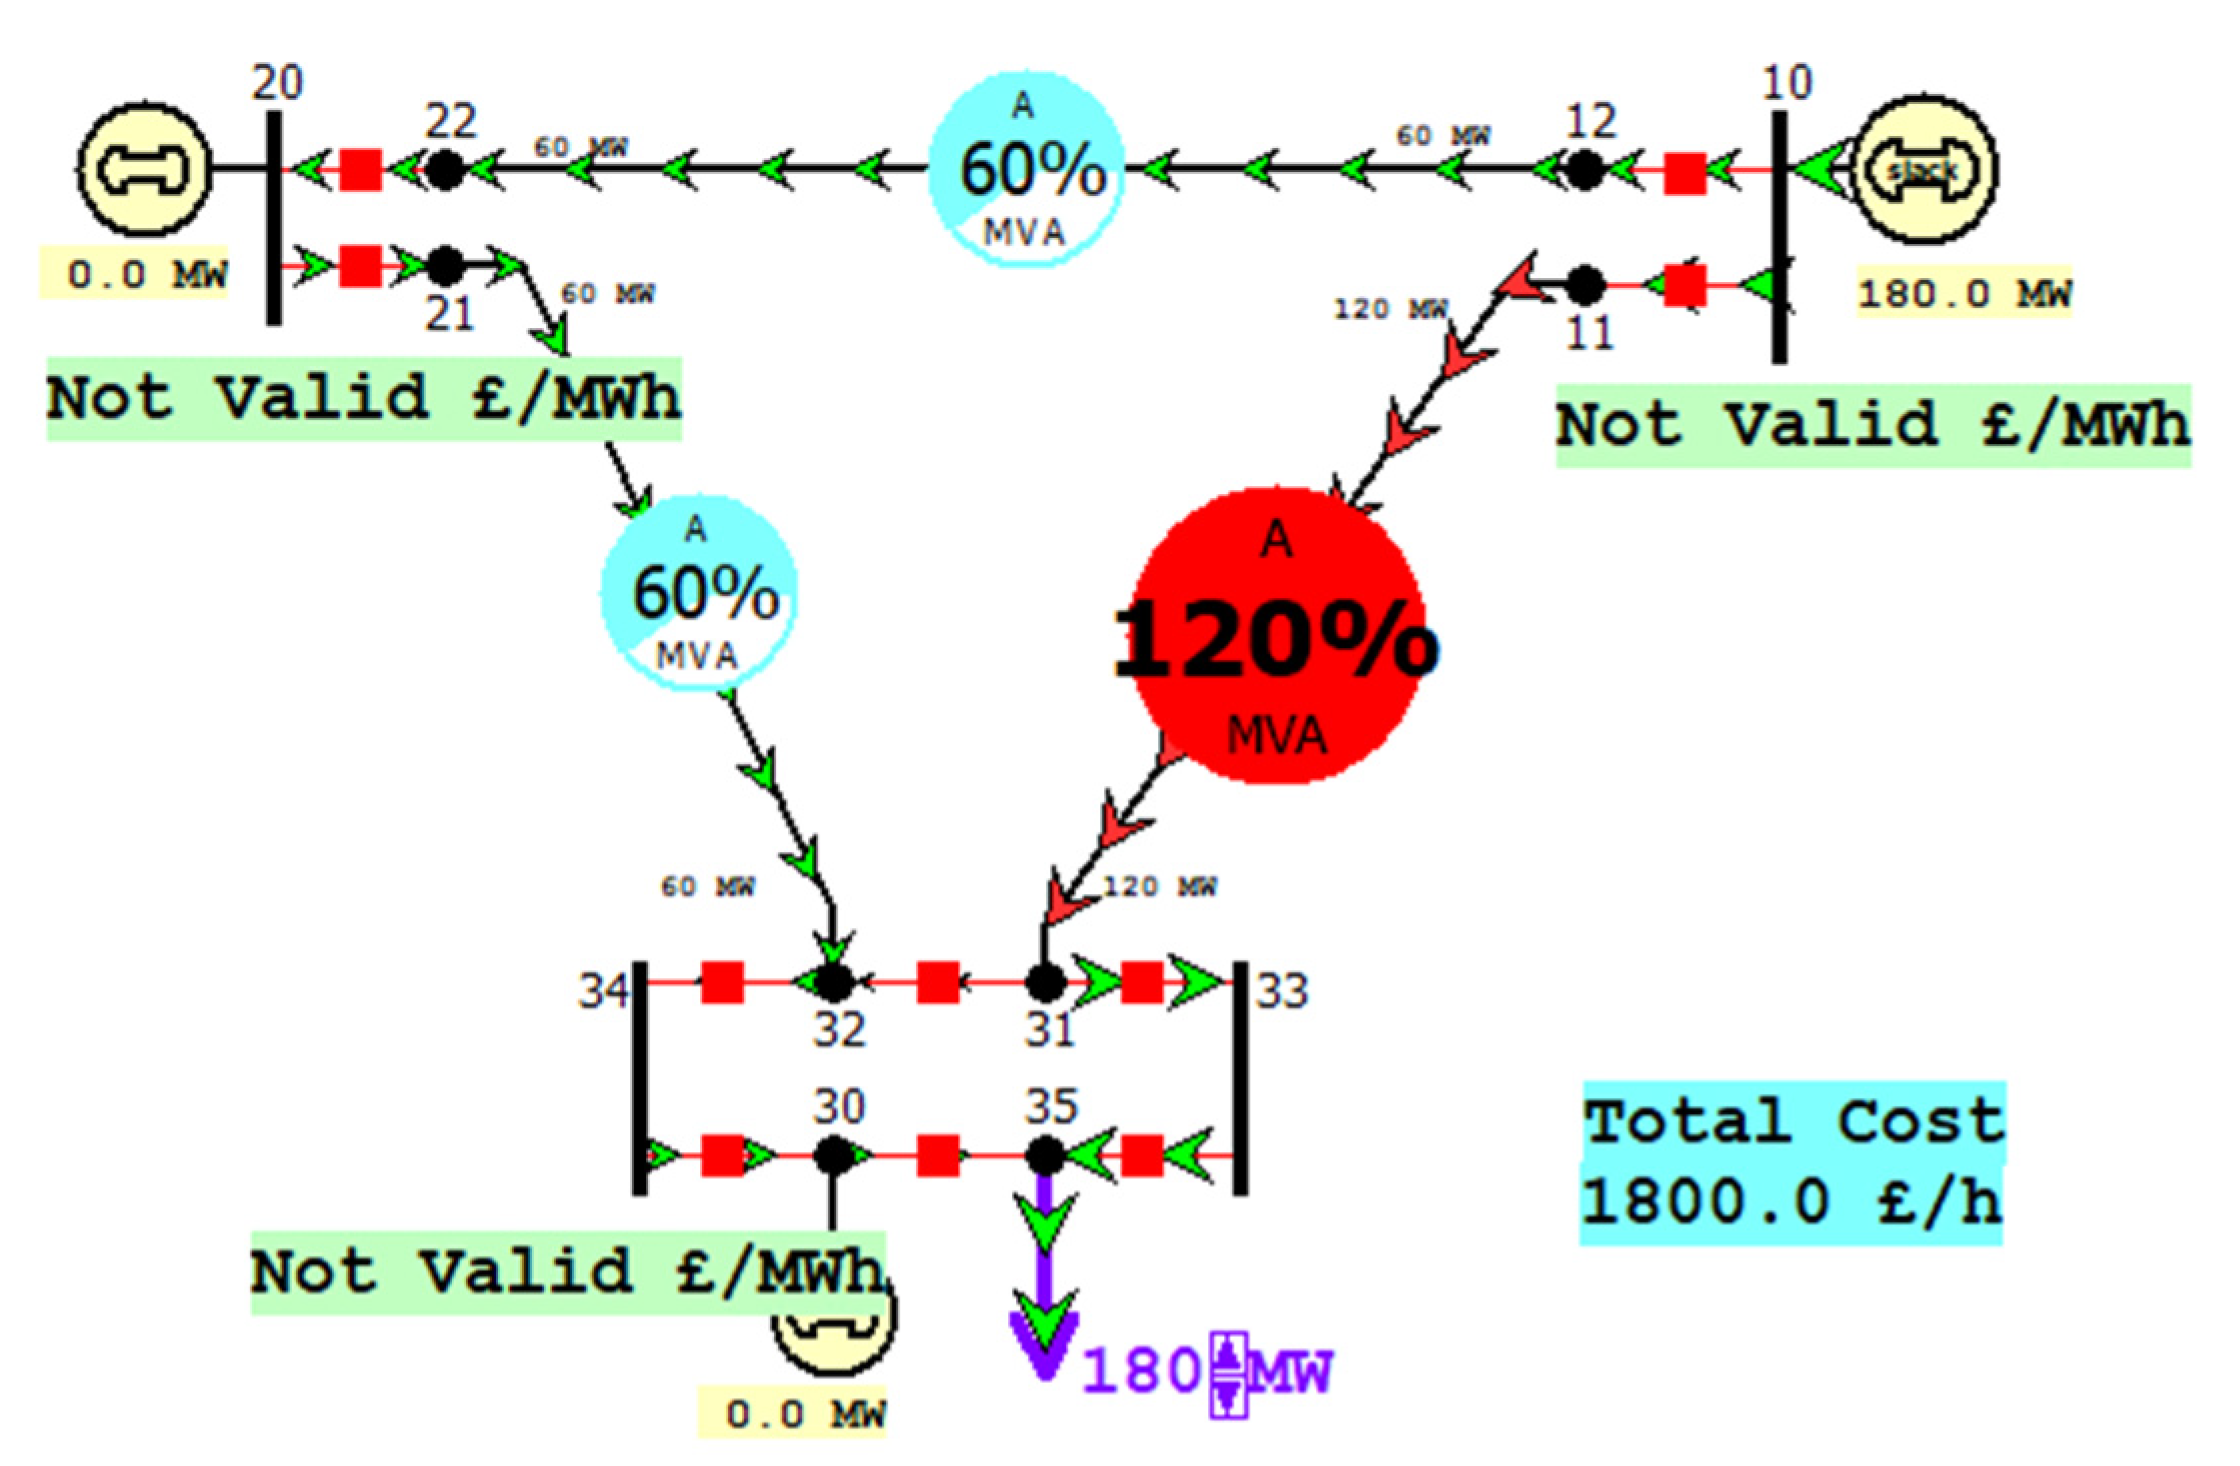
Figure 6.
Measurement values of transmission line under the normal scenario.
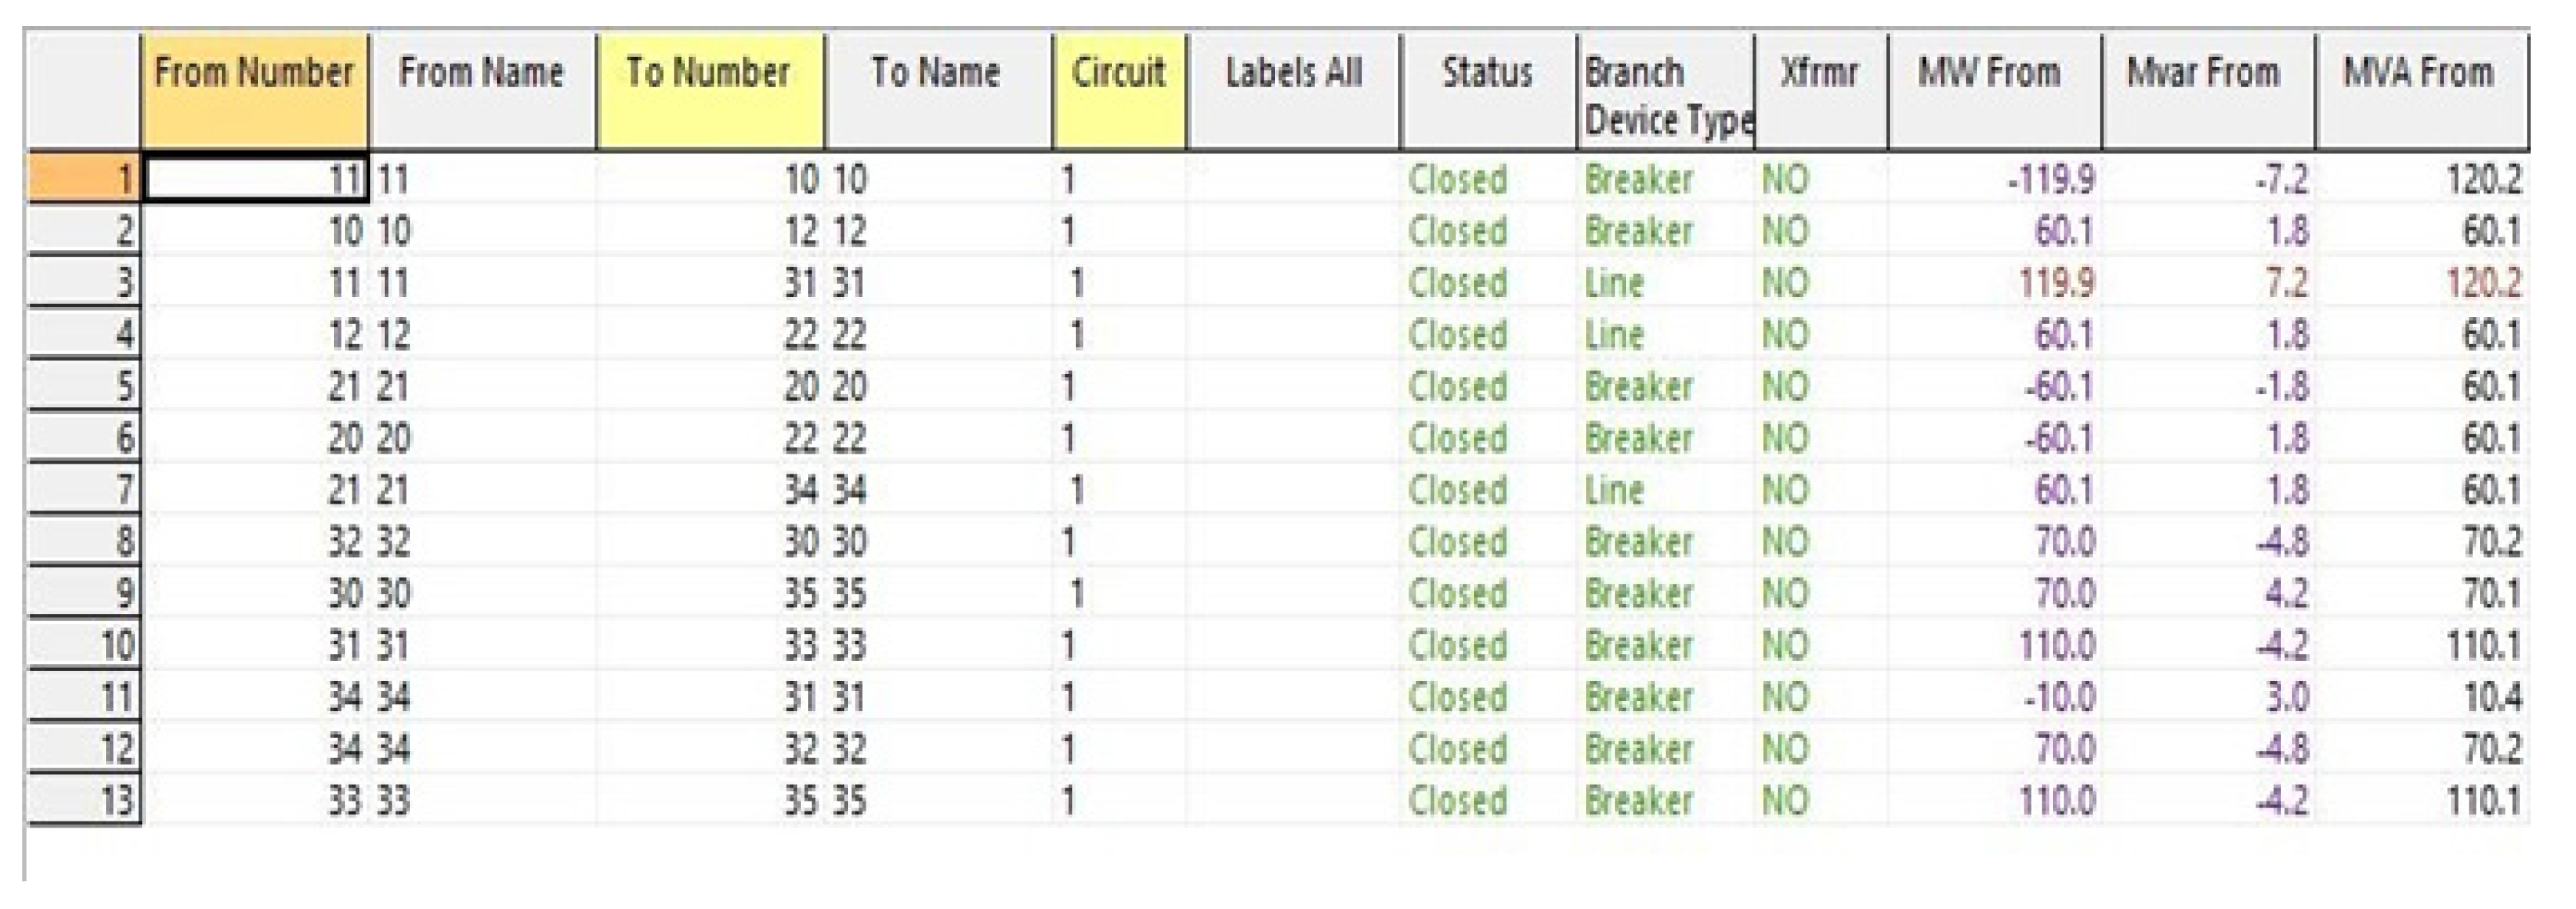
Figure 7.
Attack scenario when two generators are tripped.
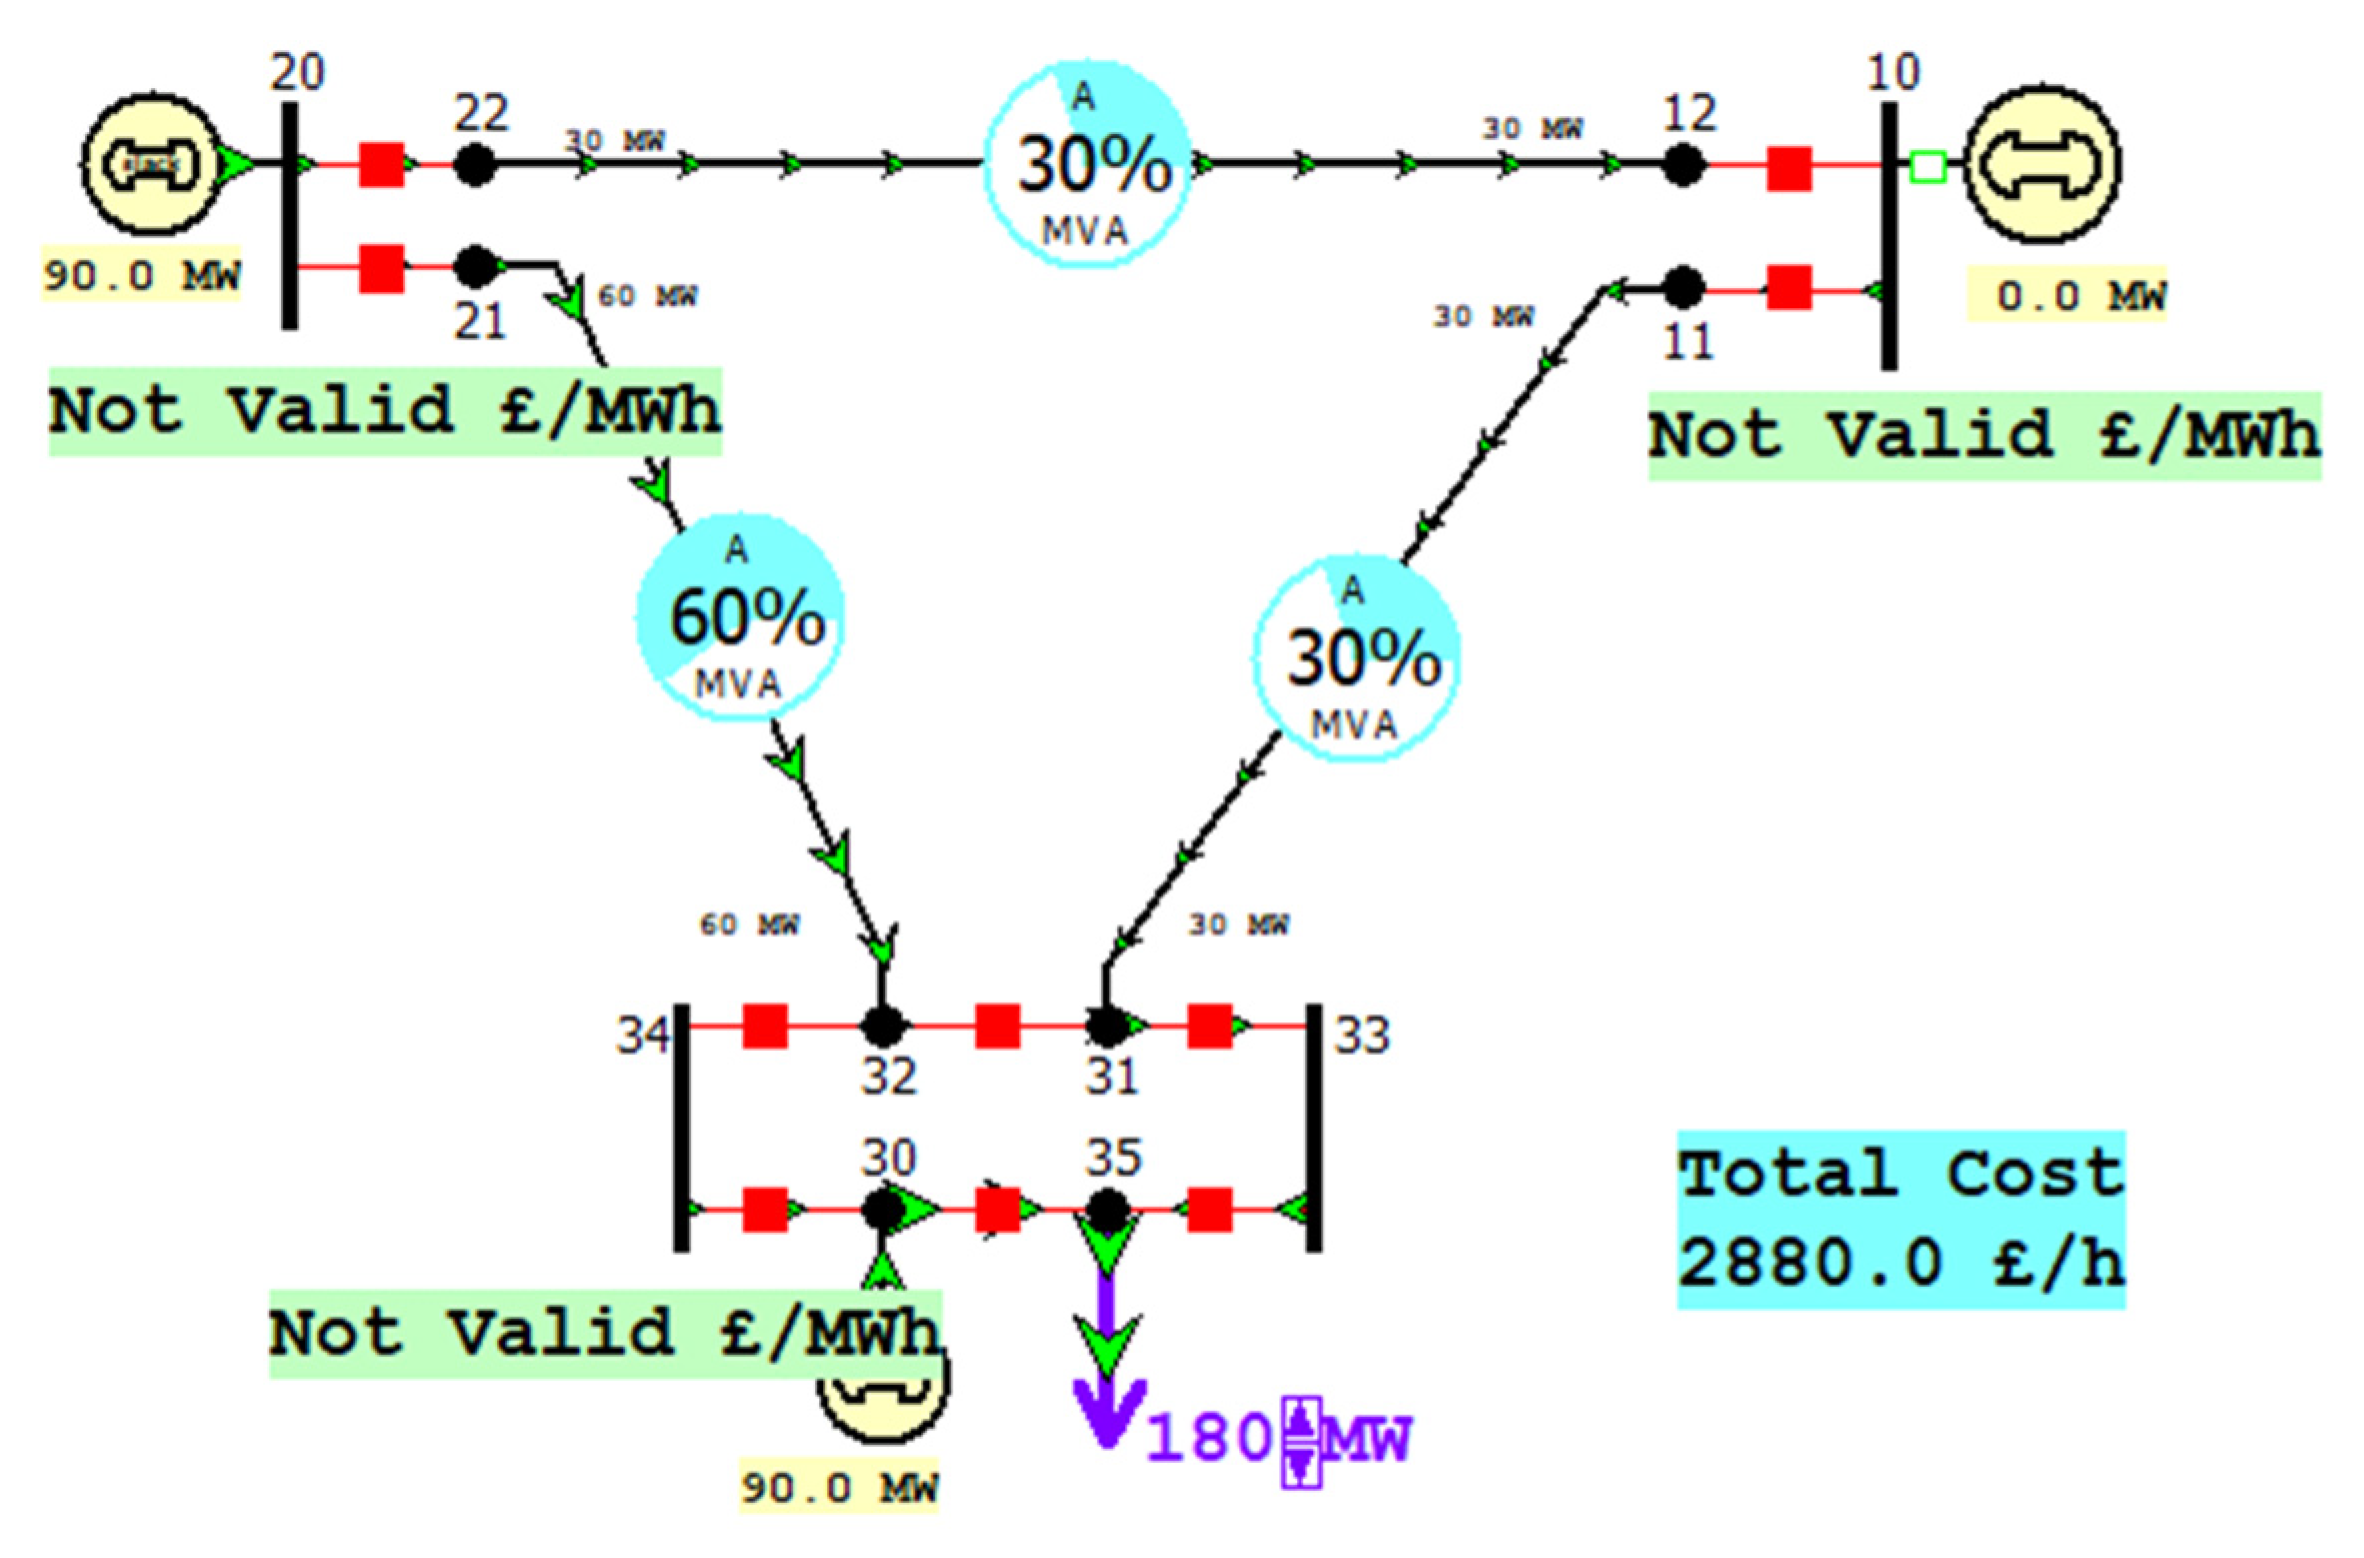
Figure 8.
Two circuit breakers under attack (tripped).
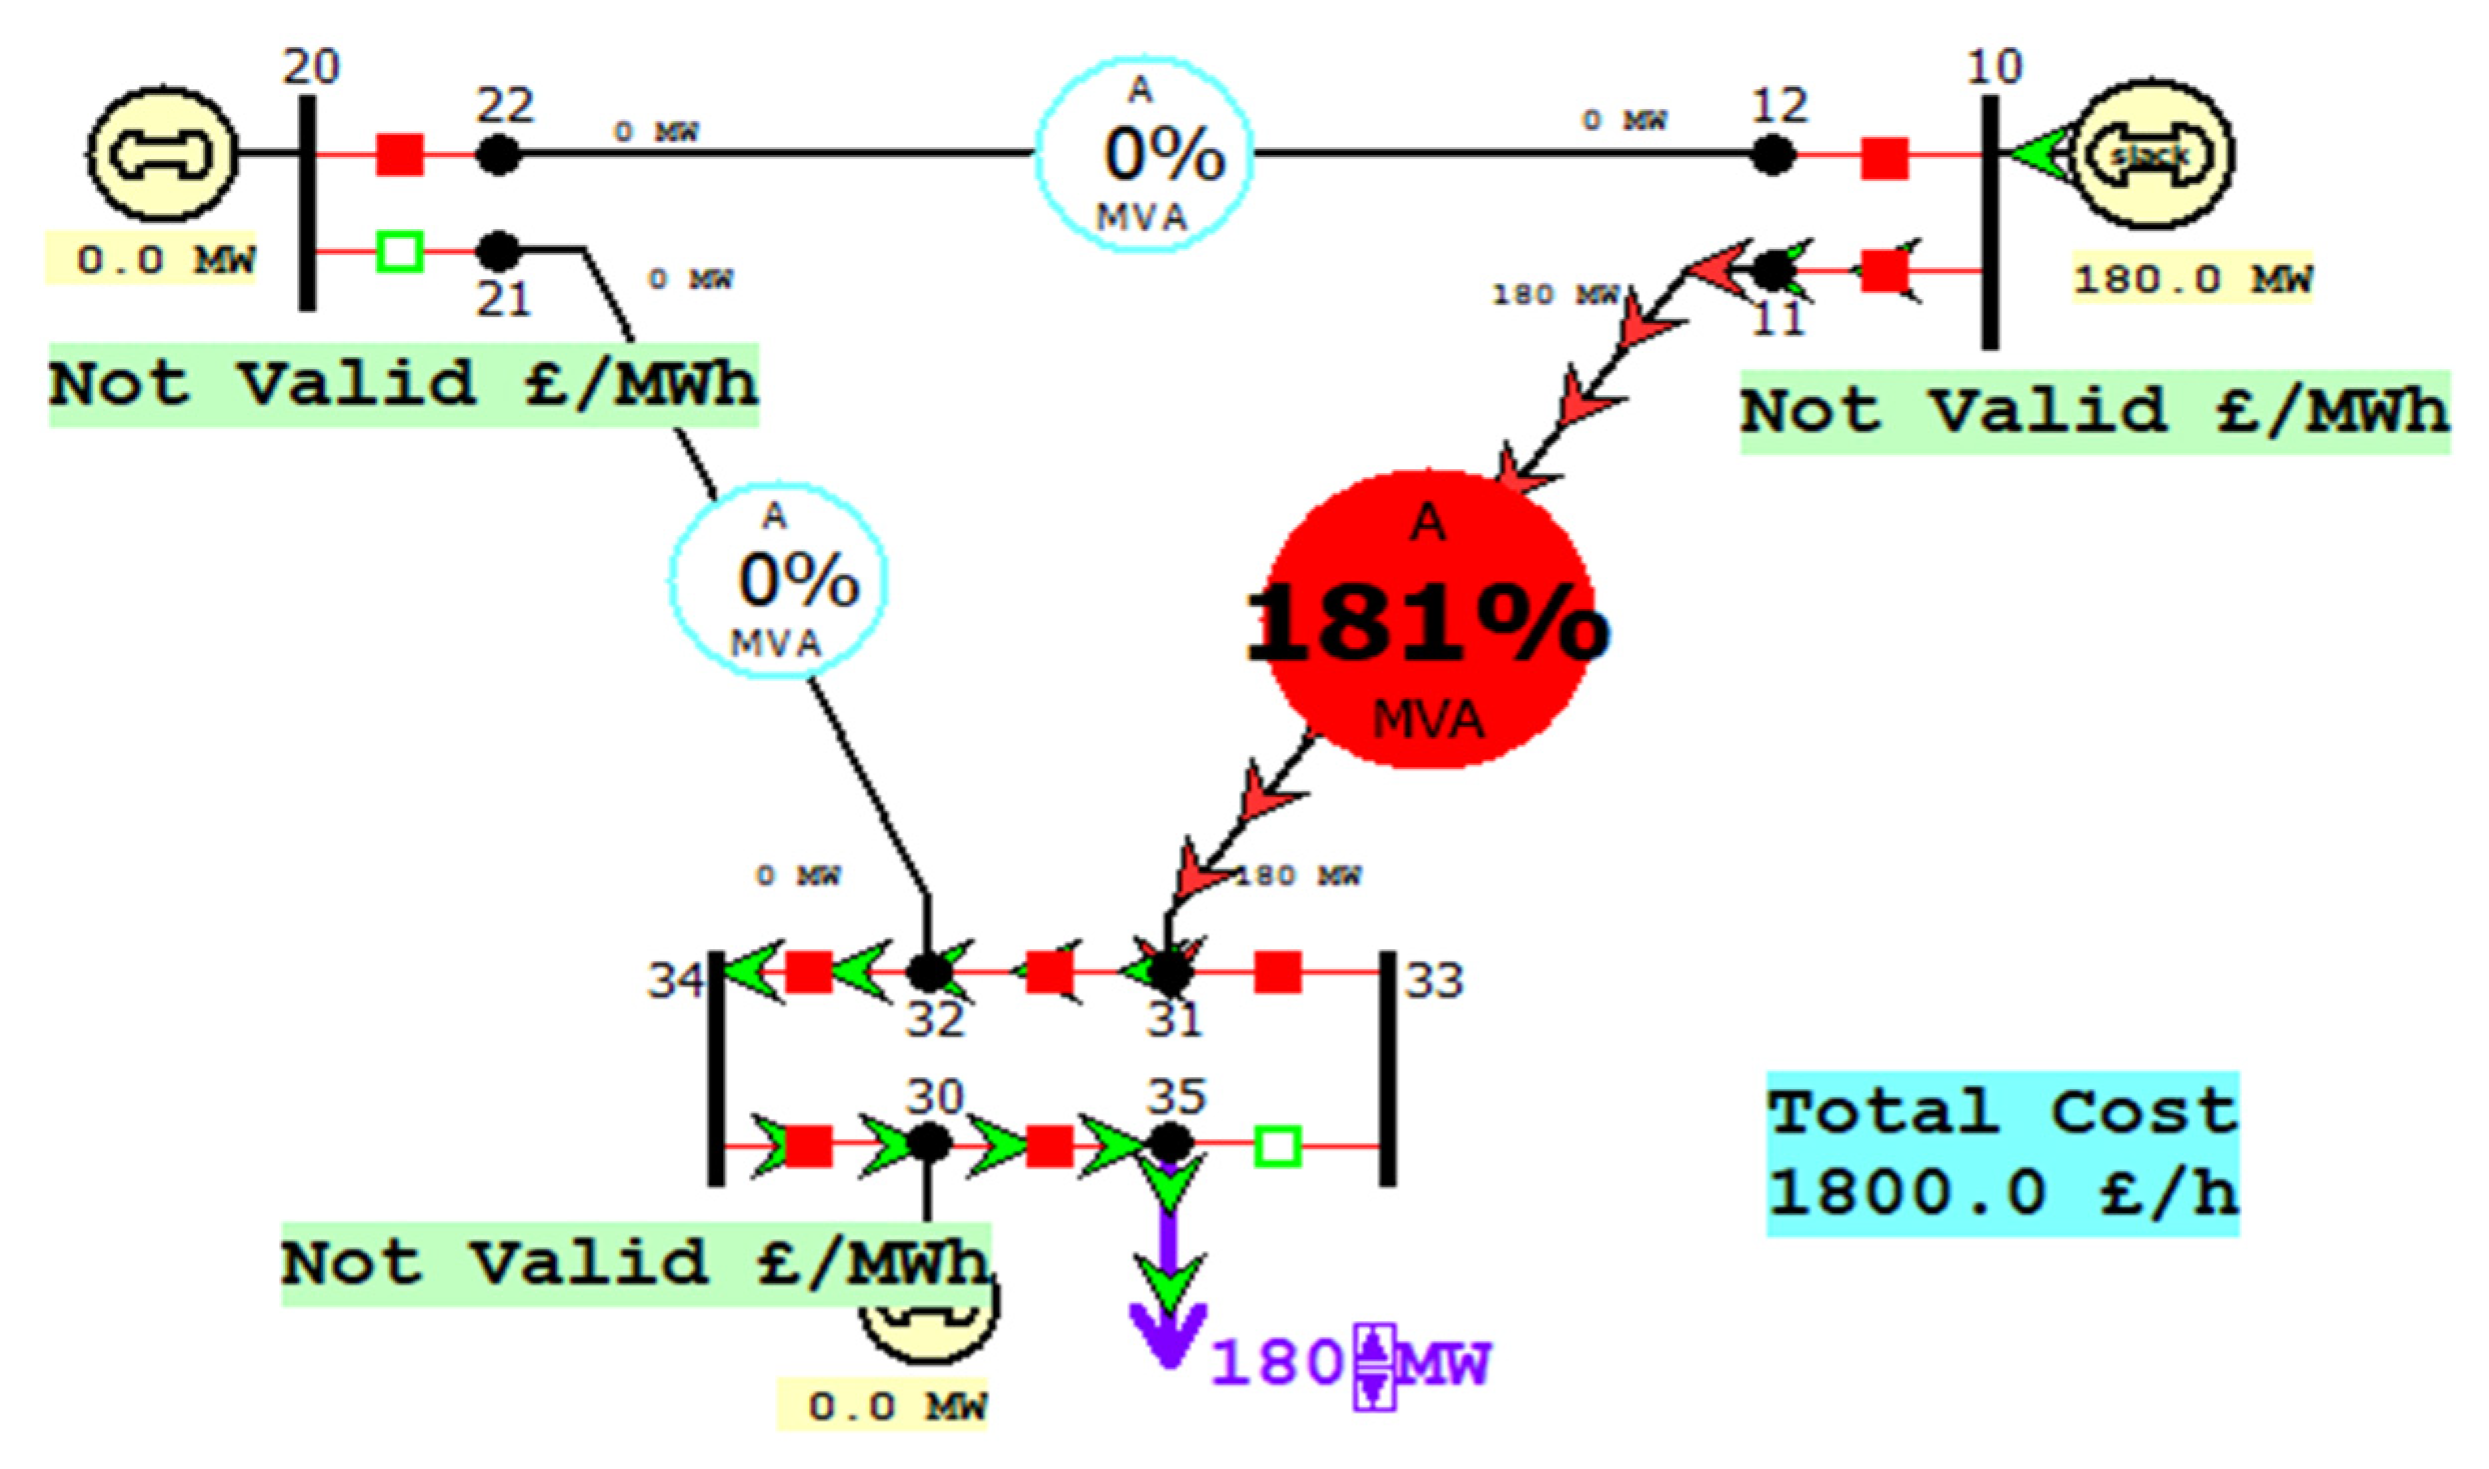
Figure 9.
Measurement values of the transmission line under attack scenario III.

Figure 10.
Trip a circuit breaker under attack in a 12-bus system.
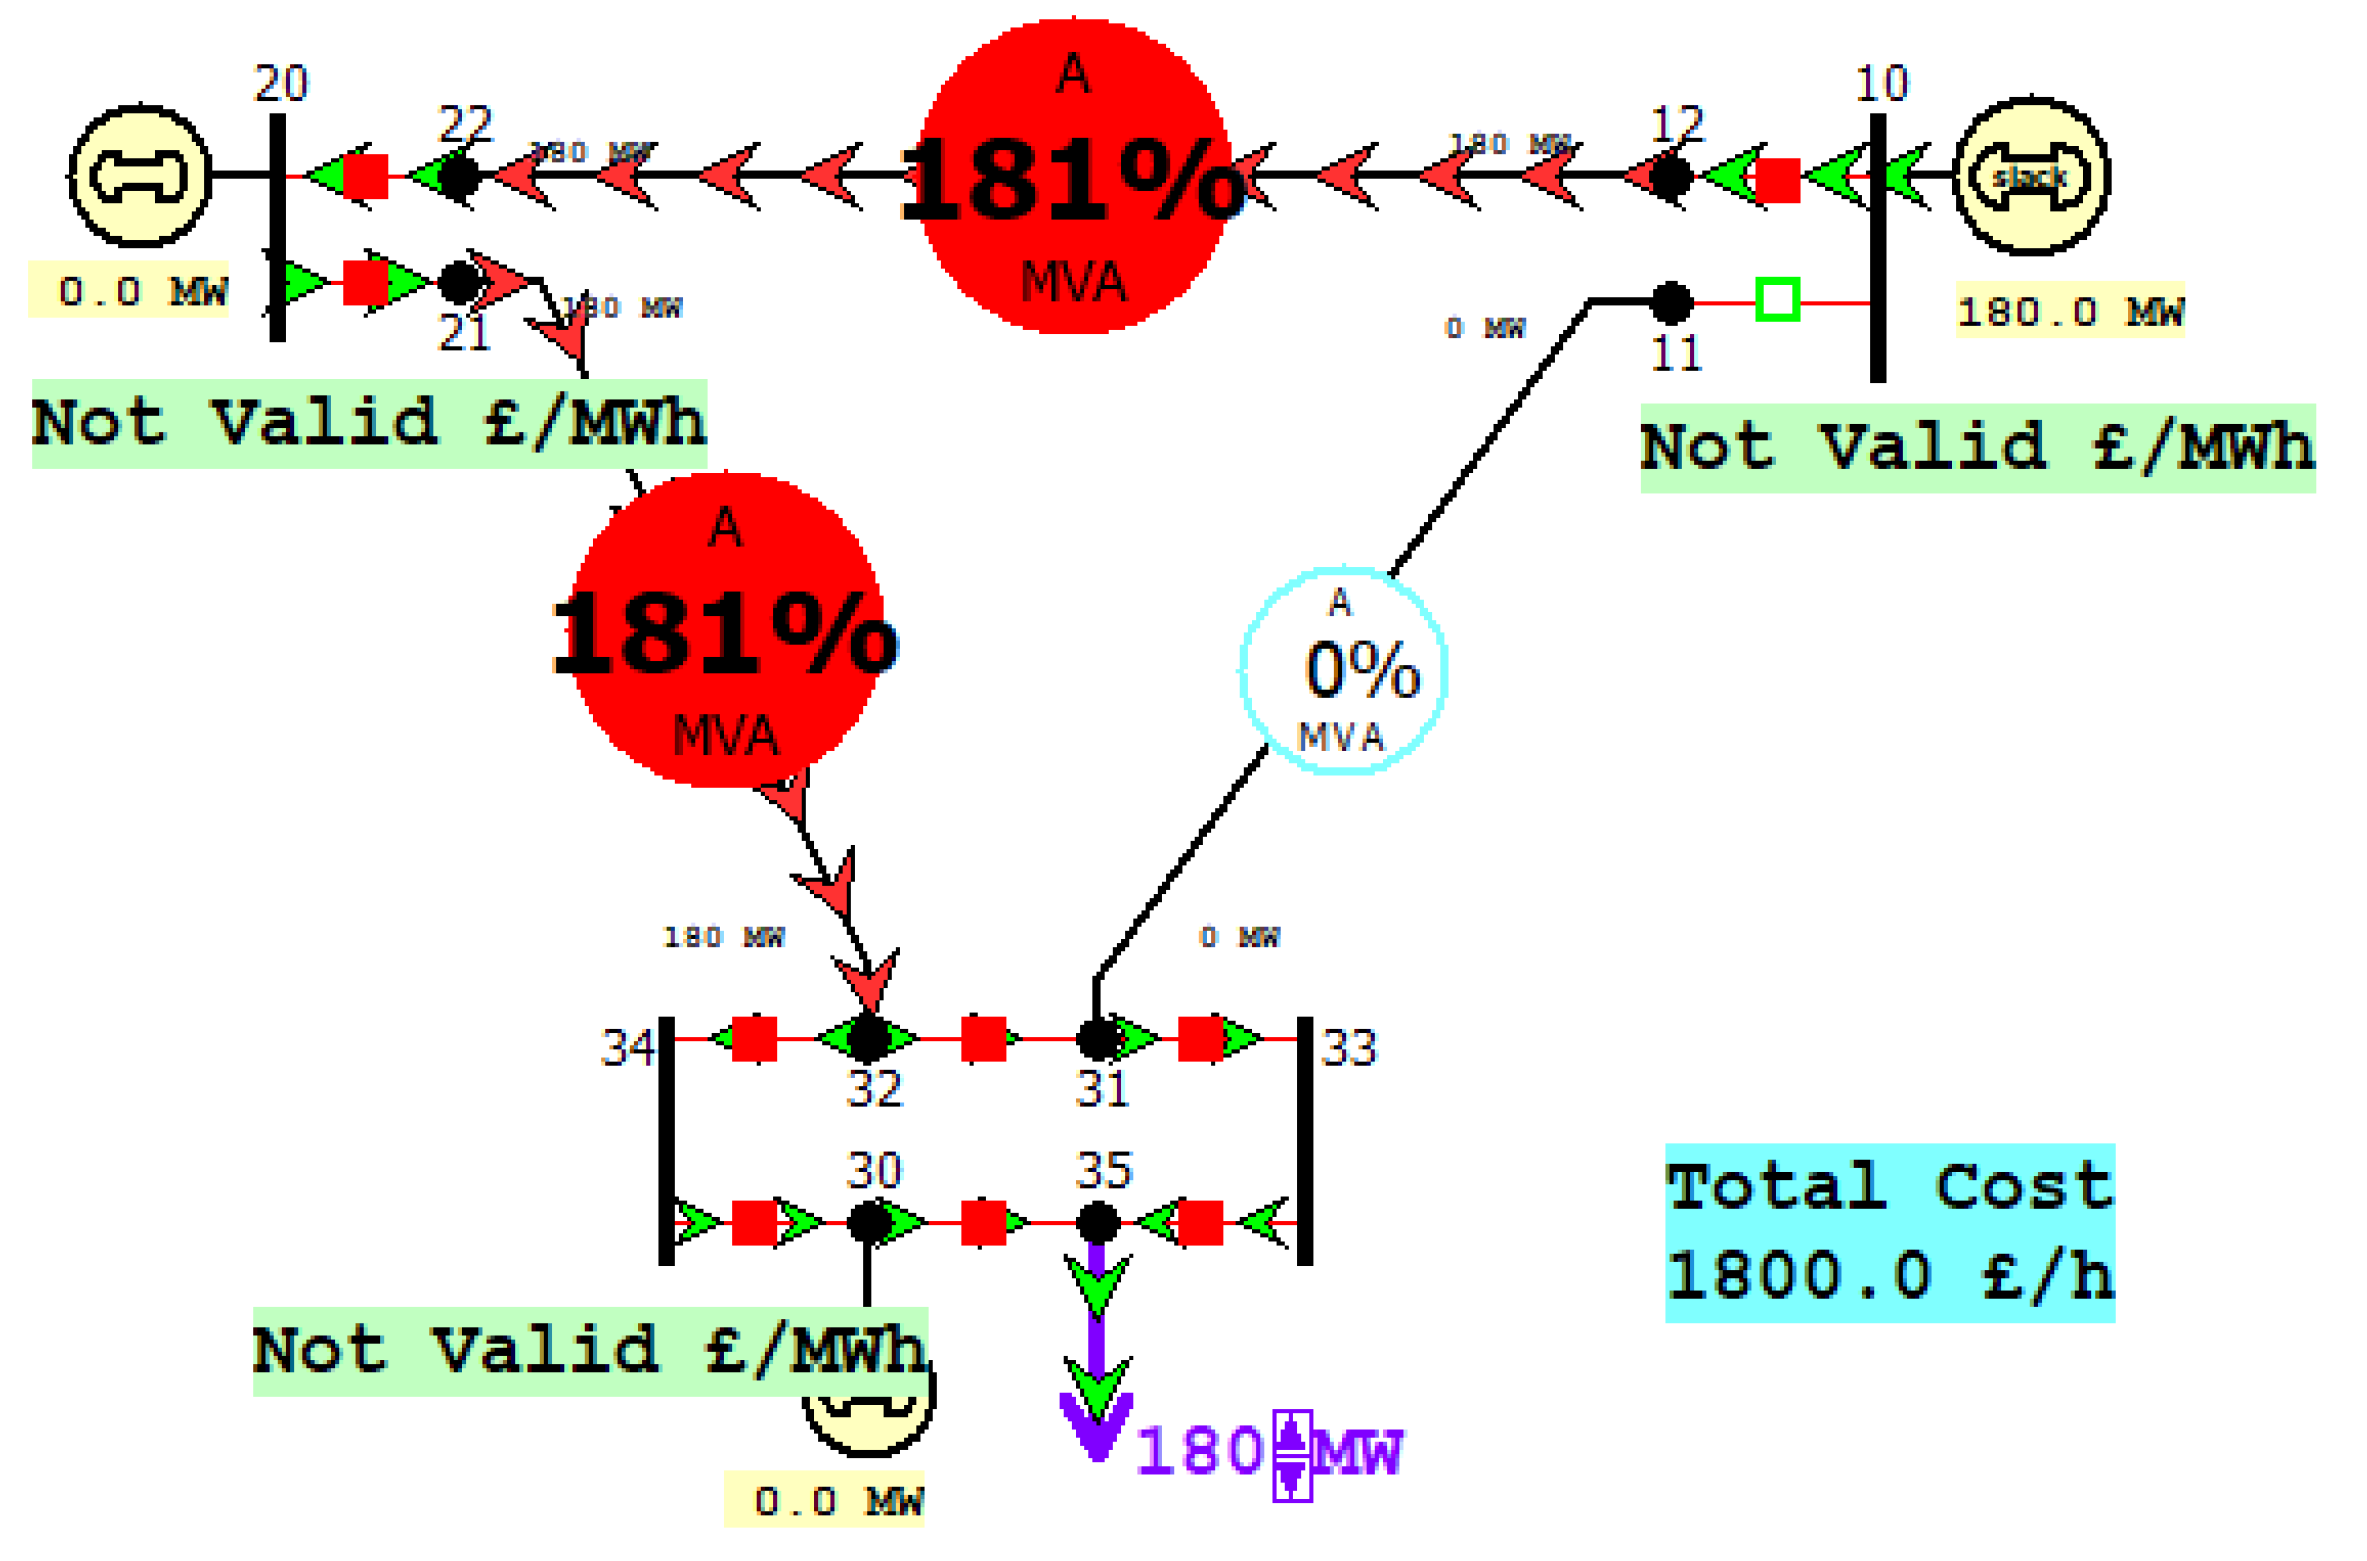
Figure 11.
Measurement values of the transmission line under attack scenario IV.

Table 1.
Existing Tools for Asset Discovery in ICS.
| Tool Name | Company | Pros | Cons |
|---|---|---|---|
| Tenable.OT [13] | Tenable | Complete visibility of assets and prioritised risk-based insights into vulnerabilities. | Unable to sort critical assets. |
| Axonius [14] | Axonius | Identify unmanaged devices and identify assets automatically. | Unable to show vulnerability level. |
| Scrutiny [15] | Bayshore networks | Have asset summary report and show network connections | Unable to show information of vulnerability |
| Claroty [16] | Claroty | Continuous threat detection and visibility of the asset management and show critical assets | Unable to rank risk assets. |
| Nozomi network [17] | Nozomi | Show information of all assets in the network and send you alerts when changes to hardware, software and devices occur | Unable to rank risk assets. |
| CyberX [18] | CyberX | Network topology diagram and information of assets and vulnerability management | Unable to rank risk assets. |
| AT&T security [19] | AT&T Business | Able to rank critical assets and vulnerability | - |
| Liu et al. [20] | Applied Risk | Show information of all assets in the network | Unable to rank risk assets |
| Shodan [21] | Shodan | Show information of all assets in the network | Unable to rank risk assets and unable to show information of vulnerability |
Table 2.
Existing Tools for Vulnerability Scanners in ICS.
| Tool Name | Company | Pros | Cons |
|---|---|---|---|
| Nessus [22] | Tenable | Fast scanning speed and high accuracy, and comprehensive vulnerability base | May causes DoS on SCADA system |
| Tenable.OT [13] | Tenable | Complete visibility of assets and prioritised risk-based insights into vulnerabilities. | Mostly focused on asset discovery and weak vulnerability |
| Nmap [23] | Nmap | Open source and comprehensive vulnerability base | May threaten the operation of the ICS/SCADA system. |
| Qualys Community Edition [24] | Qualys | The vulnerability library is powerful, and the interface is highly visible | Does not rank vulnerability |
| Wang et al. [23] | Rapid7 | Get a real-time view of risk and let people know which vulnerability is more important to focus on. | Weak vulnerability scanning capabilities |
| Zhou et al. [25] | Verve | Tech-enabled vulnerability assessment and real-time reporting | Does not rank vulnerability |
Table 3.
Existing Solutions for Asset Discovery in ICS.
| Author | Title | Pros | Cons | Gap |
|---|---|---|---|---|
| McLaughlin et al. [26] | The Cybersecurity Landscape in Industrial Control Systems | Rich basic knowledge introduction, a variety of detailed vulnerability scanning methods, clear steps. | Not much introduction about asset discovery. | No method for critical asset ranking. |
| Sulaiman [27] | ICSrank: A Security Assessment Framework for ICS | Rich basic knowledge introduction and clear data about ranking critical assets. | Not much information about vulnerability scanning. | - |
| West et al. [28] | Automatic Identification of Critical Digital Assets | Rich data of the way about the identification of the critical asset. | Not much information about vulnerability scanning. | No method for critical asset ranking. |
| Hart [29] | Continuous Asset Monitoring on the Smart Grid | Use continuous monitoring methods to discover key infrastructure equipment dynamically. | Not much information about vulnerability scanning. | No method for critical asset ranking. |
| Farzan et al. [30] | Cyber-related Risk Assessment and Critical Asset Identification in Power Grids | A variety of detailed vulnerability scanning methods and asset discovery, rich basic knowledge introduction, clear steps. | No method for critical asset ranking. | No method for critical asset ranking. |
| Abdulrazzaq et al. [31] | Industrial Control System (ICS) Network Asset Identification and Risk Management | Rich basic knowledge introduction about the critical asset and asset discovery. | No method about critical asset ranking and not much text about vulnerability scanning. | No method for critical asset ranking. |
| Audrey [32] | Ranking Critical Assets | The process of ranking critical assets is described in detail. | No information about asset discovery and no text about vulnerability scanning. | - |
| Boyer [33] | Identification and ranking of Critical Assets within an Electrical Gridunder Threat of Cyber Attack | Very detailed case analysis content. | Not much information about vulnerability scanning. | No method for critical asset ranking. |
| Adam et al. [34] | Automated Asset Discovery in Industrial Control Systems—Exploring the Problem | Rich basic knowledge introduction about the critical asset and asset discovery. | No method about critical asset ranking and not much text about vulnerability scanning. | No method for critical asset ranking. |
Table 4.
Comparison between the proposed method and related methods for ranking critical assets.
| Author | Approach | Context and Scoop |
|---|---|---|
| Proposed Method | Counting the number of connections each asset holds inside the cyber–physical smart grid to determine the most critical assets. | The proposed methodology was used with ICS assets and focused on cybersecurity threats targeting this system. |
| Beyza et al. [36] | A complex network theory to identify and rank critical assets in interdependent natural gas and electricity networks. | The proposed methodology focused on the physical level of the cyber–physical system and quantifying the performance under cascading failures. |
| Bhandari et.al [37] | A methodology for ranking bulk transmission assets for maintenance by quantifying the impact when a failure occurs. | The main context is on transmission lines that fall inside the same grid, and it focused on component failures and the operational health of the transmission assets. |
Table 5.
Notations and their Description.
| Parameter | Description |
|---|---|
| From Number, Name: | Represents the source bus of the power flow movement to the destination. |
| To Number, Name | Represents the destination bus for the power flow movement |
| Statutes: | The service status of the branch. |
| Circuit: | Used to differentiate between multiple lines linking the same two buses. |
| Brush/Device Type: | Represents the identifier for the type of branch. |
| Xfrmr: | Used to indicate if the branch is a transformer or transmission line. |
| MW: | Real power flowing into the line at the source bus. |
| Mvar: | Reactive power flowing into the line at the source bus. |
Publisher’s Note: MDPI stays neutral with regard to jurisdictional claims in published maps and institutional affiliations. |
© 2021 by the authors. Licensee MDPI, Basel, Switzerland. This article is an open access article distributed under the terms and conditions of the Creative Commons Attribution (CC BY) license (https://creativecommons.org/licenses/by/4.0/).
Share and Cite
MDPI and ACS Style
Liu, C.; Alrowaili, Y.; Saxena, N.; Konstantinou, C. Cyber Risks to Critical Smart Grid Assets of Industrial Control Systems. Energies 2021, 14, 5501. https://doi.org/10.3390/en14175501
AMA Style
Liu C, Alrowaili Y, Saxena N, Konstantinou C. Cyber Risks to Critical Smart Grid Assets of Industrial Control Systems. Energies. 2021; 14(17):5501. https://doi.org/10.3390/en14175501
Chicago/Turabian StyleLiu, Chenyang, Yazeed Alrowaili, Neetesh Saxena, and Charalambos Konstantinou. 2021. "Cyber Risks to Critical Smart Grid Assets of Industrial Control Systems" Energies 14, no. 17: 5501. https://doi.org/10.3390/en14175501
Note that from the first issue of 2016, this journal uses article numbers instead of page numbers. See further details here.