
Smart and Renewable Energy System to Power a Temperature-Controlled Greenhouse †


1
UR-LAPER, Faculty of Sciences of Tunis, University of Tunis El Manar Tunis, Tunis 1068, Tunisia
2
Department of Electrical and Information Engineering, Polytechnic University of Bari, st. E. Orabona 4, I-70125 Bari, Italy
*
Author to whom correspondence should be addressed.
†
This paper is an extended version of our paper published in 2020 IEEE-EEEIC International Conference on Environment and Electrical Engineering, Madrid, Spain, 9–12 June 2020; pp. 1–6.
Energies 2021, 14(17), 5499; https://doi.org/10.3390/en14175499
Submission received: 27 July 2021
/
Revised: 16 August 2021
/
Accepted: 31 August 2021
/
Published: 3 September 2021
(This article belongs to the Topic Electrothermal Modeling of Solar Cells and Modules)
Abstract
:This paper presents the modeling and simulation of a Multi-Source Power System (MSPS)—composed of two renewable energy sources and supported by a Battery Energy Storage System (BESS)—to supply the ventilation and heating system for a temperature-controlled agricultural greenhouse. The first one is a photovoltaic (PV) generator connected to a DC/AC inverter and the second one is a wind turbine connected to a Permanent Magnet Synchronous Generator (PMSG). The temperature contribution in the model of the PV generator is deeply studied. A Maximum Power Point Tracking (MPPT) control based on fuzzy logic is used to drive a SEPIC converter to feed the maximum power to the greenhouse actuators. The operation of the actuators (ventilation and heating systems), on the basis of the mismatch between the internal temperature and the reference one, is controlled by a PI controller optimized by fuzzy logic, for more robust results. The simulation of the system is carried out in a Matlab/Simulink environment and its validation is based on the comparison between the simulated and experimental data for a test greenhouse, located in the Faculty of Science in Tunis. The results show that the proposed system provides an efficient solution for controlling the microclimate of the agricultural greenhouse in different periods of the year.
1. Introduction
Electric energy generation systems based on renewable sources such as wind and solar are a valid alternative solution to fossil-fuel-based systems. Indeed, wind and photovoltaic systems have been booming lately and have become more and more accessible in terms of technologies and costs. Once installed, these systems can be independent of any source or network and have the advantage of being able to be positioned close to consumer sites.
A combined power system based on Renewable Energy Sources (RES) is an effective solution for controlling the internal climate of an agricultural greenhouse, because it can ensure the power necessary for its automatic operation [1,2]. Combined energy systems in different applications are known. Reference [3] presented a wind–PV generator coupled with a DC load, while [4] developed a model of a PV–wind system implemented in Matlab/Simulink. Reference [5] focused on the converter design, while [6] presented a design of a controller for the energy sources. In addition, it is necessary to monitor efficiency over time to promptly detect malfunctions before failures occur. A PV system can be easily monitored if it is equipped with a datalogger that stores the electrical parameters [7,8]. In the absence of a datalogger, the correct operation of PV systems can be checked using infrared analysis [9] and/or simulation tools [10,11]. Renewable energy is largely used in the industrial sector. For example, the authors in [12] developed a combined energy system for vehicle control, whereas other researchers presented a ventilation system of an agricultural greenhouse powered by a photovoltaic generator [13], or a control strategy for the indoor air temperature [14]. The agricultural field is nowadays an important target for researchers due to global warming, the necessity of water for cultivation, and the necessity of a good microclimate inside greenhouses. According to the Food and Agriculture Organization of the United Nations, food production has increased by more than 100% in the last 30 years and a further 60% increase is expected by 2050 [15,16]. For these reasons, many researchers are also focusing on the electrical issues of agricultural greenhouses; in fact, to guarantee a correct microclimate for the crops grown, electrical equipment (motor for ventilation/heating and/or water pumps) is needed. Proposed solutions are often based on a combination of power sources, supported by techno-economic analyses [17,18,19]. Sometimes a diesel motor is considered [17], but often a total renewable energy system is preferred [18,19]. An interesting review of solar technologies in agricultural greenhouses is available in [20]. The choice of power source is the first step, but their management [21,22] and optimization [23] is also important.
This paper focuses on the possibility of supplying the electricity requirements of an agricultural greenhouse by means of renewable energy sources in order to make it autonomous from the point of view of energy. As greenhouses require fixed temperatures during the day and the night, the electrical actuators must be active for the whole day, even if not at the same time. Therefore, the choice of photovoltaic system alone is not ideal because it should produce the energy necessary for the whole day in a few hours, the amount of which would vary during the year; hence, it should be sized for the worst-case scenario, which is winter. Furthermore, even the choice of wind power plant alone is not ideal, due to the great unpredictability of the wind; therefore, it must be sized for the worst case, which is a day with little wind. This implies that an optimal solution consists in a combination of several energy sources, possibly chosen from renewable energy sources. However, the combination of multiple power sources requires more complex control of the energy flows between the sources and loads. For these reasons, this paper proposes a combined wind–PV power supply system for a temperature-controlled greenhouse. The heating and ventilation system to maintain the temperature constant is driven by a fuzzy MPPT strategy. Energy consumption is reduced by coupling a photovoltaic system with a wind generator. This approach offers a good solution in any period. Moreover, the power delivered by the RES system is enough for the operation of the different actuators of the greenhouse. This context is explained by the presence of wind energy when there is no photovoltaic energy; especially during cold periods (night), the greenhouse requires a more intensive heating rate. The agricultural greenhouse is placed close to the sea; thus, the high wind speed allows for a great production of wind energy. Temperature has a double role. It affects the operation of the PV system, because the power produced by the PV modules depends mainly on the irradiance and temperature. Moreover, a fixed temperature value inside the greenhouse is the target for a good microclimate for cultivation. Great attention is then paid to the thermal contribution in the modeling of the photovoltaic cell. The power system is also equipped with a Battery Energy Storage System (BESS) that support the PV–wind system, when the load demand exceeds the produced energy, as happens during the night, because only the wind plant works. Due to the presence of the BESS, the control system needs to define the constraints for charging and discharging the battery, considering the bidirectional energy flows from and to the battery. Control of the actuators is the main point of interest of this paper with respect to the state of the art. Further details can be found in Section 3.2 and in the results. Control of the ventilation and heating system is done using a PI controller Optimized by Fuzzy Logic (PIOFL) strategy. In the literature, several researchers have used on/off control for agricultural greenhouse actuators, but this strategy is not convenient for this type of system, because it reduces the life of the actuators and is more expensive from an energy point of view. Instead, the proposed control works better, because the speed variation is continuous and avoids successive starting/stopping of the motors. In summary, the paper is constituted by two main parts: the power sources and the control. The choice and size of the power sources is better described in [1], of which this paper is an extension. Instead, the control part represents the main contribution of this paper.
The paper is organized as follows. The modeling of the main components constituting the global system, including the BESS and the greenhouse modeling, is presented in Section 2. The control strategy of the combined energy systems and of the heating/ventilation system is described in Section 3. The simulation results are discussed in Section 4, whereas the final section contains the Conclusions.
2. Modeling of the Energy System
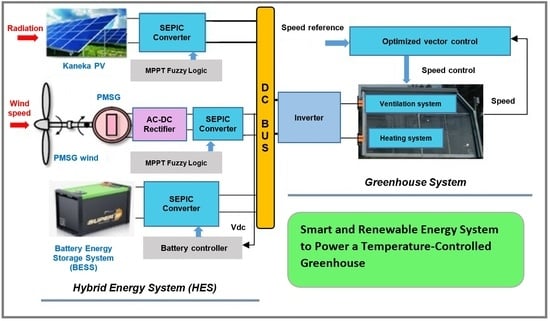
The proposed energy system is composed of a photovoltaic generator based on KANEKA GSA060 PV modules, a wind generator, a storage system battery bank, SEPIC converters controlled by a fuzzy MPPT strategy, and an inverter. They are wired with a ventilation and heating system composed by an asynchronous motor, controlled by a vector control optimized by fuzzy logic. The main scheme, implemented in the Matlab/Simulink environment, is shown in Figure 1.
The proposed model is based on a real experimental energy system, available in the Faculty of Sciences in Tunis, and it is described in Section 2.7. The following subsections describe the model of the components of that real system. Particularly, Section 2.1 models the PV cell and module, highlighting how to account for the influence of temperature on the several components.
2.1. Model of the PV Generator
A PV module is composed of several PV cells connected in series to increase the value of the total voltage, and several PV modules can be connected in parallel to increase the value of the total current. The single diode model of a PV cell is shown in Figure 2, where Rs and Rsh are the series- and shunt-resistors.
According to the LKC in the upper node in Figure 2, it results:
where Iph is the photodiode current, later defined.
The current passing through the resistor IRsh is given by:
K: Boltzmann’s constant (1.381 × J/K);
Tc: absolute cell temperature in Kelvin;
q: electron charge (1.602 × C);
: constant (1.2 A/);
: band energy gap (for crystalline silicon = 1.12 eV);
n: diode ideality factor.
By grouping the previous equations, the current–voltage (I–V) curve is:
Iph can be extracted from the Short-Circuit (SC) condition. In fact, the ISC current is the maximum current generated by the cell. It is produced when V = 0. From (6) and remembering that , it results Iph ≈ ISC.
All the parameters are affected by the solar radiation G and the air temperature Ta. Therefore, Equation (6) and the values of Rs, Rsh, n, Is, Iph are valid for a fixed environment condition. Moreover, these values are not available in manufacturer datasheets of the PV modules in any condition, because these other specifications are available: rated peak power (Pn), open-circuit voltage (Voc), short-circuit current (Isc), voltage and current in MPP (Vmpp and Impp), temperature coefficient for the short circuit current (, and temperature coefficient for the open circuit voltage . Moreover, these values regard the whole PV module and not the single PV cell. Nevertheless, the number of series- and parallel-connected PV cells is usually available in the PV module datasheet, thus cell voltage and current are:
with Ns the number of series-connected cells and Np the number of parallel-connected cells. Finally, to compare the performance of several PV modules, the declared values are evaluated under standard test conditions (STCs), i.e., G = 1000 W/m2, Ta = 25 °C, air wind of 1 m/s and air mass of 1.5. Instead, the nominal module operating temperature (NMOT) is defined for 800 W/m2 and cell temperature Tc = 20 °C. The NMOT verifies the following equation:
In summary, the circuit of Figure 2 is valid after calculating the parameters in the operating condition, i.e., under the actual solar radiation and air temperature. Therefore, the photodiode current depends on both G and Ta:
where Gpu = G/1000 is the irradiance normalized to the STC value, is the short circuit current at STC, is the current-temperature coefficient at STC, ΔT = (Tc − 25) is the temperature difference with respect to the STC.
Analogous expression of Equation (10) is valid for Impp:
The second term in Equation (6) depends on the dark saturation current, Is, which in turn depends on the cell temperature (see Equation (4)), but also on the series resistance Rs. Thus, it can be represented as:
where is the open circuit voltage in STC, while the parameters β and γ will be calculated later. Equation (12) highlights the temperature dependence of the Voc [25]:
Since Vmpp and Voc differ by less than 15%, the following is also valid:
The third term of Equation (6) considers the dissipative phenomena [26] inside the PV cell, by means of the series- and shunt- resistors. As better explained in [27,28,29], Rs defines the slope of the I–V curve in open-circuit state, while Rsh defines the slope in short-circuit state; their values can be approximated as:
Now, substituting Equations (10) and (12) in (6), and considering (15)–(16), it results:
Parameters β and γ are calculated [28], imposing the constraints at the three characteristic points: short-circuit state, open-circuit state, and the maximum power point. Their values are:
where .
These parameters depend on both the irradiance and the air temperature, so they can describe each operating point, whatever the environmental condition. Figure 2, after the mathematical manipulations, becomes as in Figure 3, where the contributions of irradiance and temperature are highlighted. ΔT is modelled with two series-connected voltage sources, and it controls four voltage-controlled sources: and (with the coefficient ), and and (with the coefficient ). The resistance G represents the solar radiance. In particular, the term of Equation (18) is calculated with a current divider. The circuit in Figure 3 models a single PV cell, but it can be used for a PV module by using Equations (7) and (8).
2.2. Model of the Wind Turbine
The wind turbine system is composed by a wind turbine, a PMSG and an AC/DC rectifier. The wind turbine power, pw, is described by the equation:
where ρ = 1.225 Kg/m3, R is the radius of the wind turbine, β is the pitch angle, Cp is the power coefficient, Vw the wind speed, and λ symbolizes the tip speed ratio defined by:
with the angular velocity of the wind turbine rotor.
The mathematical model of the most used PMSG generator in the wind turbine is described by the following differential equation in the (d,q) reference [30]:
The electromagnetic torque is defined as [31]:
The electrical angular speed ωe depends on the number of pole pairs P, whereas the mechanical angular velocity ωturb satisfies the equation:
Many types of rectifiers are used in the wind system. The PMSG is connected to a three-phase non-controlled rectifier. The PMSG electrical behavior is described by the following equations [32], VDC being the DC output voltage:
2.3. Model of the Battery Energy Storage System
The BESS consists of a bank of lithium-ion type batteries used to reduce power fluctuations from renewable energy sources and can support the stability of the electrical system. The operation of the storage system is described by the following equation [33]:
where EL is the load demand (W), EHES is the power delivered from the MSPS (W), is the battery efficiency (%), Echarge and Edischarge are the battery power in the charging and discharging periods, respectively.
The battery bank capacity can be calculated according to the equation [34]:
where DA is the Daily Autonomy, is the inverter efficiency (%) and DOD is the Depth Of Discharge of the battery (%), that varies from 60% to 100%.
Battery charging and discharging are related to the State of Charge (SOC), which is constrained by:
where SOCmax is the upper limit fixed to 100% and SOCmin is the lower limit.
The BESS is connected to the DC bus via the bi-directional converter (Figure 1) and allows compensation and minimization of output power fluctuations due to the energy conversion system engaged for wind and solar radiation.
2.4. SEPIC Buck Boost Converter
A converter is chosen for the purpose of modifying the voltage delivered by the power sources (PV generator and wind turbine) and guaranteeing the maximum power. In this case, a SEPIC buck-boost inverter is used (Figure 4), whose characteristics are reported in [35,36]. The specifications of the converter have been set for the laboratory test and the values of the main components are reported in Table 1.
2.5. Fuzzy Logic for the MPPT
This subsection discusses the design of the MPPT strategy, based on a fuzzy corrector and on the principle of Perturbation and Observation (P&O). For the fuzzification step, the input variables are the incremental voltage, , and the incremental power, , for the generic k-th step, defined on the basis of the current and previous samples:
The linguistic variables are reported in Figure 5 and Figure 6 (P = positive; Z = approximately zero; N = negative). Instead, the inference rules are reported in Table 2. The center of gravity method is used for the defuzzification. For this case, the unique output variable is the change of the duty cycle D (see the third column of Table 2 and Figure 7).
2.6. Greenhouse Model
The agricultural greenhouse is a complex system, used for off-season agricultural production to ensure a favorable indoor climate. Temperature is one of the most important parameters in a greenhouse, and a heating and ventilation system is used to achieve an efficient control of the indoor temperature. This section studies a dynamic model developed in [37] and based on thermodynamic laws, and it is coupled with a heating and ventilation system supplied by an MSPS. The agricultural greenhouse is modeled as a thermodynamic system, where different heat transfers occur from several energy exchanges between the inside and outside of the greenhouse. The temperature inside the greenhouse, as discussed in [37,38], must satisfy the Equation:
where is the air density equal to 1.225 [Kg/m3], Ca is the air heat capacity equal to 1.003 [kJ/kg K], and is the variation of the internal temperature. An exhaustive explanation of the other terms is reported in [36].
2.7. Real Experimental Greenhouse in the Faculty of Sciences in Tunis
The experimental greenhouse is in the North of Tunisia (36°43’10.25” N) and presents a typical model for greenhouses located in the Mediterranean area. It is a small-capel of the semi-insulated type and occupies an area equal to 14.8 (width 3.7 m, length 4 m, ridge height 3 m) and a volume of 36 m3 (Figure 8). This real greenhouse has been used to experimentally validate the agricultural greenhouse system, and to validate the operation of the actuators: a 705 W power fan and a 1000 W heating system. We tested an MSPS coupled by a storage system with real data (wind speed and solar radiation) to ensure the power consumed by the actuators, which control the interior temperature. In this test, the plant under cultivation is the tomato, and the optimal temperatures are 24 °C during the day and 15 °C during the night.
3. Control Strategy of the Global System
3.1. Control of the MSPS and BESS
This section presents the control strategy to manage the produced energy and to coordinate the interactions among the devices. The energy source is the combination of a photovoltaic system and a wind system, whereas the battery represents the energy storage system. The use of the battery bank is useful to compensate the mismatch between the power demanded by the load and the power generated by the MSPS. Therefore, three operating conditions can be observed:
- Power generated by the MSPS exceeds the power required by the load: the excess is stored in the battery bank and, when the battery bank will be full, the further energy will be dissipated in a load shedding system, which is a resistor in this study.
- Generated power is equal to the power required by the load: the produced power is entirely injected into the DC bus to the load.
- Power delivered by the MSPS is insufficient and the battery is charged: the missing power will be supplied by the battery storage system and the battery bank will be controlled to be activated when the SOC state is in the operating range.
The proposed control strategy (Figure 9) allows optimization of the produced energy and is reliable in regulating the power flow from and to the battery system, taking into account the battery SOC level and the power offset between the power demanded by the load and the power generated by the MSPS.
3.2. Control Strategy of the Ventilation/Heating System
Several control strategies for electric motors have been developed [39], such as scalar control, predictive control, etc., but, in this study, a vector control is used. It can control the speed of the asynchronous motor, the electromotive flux, and the torque of the three-phase electric motor. In general, vector control consists of a PI controller which calculates the reference speed according to its rated speed; this technique is not stable for motor speed control since the motor speed of a load is variable over time [40,41].
For this reason, we developed a PI controller Optimized by Fuzzy Logic (PIOFL). The structure of the proposed vector control is reported in Figure 10. Firstly, a Fuzzy Logic (FL) controller is defined, then it is optimized by using PI controller.
The diagram of the speed control strategy based on a basic FL controller is summarized in Figure 11, where two linguistic variables at the input of the speed controller are defined: the speed error E and sampled acceleration ΔET. Speed error E, at the k–th step, is defined as:
where is reference speed and Ω is the actual speed of the motor, calculated as:
with J the inertia on the shaft of the heating system group, p the Laplace variable, and f the viscous friction coefficient; Cr is the load (resistive) torque, while the electromagnetic torque, Cem, is given by:
where is the output of the fuzzy logic controller.
The inference rules of the FL controller are reported in Table 3, where the first column reports the input error E of the FL controller, the second column the sampled acceleration ΔET, while the third column regards the output of the fuzzy controller for Cem. Based on the study of the behavior of the system in closed control loop, there are three fuzzy sets, which implies nine possible combinations of these inputs, or nine rules.
Now, FL can be a useful support in processing inaccurate variables and in minimizing objective decisions through approximate cognition. This controller has good robustness against external disturbances, but it is not quick. On the other hand, the PI controller has a fast response and is sensitive to external perturbations [42]. To take full advantage of both controllers, we program the coefficients of the PI controller optimized by fuzzy logic, as reported in Figure 12, i.e., similar to Figure 11, apart from the PI controller.
The inputs to the fuzzy controller are the same linguistic variables defined in Equations (37) and (38). Similarly, the fuzzification stage will also be retained. The difference with respect to the basic FL controller concerns the output linguistic variables.
The inference rules that manage the controller level are detailed in Table 4 and Table 5 for Kp and Ki, respectively. The proposed control strategy consists of a PI controller with parameters Kp and Ki generated from a fuzzy controller to improve the robustness of the whole control. This robustness is due to the change of the parameters Kp and Ki every time a change of the input parameters occurs.
4. Simulation Results and Discussion
4.1. Electrical Behavior of the PV Generator
The PV module specifications under STC are shown in Table 6 [43]. The PV generator consists of several modules in series and in parallel, and it is simulated in the MATLAB/SIMULINK environment with real climatic data measured in the research laboratory in the Faculty of Sciences of Tunis, Tunisia. The PV generator is associated with the converter, controlled by MPPT-based fuzzy logic controller. During the simulation, the photovoltaic radiation varied between 0 W/m2 and 800 W/m2, with a temperature of 25 °C. The role of the buck converter consists in decreasing the voltage to 24 V and extracting the maximum power delivered by the PV generator. The command of the FL is good and assures the MPPT in all the weather conditions. It is also fast and precise. Figure 13 presents the profile of the solar radiation, while Figure 14 shows the PV power and voltage.
The simulation results show the efficiency of the MPPT command in the converter control such that the voltage is constant, and the power operates at a maximum power delivered by the PV generator.
4.2. Electrical Behavior of the Wind Turbine
The PMSG wind turbine system used in this simulation has the following specifications: 1 kW at 400 V, f = 50 Hz, coupled with a SEPIC converter controlled by a fuzzy strategy. Figure 15 reports the Simulink model of the wind system.
4.3. Simulation of the MSPS under Control Strategy
This section evaluates a MSPS consists of the PV generator (based on Kaneka GSA060) and a PMSG wind system, supported by the BESS, simulated under the MATLAB/SIMULINK environment. They are connected to a variable resistive load that absorbs a variable power between 700 W and 900 W.
The Li-Ion battery is constituted by three cells and has Vn = 200 V, while its capacity is equal to 100 Ah. The SOC and DOD are variable during the simulation and the initial values are fixed to SOC = 60% (the battery is not totally charged) and DOD = 40%.
The power of each MSPS component is shown in Figure 18, whereas Figure 19 reports the battery charging and discharging.
During the period 0–6 min, the power of the load is set to 700 W. The power delivered by the energy sources is equal to 300 W and BESS delivers 400 W (discharging) to balance the power absorbed by the load. The battery reaches its low SOC state (Figure 19). During the period 12–15 min, the power produced by the MSPS exceeds the power required by the load. In this case, the surplus power is stored in the battery (charging). After the 15th minute, the load power equals the power produced by the MSPS, indicating that the battery level is constant. It is concluded that the BESS and the proposed algorithm seem to provide a correct energy balance. In case of sudden changes, the proposed system reacts quickly to transience and avoids power oscillations.
Simulation results show the effectiveness of the proposed control strategy, while the BESS correctly manages the charging and discharging, on the basis of the load demand.
4.4. Simulation Results of the Global System
A real database of the values of solar radiation, outside temperature, and wind speed of one day (5 March 2017 in Tunisia) is used in the Simulink-based system. As the internal temperature of the greenhouse should vary in a limited range, two actuators are needed: a ventilation system to remove internal heat during the hot hours of midday, and a heating system to raise the internal temperature during the cold hours of the night.
Figure 20 and Figure 21 show the simulation results of the output power and the voltage delivered by the MSPS under MPPT fuzzy controller, and the storage system battery coupled with a SEPIC converter. It injects power into the DC bus to ensure the operation of the actuators (ventilation and heating system).
The real agricultural system under investigation is equipped with a ventilation system based on a three-phase asynchronous motor and a heat pump. Table 7 reports the electrical parameters of both the actuators used in the experimental energy system.
The simulation results of the ventilation system are presented in Figure 22 and Figure 23. From 12:00 am and 6:00 pm, the internal temperature of the greenhouse exceeds the reference temperature, 24 °C [38]. Therefore, the ventilation system operates at maximum speed (480 rpm) as shown in Figure 23. During this period, the MSPS delivers a maximum power (1.6 kW, see Figure 20) to ensure the operation of the ventilation system and to lower the indoor temperature to around its reference point.
Figure 24 shows the heating rate that the heating system must ensure to increase the internal temperature to the reference value during the night and the first hours of the day, until 11.00 am. The heating system should operate around the maximum speed to guarantee the maximum heating rate of 250 W/m2. Figure 25 shows the motor speed of the heating system under the PIOFL controller. The energy is supplied by the wind system and the battery during the night, as you can observe in Figure 20. Moreover, PIOFL controller showed robustness in vector control, no overshoot, and a fast response when the reference speed changed. So, PIOFL is efficient for the proposed system control and is a good solution to reduce energy consumption in the agricultural greenhouse.
The absence of PV energy, during the night, has an impact on the control of the agricultural greenhouse. The wind turbine supported by the storage system works with a boost converter to guarantee the maximum power injected in the heating system through a DC bus. The simulation results of the MSPS show the effectiveness in controlling the greenhouse system for different periods of time. Moreover, the coupling of two RES and a storage battery system allows supplying the energy to the greenhouse during the whole day, and this implies an improved energy management.
Finally, Figure 26 reports the desired temperature in the greenhouse (24 °C during the day and 15 °C during the night, black line), the real outside temperature and the real inside temperature. It shows that the control is effective in following the setpoint temperature.
In summary, Figure 18, Figure 20 and Figure 26 show that the main objectives have been achieved. Figure 26 shows that the desired temperature (24 °C during the day and 15 °C during the night) is maintained until the next change and the transition between the two states is fast. Figure 20 shows how the single components contribute to the requested power: the PV plant gives an insufficient contribution only during the day, the wind plant gives a variable contribution during the 24 h period, and the battery closes the balance. Finally, Figure 18 shows the MSPS response to the variation of the power absorbed by the load and/or to the variation of the power produced by one component of the MSPS.
5. Conclusions
The paper is constituted by two main parts: the power sources and the control. The first part proposes a battery–PV–wind energy system to power the heating and ventilation system of an agricultural greenhouse. Each subsystem is an accurate and verified model: a temperature-dependent model for the PV generator, a wind turbine coupled with a PMSG generator, and a BESS that allows improvement of the performance of the MSPS, especially during the night when only the wind system—subject to rapid wind variations, because the greenhouse is located near the sea—supplies the electrical load. The second part introduces the PIOFL strategy to control the energy flows exchanged among power sources, electrical loads, and battery. The global system has been tested by inputting the real environmental data for a complete daily scenario, which must consider the contributions of both PV and wind generators during the day, and the contribution of only the wind generator during the night. The proposed PIOFL strategy has shown an accurate and reliable operation during the variations of the energy flows because the target was reached in a limited time and in any condition (with one or two power sources). Moreover, the PIOFL has shown its reliability in reaching the temperature target both in increasing and in decreasing the internal temperature. The MSPS is modelled in MATLAB/Simulink under the change in wind speed, solar irradiance, and load. The simulation results demonstrated that the proposed MSPS maintains active power balance between supply and demand irrespective of variations in solar irradiance, wind speed, and connected load. Moreover, VDC, frequency, and output AC voltage are very minimally impacted due to these variations. Future work will focus on the temperature dependence of the battery capacity, which is a critical issue for certain latitudes.
Author Contributions
Conceptualization, J.R., S.V., D.M. and A.M.; methodology, J.R., S.V., D.M. and A.M.; software, J.R., D.M.; validation, J.R., S.V., D.M. and A.M.; formal analysis, J.R., S.V., D.M. and A.M.; investigation, J.R., D.M.; resources, J.R. and A.M.; data curation, J.R., D.M.; writing—original draft preparation, J.R., S.V. and D.M.; writing—review and editing, S.V., D.M. and A.M.; visualization, J.R., S.V., D.M. and A.M.; supervision, S.V. and A.M.; project administration D.M. and A.M. All authors have read and agreed to the published version of the manuscript.
Funding
This research received no external funding.
Conflicts of Interest
The authors declare no conflict of interest.
References
- Riahi, J.; Vergura, S.; Mezghani, D.; Mami, A. A combined PV-wind energy system for an energy saving greenhouse. In Proceedings of the IEEE International Conference on Environment and Electrical Engineering and 2020 IEEE Industrial and Commercial Power Systems Europe (EEEIC/I&CPS Europe), Madrid, Spain, 9–12 June 2020; pp. 1–6. [Google Scholar]
- Diab, F.; Lan, H.; Zhang, L.; Ali, S. An environmentally friendly factory in Egypt based on hybrid photovoltaic/wind/diesel/battery system. J. Clean. Prod. 2016, 112, 3884–3894. [Google Scholar] [CrossRef] [Green Version]
- Huang, P.-H.; Kuo, J.-K.; Wu, Z.-D. Applying small wind turbines and a photovoltaic system to facilitate electrolysis hydrogen production. Int. J. Hydrogen Energy 2016, 41, 8514–8524. [Google Scholar] [CrossRef]
- JFulzele, B.; Daigavane, M.B. Simulation and optimization of hybrid PV-wind renewable energy system. In Proceedings of the 3rd International Conference on Electrical, Electronics, Engineering Trends, Communication, Optimization and Sciences (EEECOS 2016), Tadepalligudem, India, 1–2 June 2016. [Google Scholar]
- Allani, M.Y.; Jomaa, M.; Mezghani, D.; Mami, A. Modelling and simulation of the hybrid system PV-wind with MATLAB/SIMULINK. In Proceedings of the 9th International Renewable Energy Congress (IREC), Hammamet, Tunisia, 20–22 March 2018. [Google Scholar]
- Gautam, A.R.; Mahela, O.P.; Singh, S.; Mahia, R.N. A double input SMV controlled dc/dc buckboost converter for solar PV/wind energy sources. In Proceedings of the International Conference on Recent Advances and Innovations in Engineering (ICRAIE-2014), Jaipur, India, 9–11 May 2014; pp. 1–6. [Google Scholar]
- Qi, W.; Liu, J.; Chen, X.; Christofides, P.D. Supervisory Predictive Control of Standalone Wind/Solar Energy Generation Systems. IEEE Trans. Control Syst. Technol. 2011, 19, 199–207. [Google Scholar] [CrossRef]
- Vergura, S.; Pavan, A.M. On the photovoltaic explicit empirical model: Operations along the current-voltage curve. In Proceedings of the IEEE-ICCEP 2015 International Conference on Clean Electrical Power, Taormina, Italy, 16–18 June 2015. [Google Scholar]
- Vergura, S. Correct Settings of a Joint Unmanned Aerial Vehicle and Thermocamera System for the Detection of Faulty Photovoltaic Modules. IEEE J. Photovolt. 2021, 11, 124–130. [Google Scholar] [CrossRef]
- Vergura, S.; Marino, F. Quantitative and Computer Aided Thermography-based Diagnostics for PV Devices: Part I—Framework. IEEE J. Photovolt. 2017, 7, 822–827. [Google Scholar] [CrossRef]
- Vergura, S.; Colaprico, M.; de Ruvo, M.F.; Marino, F. A Quantitative and Computer Aided Thermography-based Diagnostics for PV Devices: Part II—Platform and Results. IEEE J. Photovolt. 2017, 7, 237–243. [Google Scholar] [CrossRef]
- Sineglasov, V.M.; Dmitrenko, B.I.; Kulbaka, A.V. Using PV/wind hybrid systems in the autonomous power of unmanned aerial vehicle control centre. In Proceedings of the IEEE 2nd International Conference Actual Problems of Unmanned Air Vehicles Developments (APUAVD), Kyiv, Ukraine, 15–17 October 2013. [Google Scholar]
- Maher, A.; Kamel, E.; Enrico, F.; Atif, I.; Abdelkader, M. An intelligent system for the climate control and energy savings in agricultural greenhouses. Energy Effic. 2016, 9, 1241–1255. [Google Scholar] [CrossRef]
- Echaieb, K.; Azaza, M.; Mami, A. A new control strategy of indoor air temperature in a photovoltaic greenhouse. Int. J. Soft Comput. Softw. Eng. 2013, 3, 848–852. [Google Scholar]
- Stoyanov, L.; Bachev, I.; Zarkov, Z.; Lazarov, V.; Notton, G. Multivariate Analysis of a Wind–PV-Based Water Pumping Hybrid System for Irrigation Purposes. Energies 2021, 14, 3231. [Google Scholar] [CrossRef]
- Food and Agriculture Organization of the United Nations. Water for Sustainable Food and Agriculture: A Report Produced for the G20 Presidency of Germany. Available online: http://www.fao.org/3/i7959e/i7959e.pdf?fbclid=IwAR1eV3HuHfHdxH6ca11yhMBTD6U78LnwqUxZlKrTWaxfUgOQF4rpuFwJtWo (accessed on 13 August 2021).
- Salisu, S.; Mustafa, M.W.; Olatomiwa, L.; Mohammed, O.O. Assessment of technical and economic feasibility for a hybrid PV-wind-diesel-battery energy system in a remote community of north central Nigeria. Alex. Eng. J. 2019, 58, 1103–1118. [Google Scholar] [CrossRef]
- Krishan, O.; Suhag, S. Techno-economic analysis of a hybrid renewable energy system for an energy poor rural community. J. Energy Storage 2019, 23, 305–319. [Google Scholar] [CrossRef]
- Wesly, J.; Brasil, A.C.P.; Frate, C.A.; Badibanga, R.K. Techno-economic analysis of a PV-wind-battery for a remote community in Haiti. Case Stud. Chem. Environ. Eng. 2020, 2, 100044. [Google Scholar] [CrossRef]
- Gorjian, S.; Calise, F.; Kant, K.; Ahamed, S.; Copertaro, B.; Najafi, G.; Zhang, X.; Aghaei, M.; Shamshiri, R.R. A review on opportunities for implementation of solar energy technologies in agricultural greenhouses. J. Clean. Prod. 2021, 285, 124807. [Google Scholar] [CrossRef]
- ATraoré, K.; Cardenas, A.; Doumbia, M.L.; Agbossou, K. Comparative Study of Three Power Management Strategies of a Wind PV Hybrid Stand-alone System for Agricultural Applications. In Proceedings of the IECON 2018—44th Annual Conference of the IEEE Industrial Electronics Society, Washington, DC, USA, 21–23 October 2018; pp. 1711–1716. [Google Scholar]
- Islam, A.; Merabet, A.; Beguenane, R.; Ibrahim, H. Power Management Strategy for Solar-Wind-Diesel Stand-alone Hybrid Energy System. Int. J. Electr. Comput. Energ. Electron. Commun. Eng. 2014, 8, 849–853. [Google Scholar]
- Al-Ghussain, L.; Ahmed, H.; Haneef, F. Optimization of hybrid PV-wind system: Case study Al-Tafilah cement factory, Jordan, Sustain. Energy Technol. Assess. 2018, 30, 24–36. [Google Scholar] [CrossRef]
- Singh, P.; Ravindra, N. Temperature dependence of solar cell performance—An analysis. Sol. Energy Mater. Sol. Cells 2012, 101, 36–45. [Google Scholar] [CrossRef]
- Luque, A.; Hegedus, S. Handbook of Photovoltaic Science and Engineering; John Wiley and Sons: Chichester, UK, 2003. [Google Scholar]
- Markvart, T.; Castaner, L. Practical Handbook of Photovoltaics. Fundamentals and Applications; Elsevier: Oxford, UK, 2006. [Google Scholar]
- Vergura, S. Scalable Model of PV Cell in Variable Environment Condition based on the Manufacturer Datasheet for Circuit Simulation. In Proceedings of the IEEE-EEEIC 2015, Roma, Italy, 10–13 June 2015. [Google Scholar]
- Vergura, S. A Complete and Simplified Datasheet-Based Model of PV Cells in Variable Environmental Conditions for Circuit Simulation. Energies 2016, 9, 326. [Google Scholar] [CrossRef]
- Vergura, S. Hypothesis Tests-Based Analysis for Anomaly Detection in Photovoltaic Systems in the Absence of Environmental Parameters. Energies 2018, 11, 485. [Google Scholar] [CrossRef] [Green Version]
- Joonmin, L.; Young-Seok, K. Sensorless fuzzy-logic-based maximum power point tracking control for a small-scale wind power generation system with a switched mode rectifier. IET Renew. Power Gener. 2016, 10, 194–202. [Google Scholar]
- Charfi, S.; Atieh, A.; Chaabene, M. Modeling and cost analysis for different PV/battery/diesel operating options driving a load in Tunisia, Jordan and KSA. Sustain. Cities Soc. 2016, 25, 49–56. [Google Scholar] [CrossRef]
- Allani, M.Y.; Tadeo, F.; Mezghani, D.; Mami, A. Modelling and Control of a Grid–connected Hybrid Photovoltaic/wind/battery System Coupled to an AC Load. IJSCNS 2019, 19, 5. [Google Scholar]
- Borowy, B.S.; Salameh, Z.M. Methodology for optimally sizing the combination of a battery bank and PV array in a wind/PV hybrid system. IEEE Trans. Energy Convers. 1996, 11, 367–375. [Google Scholar] [CrossRef]
- Daud, A.-K.; Ismail, M.S. Design of isolated hybrid systems minimizing costs and pollutant emissions. Renew. Energy 2012, 44, 215–224. [Google Scholar] [CrossRef]
- Mezghani, D.; Othmani, H.; Mami, A. Bond graph modeling and robust control of a photovoltaic generator that powered an induction motor pump via SEPIC converter. Electr. Energy Syst. 2019, 29, e2746. [Google Scholar] [CrossRef]
- Mezghani, D.; Mami, A.; Dauphin-Tanguy, G. Bond graph modelling and control enhancement of an off-grid hybrid pumping system by frequency optimization. Int. J. Numer. Model. 2020, 33, e2717. [Google Scholar] [CrossRef]
- Riahi, J.; Vergura, S.; Mezghani, D.; Mami, A. Intelligent Control of the Microclimate of an Agricultural Grennhouse Powered by a Supporting PV System. Appl. Sci. 2020, 10, 1350. [Google Scholar] [CrossRef] [Green Version]
- Ben Ali, R.; Bouadila, S.; Mami, A. Experimental validation of the dynamic thermal behavior of two types of agricultural greenhouses in the Mediterranean context. Renew. Energy 2019, 147, 118–129. [Google Scholar] [CrossRef]
- Chen, M.; Zhang, W. H2 optimal speed regulator for vector-controlled induction motor drives. In Proceedings of the 27th Chinese Control and Decision Conference (2015 CCDC), Qingdao, China, 23–25 May 2015. [Google Scholar]
- Miki, I.; Nagai, N.; Nishiyama, S.; Yamada, T. Vector control of induction motor with fuzzy PI controller. In Proceedings of the 1991 IEEE Industry Applications Society Annual Meeting, Dearborn, MI, USA, 28 September–4 October 1991. [Google Scholar]
- Zhu, X.; Shen, A. Speed Estimation of Sensorless Vector Control System Based on Single Neuron PI Controller. In Proceedings of the 2006 6th World Congress on Intelligent Control and Automation, Dalian, China, 21–23 June 2006. [Google Scholar]
- Othmani, H.; Mezghani, D.; Mami, A. Fuzzy Gain-Scheduling Proportional–Integral control for Improving the speed behavior of a three-phases induction motor. Int. J. Power Electron. Drive Syst. (IJPEDS) 2016, 7, 1161. [Google Scholar] [CrossRef] [Green Version]
- Chaouali, H.; Othmani, H.; Mezghani, D.; Jouini, H.; Mami, A. Fuzzy logic control scheme for a 3 phased asynchronous machine fed by Kaneka GSA-60 PV panels. In Proceedings of the 7th IEEE International Conference Renewable Energy Congress, Hammamet, Tunisia, 22–24 March 2016. [Google Scholar]
Figure 1.
Conceptual scheme of the global system.

Figure 2.
Electric model of a PV cell.

Figure 3.
Circuit of a PV cell in any environment condition.

Figure 4.
Simulink model of the SEPIC converter.

Figure 5.
Linguistic variable EV(k).

Figure 6.
Linguistic variable EP(k).

Figure 7.
Output of the linguistic variable D(k).

Figure 8.
(a) Greenhouse; (b) Greenhouse internal area with tomato plants.

Figure 9.
Algorithm of the control strategy.

Figure 10.
Scheme of the PI controller Optimized by Fuzzy Logic (PIOFL).

Figure 11.
Basic FL controller for the yellow block in Figure 9.
Figure 11.
Basic FL controller for the yellow block in Figure 9.

Figure 12.
PI controller optimized by fuzzy logic for yellow block in Figure 10.
Figure 12.
PI controller optimized by fuzzy logic for yellow block in Figure 10.

Figure 13.
Solar radiation profile.

Figure 14.
Power and voltage of the PV generator.

Figure 15.
Simulink model of the wind turbine.

Figure 16.
Wind speed profile.

Figure 17.
Power and the voltage of the wind turbine.

Figure 18.
Power delivered by the MSPS.

Figure 19.
Battery charging and discharging.

Figure 20.
Power delivered by different sources of the MSPS and BESS.

Figure 21.
Voltage at the DC bus.

Figure 22.
Ventilation rate.

Figure 23.
Motor speed of the ventilation system.

Figure 24.
Heating rate of the greenhouse.

Figure 25.
Motor speed of the heating system under PIOFL controller.

Figure 26.
Temperature under ventilation and heating control.


Table 1.
Values of the main components of the SEPIC.
| Component | Value |
|---|---|
| Cin, Cout | 440 uF |
| Cp | 10 uF |
| L1, L2 | 47 uH |
Table 2.
Rules of inference.
| Rules | Ev | Ep | D |
|---|---|---|---|
| 1 | P | P | P |
| 2 | N | P | P |
| 3 | Z | P | P |
| 4 | Z | Z | Z |
| 5 | N | Z | P |
| 6 | P | Z | N |
| 7 | P | N | N |
| 8 | N | N | P |
| 9 | Z | N | P |
Table 3.
Speed control inference rules.
| Rule N° | E | ΔET | Cem |
|---|---|---|---|
| 1 | P | P | P |
| 2 | P | Z | P |
| 3 | P | N | P |
| 4 | Z | P | P |
| 5 | Z | Z | Z |
| 6 | Z | N | N |
| 7 | N | P | N |
| 8 | N | Z | N |
| 9 | N | N | N |
Table 4.
Inference rules for Kp.
| Rule N° | E | Kp |
|---|---|---|
| 1 | N | N |
| 2 | Z | Z |
| 3 | P | P |
Table 5.
Inference rules for Ki.
| Rule N° | E | dE | Ki |
|---|---|---|---|
| 1 | P | P | P |
| 2 | P | Z | P |
| 3 | P | N | P |
| 4 | Z | P | P |
| 5 | Z | Z | Z |
| 6 | Z | N | N |
| 7 | N | P | N |
| 8 | N | Z | N |
| 9 | N | N | N |
Table 6.
Main parameters of the PV module Kaneka GSA060.
| Technical Specifications | Nominal Values |
|---|---|
| Nominal power, Pn | 60 Wp |
| Minimum Power | 57 W |
| Voltage at Pmax, Vmpp | 67 V |
| Current at Pmax, Impp | 0.9 A |
| Open circuit voltage, Voc | 92 V |
| Short-circuit current, Isc | 1.19 A |
Table 7.
Actuators.
| Actuator | Electrical Parameters | Nominal Power |
|---|---|---|
| Ventilation System | 3 phase–50 Hz | 705 W |
| Heating system | 230 V, 50/60 Hz | 1000 W |
Publisher’s Note: MDPI stays neutral with regard to jurisdictional claims in published maps and institutional affiliations. |
© 2021 by the authors. Licensee MDPI, Basel, Switzerland. This article is an open access article distributed under the terms and conditions of the Creative Commons Attribution (CC BY) license (https://creativecommons.org/licenses/by/4.0/).
Share and Cite
MDPI and ACS Style
Riahi, J.; Vergura, S.; Mezghani, D.; Mami, A. Smart and Renewable Energy System to Power a Temperature-Controlled Greenhouse. Energies 2021, 14, 5499. https://doi.org/10.3390/en14175499
AMA Style
Riahi J, Vergura S, Mezghani D, Mami A. Smart and Renewable Energy System to Power a Temperature-Controlled Greenhouse. Energies. 2021; 14(17):5499. https://doi.org/10.3390/en14175499
Chicago/Turabian StyleRiahi, Jamel, Silvano Vergura, Dhafer Mezghani, and Abdelkader Mami. 2021. "Smart and Renewable Energy System to Power a Temperature-Controlled Greenhouse" Energies 14, no. 17: 5499. https://doi.org/10.3390/en14175499
Note that from the first issue of 2016, this journal uses article numbers instead of page numbers. See further details here.