
Analysis and Experimental Verification of the Demagnetization Vulnerability in Various PM Synchronous Machine Configurations for an EV Application


Department of Electrical Engineering, Inha University, Incheon 22212, Korea
Energies 2021, 14(17), 5447; https://doi.org/10.3390/en14175447
Submission received: 10 August 2021
/
Revised: 23 August 2021
/
Accepted: 27 August 2021
/
Published: 1 September 2021
(This article belongs to the Special Issue Design and Application of Electrical Machines)
Abstract
:Safety is a critical feature for all passenger vehicles, making fail–safe operation of the traction drive system highly important. Increasing demands for traction drives that can operate in challenging environments over wide constant power speed ranges expose permanent magnet (PM) machines to conditions that can cause irreversible demagnetization of rotor magnets. In this paper, a comprehensive analysis of the demagnetization vulnerability in PM machines for an electric vehicle (EV) application is presented. The first half of the paper presents rotor demagnetization characteristics of several different PM machines to investigate the impact of different design configurations on demagnetization and to identify promising machine geometries that have higher demagnetization resistance. Experimental verification results of rotor demagnetization in an interior PM (IPM) machine are presented in the latter half of the paper. The experimental tests were carried out on a specially designed locked-rotor test setup combined with closed-loop magnet temperature control. Experimental results confirm that both local and global demagnetization damage can be accurately predicted by time-stepped finite element (FE) analysis.
1. Introduction
Due to their superior torque density and efficiency, permanent magnet synchronous machines (PMSMs) are frequently used in many high-performance applications. Despite recent price fluctuations, neodymium–iron–boron (NdFeB) rare-earth magnets have remained the popular choice for advanced applications due to their high coercive force and magnet remanence. However, most PM machines are naturally prone to irreversible demagnetization, which is typically caused by large demagnetizing fields from the stator windings and excessive temperature elevation. For high-performance PMSMs, reduction in magnet strength may result in significant performance degradation [1].
The properties of demagnetization characteristics of PMSMs have traditionally been examined based on the principles of Gauss’s law and Ampere’s law, commonly utilizing equivalent magnetic circuits as presented in many previous studies in the literature [2,3,4]. However, because of the secondary effects that are often omitted to simplify the study, the analytical models utilized in various previous research are insufficient to provide accurate answers for many real scenarios. Common examples include irreversible demagnetization, various leakage paths, and neglecting magnetic saturation, as well as an oversimplification of machine geometry.
The demagnetization characteristics of ferrite magnet material have been received more attention in recent years due to the fluctuations in the price of rare-earth magnet materials. Although the same fundamentals for demagnetization apply to both the magnet types, ferrite magnets have a significantly lower remanent flux density and coercivity. Therefore, machines using ferrite magnets must pay much more attention to demagnetization. In [5], the ratio of demagnetized magnet elements to total magnet materials for a PM-assisted synchronous reluctance machine was calculated using finite element (FE) analysis. A more recent study uses a magnetic equivalent circuit model to investigate design requirements for ferrite-assisted synchronous reluctance machines [6]. Despite the use of an infinitely permeable core, the match between the analytical and FE results was excellent because of the lower level of core saturation induced by ferrite magnets.
Several methods for evaluating the demagnetization state of PMSMs have been proposed in the literature. Both hybrid [7] and FE-based methods [1,5,6,7,8,9,10,11,12,13,14,15,16] have been used to investigate the demagnetization characteristics of PM machines. Calculating the minimum flux density within the magnets under the effect of demagnetizing magnetomotive force (MMF) is one of the most extensively used ways for indicating the demagnetization state [8,9,10,11,12]. The reduction in back-emf voltage magnitude after exposure to a demagnetizing MMF has been employed by some authors to describe the demagnetization state [1,13]. This back-emf voltage-based method is useful for investigating experimental demagnetization because the quantities to be measured are directly available at the terminals of the machine. The reduction ratio of the magnetic flux linkage and the ratio of demagnetized magnet volume to the total magnet volume have also been employed [5,16]. In addition, a three-dimensional (3D) demagnetization analysis was performed in [16]. The process of localized demagnetization inside the magnets was studied using vector plots of the magnetic flux density [14,15]. Unfortunately, past experience has shown that there is no single representation that can include all of the detailed information to represent the demagnetization state of a PM machine.
More recent research trends focus on improving simulation accuracy by including the end effects into two-dimensional (2D) FE analysis [17], improved B–H curve modeling [18], and the complex spatial distribution of the demagnetizing MMF inside rotor magnets [19]. Novel rotor flux barrier designs that can mitigate demagnetization risks have been proposed in [20]. Design optimization considering demagnetization has been receiving increasing attention in recent studies [21,22].
Despite the fact that a typical demagnetization test requires a significant amount of time and expense, there have been some interesting findings published on the experimental verification of magnet demagnetization. The demagnetization characteristics of a dovetail PM machine was investigated under locked-rotor condition [13]. Reduction of the no-load back-emf voltage was used to evaluate the demagnetization damage. In another study, the demagnetization test results of a PM brushless dc machine under an inter-turn short-circuit fault condition were reported [23]. The demagnetization characteristics of permanent magnets outside the machine were investigated in [24] using a specially designed fixture. Another demagnetization test result presented in [25] was performed with the rotor magnets physically damaged. Unfortunately, most of the reported work to date may not be applicable to more generalized cases due to the specialized and constrained conditions.
A significant amount of demagnetization analysis results has been provided in [26] for several different PMSMs under the effect of demagnetizing MMF, highlighting the impact of the rotor geometry and winding type on demagnetization at an application level (i.e., EV). To date, the literature on this subject has received relatively little attention. As it is challenging to remagnetize the damaged magnets, identifying PM machine configurations with improved demagnetization resistance is critical. In most cases, the only way to recover the loss of magnet strength is to remove the rotor and magnets from the machine and remagnetize the rotor magnets with a huge external magnetizing MMF, which is a very time-consuming and expensive process. In this paper, the results presented in [26] are significantly expanded by investigating an interior PM (IPM) machine design with a new type of rotor configuration, which is called flux-intensifying (FI) IPM machine, and providing valuable experimental results of a fractional-power IPM machine as well as discussions on modeling accuracy issues to validate the FE results that are provided in the paper.
The rest of the paper is organized as follows: Section 2 describes the basics of magnet demagnetization and seven baseline PM machines to be studied. Section 2 also presents two different types of IPM machines—flux-weakening (FW) and flux-intensifying (FI) IPM machines—to highlight the differences in each of the machine configurations. Rotor demagnetization characteristics for eight different PM machine configurations under the influence of demagnetization MMF are investigated in Section 3. In Section 4, a collection of measured pre- and post-demagnetization test data is presented to verify the rotor demagnetization characteristics predicted by FE analysis. FE modeling accuracy issues are discussed in Section 5, and the conclusion is given in Section 6.
2. Demagnetization Principles and Baseline PM Machines
2.1. Demagnetization Principles
Irreversible magnet demagnetization is generally caused by the combined effect of demagnetizing field and temperature rise. In this paper, it was assumed that the irreversible demagnetization is caused by the application of an external demagnetizing field under constant magnet temperature. The variation of magnet operating point on the B–H curve was calculated based on predefined data arrays for each temperature level.
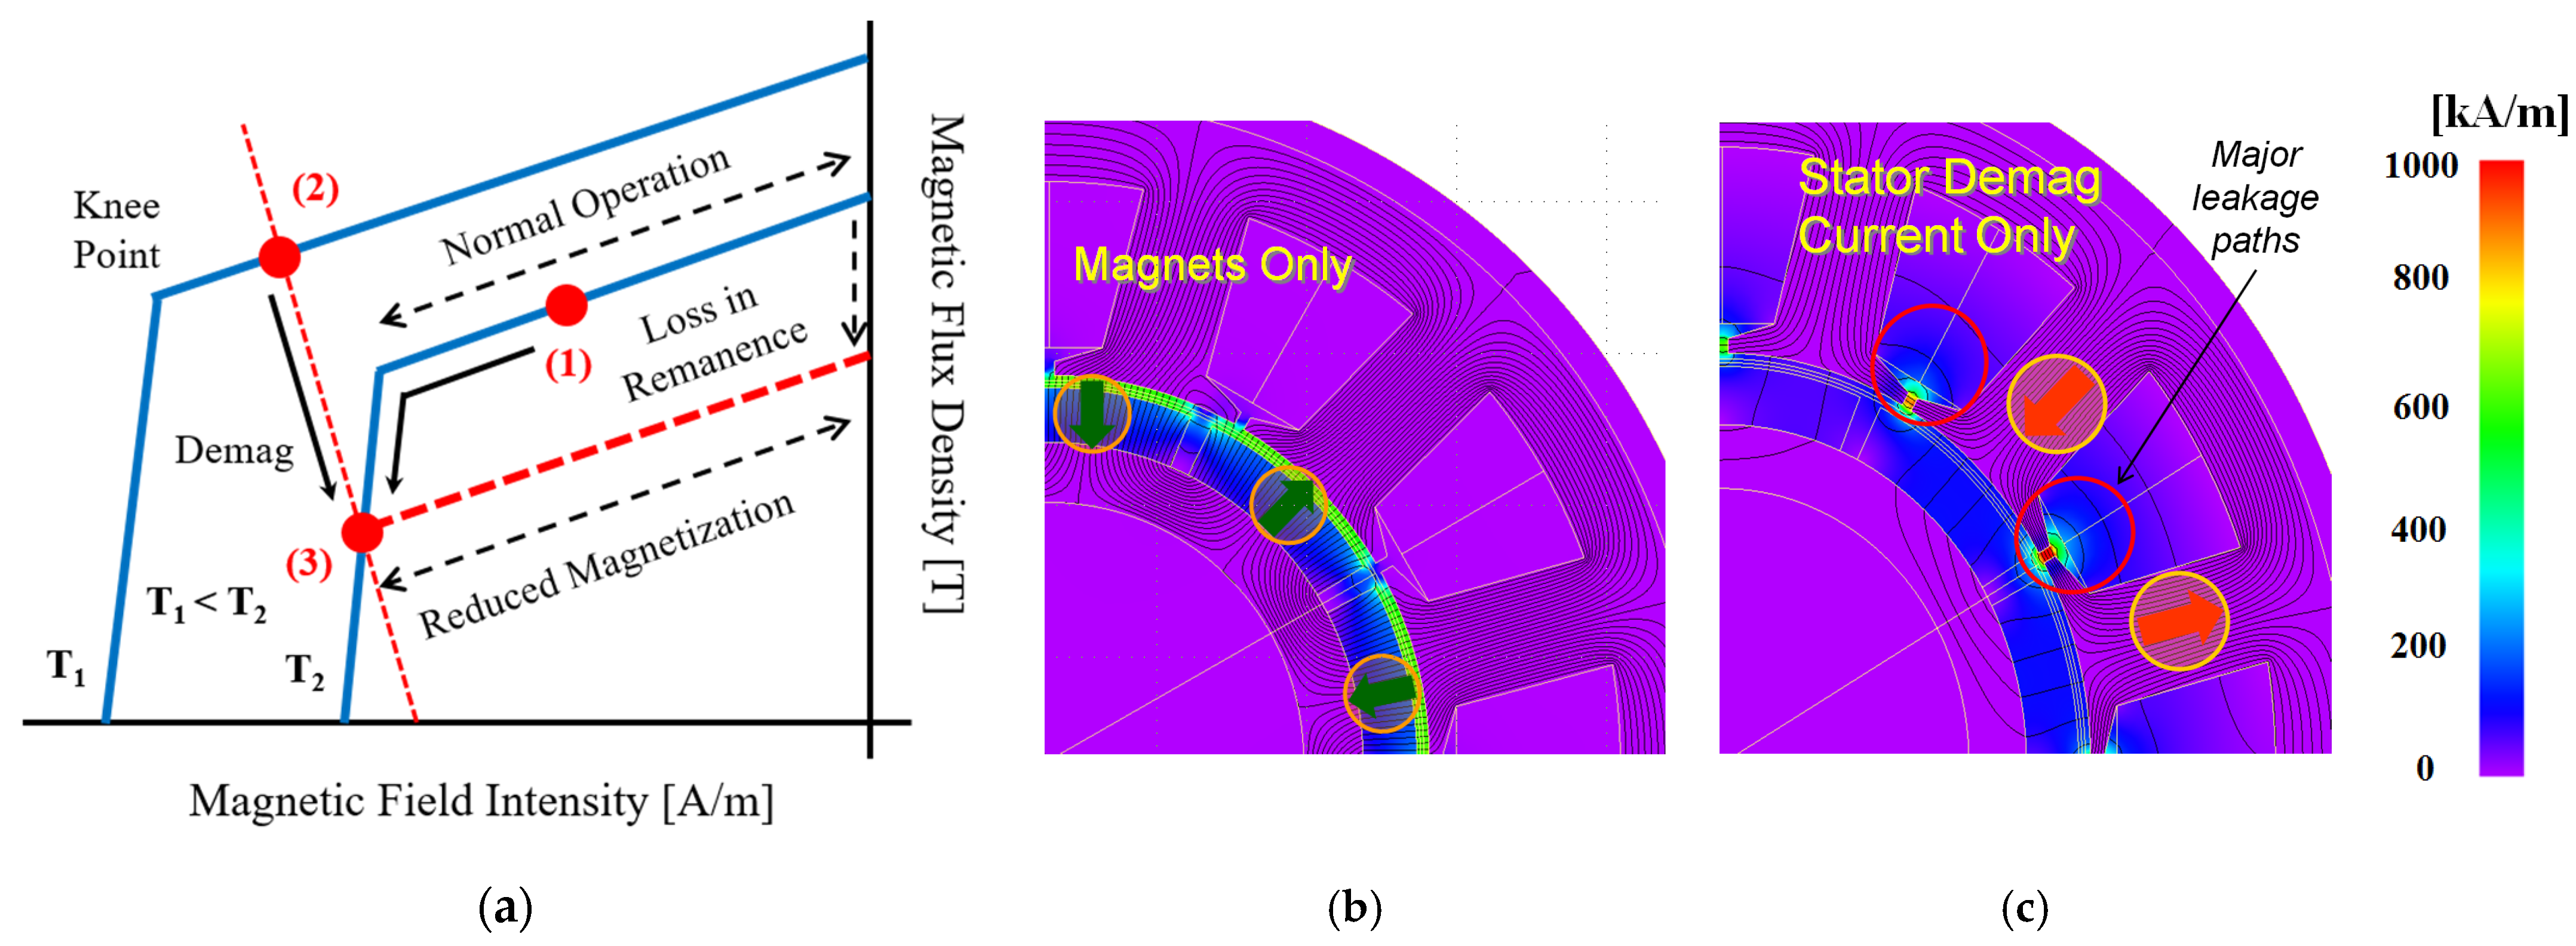
Figure 1a shows the magnet demagnetization characteristics on a B–H curve, taking into account the effect of demagnetizing MMF and temperature rise, respectively. With a large demagnetizing stator current exceeding a threshold value, the magnet operating point changes irreversibly beyond the knee point, from point (1) to (2) as in Figure 1a, and follows a recoil curve with reduced magnetization capability after removing the demagnetization current. Figure 1a also shows that the loss in magnet remanence does not recover once the magnet operating point changes from (2) to (3) due to temperature rise.
Figure 1b,c shows contour plots of the magnetic field strength H throughout a fractional-slot concentrated-winding (FSCW) surface PM (SPM) machine for excitation by magnets alone, and for 1 per-unit (pu) of negative d-axis current alone, respectively. The contour plots were calculated using a frozen permeability technique [27] to separate the combined loaded field components generated by both the negative d-axis current and rotor magnets. Figure 1c shows that most leakage flux in the SPM machine moves from a stator tooth to a neighboring stator tooth through the stator teeth-tips. In contrast to the SPM machine, the air cavity areas in the IPM rotor also provide an additional leakage path for demagnetizing MMFs, indicating that its demagnetization risk is lower than that of the SPM machine.
2.2. Baseline PM Machines
The demagnetization characteristics of several design configurations were investigated using seven different baseline PM machines that were initially developed in [26] for an EV application. The baseline designs were optimized by using a commercial optimization tool in order to meet the key performance characteristics of an 80 kW (pk) traction machine. This machine is rated for a 145 Apk stator current, which is defined to be 1 pu, for continuous operation and 565 Apk at peak power. As stated in [26], a constant magnet thickness of 8 mm was imposed on the optimization process for all of the designs to ensure a fair comparison between the seven machine designs.
Cross-sectional views of the baseline PM machines are shown in Figure 2. In order to highlight the impact of different stator MMF harmonics, a comparison between distributed winding (DW) and FSCW topologies is provided. The effect of different rotor structures was investigated by choosing IPM and SPM machines that are equipped with fractional-slot, concentrated windings. The variation of magnet positions in the rotor was considered in the analysis to show its impact on demagnetization—spoke type, flat type (Flat 1), the other flat type that is located closer to the airgap (Flat 2), single-layer V shape, and two-layer VU shape. Key performance metrics and dimensions for the seven baseline machines are summarized in Table 1.
2.3. FW-IPM vs. FI-IPM
Recently, there is a growing interest in FI-IPM machines as an alternative to the conventional FW-IPM machines due to the improved self-sensing capability as well as their potential for variable-flux capability [28]. In order to highlight the differences in demagnetization characteristics between the conventional FW-IPM and FI-IPM machines, an FI-IPM machine was designed based on the same performance specifications applied to the seven baseline PM machines.
Contrary to the conventional FW-IPM machines, rotor magnets were embedded in a deeper position inside the rotor, while the flux barriers along the q-axis were placed next to the rotor surface. This helps to maximize the magnet torque as well as the difference between the dq inductances, Ld, and Lq, thereby achieving a saliency relationship of Ld > Lq in FI-IPM machines [27], as shown in Figure 3a. In order to provide meaningful comparisons and highlight the differences in rotor design, both FI-IPM and FW-IPM machines had the same stator structure (i.e., same stator demagnetizing MMF), including the same number of turns that were designed based on the Flat 2 DW-IPM design shown in Figure 3b. However, the rotor structure of the FI-IPM machine is significantly different, as shown in Figure 3a, due to the machine characteristics explained above.
A summary of the predicted performance metrics for the two PM machines is provided in Table 2. Although both FI- and FW-IPM machines were designed for identical design requirements with the same airgap length and rotor diameter constraints, the FI-IPM machine exhibits significant increases in volume and mass, compared to the FW-IPM machine.
Table 2 shows that the power density of the FI-IPM machine is degraded, compared to the conventional FW-IPM machine, primarily due to two reasons: (1) decreased magnet flux leakage due to the deeper embedded position of magnets and (2) degraded rotor permeance waveform due to the large flux barriers in the rotor q-axis. As a result, the peak power density of the FI-IPM machine is approx. 20% lower, compared to the FW-IPM machine. Both IPM machine designs exhibit relatively large torque ripple at rated operating conditions. On the other hand, the efficiency of the two IPM machines is as high as 97% at rated conditions.
3. Simulation Results
3.1. Baseline PM Machines
Since stator current aligned with the negative d-axis is considered as a major source of demagnetizing MMF, 5 pu negative d-axis stator current was selected as the worst-case scenario. Fixed-speed, time-stepping FE analysis was used to investigate the detailed demagnetization characteristics under the influence of demagnetizing MMFs. Each individual element inside the magnets was scheduled to follow a major B–H curve and a set of recoil curves based on the element’s operating point to take into account irreversible demagnetization in the FE analysis. A commercial FE software was used for this study.
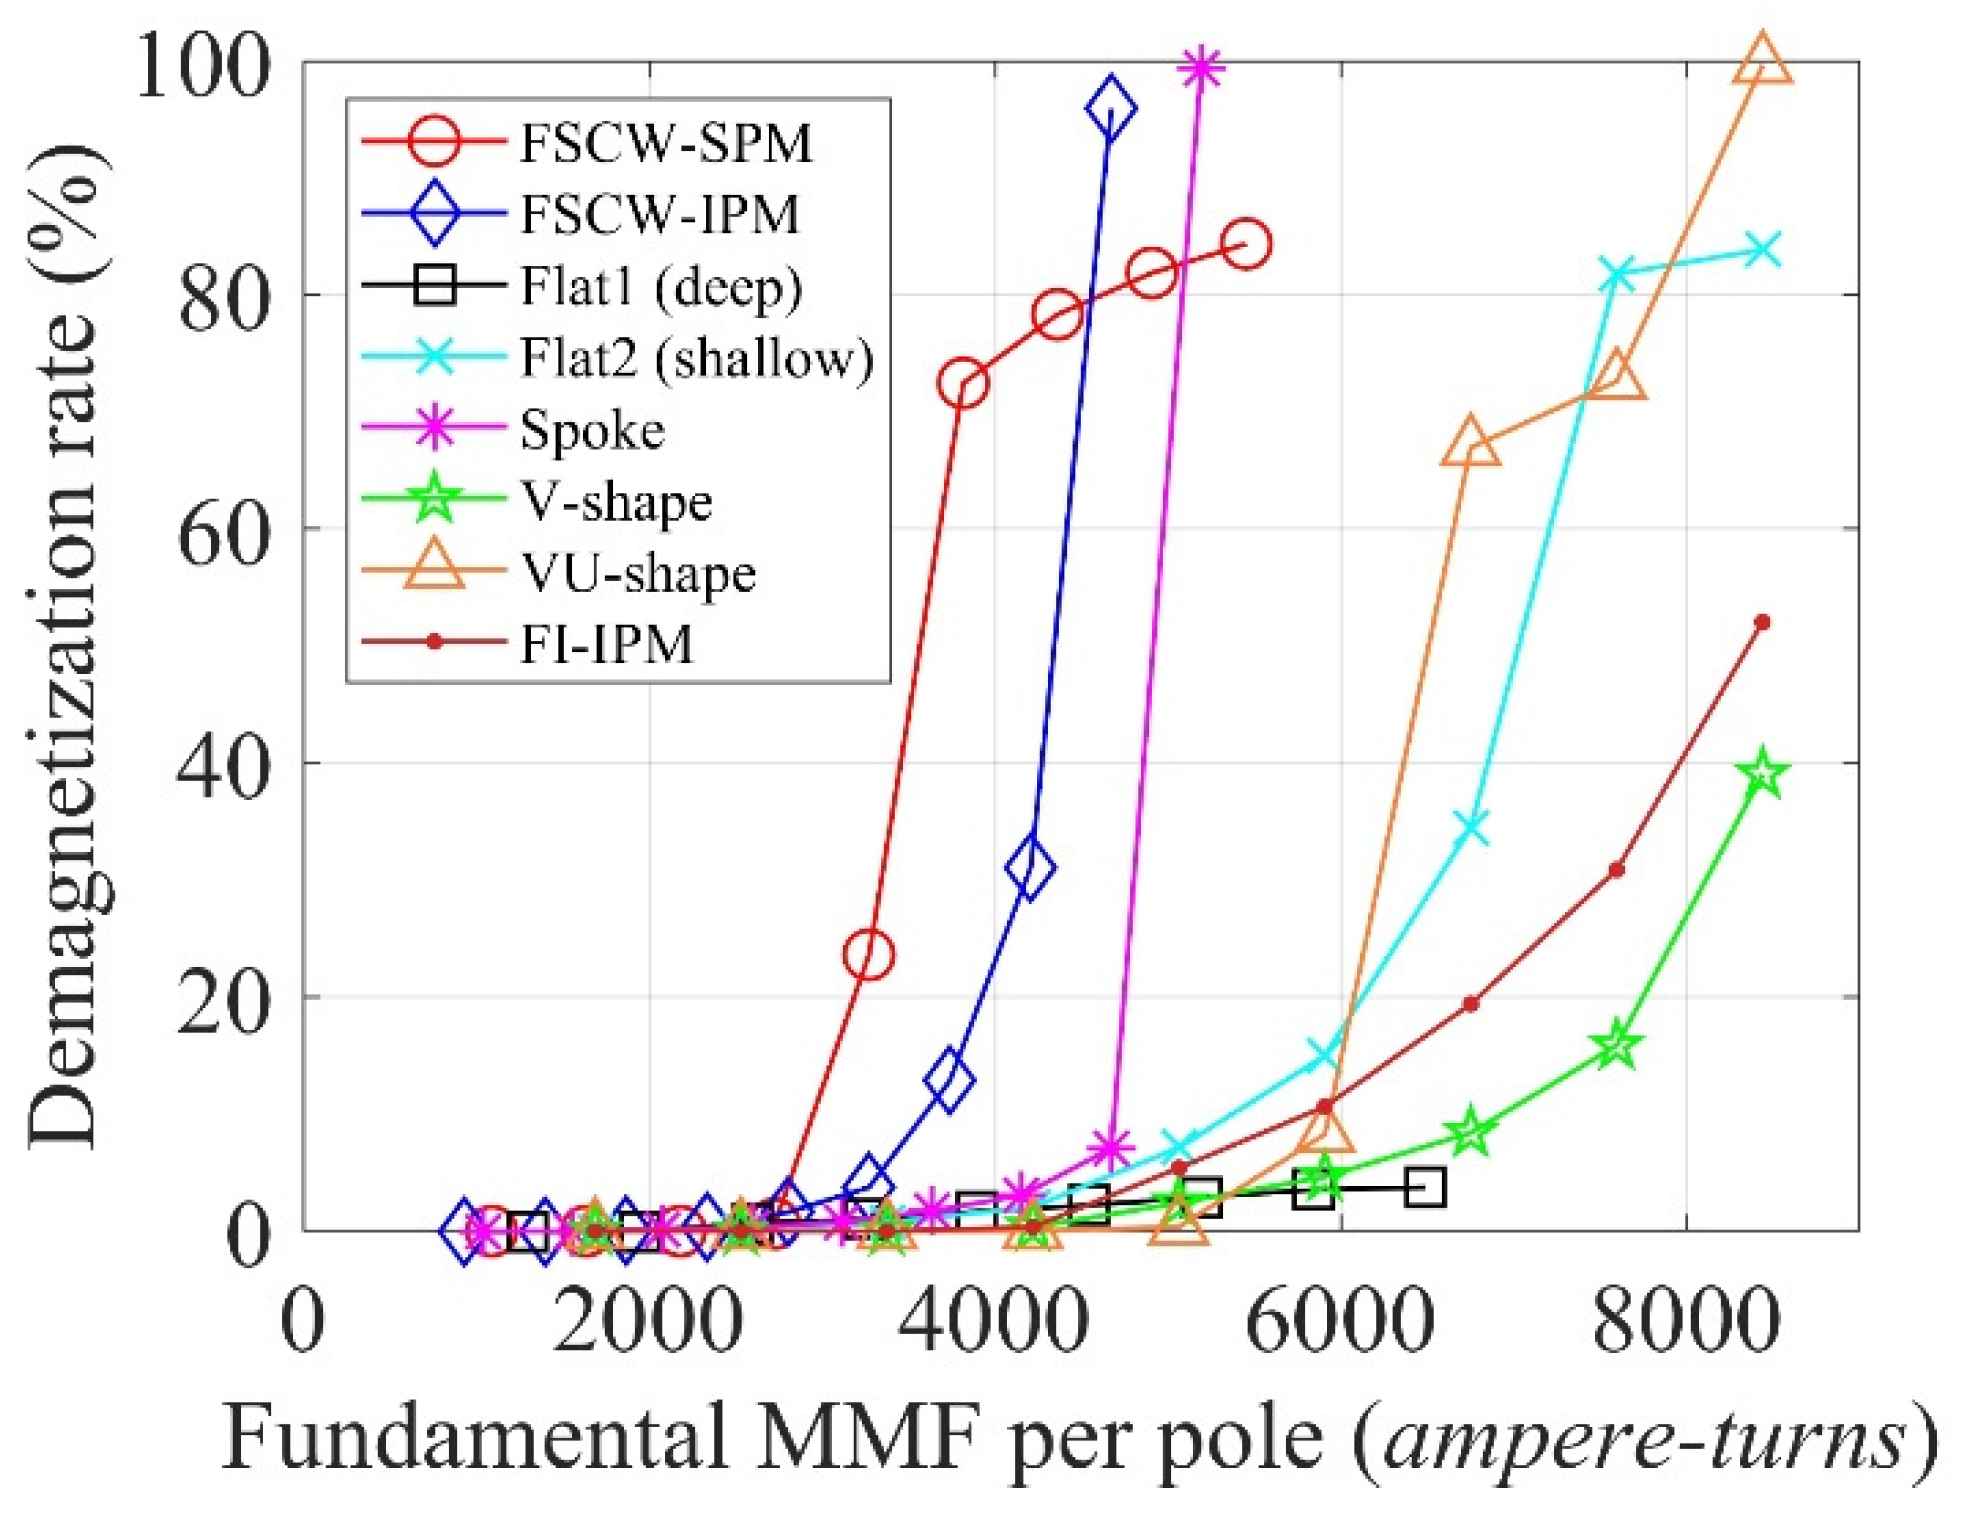
The number of demagnetized magnet elements to total magnet elements is defined as the demagnetization ratio. Figure 4 shows the demagnetization rate (in %) in terms of the applied demagnetizing MMF per rotor pole for the eight baseline PM machines including the FI-IPM machine. The stator MMF per rotor pole introduced in [2] is written as follows:
where Im is the magnitude of stator current, Nt is series turn numbers, C is the number of parallel circuits, Nph is the number of phases, P is the number of poles, and kwh is the winding factor for the h-th order winding spatial harmonic component. The winding factor can be written as a product of winding distribution factor kdh, slot opening factor kxh, winding pitch factor kph, and skew factor ksh, as shown in (2).
The skew factor and stator slot opening factors, ksh and kxh, are assumed to be equal to 1.
Simulation results in Figure 4 show that the magnets placed radially inner position (e.g., Flat 1 and V shape) are more resistant to demagnetization. However, when magnets are buried deeper, the weight and volume of the design generally become greater. The results in Figure 4 also show that the SPM machine is the most sensitive design to magnet demagnetization, followed by the spoke-type and FSCW-IPM machines. The relatively low resistance to demagnetization of both IPM designs can be explained by the greater d-axis inductance, which, in turn, reduces the number of series turns and lowers the fundamental MMF per rotor pole for a given current. The VU-shape machine, on the other hand, exhibits good demagnetization characteristics for the given demagnetizing MMF range since the lower d-axis inductance for this machine leads to higher fundamental MMF per pole for a given current. The V-shape, Flat 1, and FI-IPM designs have excellent demagnetization resistance. Notice that only fundamental demagnetizing MMF is considered in Figure 4 without including the impact of the spatial harmonics in FSCW-PM machines. If the harmonic MMFs were included, the overall demagnetizing MMF per pole for these machines would increase.
3.2. Remanence Ratio Contour Plots
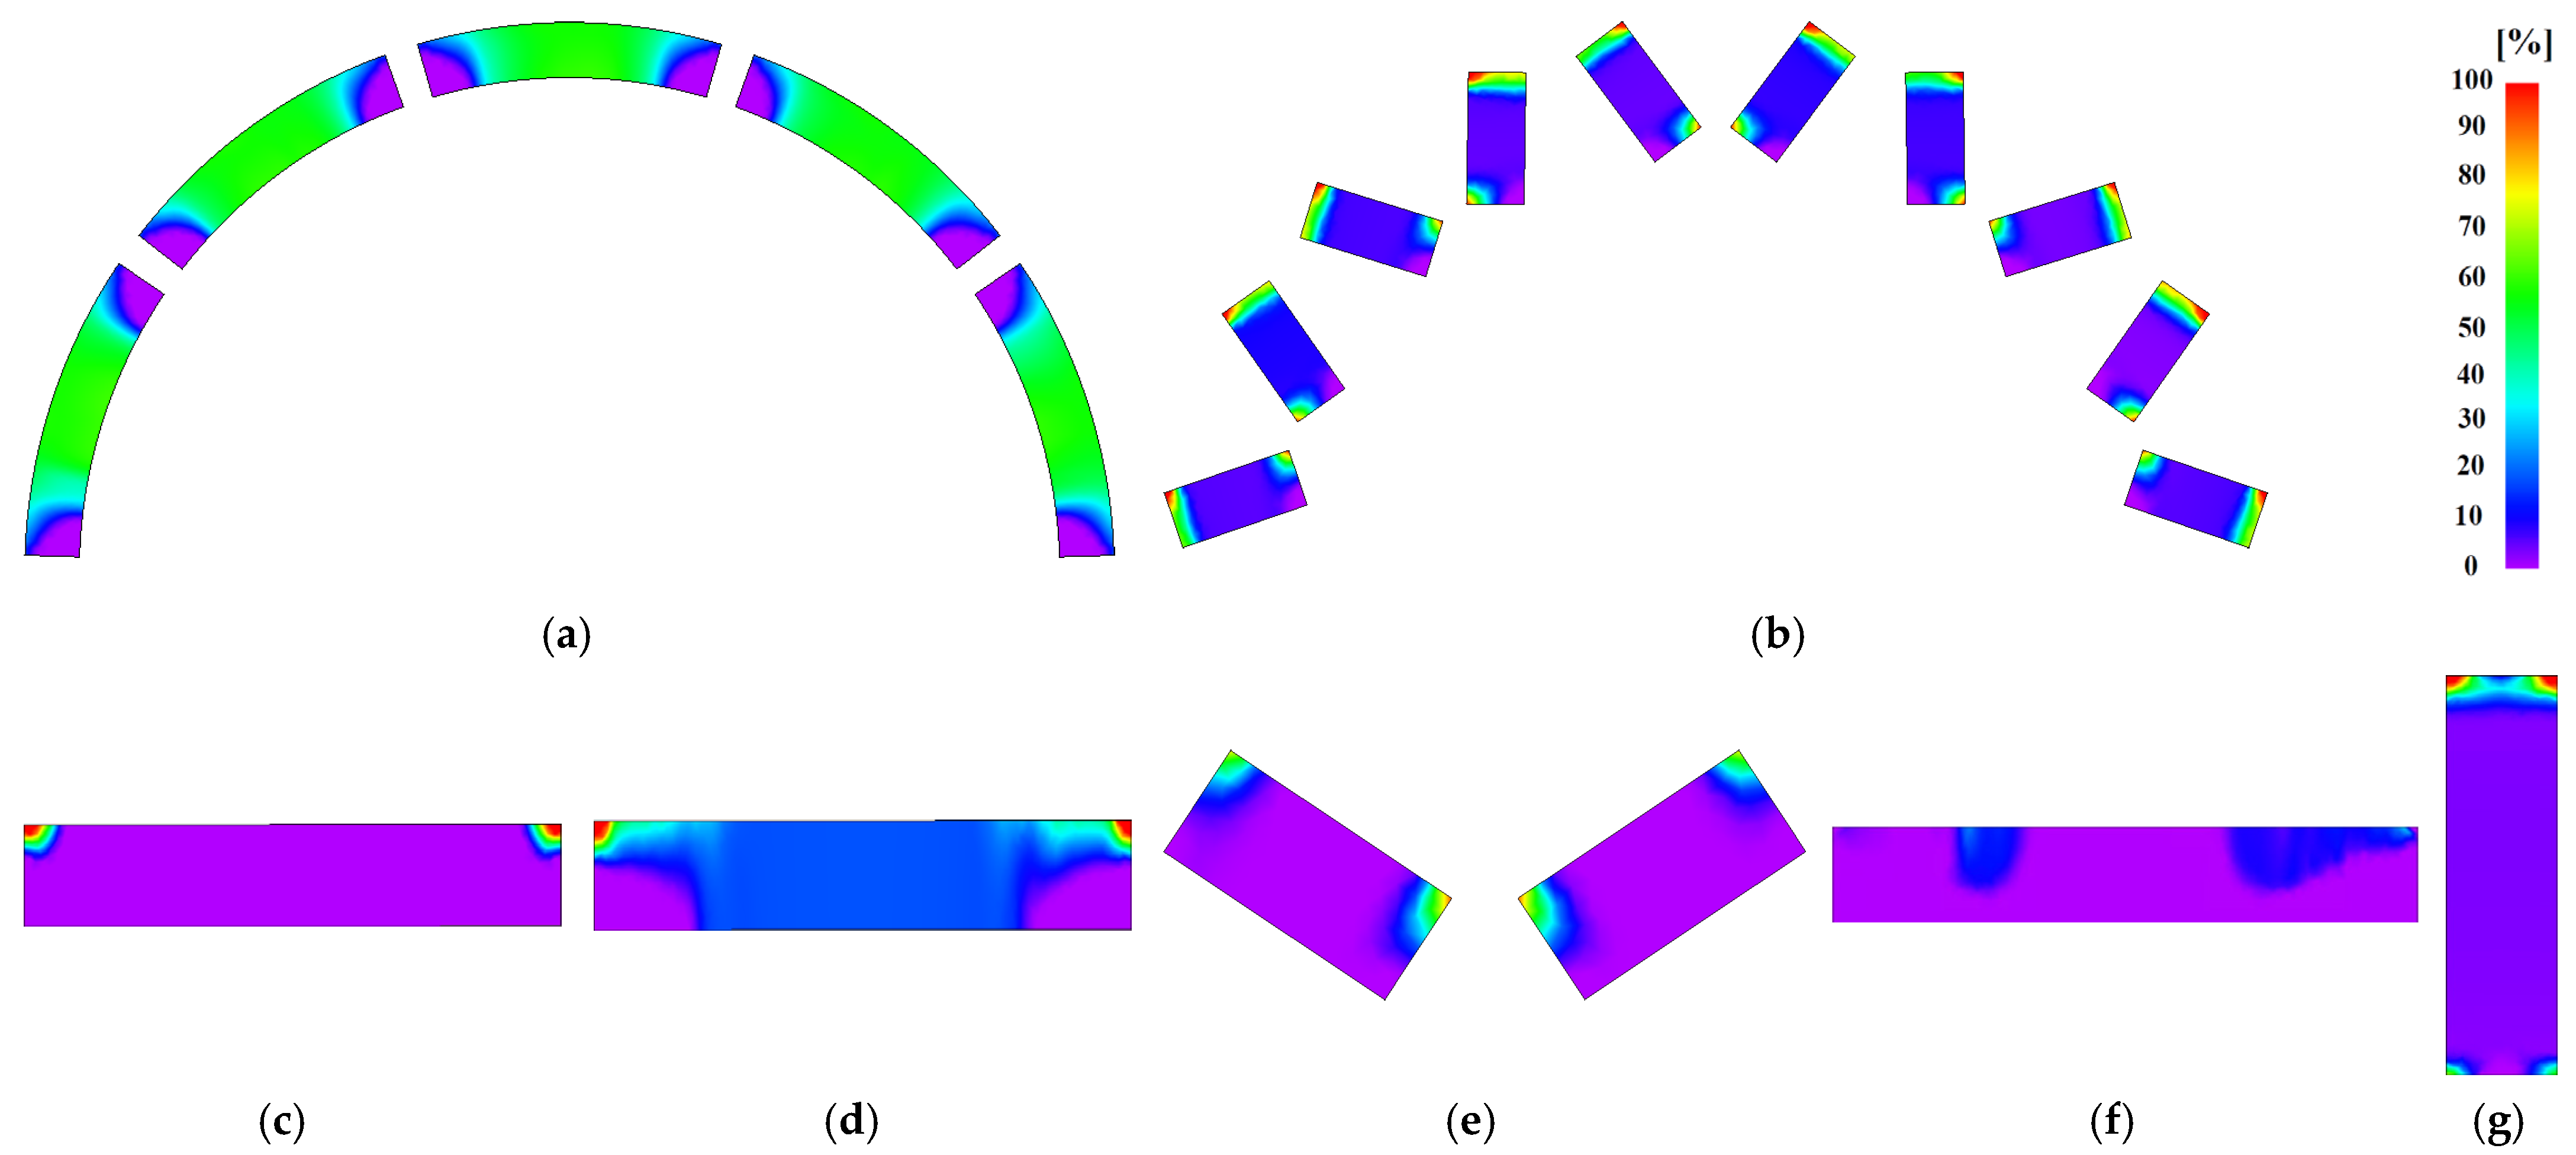
The color contour plots of the remanence ratio within the entire rotor magnets give additional insight into the baseline machines’ demagnetization characteristics. Figure 5 shows a rotor pole unit after applying the 5 pu negative d-axis current for one electrical cycle. The remanence ratio (in %) represents the reduction in magnet remanence and is expressed as follows:
where Bro is the initial magnet remanence and Br is the post-demagnetization magnet remanence.
Consider the FSCW-SPM machine’s results first. The results of the remanence ratio in Figure 5a show the extensive demagnetization in the rotor magnets, with most of the magnet material’s remanence values decreasing by approx. 45% of its initial value. The SPM machine has the worst demagnetization among the eight baseline PM machines because its magnets are directly exposed in the air gap area without having additional leakage flux paths.
Figure 5b,d,g indicates that the demagnetization rates of the FSCW-IPM, Flat 2, and spoke machines are as high as the SPM machine values. Except for the areas near the leakage flux paths, the reduction in magnet strength for these three machines is rather modest, compared to the SPM machine, with remanence ratio values typically ranging from 5 to 25%. The rotor bridge and post provide magnetic shunts for the demagnetizing MMF, leading to the reduction of overall demagnetization risks. It should be noted that the flux passing through these bypasses demagnetizes the neighboring magnet material significantly.
Flat 1, V-shape, and FI-IPM machines are the three most favorable designs with regard to demagnetization resistance. Figure 5c,e,f shows very little decrease in flux density strength in most magnet materials for these three machines, except for significant losses near the magnet edge areas. Despite having a larger number of poles than the rest of the baseline machines, the two FSCW machines have generally higher demagnetization rates when compared with the DW-PM machines. This is primarily due to the harmonic demagnetizing MMFs that exist in these types of machines, as reported in [29].
3.3. Demagnetization Index
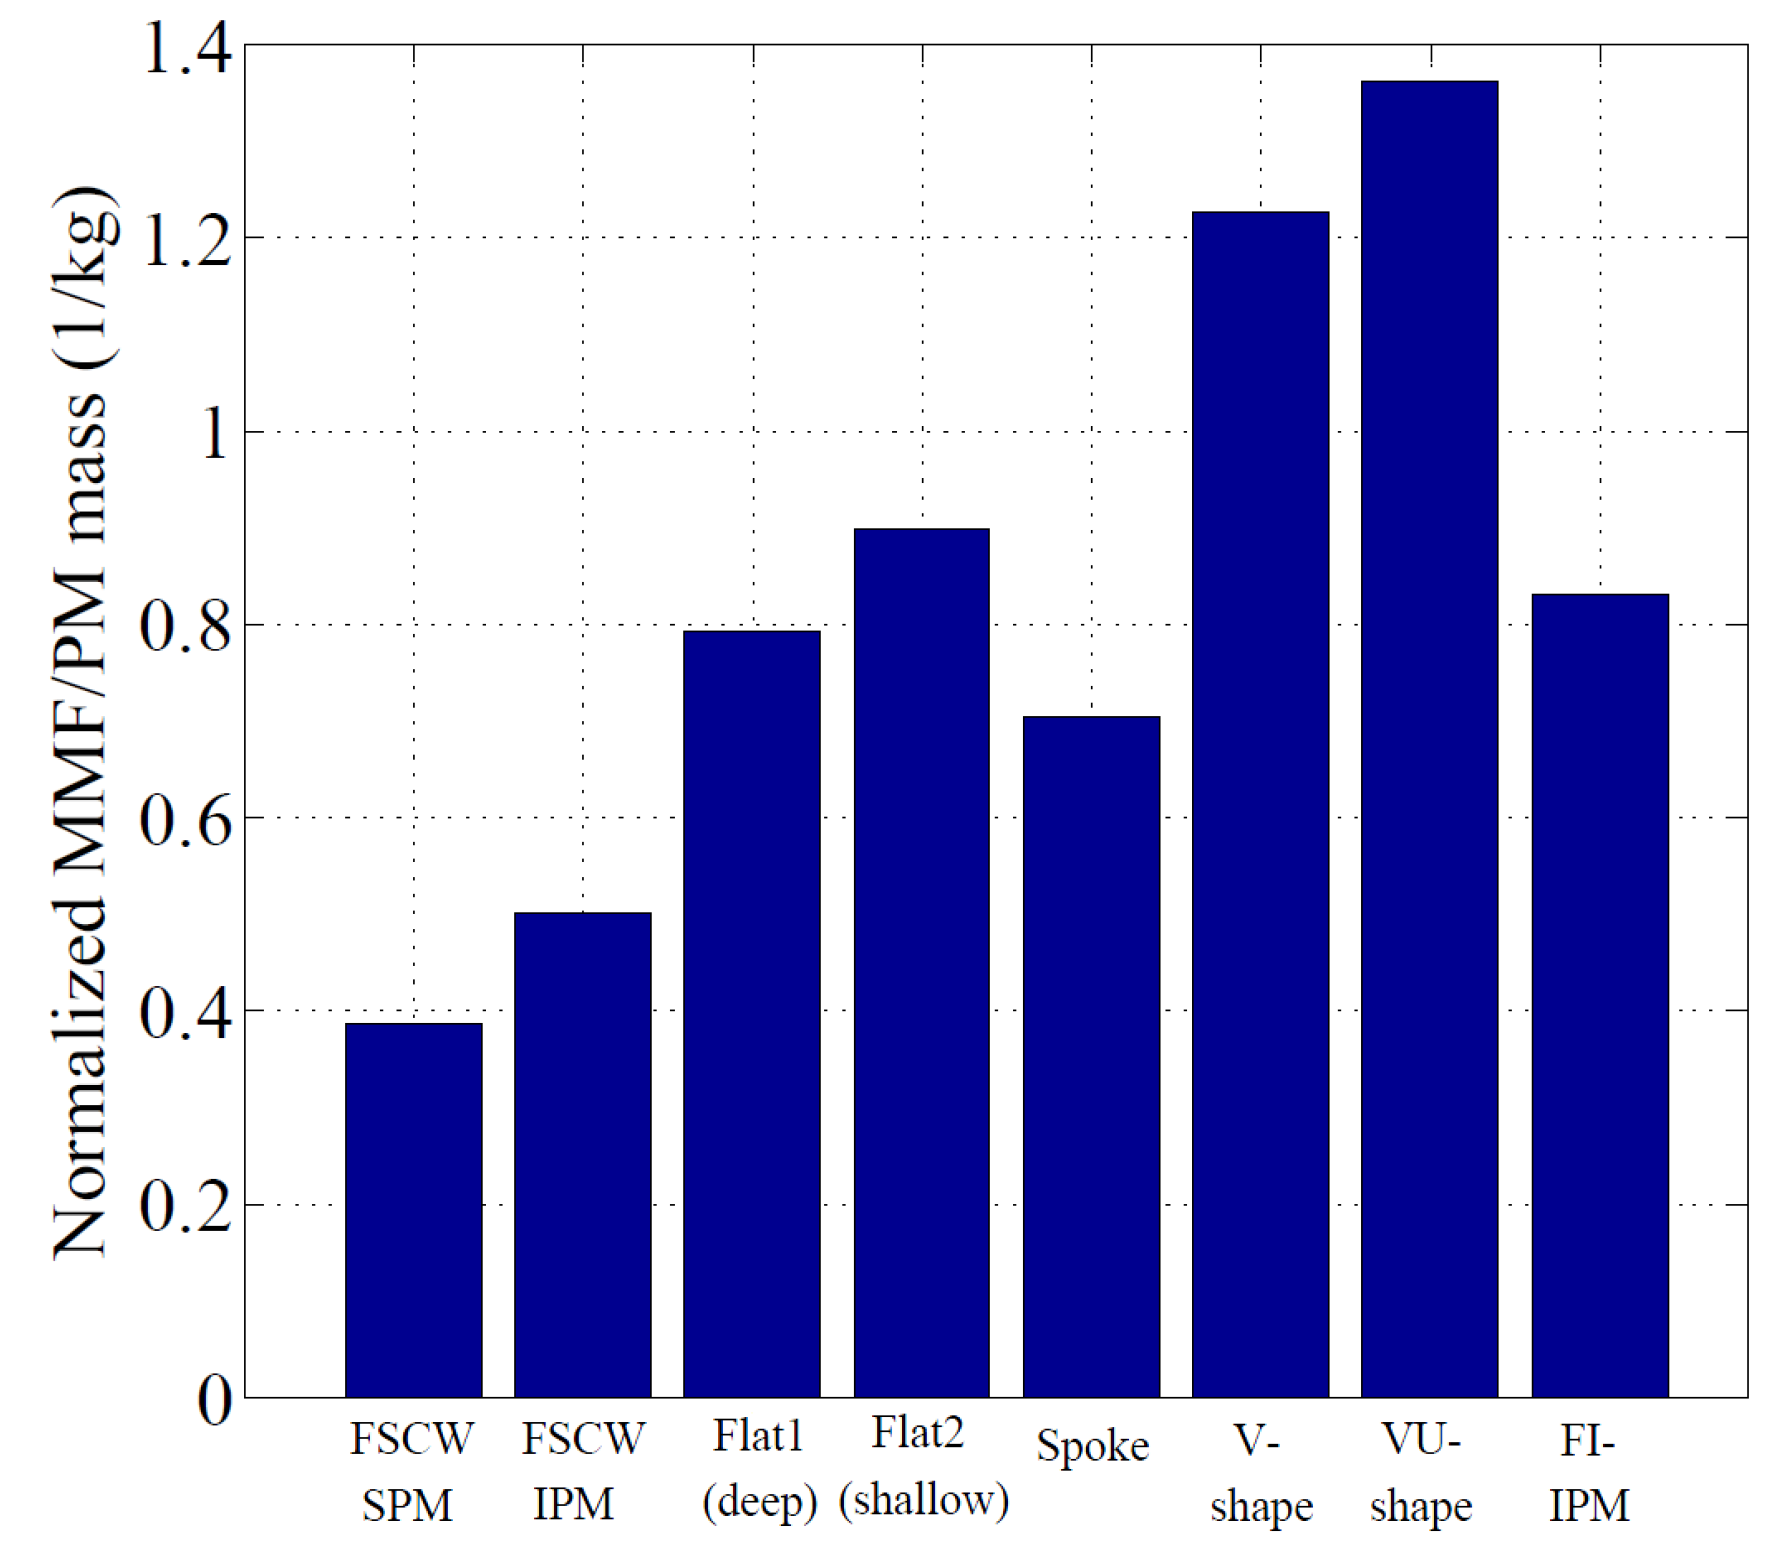
Thus far, two different magnetization quantification methods are used to provide numerical and graphical representations of the demagnetization state for the baseline machines: demagnetization rate and remanence ratio. Unfortunately, these approaches do not take into account the impact of each machine’s magnet mass on its demagnetization resistance. A new demagnetization index metric was introduced to reflect the impact of the total magnet mass on the demagnetization-withstand capability. The demagnetization index is expressed as follows:
Demagnetization index = Normalized Demagnetization MMF/Magnet Mass [kg]
The demagnetization MMF indicated in (4) is the stator MMF necessary to produce a 3% threshold demagnetization rate in each baseline machine employing negative d-axis current. This demagnetization MMF is then normalized by the demagnetizing MMF value necessary to produce the 3% demagnetization ratio value for the SPM machine (=1090 A-turns) and then divided by total magnet mass. The resultant demagnetization index value serves as a measure of the maximum demagnetizing MMF that a machine can withstand per unit PM mass.
The demagnetization index values for each of the eight baseline machines are shown in Figure 6. When the impact of magnet mass is considered, the Flat 1 machine and the FI-IPM machine, which scored high with regard to demagnetization resistance capability without considering the magnet mass, drop in ranks. Overall, the VU-shape machine, which is followed by the V-shape machine, has the greatest demagnetization index value.
3.4. Impact of q-Axis Current
It was shown in [26] that demagnetization can be mitigated by adding q-axis current. Although the impact of increasing q-axis current varies depending on the degree of demagnetization state and detailed rotor structure, the rate of demagnetization reduces as the magnitude of q-axis current rises. In order to provide a better explanation of why the presence of q-axis current tends to reduce demagnetization risks, Figure 7 shows vector plots of the magnetic flux density inside the VU-shape machine with two different values of q-axis current, iq = 0 and 2 pu. It clearly shows that demagnetizing flux crosses the magnets along the d-axis and flows out the adjacent d-axis when there is negative d-axis current only. However, the addition of q-axis current shifts the direction of the demagnetizing flux towards the q-axis, parallel to magnet faces.
4. Experimental Verification
Tested FSCW-IPM Machine
This section presents experimental results of a demagnetization test to collect measured data for comparison with FE analysis results. Due to the limited budget on this study, the PM machines shown in Figure 2 were not able to be manufactured for experimental verification. Instead, a commercial IPM machine shown in Figure 8a that was used in [30] was chosen for testing in this study. Table 3 summarizes the key parameters and dimensions of the tested machine. Custom-sized, low coercivity NdFeB magnets were used for testing to make the magnets more vulnerable to demagnetization during tests. Figure 8b shows measured B–H curve characteristics of the tested magnets at room temperature, indicating that the magnet properties are midway between the characteristics of N48 and N52 grades. Figure 8b also shows extrapolated B–H curves of the custom magnets at a higher temperature of 100 degC using an estimated thermal coefficient based on the measured properties at room temperature.
Figure 9a shows the test configuration that can perform demagnetization tests under a locked-rotor condition. Figure 10a,b shows that phase-a winding is excited by an externally applied 20A current pulse, generating a total of 2010 ampere-turns, at a rotor magnet temperature of 100 degC, while the terminals of the other two phases short-circuit each other. Figure 10c shows that the north poles are aligned with the Phase-a stator windings, while the south poles are located midway between the axes of phase b and c windings.
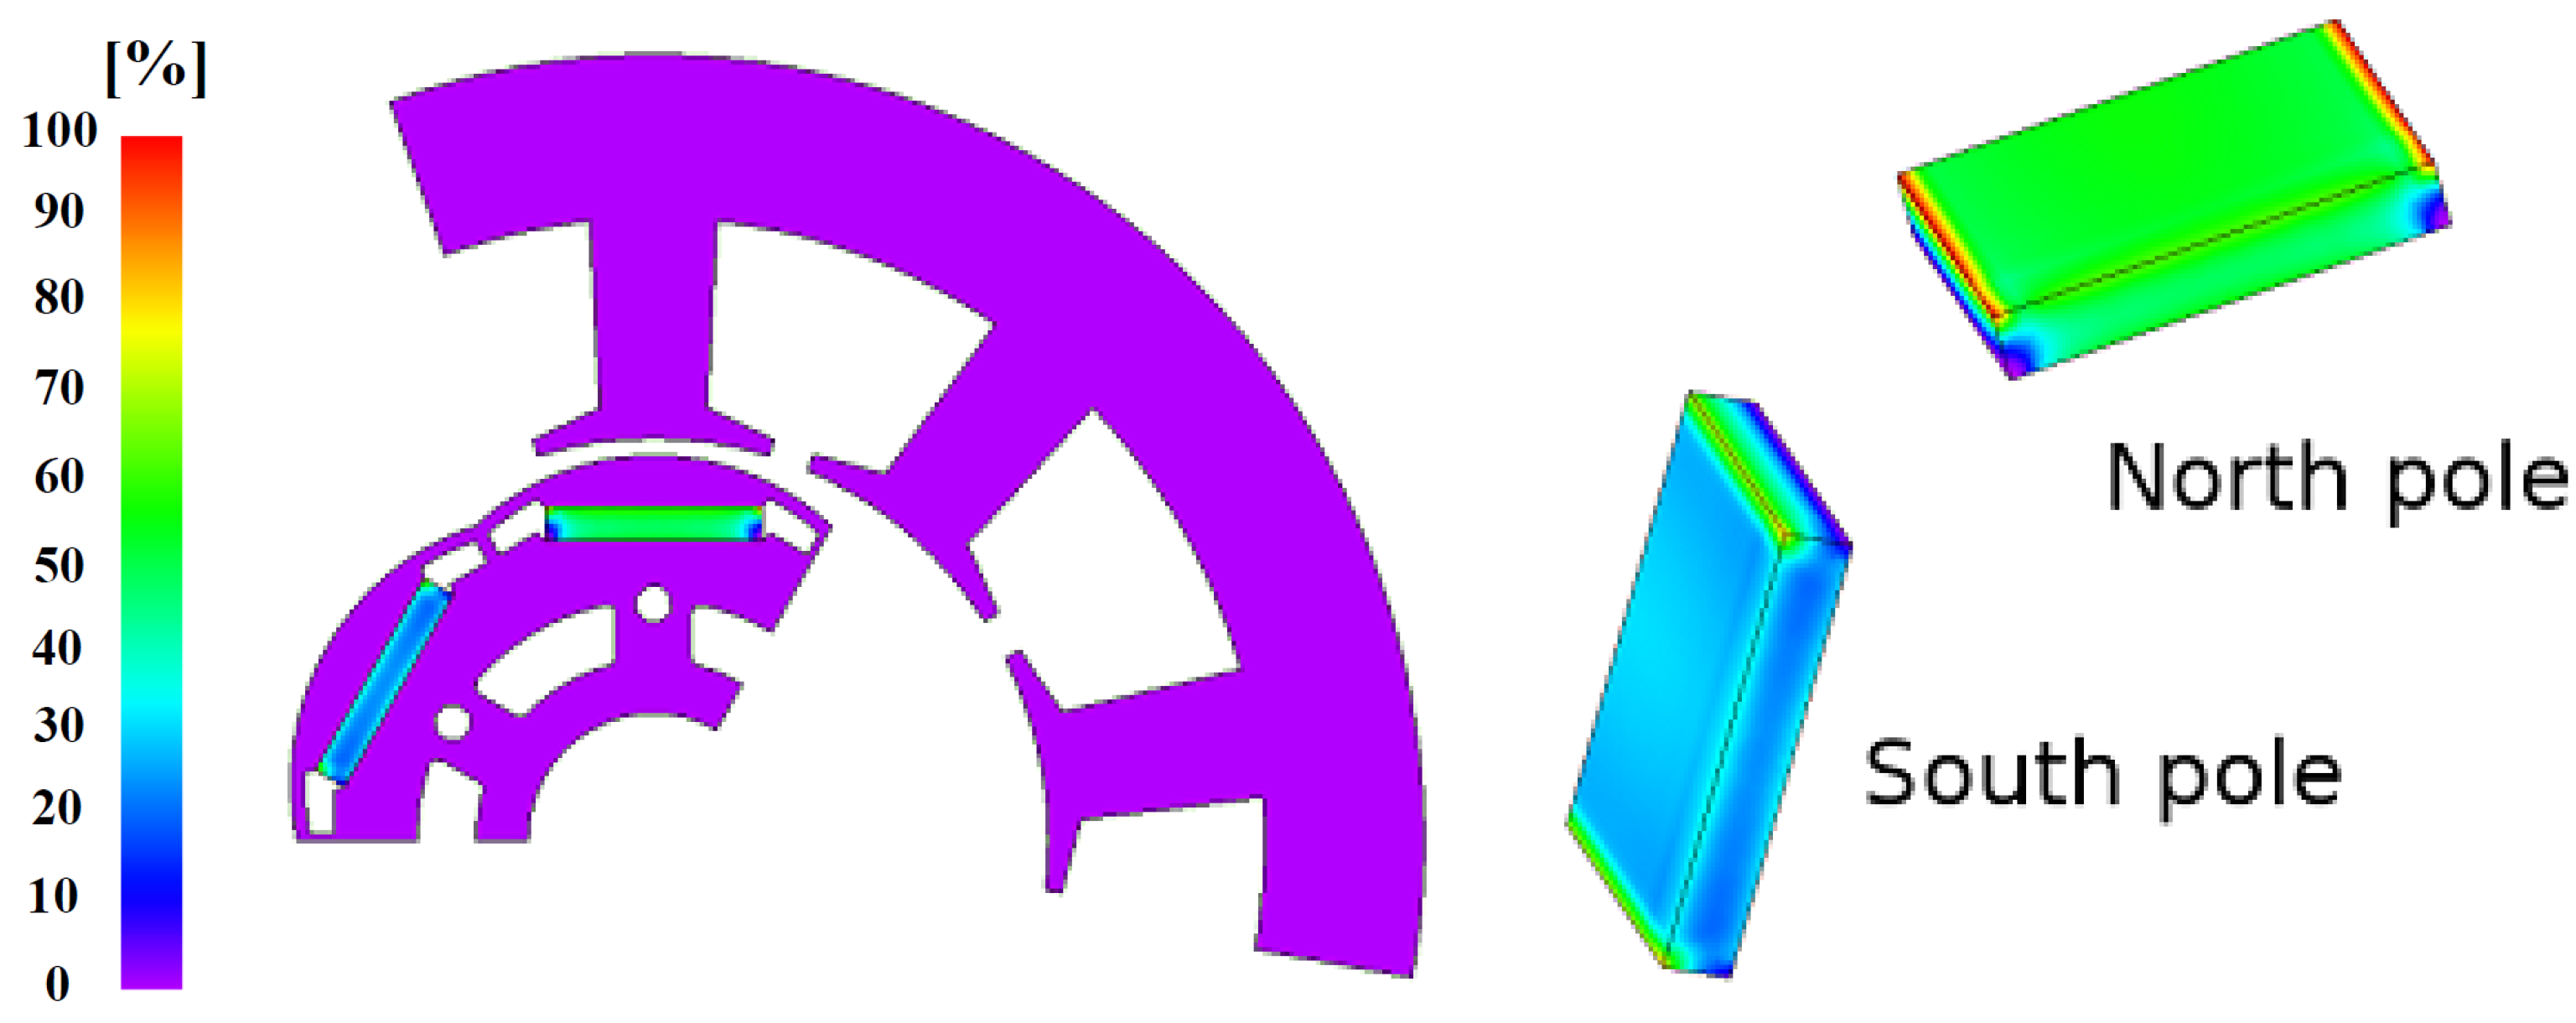
Time-stepped, 3D FE analysis was performed to simulate the rotor demagnetization at 100 degC under a locked-rotor condition. Figure 11 shows contour plots of the predicted remanence ratio throughout the magnets in two adjacent poles after applying the demagnetizing current pulse. The FE-calculated remanence ratio results shown in Figure 11 predict approx. 50% loss of remanence for most of the north pole, with losses reaching 100% in a very localized region at the north pole magnet corners. In contrast, relatively mild demagnetization is predicted in the south pole. More detailed studies revealed that the resulting demagnetization level in the magnets is very sensitive to the magnet properties used in FE analysis, indicating that neither of the thermal coefficients using N48- and N52-grade matches well with test results. As explained previously, magnet properties in Figure 8b that are midway between the characteristics of N48 and N52 grades were used for comparison between simulation and experimental results.
Figure 12 shows a comparison between the measured surface flux density of the same North pole magnet in air measured before and after the locked rotor test with a 20A current pulse in phase-a at 100 degC, together with a % difference. For magnet flux density measurement, an AN_180KIT Hall probe with a very thin (<0.65 mm) sensor probe and a high flux density (±1 T) range was used. Key specifications and dimensions of this Hall probe are provided in Table 4. A commercial BW Bell Hall gaussmeter was used to calibrate the Hall probe. A commercial Zaber three-axis linear motion stage was used for precise measurement of the surface flux density of the individual magnets in the air.
The measured reduction of the magnet’s surface flux density around the lower y-position area is approx. 44%, slightly lower than the FE-predicted reduction of 50% when using the B–H curve characteristics from Figure 8b. Figure 12 shows that the demagnetization damage is also more severe at the lower y-axis position, which is adjacent to the heat gun nozzles. This is due to the nonuniform temperature distribution of the magnets in the axial direction. Figure 12 shows that the measured demagnetization damage from the locked-rotor test in a magnet south pole is much less severe, as expected.
In order to provide a more meaningful comparison between the FE predictions and measured results, the % difference of FE-predicted and measured demagnetization values at three different points on the north pole magnet after the locked-rotor test were compared; the results are shown in Table 5. The three measurement points marked on the north pole magnet are shown in Figure 12a. These particular measurement points are selected because the experimental magnet temperature from the three points is approx. 100 degC, which is assumed as magnet operating temperature in FE analysis. Results in Table 5 show that the FE results match well with the measured results with errors ranging from 2 % to 8 %.
The direct flux density measurement on the magnet surface, as shown in Figure 12, is a very efficient method to quantify any localized demagnetization in the magnets. However, it is very time consuming to measure the flux density directly from each of the tested magnets. It is also noted that the data obtained from this measurement cannot be represented as aggregated information of the test machine. This information can be measured through the air gap or stator windings when the magnets are mounted in the machine after the demagnetization.
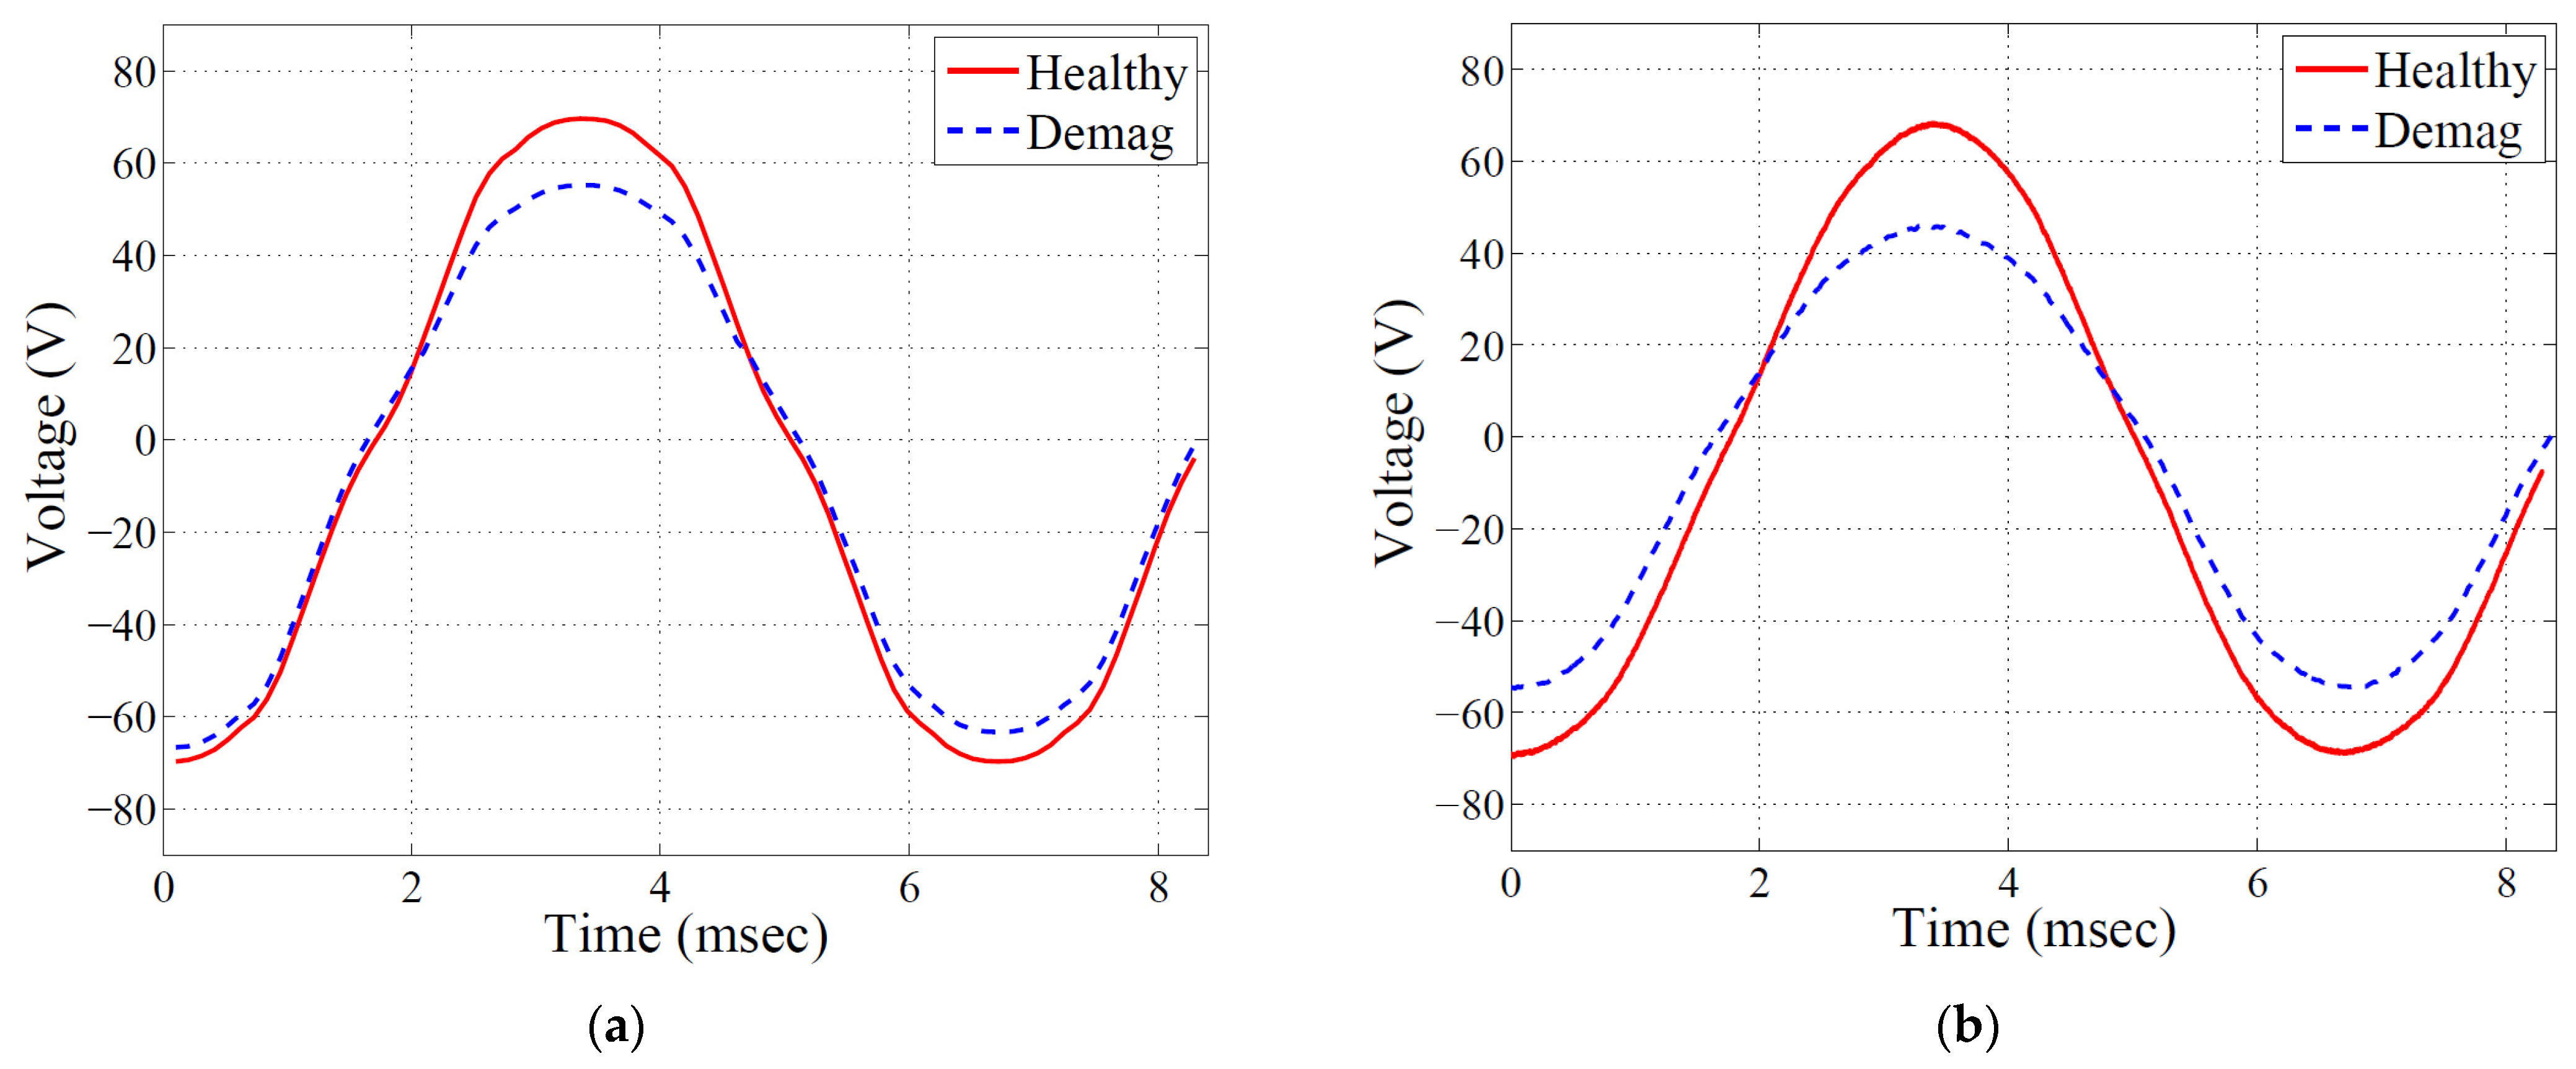
Figure 13 shows a comparison between the back-emf voltage waveforms with healthy and demagnetized magnets following the locked-rotor test using both FE-predicted and measured results. The terminal voltages were measured while the rotor was spinning at 3000 rpm under a no-load condition. Comparing the amplitude of the post-demagnetization back-emf voltages, the FE results underestimate by approx. 13%. Possible sources of discrepancy include the error in estimating the magnet thermal coefficients and the complex machine geometry. The waveshape is consistent with the previous results in Figure 12, showing different amplitudes for the positive and negative peak back-emf voltages due to the severe demagnetization concentrated on the north pole magnets. It is convenient to use the back-emf voltage measurement for evaluating the average reduction in the magnet flux linkage and thus the average torque production capability. However, the localized information available from the direct measurement is lost because the induced back-emf voltage is equal to the integration of the position-dependent flux density waveform over one electric cycle.
5. Discussion
The accuracy of FE analysis can be compromised due to several different factors such as FE modeling accuracy in material property, machine geometry, and B–H curve characteristics, as well as manufacturing tolerances. Previous comparison results in Section 3 and Section 4 show that the resulting demagnetization level in the magnets is very sensitive to the magnet thermal coefficients. Accurate thermal coefficient values can only be obtained from multiple experimental measurements over the wide temperature range in a temperature-controlled condition, which is often not possible in academic lab environments. In addition, any errors in modeling the B–H curve of rotor magnets can affect the accuracy of simulation results. Techniques based on piecewise-linear modeling, exponential modeling, and data-array-based methods are most popular among various modeling methods. It is very difficult to make machine parts as precise as initially designed due to the inevitable inaccuracy of the manufacturing process. For this reason, the impact of manufacturing tolerances such as eccentricity, errors in the properties of permanent magnets, and machine dimensions can also be a source of discrepancy. Any errors in estimating the saturation level of the machine lamination core (i.e., B–H curve data sheets provided by lamination manufacturers) can also be a source of discrepancy.
In order to improve the accuracy of FE predictions for comparison with experimental data, 3D FE analysis was carried out in Section 4. When compared with the results calculated by 2D analysis, 3D results show much better modeling accuracy because the end effects that are not included in the 2D analysis have a significant impact. Despite the complex nature of machine geometry and saturation effect, developing a hybrid method that combines 2D analysis and analytically calculated end leakages, such as in [17], has received continued attention. However, the exact calculation of the end leakages is still a challenging task.
As explained in Section 1, several demagnetization test results have been reported over the past decade. Unfortunately, the majority of past work was conducted in a special environment and thus failed at providing practical data. This paper presents valuable test results on a commercially constructed FSCW-IPM machine, including both local and global magnet demagnetization data for comparison with FE results.
6. Conclusions
This paper presents a comprehensive investigation of rotor demagnetization characteristics for several different PM machine configurations under the influence of demagnetization MMF by performing time-stepped FE simulations. New quantitative metrics that provide both aggregate and localized measurements of the demagnetization severity resulting from demagnetizing MMF were defined in order to evaluate the resulting magnet demagnetization in PM machines. The increased risks of demagnetization posed by moving magnets from deep inside the rotor poles to external mounting on the rotor core were clearly shown in the simulation results. The machines equipped with the distributed winding configurations show less vulnerability to demagnetization than the concentrated winding machines. In addition, the ability of the q-axis current to redirect rotor magnetic flux into more benign rotor paths that reduce the risk of demagnetization for IPM machines was graphically demonstrated.
A test configuration was built and utilized to experimentally verify the predicted rotor demagnetization characteristics for a fractional-power FSCW-IPM machine. Overall, the tests conducted using the FSCW-IPM test machine succeeded in providing a meaningful collection of measured pre- and post-demagnetization test data, which builds confidence in the FE predictions and key results developed in the paper regarding rotor demagnetization characteristics.
The work presented here can be used as design recommendations for machine designers to identify promising machine configurations when magnet demagnetization is of critical importance. Future work will be about identifying key machine parameters that are effective to mitigate the demagnetization risks and evaluating its engineering trade-offs.
Funding
This work was supported in part by Inha University Research Grant and by the BK21 Four Program funded by the Ministry of Education (MOE, Korea) and the National Research Foundation of Korea (NRF).
Institutional Review Board Statement
Not applicable.
Informed Consent Statement
Not applicable.
Acknowledgments
The author would like to thank the Wisconsin Electric Machines and Power Electronics Consortium (WEMPEC) for making its laboratory facilities available for the experimental work in this study.
Conflicts of Interest
The author declares no conflict of interest.
Abbreviations
| 2D | Two-dimensional |
| 3D | Three-dimensional |
| DW | Distributed windings |
| EV | Electric vehicle |
| FE | Finite element |
| FI | Flux intensifying |
| FSCW | Fractional-slot concentrated winding |
| FW | Distributed winding |
| IPM | Interior permanent magnet |
| MMF | Magnetomotive force |
| NdFeB | Neodymium–iron–boron |
| PM | Permanent magnet |
| PMSM | Permanent magnet synchronous machine |
| pu | Per unit |
| SPM | Surface permanent magnet |
References
- Ruoho, R.; Kolehmainen, J.; Ikaheimo, J.; Arkkio, A. Interdependence of Demagnetization, Loading, and Temperature Rise in a PM Synchronous Motor. IEEE Trans. Magn. 2010, 46, 949–953. [Google Scholar] [CrossRef]
- Lipo, T.A. Introduction to AC Machine Design; University of Wisconsin: Madison, WI, USA, 2007. [Google Scholar]
- Hendershot, J.R.; Miller, T.J.E. Design of Brushless Permanent Magnet Machines; Clarendon: Oxford, UK, 2010. [Google Scholar]
- Bianchi, N.; Jahns, T.M. (Eds.) Design, Analysis, and Control of Interior PM Synchronous Machines, Tutorial Course Notes. In Proceedings of the IEEE Industry Appl. Society Annual Meeting, Seattle, WA, USA, 3–7 October 2004. [Google Scholar]
- Sanada, M.; Inoue, Y.; Morimoto, S. Rotor Structure for Reducing Demagnetization of Magnet in a PMASynRM with Ferrite Permanent Magnet and its Characteristics. In Proceedings of the IEEE Energy Conversion Congress and Exposition (ECCE), Phoenix, AZ, USA, 17–22 September 2011; pp. 4189–4194. [Google Scholar]
- Vagati, A.; Boazzo, B.; Guglielmi, P.; Pellegrino, G. Design of Ferrite Assisted Synchronous Reluctance Machines Robust towards Demagne-tization. IEEE Trans. Ind. Appl. 2013, 50, 1768–1779. [Google Scholar] [CrossRef] [Green Version]
- Farooq, J.; Srairi, S.; Djerdir, A.; Miraoui, A. Use of Permeance Network Method in the Demagnetization Phenomenon Modeling in a Permanent Magnet Motor. IEEE Trans. Magn. 2006, 42, 1295–1298. [Google Scholar] [CrossRef]
- Kang, G.-H.; Hur, J.; Sung, H.-G.; Hong, J.-P. Optimal Design of Spoke Type BLDC Motor Considering Irreversible Demagnetization of Permanent Magnet. In Proceedings of the International Conference Electrical Machines and Systems (ICEMS), Beijing, China, 9–11 November 2003; Volume 1, pp. 234–237. [Google Scholar]
- Bianchi, N.; Bolognani, S.; Luisem, F. Potentials and Limits of High-Speed PM Motors. IEEE Trans. Ind. Appl. 2004, 40, 1570–1578. [Google Scholar] [CrossRef]
- Lee, B.-K.; Kang, G.-H.; Hur, J.; You, D.-W. Design of Spoke Type BLDC Motors with High Power Density for Traction Applications. In Proceedings of the IEEE Ind. Applicat. Conf. 39th IAS Annu. Meeting, Seattle, WA, USA, 3–7 October 2004; Volume 2, pp. 1068–1074. [Google Scholar]
- Hosoi, T.; Watanabe, H.; Shima, K.; Fukami, T.; Hanaoka, R.; Takata, S. Demagnetization Analysis of Additional Permanent Magnets in Salient-Pole Synchronous Machines With Damper Bars Under Sudden Short Circuits. IEEE Trans. Ind. Electron. 2012, 59, 2448–2456. [Google Scholar] [CrossRef]
- Kim, K.-C.; Kim, K.; Kim, H.J.; Lee, J. Demagnetization Analysis of Permanent Magnets According to Rotor Types of Interior Permanent Magnet Synchronous Motor. IEEE Trans. Magn. 2009, 45, 2799–2802. [Google Scholar]
- Ruoho, S.; Kolehmainen, J.; Ikaheimo, J.; Arkkio, A. Demagnetization Testing for a Mixed-Grade Dovetail Permanent-Magnet Machine. IEEE Trans. Magn. 2009, 45, 3284–3289. [Google Scholar] [CrossRef]
- McFarland, J.D.; Jahns, T.M. Investigation of the rotor demagnetization characteristics of interior PM synchronous machines during fault conditions. In Proceedings of the IEEE Energy Conversion Congress and Exposition (ECCE), Raleigh, NC, USA, 15–20 September 2012; pp. 4021–4028. [Google Scholar]
- McFarland, J.D.; Jahns, T.M. Influence of d- and q-Axis Currents on Demagnetization in PM Synchronous Machines. In Proceedings of the Energy Conversion Congress & Exposition (ECCE), Denver, CO, USA, 15–19 September 2013; pp. 4380–4387. [Google Scholar]
- Kakihara, W.; Takemoto, M.; Ogasawara, S. Rotor Structure in 50 kW Spoke-Type Interior Permanent Magnet Synchronous Motor with Ferrite Permanent Magnets for Automotive Applications. In Proceedings of the Energy Conversion Congress and Exposition (ECCE), Denver, CO, USA, 15–19 September 2013; pp. 606–613. [Google Scholar]
- Lee, S.G.; Kim, K.-S.; Lee, J.; Kim, W.H. A Novel Methodology for the Demagnetization Analysis of Surface Permanent Magnet Synchronous Motors. IEEE Trans. Magn. 2016, 52, 1–4. [Google Scholar] [CrossRef]
- Bekir, W.; Messal, O.; Benabou, A. Permanent Magnet Non-linear Demagnetization Model for FEM Simulation Environment. IEEE Trans. Magn. 2021. [Google Scholar] [CrossRef]
- Fukisaki, J.; Furuya, A.; Shitara, H.; Uehara, Y.; Kobayashi, K.; Hayashi, Y.; Ozaki, K. Demagnetization Correction Method by Using Inverse Analysis Considering Demagnetizing Field Distribution. IEEE Trans. Magn. 2020, 56, 1–4. [Google Scholar] [CrossRef]
- Kong, Y.; Lin, M.; Yin, M.; Hao, L. Rotor Structure on Reducing Demagnetization of Magnet and Torque Ripple in a PMa-SynRM with Ferrite Permanent Magnet. IEEE Trans. Magn. 2018, 54, 1–5. [Google Scholar] [CrossRef]
- Yoon, K.-Y.; Hwang, K.-Y. Optimal Design of Spoke-Type IPM Motor Allowing Irreversible Demagnetization to Minimize PM Weight. IEEE Access 2021, 9, 65721–65729. [Google Scholar] [CrossRef]
- Wang, M.; Zhu, H.; Zhou, C.; Zheng, P.; Tong, C. Analysis and Optimization of a V-shape Combined Pole Interior Permanent-Magnet Synchronous Machine with Temperature Rise and Demagnetization Considered. IEEE Access 2021, 9, 64761–64775. [Google Scholar] [CrossRef]
- Kim, K.; Lee, Y.; Hur, J.; Member, S. Transient Analysis of Irreversible Demagnetization of Permanent-Magnet Brushless DC Motor with Interturn Fault Under the Operating State. IEEE Trans. Ind. 2014, 50, 3357–3364. [Google Scholar] [CrossRef]
- le Roux, W.; Harley, R.G.; Habetler, T.G. Detecting Rotor Faults in Low Power Permanent Magnet Synchronous Machines. IEEE Trans. Power Electron. 2007, 22, 322–328. [Google Scholar] [CrossRef]
- Xiong, H.; Zhang, J.; Degner, M.W.; Rong, C.; Liang, F.; Li, W. Permanent Magnet Demagnetization Test Fixture Design and Validation. IEEE Trans. Ind. Appl. 2016, 52, 2961–2970. [Google Scholar] [CrossRef]
- Choi, G.; Jahns, T.M. Demagnetization Characteristics of Permanent Magnet Synchronous Machines. In Proceedings of the 40th Annual Conference of the IEEE Industrial Electronics Society (IECON), Dallas, TX, USA, 29 October–1 November 2014; pp. 469–475. [Google Scholar]
- Chu, W.Q.; Zhu, Z.Q. Average Torque Separation in Permanent Magnet Synchronous Machines using Frozen Permeability. IEEE Trans. Magn. 2013, 49, 1202–1210. [Google Scholar] [CrossRef]
- Limsuwan, N.; Kato, T.; Akatsu, K.; Lorenz, R.D. Design and Evaluation of a Variable-Flux Flux-Intensifying Interior Permanent-Magnet Machine. IEEE Trans. Ind. Appl. 2014, 50, 1015–1024. [Google Scholar] [CrossRef]
- Choi, G.; Jahns, T.M. Analysis and Design Recommendations to Mitigate Demagnetization Vulnerability in Surface PM Synchronous Machines. IEEE Trans. Ind. Appl. 2018, 54, 1292–1301. [Google Scholar] [CrossRef]
- Choi, G.; Zhang, Y.; Jahns, T.M. Experimental Verification of Rotor Demagnetization in a Fractional-Slot Concentrated-Winding PM Synchronous Machine Under Drive Fault Conditions. IEEE Trans. Ind. Appl. 2017, 53, 3467–3475. [Google Scholar] [CrossRef]
Figure 1.
Magnet B–H curve characteristics and magnetic field strength H contours and flux lines for an SPM machine: (a) variation of magnet operating point on a B–H curve; (b) magnet flux alone; (c) demagnetizing MMF alone.
Figure 1.
Magnet B–H curve characteristics and magnetic field strength H contours and flux lines for an SPM machine: (a) variation of magnet operating point on a B–H curve; (b) magnet flux alone; (c) demagnetizing MMF alone.
Figure 2.
Cross-sectional views of seven baseline PM machines: (a) 12-slot/10-pole FSCW-IPM; (b) 12-slot/10-pole FSCW-SPM; (c) 48-slot/8-pole DW-IPM (spoke type); (d) 48-slot/8-pole DW-IPM (Flat 1); (e) 48-slot/8-pole DW-IPM (Flat 2); (f) 48-slot/8-pole DW-IPM (V shape); (g) 48-slot/8-pole DW-IPM (VU shape).

Figure 3.
Cross-sectional views of the two IPM machines: (a) FI-IPM machine; (b) FW-IPM (Flat 2) machine.
Figure 3.
Cross-sectional views of the two IPM machines: (a) FI-IPM machine; (b) FW-IPM (Flat 2) machine.
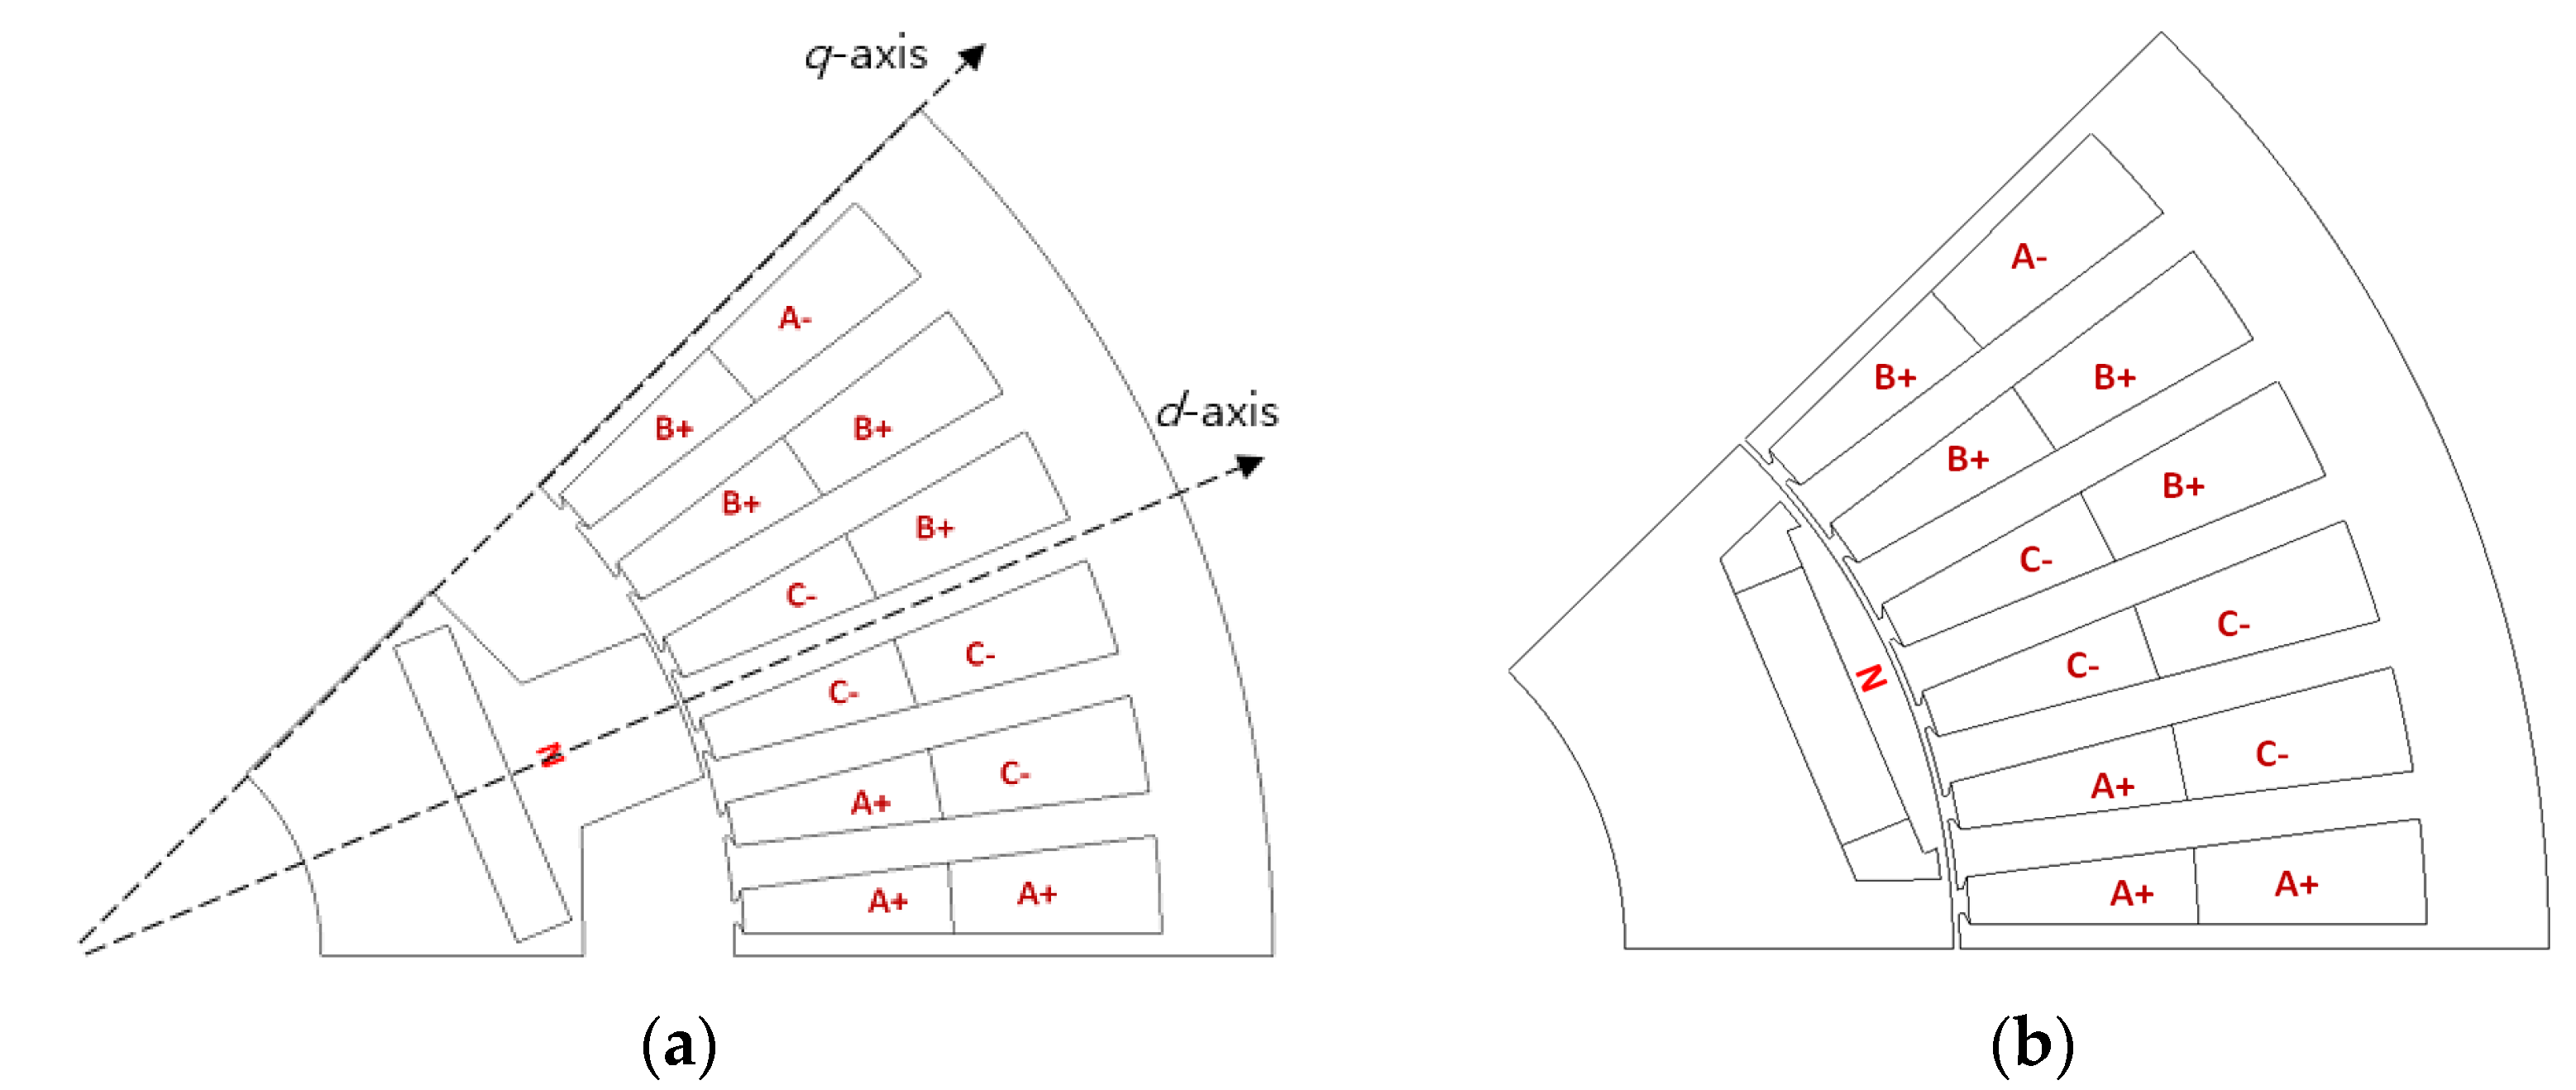
Figure 4.
Demagnetization rate vs. fundamental MMF per pole for the eight baseline PM machines.

Figure 5.
Contour plots of magnet remanence ratio values for the eight baseline PM machines (id = -5 p.u., iq = 0 p.u.): (a) FSCW-SPM; (b) FSCW-IPM; (c) DW-IPM (Flat 1); (d) DW-IPM (Flat 2); (e) DW-IPM (V shape); (f) FI-IPM; (g) DW-IPM (spoke).
Figure 5.
Contour plots of magnet remanence ratio values for the eight baseline PM machines (id = -5 p.u., iq = 0 p.u.): (a) FSCW-SPM; (b) FSCW-IPM; (c) DW-IPM (Flat 1); (d) DW-IPM (Flat 2); (e) DW-IPM (V shape); (f) FI-IPM; (g) DW-IPM (spoke).

Figure 6.
Demagnetization index representing normalized demagnetizing MMF per unit magnet mass.

Figure 7.
Magnetic flux density contour and vector plots for the VU-shape machine with 2 different q-axis current values in addition to -5 pu d-axis current: (a) iq = 0 pu; (b) iq = 2 pu.
Figure 7.
Magnetic flux density contour and vector plots for the VU-shape machine with 2 different q-axis current values in addition to -5 pu d-axis current: (a) iq = 0 pu; (b) iq = 2 pu.

Figure 8.
(a) Tested IPM machine; (b) B–H characteristics of the tested NdFeB magnets at 20 degC and 100 degC.
Figure 8.
(a) Tested IPM machine; (b) B–H characteristics of the tested NdFeB magnets at 20 degC and 100 degC.
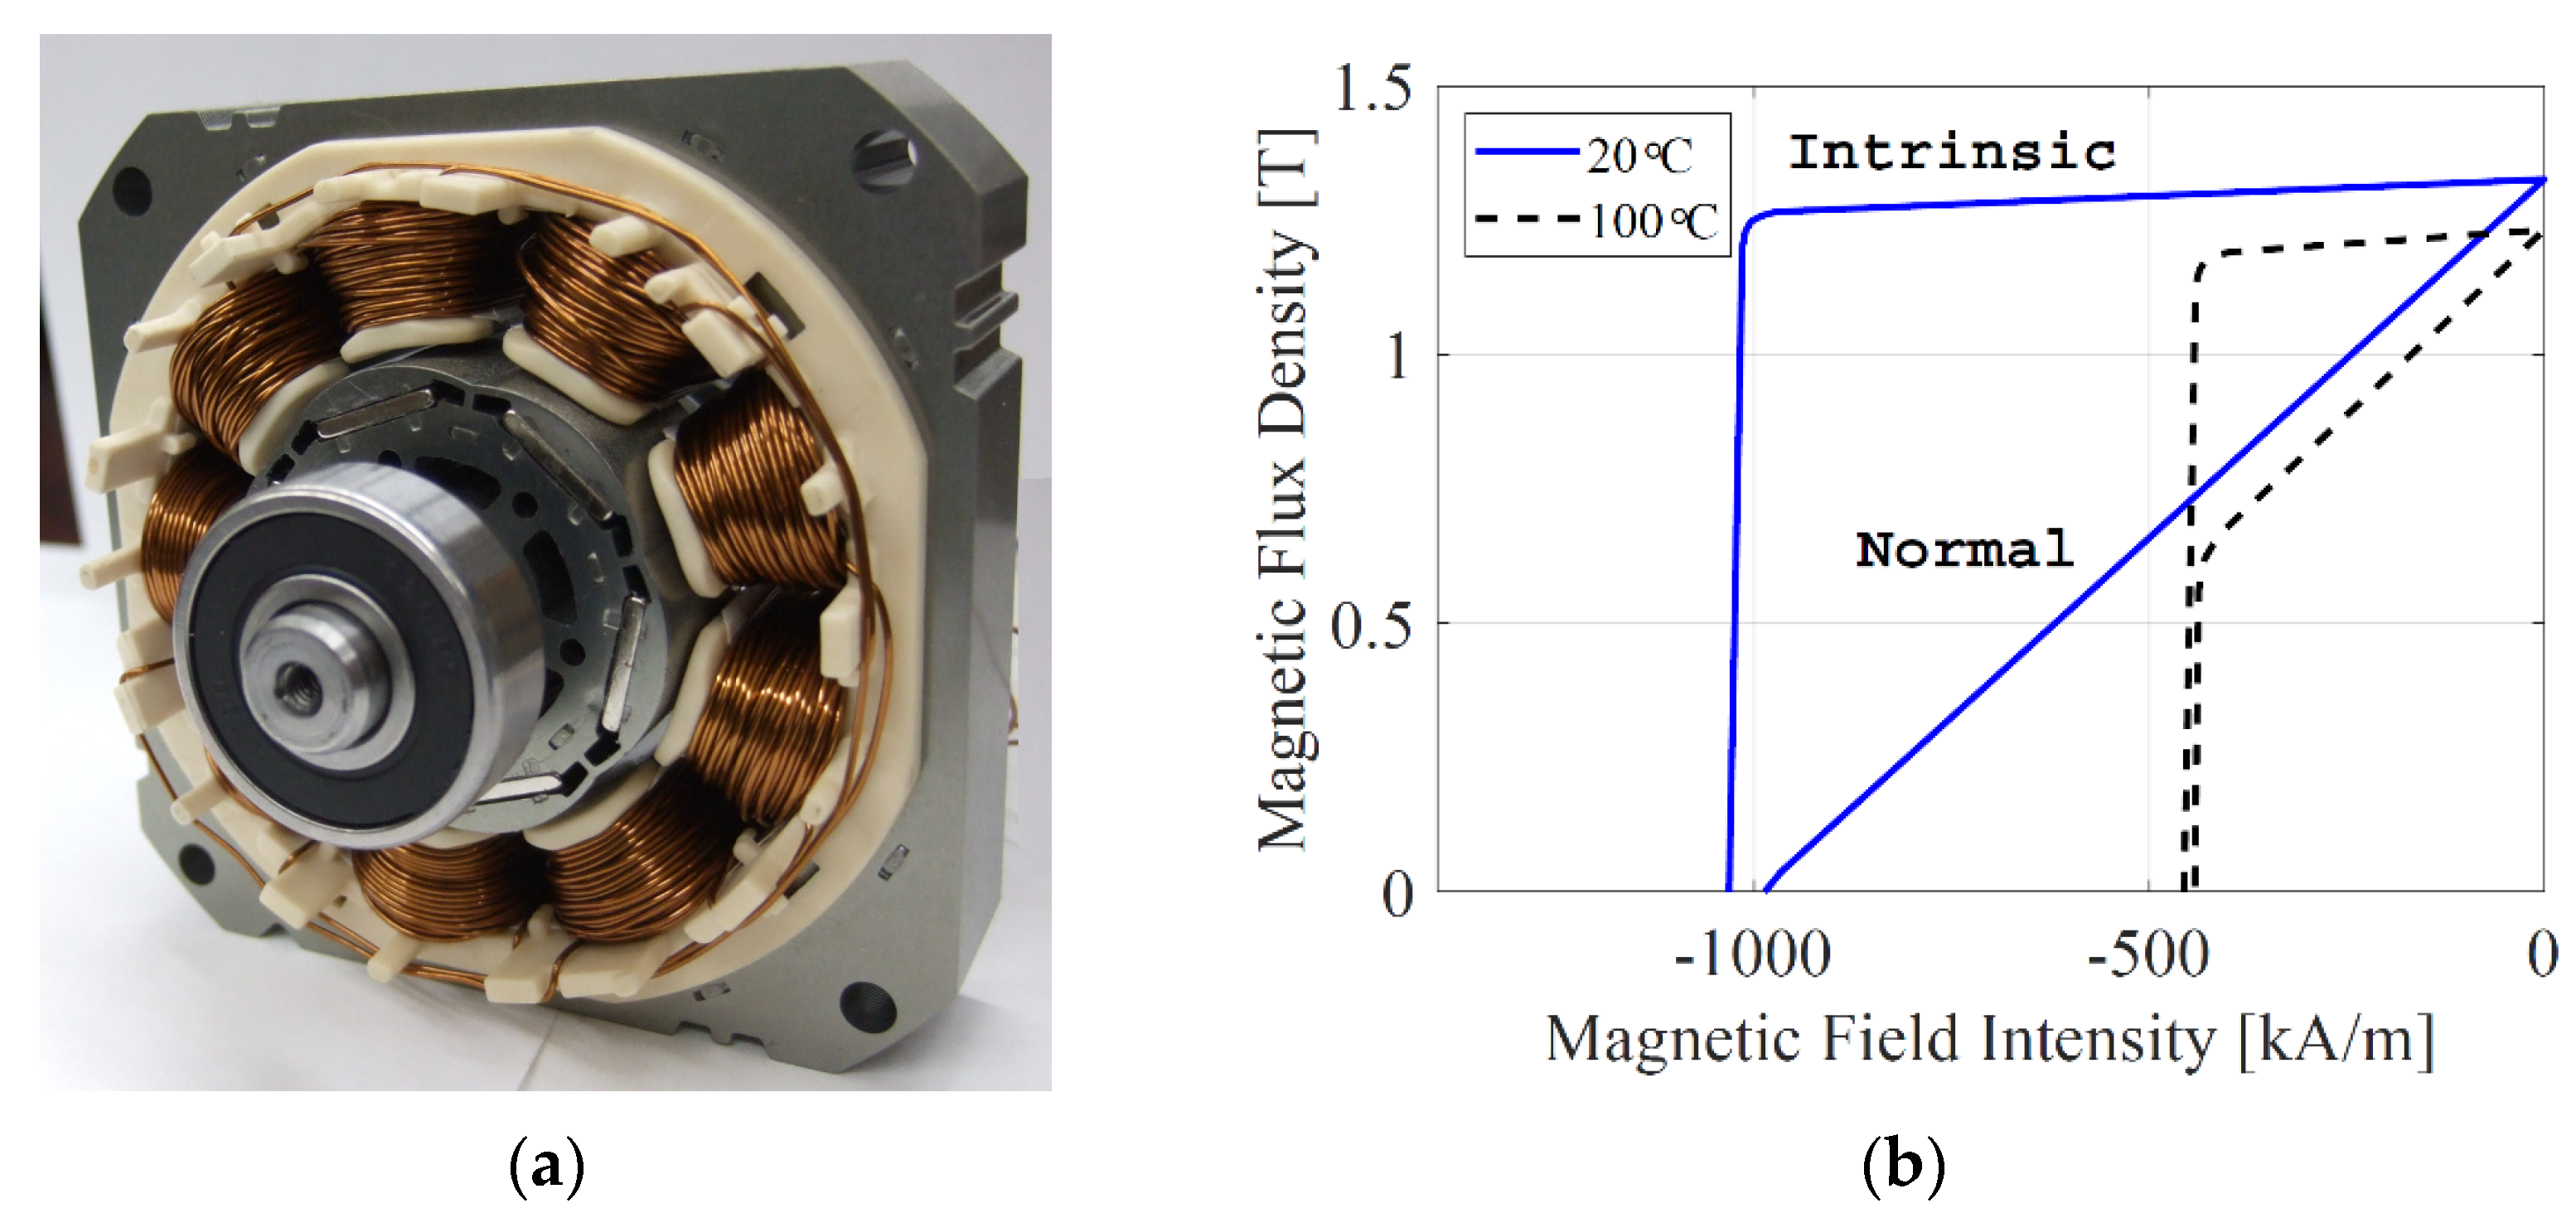
Figure 9.
Dynamometer test configuration: (a) locked-rotor test setup; (b) heat gun with duckbill nozzles for temperature control.
Figure 9.
Dynamometer test configuration: (a) locked-rotor test setup; (b) heat gun with duckbill nozzles for temperature control.
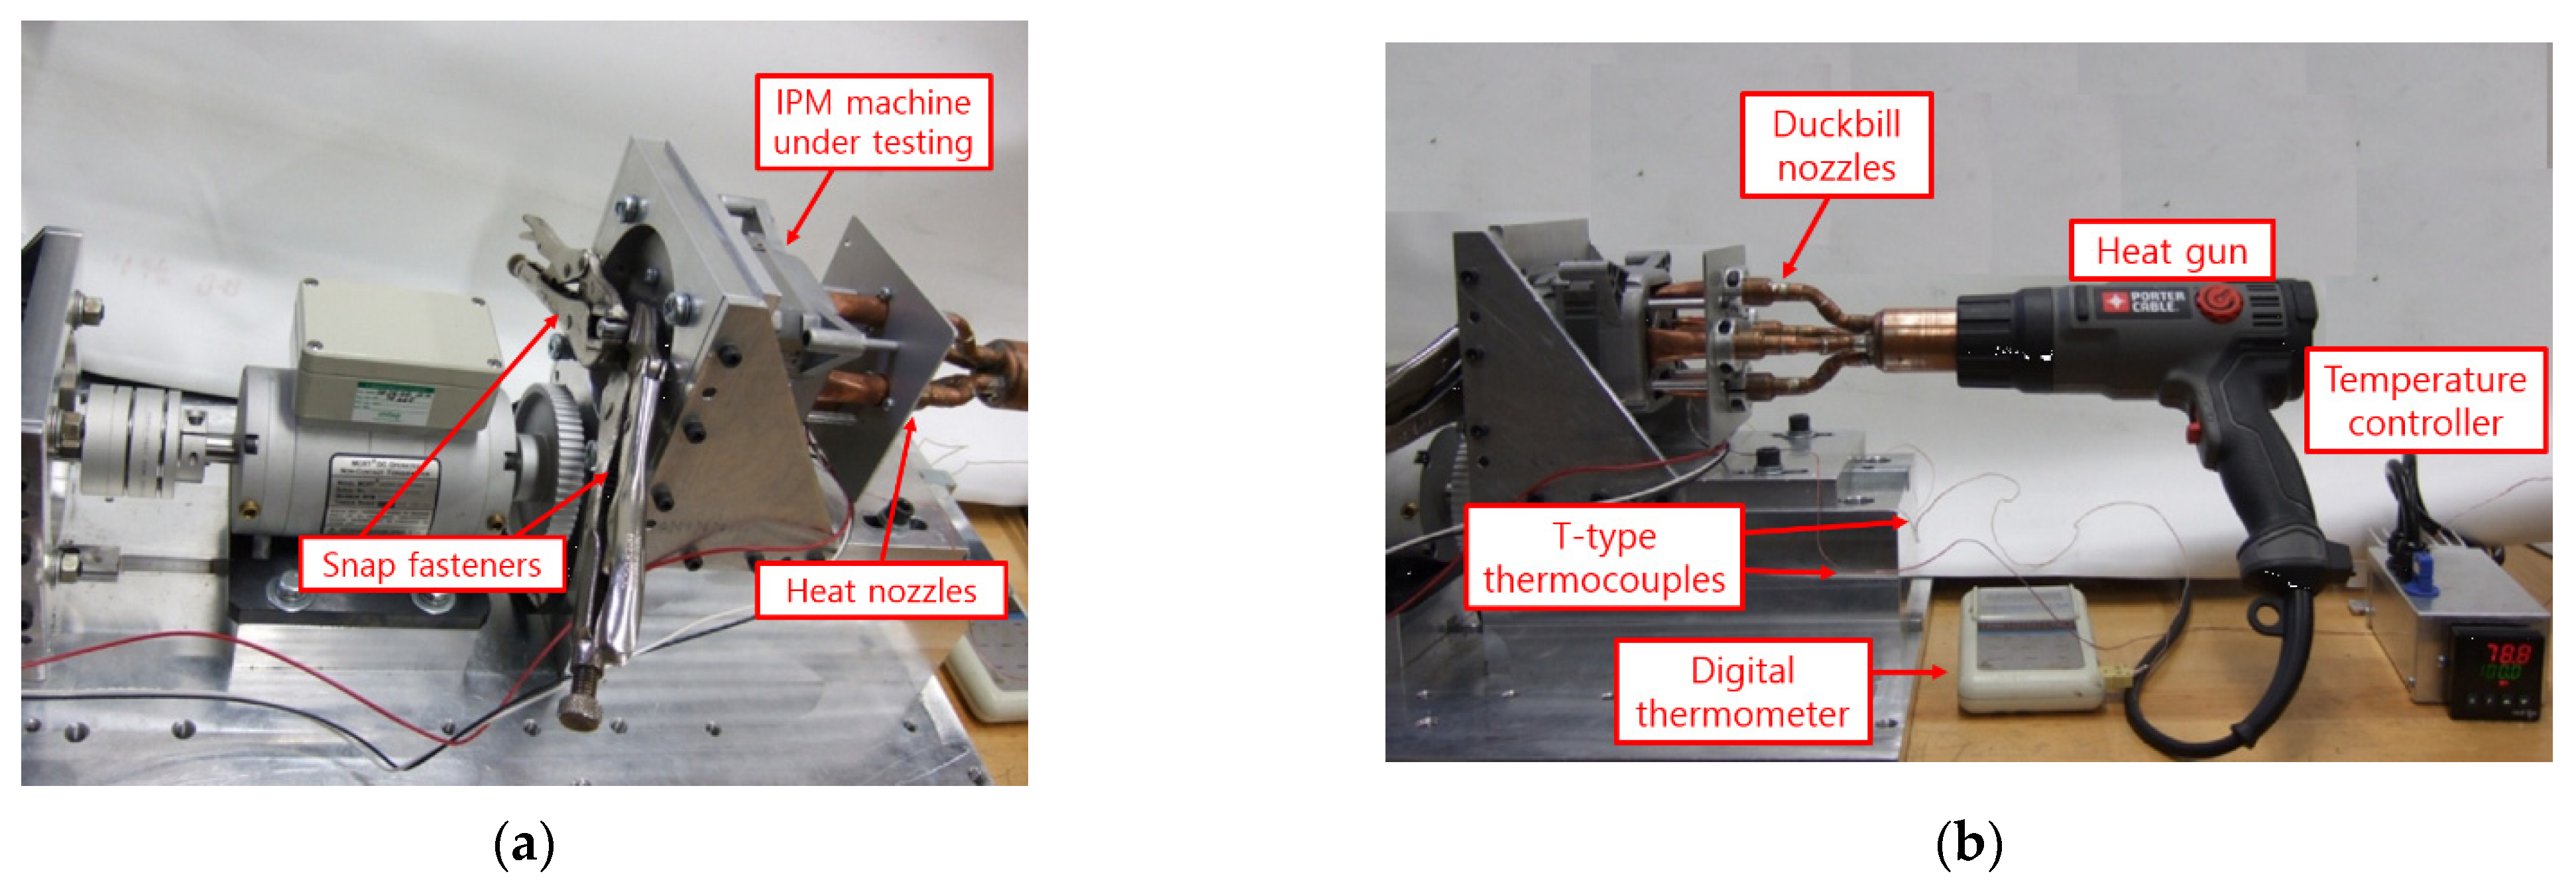
Figure 10.
(a) Winding schematic; (b) current pulse waveform; (c) rotor position during locked-rotor test.
Figure 10.
(a) Winding schematic; (b) current pulse waveform; (c) rotor position during locked-rotor test.

Figure 11.
FE-predicted magnet remanence ratio in the experimental IPM after locked-rotor test using the estimated thermal coefficients (20 A at 100 degC).
Figure 11.
FE-predicted magnet remanence ratio in the experimental IPM after locked-rotor test using the estimated thermal coefficients (20 A at 100 degC).
Figure 12.
Comparison of measured surface flux density of the same magnets in air before (left) and after (middle) the locked-rotor test with 20 A current pulse at 100 degC and the reduction (in %) of surface flux density after the locked-rotor test (right): (a) north pole; (b) south pole. Three measurement points are marked in the north pole magnet (left).

Figure 13.
Comparison of the line-to-line back-emf waveforms for the IPM test machine. Both pre-test healthy magnets (solid lines) and demagnetized magnets (dashed line) after the locked-rotor test are shown: (a) FE-predicted; (b) measured.
Figure 13.
Comparison of the line-to-line back-emf waveforms for the IPM test machine. Both pre-test healthy magnets (solid lines) and demagnetized magnets (dashed line) after the locked-rotor test are shown: (a) FE-predicted; (b) measured.

Table 1.
Summary of key information of the seven baseline PM machines.
| Dimensions/Metrics | Design 1 | Design 2 | Design 3 | Design 4 | Design 5 | Design 6 | Design 7 |
|---|---|---|---|---|---|---|---|
| Winding type | FSCW | FSCW | ISDW | ISDW | ISDW | ISDW | ISDW |
| Rotor type | SPM | V shape | Flat 1 | Flat 2 | Spoke | V shape | VU shape |
| Slot/pole | 12/10 | 12/10 | 48/8 | 48/8 | 48/8 | 48/8 | 48/8 |
| Stator diameter [mm] | 275 | 261 | 273 | 291 | 260 | 291 | 291 |
| Rotor diameter [mm] | 160 | 160 | 160 | 160 | 160 | 160 | 160 |
| Stack length [mm] | 96 | 98 | 113 | 88 | 148 | 88 | 85 |
| Estimated volume [pu] | 1.09 | 1 | 1.26 | 1.13 | 1.50 | 1.13 | 1.09 |
| Magnet remanence [T] at 180 degC | 1.01 | 1.01 | 1.01 | 1.01 | 1.01 | 1.01 | 1.01 |
| Unsaturated saliency | ≈1 | 1.51 | 2.18 | 2.21 | 1.58 | 2.39 | 2.29 |
| Magnet mass [kg] | 2.59 | 2.23 | 2.40 | 1.71 | 2.11 | 1.55 | 1.41 |
Table 2.
Key design parameters and performance metrics of the FI-IPM and FW-IPM machines.
| Parameter | FI-IPM | FW-IPM |
|---|---|---|
| Slot/pole | 48/8 | 48/8 |
| Peak power/torque at base speed | 80.5 kW/281 Nm | 80.5 kW/281 Nm |
| Peak speed | 10,000 r/min | 10,000 r/min |
| Stator/rotor diameter | 290.8 mm/160 mm | 290.8 mm/160 mm |
| Airgap length | 0.73 mm | 0.73 mm |
| Magnet remanence | 1.01 T at 180 degC | 1.01 T at 180 degC |
| Active stack length | 120 mm | 88 mm |
| Magnet mass | 2.10 kg | 1.71 kg |
| Total active mass | 47.02 kg | 37.61 kg |
Table 3.
Key parameters for the tested IPM machine.
| Parameter | Value | Parameter | Value |
|---|---|---|---|
| Number of slots | 9 | Number of poles | 6 |
| Series turns | 301.5 | Number of coils/phase | 3 |
| Stator diameter | 92.1 [mm] | Rotor diameter | 45 [mm] |
| Active length | 19.5 [mm] | Airgap length | 1 [mm] |
Table 4.
Key specifications for the AN_180KIT Hall probe.
| Parameter | Value | Parameter | Value |
|---|---|---|---|
| Max. sensor tip thickness | 0.65 mm | Linear magnetic field range | ±1 T |
| Frequency range | 0 to 20 kHz | Operating temperature | 0 to 50 °C |
| Sensitivity | 1.069 mV/mT | Offset | 2.54 V |
Table 5.
Differences between FE results and measured demagnetization values.
| Measurement Point | FE Results | Measured |
|---|---|---|
| Point A | 33.8% | 32.3% |
| Point B | 51.3% | 43.3% |
| Point C | 33.6% | 35.7% |
Publisher’s Note: MDPI stays neutral with regard to jurisdictional claims in published maps and institutional affiliations. |
© 2021 by the author. Licensee MDPI, Basel, Switzerland. This article is an open access article distributed under the terms and conditions of the Creative Commons Attribution (CC BY) license (https://creativecommons.org/licenses/by/4.0/).
Share and Cite
MDPI and ACS Style
Choi, G. Analysis and Experimental Verification of the Demagnetization Vulnerability in Various PM Synchronous Machine Configurations for an EV Application. Energies 2021, 14, 5447. https://doi.org/10.3390/en14175447
AMA Style
Choi G. Analysis and Experimental Verification of the Demagnetization Vulnerability in Various PM Synchronous Machine Configurations for an EV Application. Energies. 2021; 14(17):5447. https://doi.org/10.3390/en14175447
Chicago/Turabian StyleChoi, Gilsu. 2021. "Analysis and Experimental Verification of the Demagnetization Vulnerability in Various PM Synchronous Machine Configurations for an EV Application" Energies 14, no. 17: 5447. https://doi.org/10.3390/en14175447
Note that from the first issue of 2016, this journal uses article numbers instead of page numbers. See further details here.