Article

Numerical Investigation of Top Coal Drawing Evolution in Longwall Top Coal Caving by the Coupled Finite Difference Method-Discrete Element Method

1
Key Laboratory of In-Situ Property-Improving Mining of Ministry of Education, Taiyuan University of Technology, Taiyuan 030024, China
2
Anhui Province Wanbei Coal-Electricity Group Co., Ltd., Suzhou 234000, China
3
Shaanxi Provincial Key Laboratory of Geological Support for Coal Green Exploitation, Xi’an University of Science and Technology, Xi’an 710054, China
*
Author to whom correspondence should be addressed.
Energies 2021, 14(1), 219; https://doi.org/10.3390/en14010219
Submission received: 28 November 2020 / Revised: 28 December 2020 / Accepted: 30 December 2020 / Published: 4 January 2021
(This article belongs to the Section L: Energy Sources)

Abstract

:
In longwall top coal caving (LTCC), the resource recovery ratio of the working face is directly determined by the top coal recovery ratio. An investigation of the evolution of top coal drawing characteristics and revealing the evolution of top coal drawing parameters is necessary when providing guidance for caving parameter selection and improving the top coal recovery ratio. Based on in-situ measurements of the size distribution of caved top coal blocks in Wangjialing coal mine, a finite difference method (FDM)–discrete element method (DEM) coupled method was applied to establish a “continuous–discontinuous” numerical model and the process from the first coal drawing to the common coal drawing was simulated with 17 separate working face advances. The evolution of the drawing body (DB), loose body (LB), and top coal boundary (TCB) was obtained. The results show that, the evolution of parameters of DB such as shape and size, drawing amount, length and deflection angle of the long axis of the profile ellipsoid tended to decrease first, then increase, decrease again, and finally stabilise; the increment of the LB advance coal wall distance and the coal pillar distance was close to 0 m in the common coal drawing stage, while width increment of the LB was close to the drawing interval (0.865 m). The TCB formed after each coal drawing round was fitted based on the improved “Hook” function. The evolution of height and radius of curvature of TCB’s stagnation point was analysed. This was divided into three stages: the first (first to third drawing rounds) was the initial mining influence stage, the second (fourth to ninth drawing rounds) was the transitional caving stage, and the third (after tenth drawing round) was the common coal drawing stage.

1. Introduction

As one of the main methods for underground thick seam mining, longwall top coal caving (LTCC) has been fully developed and applied in China [1]. The coal seam is divided into two parts in LTCC: bottom coal and top coal. Bottom coal is cut directly by the shearer, while top coal is finally caved from the drawing opening under its self-weight due to the fracture gradually developing under the influence of mining pressure [2,3]. Based on the drawing characteristics of top coal during the caving process of the LTCC, the caving process can be divided into first coal drawing and common coal drawing [4]. First coal drawing refers to the first round in the top coal caving process of the LTCC working face. The most remarkable characteristic of the common coal drawing stage is that the top coal drawing characteristics show a relatively consistent periodicity [5,6]. As most operations of the LTCC mining face fall within the common coal drawing stage, most scholars focus on this stage and elaborate on the top coal drawing characteristics and evolution of this stage regarding the parameters of the drawing body (DB), loose body (LB), and the top coal boundary (TCB) to provide a theoretical basis for caving parameter selection.
Using numerical simulation, physical simulation, theoretical analysis and other means, numerous scholars have carried out a lot of research work on the evolution laws of top coal recovery ratio, shape of DB, LB range, TCB and so on, to deal with the caving of the top coal [7]. Through applying the PFC software and taking the standard deviation of top coal fragment dimension as a single variable, Wang et al. [8] studied the top coal recovery ratio, shape of DB, TCB, and particle contact force under different particle size distributions. They believed that the standard deviation of top coal size had a significant influence on the top coal drawing mechanism. Wang et al. [9] coupled the FDM with the DFN to study the top coal drawing mechanism, as well as the role of factors such as original crack, stress redistribution and stress direction in the top coal destruction process. Through the combination of theoretical analysis and numerical simulation (PFC), Yang et al. [10] studied the movement law of top coal in inclined coal seams, and derived the shape of DB, particle drawing trajectory and top coal recovery ratio in the dynamic group caving method. They also studied the influence of cutting-caving ratio on the top coal recovery ratio and shape of DB, which was then verified on site at the Beixinyao coal mine. Song et al. [11] established a 3D particle flow model to carry out a simulation study of the top coal drawing process, and to analyze the shape of DB, TCB and top coal loss distribution characteristics. The study showed that the movement trajectory and velocity of top coal particles were consistent with the assumptions from the Bergmark-Roos model. Based on this, they concluded that the vertical force on the roof beam of the support would decrease during the coal drawing and the support advancement. Using the Ruilong coal mine as an engineering background, Wang et al. [12] studied the drawing mechanism of loose top coal in different size distributions through the combination of theoretical analysis, numerical simulation and physical simulation. The study showed that as the weighted average particle size of the top coal increased, the volume of DB increased linearly and the maximum width of it increased non-linearly; as the weighted average particle size of the top coal increased, the top coal recovery ratio tended to increase and then decreased; high recoveries were achieved when the weighted average particle size of the top coal was in the range of 150–250 mm; and a relatively dispersed top coal particle size distribution and large standard deviations [13] were more favorable for the drawing of the top coal. Liang et al. [14] studied the drawing characteristics of complex top coal, and believed that the cutting-caving ratio had an important influence on the drawing of the top coal. In the absence of manual intervention to break the coal, a cutting-caving ratio of 3 was most favorable for the drawing of the top coal. Based on UDEC software, Dung et al. [4,15] systematically proposed a discrete numerical method applicable to top coal drawing and verified the accuracy of the model through practical cases. Hu et al. [16] studied the support-surrounding rock relationship as well as the movement laws of the top coal, and determined the coal drawing process for improving the recovery ratio of top coal at the large dip angle LTCC face. Zhang et al. [17] studied the drawing rule of the top coal during the LTCC mining of steeply inclined thick seam. The results showed that the DB obviously protruded to the side of the working face, and the recovery ratio of top coal in the middle of the working face was higher than that of the two ends. Klishin et al. [18,19] systematically proposed a numerical method of top coal draw-out based on DEM. Wang et al. [20] proposed the boundary-body-ratio (BBR) research system based on their long-term research on top coal drawing mechanics. Yu et al. [21] studied the mining stress field at different coal seam thicknesses and proposed corresponding numerical methods. Based on the stochastic medium theory, Zhu et al. [22] carried out theoretical research on the drawing mechanism of loose top coal, analyzed the moving boundary and loss pattern of top coal, and derived the dynamic evolution process of the TCB and DB. Based on the parametric study on the factors affecting rock strata caving behavior and support resistance, Singh et al. [2] evaluated the change of rock caving properties, caving span and support performance with these parameters by using the numerical method. Castro et al. [23,24] used the physical simulation method to carry out the rock gravity caving test under the condition that the boundary stress and particle sizes differed; their test results showed that the application of vertical pressure and change of particle size had a significant impact on particle caving. By using the PFC software, Yang et al. [25] studied the top coal drawing mechanism under the influence of upward angle, focusing on the drawing amount, DB form and TCB. Based on the analytic hierarchy process (AHP) and fuzzy discrimination method, Chi et al. [26] put forward the prediction model for top coal caving characteristics and drawing features and verified them in Tashan Coal Mine and Tongxin Coal Mine. Wang et al. [13] established the prediction model of top coal recovery ratio by using physical simulation and theoretical analysis methods and verified its reliability through in situ measuring the block size of top coal on four LTCC faces and its recovery ratio. Zhang et al. [27] put forward a numerical method for automatic control of coal drawing based on time criterion by using the continuous-discontinuous numerical method, conducted a simulation study on the top coal drawing mechanism in extremely thick coal seam, and optimized the window switching principle for coal drawing and the coal drawing technology centering on the gangue mixture ratio, top coal recovery ratio and drawing amount.
The top coal drawing differs greatly in the first coal drawing stage and the common coal drawing stage, and a transition can be observed between the two stages. Most scholars focus their research on the common coal drawing stage and ignore this transition. Based on the in-situ measurement of the equivalent diameter of caved top coal blocks in the 12309 LTCC working face of the Wangjialing coal mine, a coupled finite difference method (FDM)–discrete element method (DEM) was applied to established a “continuous–discontinuous” numerical model and the process from the first coal drawing to the common coal drawing was simulated with 17 separate working face advances. Consider that one of the most important stages of safe operation in a longwall excavation is the selection of the appropriate powered roof support [28,29]. The influence of hydraulic support on the drawing process is considered in the numerical simulation. The evolution of the DB, LB, and TCB was deduced, thus revealing the evolution of the top coal drawing and its characteristics during the process from first coal drawing to common coal drawing.

2. Numerical Method

2.1. Engineering Background

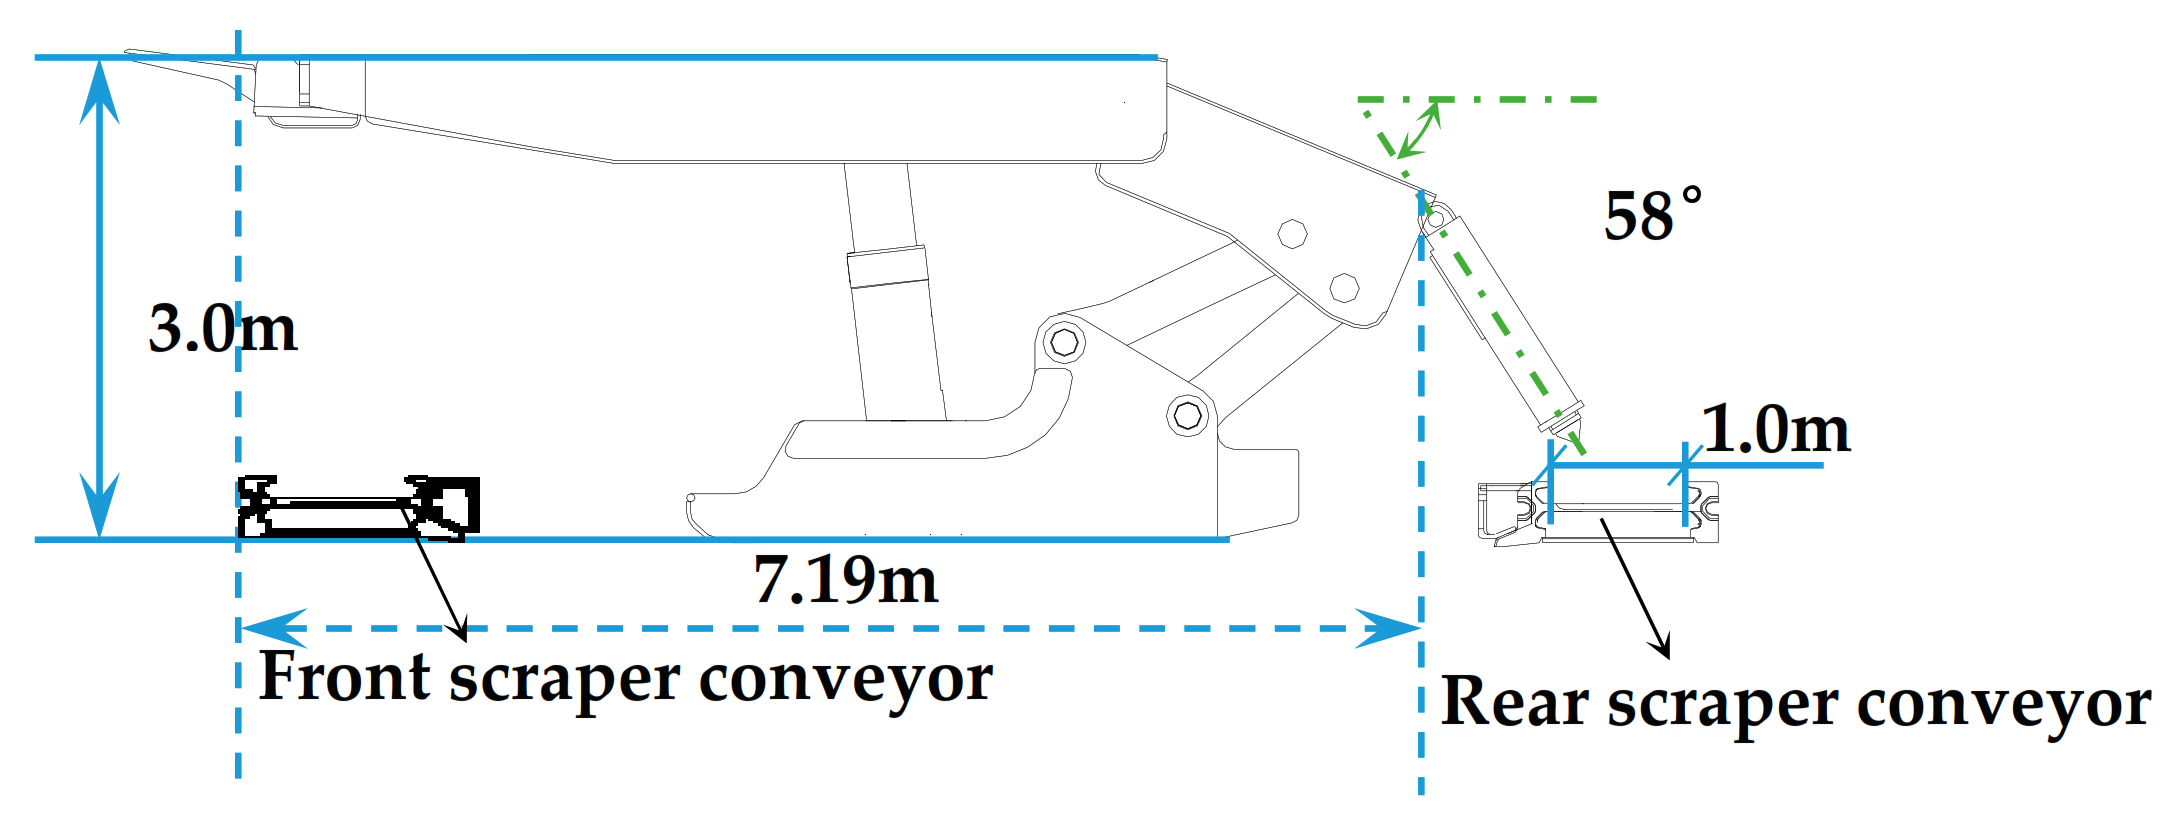
2.1.1. General Situation

The average burial depth of panel 12309 in Wangjialing coal mine was 360 m while the average thickness was 6.5 m. The cutting and caving height were 3.0 m and 3.5 m, respectively. A schematic representation of the coal seam and roofs is shown in Table 1. The hydraulic support and scraper conveyors are illustrated in Figure 1.

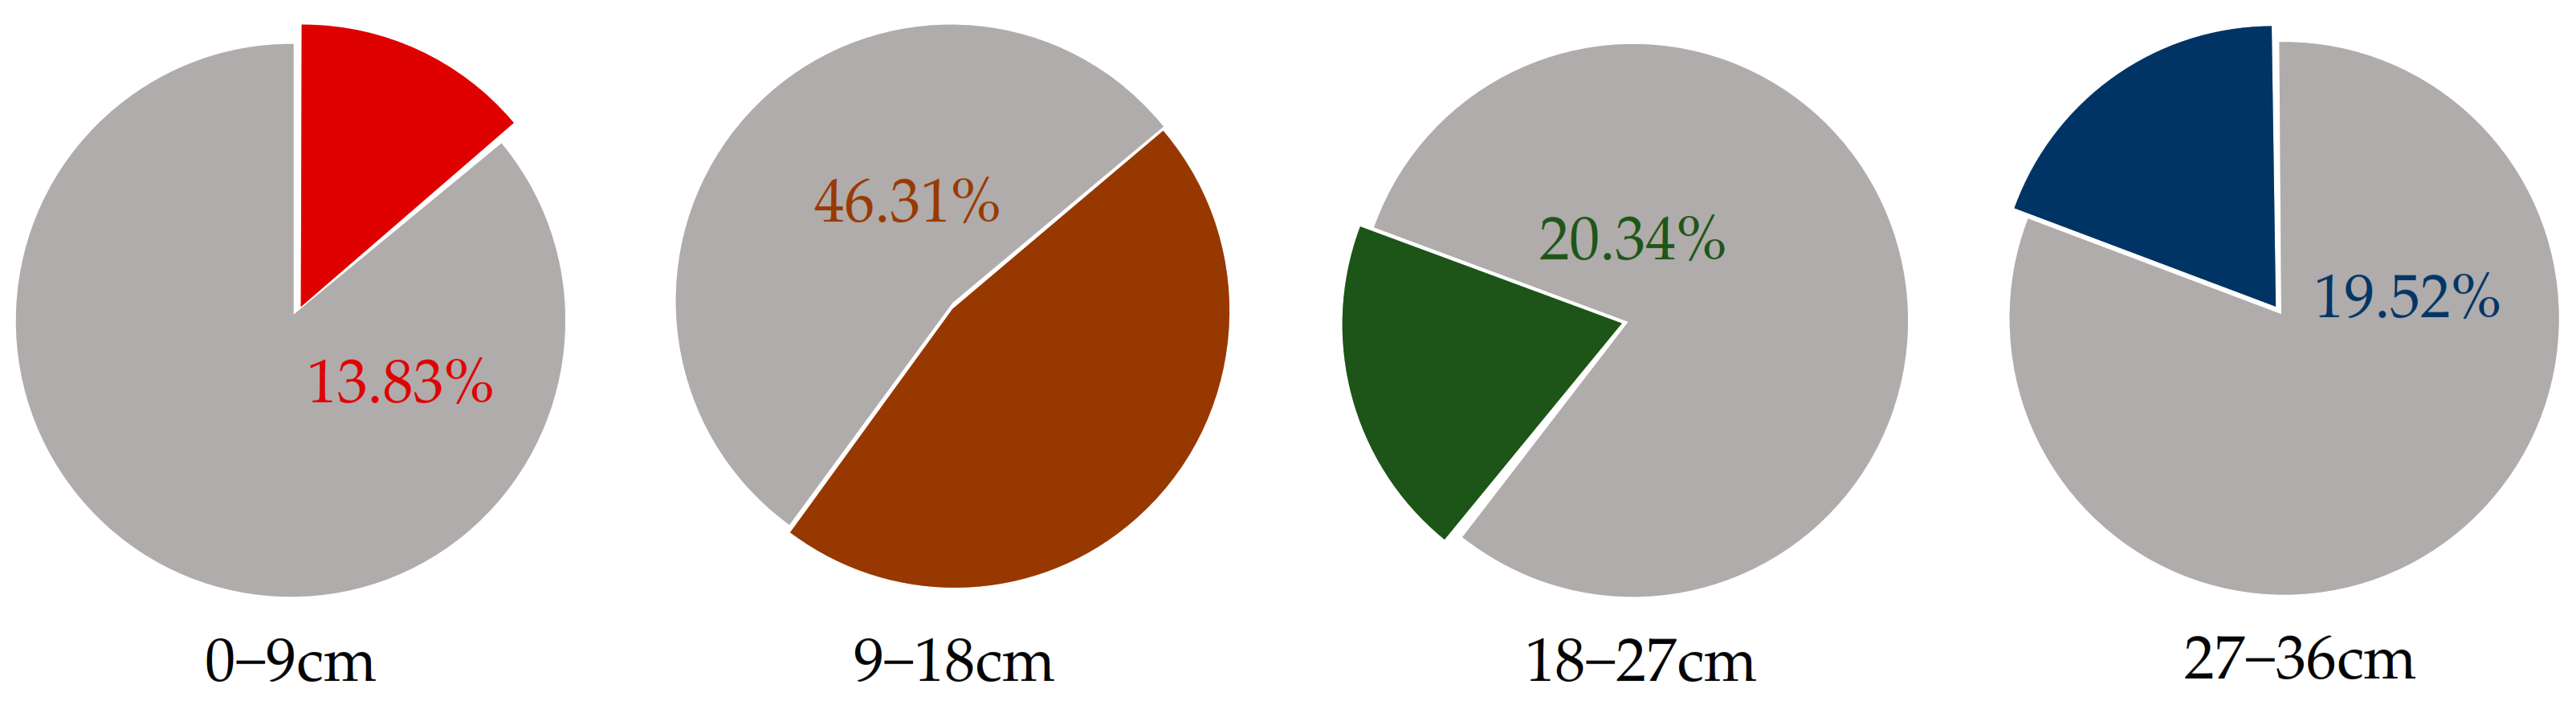
2.1.2. Top Coal Block Size Distribution

In the LTCC operation, top coal changes to a granular state under the mining pressure, and the top coal migration is affected by the distribution of the top coal block to a certain extent. As it is difficult to predict the distribution of granular top coal block size, we measured the top coal lumpiness in the 12309 working face as the basis for establishing the FDM-DEM numerical model. The measurement and analysis process have been published elsewhere [31]. In the process of field test, although some rocks were also drawn out and transported to the measurement location, we only measured the weight of coal instead of rocks. Certainly, as you said, the measurement error is inevitable. In the test process, we evenly spread the coal blocks drawn out by a single support on the scraper of the stage loader and measure the coal blocks one by one. However, as some coal blocks are too small (or even powder-like) and in huge quantity, we did not measure them. This may lead to the decrease in the accuracy of the measurement results. We think that, although the smaller coal blocks may have a certain impact on the overall movement and drawing effect of top coal, its impact is limited; so we ignore the role of too small coal blocks in the overall drawing process of top coal. Three hundred and fifteen, 240 and 208 sets of data were obtained at the middle (75# caving support), and two ends (16# and 134# caving supports) of the working face. The measured results are shown in Figure 2.
Figure 2 shows that the top coal block equivalent diameters were divided into four sectors and the mass fraction of each sector was obtained in Figure 2: 0–9 cm (13.83%), 9–18 cm (46.31%), 18–27 cm (20.34%), and 27–36 cm (19.52%).

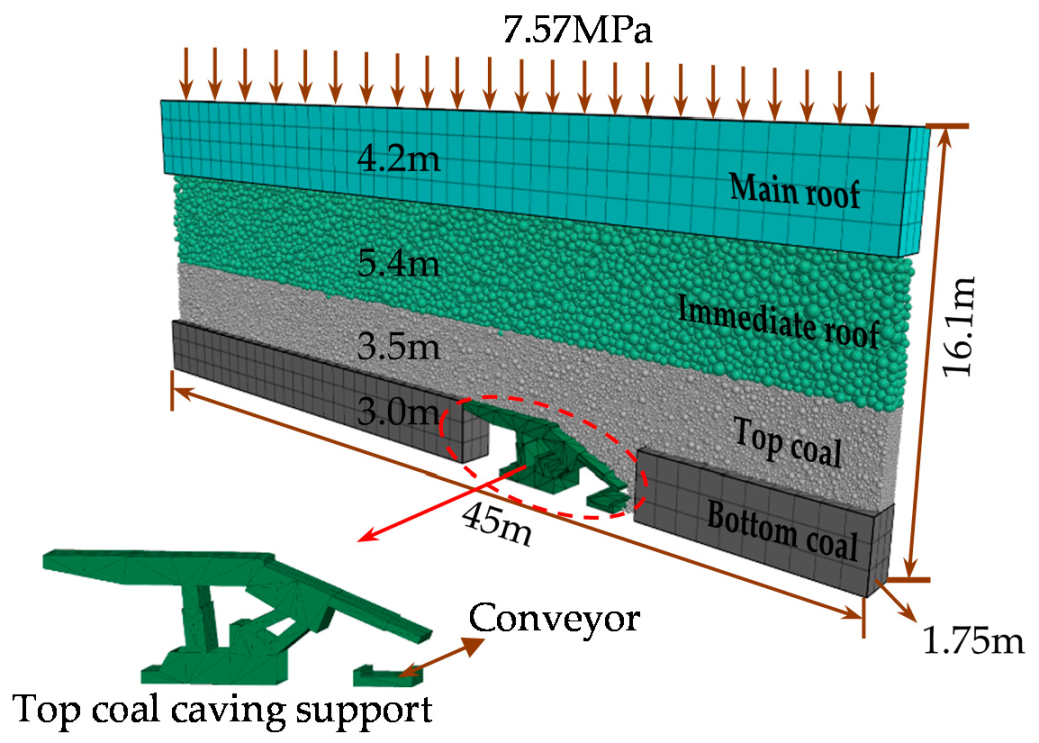
2.2. Numerical Model

The FDM-DEM model includes coal seam, immediate roof, main roof, top coal caving hydraulic support and rear scraper conveyor. In the modeling process, the PFC3D V6.0 (ITASCA Inc., Minneapolis, MN, USA) was used as the main body to establish the discontinuous rock stratum (top coal and immediate roof) with Balls, the Walls was used to establish the equipment model (top coal caving hydraulic support and rear scraper conveyor), and the FLAC3D V6.0 (ITASCA Inc.) module was introduced to establish the continuous rock stratum (bottom coal and main roof) with Zones. The particle size distribution of top coal complied with the test results as shown in Figure 2. The mechanical properties of the immediate roof rock are much stronger than the coal seam, so the crushing lumpiness of the immediate roof rock is bound to be greater than that of the top coal. In view of the unmeasurable of the crushing lumpiness of the immediate roof rock, we assumed that the size of its lumpiness was four times [8,12,31] that of the top coal, and the mass fraction was the same as that of the top coal as shown in Table 2. The numerical model is shown in Figure 3.
Figure 3 shows that overall size of the numerical model has a length of 45 m and the bottom coal is divided into 3 sections in the lengthwise direction. The width of the numerical model is 1.75 m, which is equal to the width of top coal caving hydraulic support. The height of the numerical model is 16.1 m, which is the same as the thickness of the actual coal seam, the immediate roof and the main roof stratum. As a result, to inverse the pressure exerted by the 343.9 m (average depth of 360 m) rock stratum above the main roof on the main roof itself, a vertical compressive stress of 7.57 MPa is applied to the upper surface of the model. As this paper focuses on the evolution law of the loose top coal during its movement, and the top coal above the hydraulic support can be considered to be in a loose state, the contact constitutive model between Balls in the numerical simulation adopts a linear model, and the constitutive model of the continuous unit uses an elastomeric model. Numerical parameters are listed in Table 3.

2.3. Simulation Process

The process of numerical simulation was divided into three stages. The first stage was the mining preparation stage, which the original state and equipment set-up process of the working face were inverted to obtain each formation state before working face advance. The second stage was the drawing preparation stage, the process of only cutting bottom coal without caving top coal after working face advance was inverted. The calculation was stopped before proceeding to the next stage after the range of LB expanded to the immediate roof. The range and shape of LB before caving were derived as the primary boundary condition for caving operation. The third stage was the top coal drawing stage, the caving and recovery process of top coal was inverted to reveal the evolution of the DB, LB, and TCB. The numerical simulation process is demonstrated in Figure 4.
The “Fishcall” function [32,33] was inserted at the “−11” point of the calculation cycle of PFC3D to realize real-time monitoring and control of the model. In order to automatically delete the drawn particles and close the coal drawing opening (automatically stop the calculation), the “Fishcall” function is introduced, which is called before the start of each calculation step to identify whether it is necessary to delete the particles or stop the calculation. The advantage of doing this is that there is no need to manually control the termination of the calculation program; namely, when certain conditions are met, the program will automatically stop the calculation. In this paper, when the specific gravity of the drawn rock particles reaches 5% of that of the top coal particles (or any other proportion), the calculation will automatically stop. The biggest advantage of this setting is that the calculation process can be controlled according to the calculation termination conditions defined by users, avoiding the errors caused by manually. The main functions include: (1) deleting particles dropping from the drawing opening to the rear scraper conveyor in real-time to invert the rear scraper conveyor hauling the caved top coal out; (2) monitoring the proportion of immediate roof particles in the caved particles in real-time and triggering the calculation termination condition when the proportion of immediate roof particles reaches 5% of the total number of particles caved in each drawing round.

3. Simulation Results

3.1. Mining Preparation and Drawing Preparation Stages

After equipment installation, the top coal above the hydraulic support dropped and reached equilibrium (Figure 5a); only then can the working face begin to cut the bottom coal and advance. After five steps involving this coal cutting and support advance, the range of the LB reached the immediate roof, which triggered the termination of the calculation. The particle displacement diagram and movement boundary of LB after each round of support advance were extracted, as shown in Figure 5.
Figure 5 shows that the range of LB expanded with the advance of the working face. Before the support was advanced, the maximum boundary height was 1.27 m (Figure 6a). When the support begins to advance, the maximum boundary height kept increasing albeit at a gradually decreasing rate. After the fourth support advance, the range of LB reached the immediate roof. In actual operation, as the mining pressure was not significant at this stage, top coal and the immediate roof broke to a relatively small extent, which did not meet the requirements for caving, therefore, only bottom coal cutting was conducted without top coal drawing in the caving preparation stage. As top coal and immediate roof crushing block size of these stages could not be measured in-situ, the particle diameter distribution was configured based on the measurement result in Figure 2. Whether the range of LB reached the immediate roof was the basis for judgment as to start of drawing. The reason for this was that when the LB reached the immediate roof, under the influence of working face advance, the top coal particles near the drawing opening in the vertical direction had all started to move, and it can be considered that the top coal particles were relieved from being squeezed, therefore, the top coal drawing was started after the fifth support advance.

3.2. Top Coal Drawing Stage

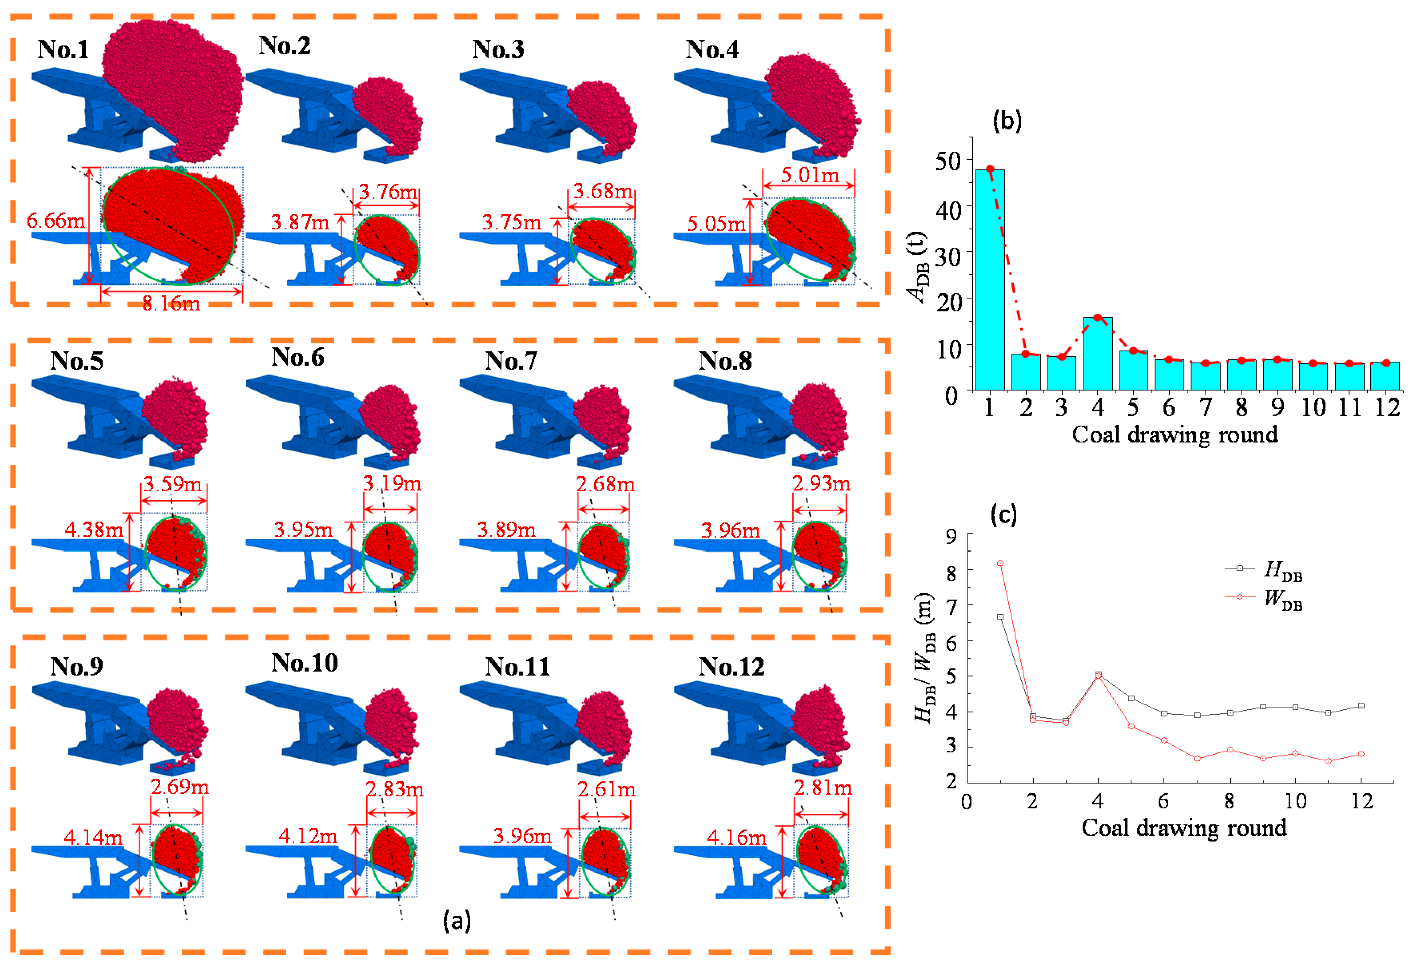
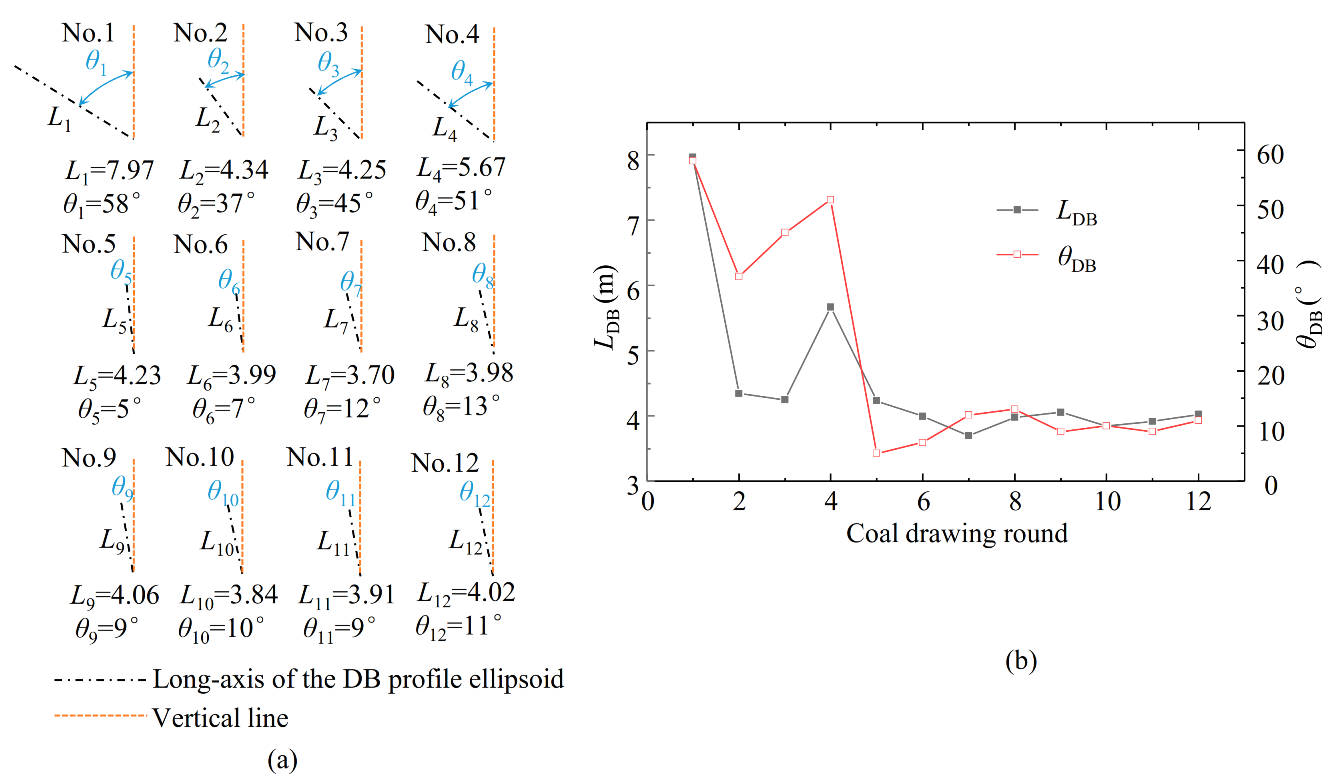
3.2.1. Evolution of DB

The DB refers to all top coal blocks caved in each drawing round. The shape of DB refers to the shape formed by these blocks before drawing. The 3D images and profile images of the DB shapes of all drawing rounds were extracted, as illustrated in Figure 6, which shows that all DBs fell in an ellipsoid cut by the tail beam of support (the area marked by the green dotted line in Figure 6a). The DBs of the first coal drawing and the common coal drawing were different. For the range of DB (Figure 6a), it extended to above the top beam of support, completely covering the shield beam and the tail beam after the first coal drawing. None of the DBs formed after common coal drawing rounds extended to the top beam, and except that of the first coal drawing, the DB of the fourth round extended the farthest (to most parts of the shield beam), the second to the fourth DB ranges extended to local parts of the shield beam, and the fifth to the twelfth DBs only covered the tail beam. In terms of drawing amount (ADB), the first round was the greatest, reaching 47.9 t, the second and third rounds decreased to about 7.5 t, the fourth round involved 15.9 t, and the subsequent rounds gradually decreased and stabilised at around 6 t each (Figure 6b). The evolution of the horizontal width (WDB) and vertical height (HDB) of DB was the same as that of ADB (Figure 6c), first decreasing, then increasing, decreasing again, and finally stabilising. WDB (HDB) decreased from 8.16 m (6.66 m) in the first round to around 3.72 m (3.81 m) in the second and third rounds, then increased to 5.01 m (5.05 m), and then gradually decreased before stabilising at around 2.7 m (4.0 m).
From these results, it can be seen that, from the first coal drawing round to the common coal drawing stage, each parameter of the DB changed according to a certain trend. The fourth drawing round represented a turning point, with its ADB, WDB, and HDB being slightly increased compared with those of the second and third rounds; after the fourth drawing round, the parameters gradually decreased and tended to stabilise. To verify the conclusion, the long-axis length (LDB) and the included angle (θDB) of the DB profile ellipsoid of each drawing round were extracted, as shown in Figure 7.
As shown in Figure 6a and Figure 7, the evolution of LDB and θDB was consistent with that mentioned above. For the long-axis extension of DB, the intersection point between it and coal floor was located in the goaf after the first four rounds of coal drawing, but it was located at the back of the rear scraper conveyor from the fifth coal drawing round (black dotted line in Figure 7a). For LDB, it reached 7.97 m after the first drawing round and decreased to around 4.3 m after the second and third drawing rounds, increased slightly after the fourth drawing round, and then gradually decreased before stabilising at around 4 m. For θDB, it maintained a large deflection (over 45°) during the first four drawing rounds and decreased to around 10° then stabilised from the fifth drawing round. Therefore, a similar conclusion was drawn, suggesting that the fourth drawing round is the key turning point for DBs in the present numerical simulation.

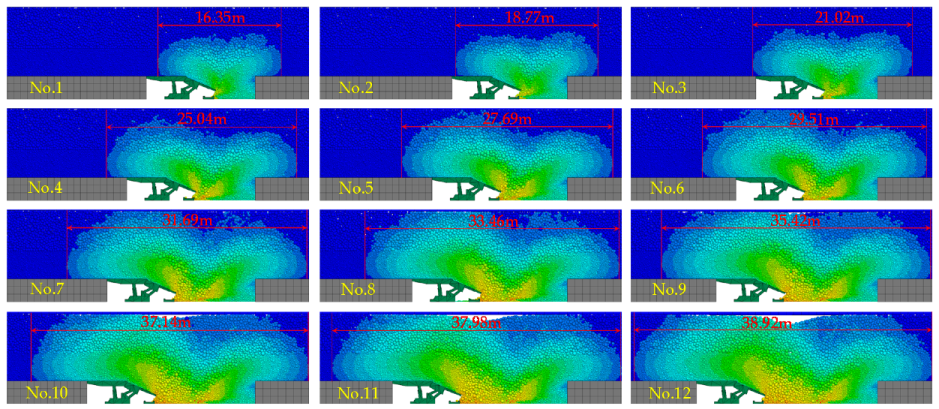
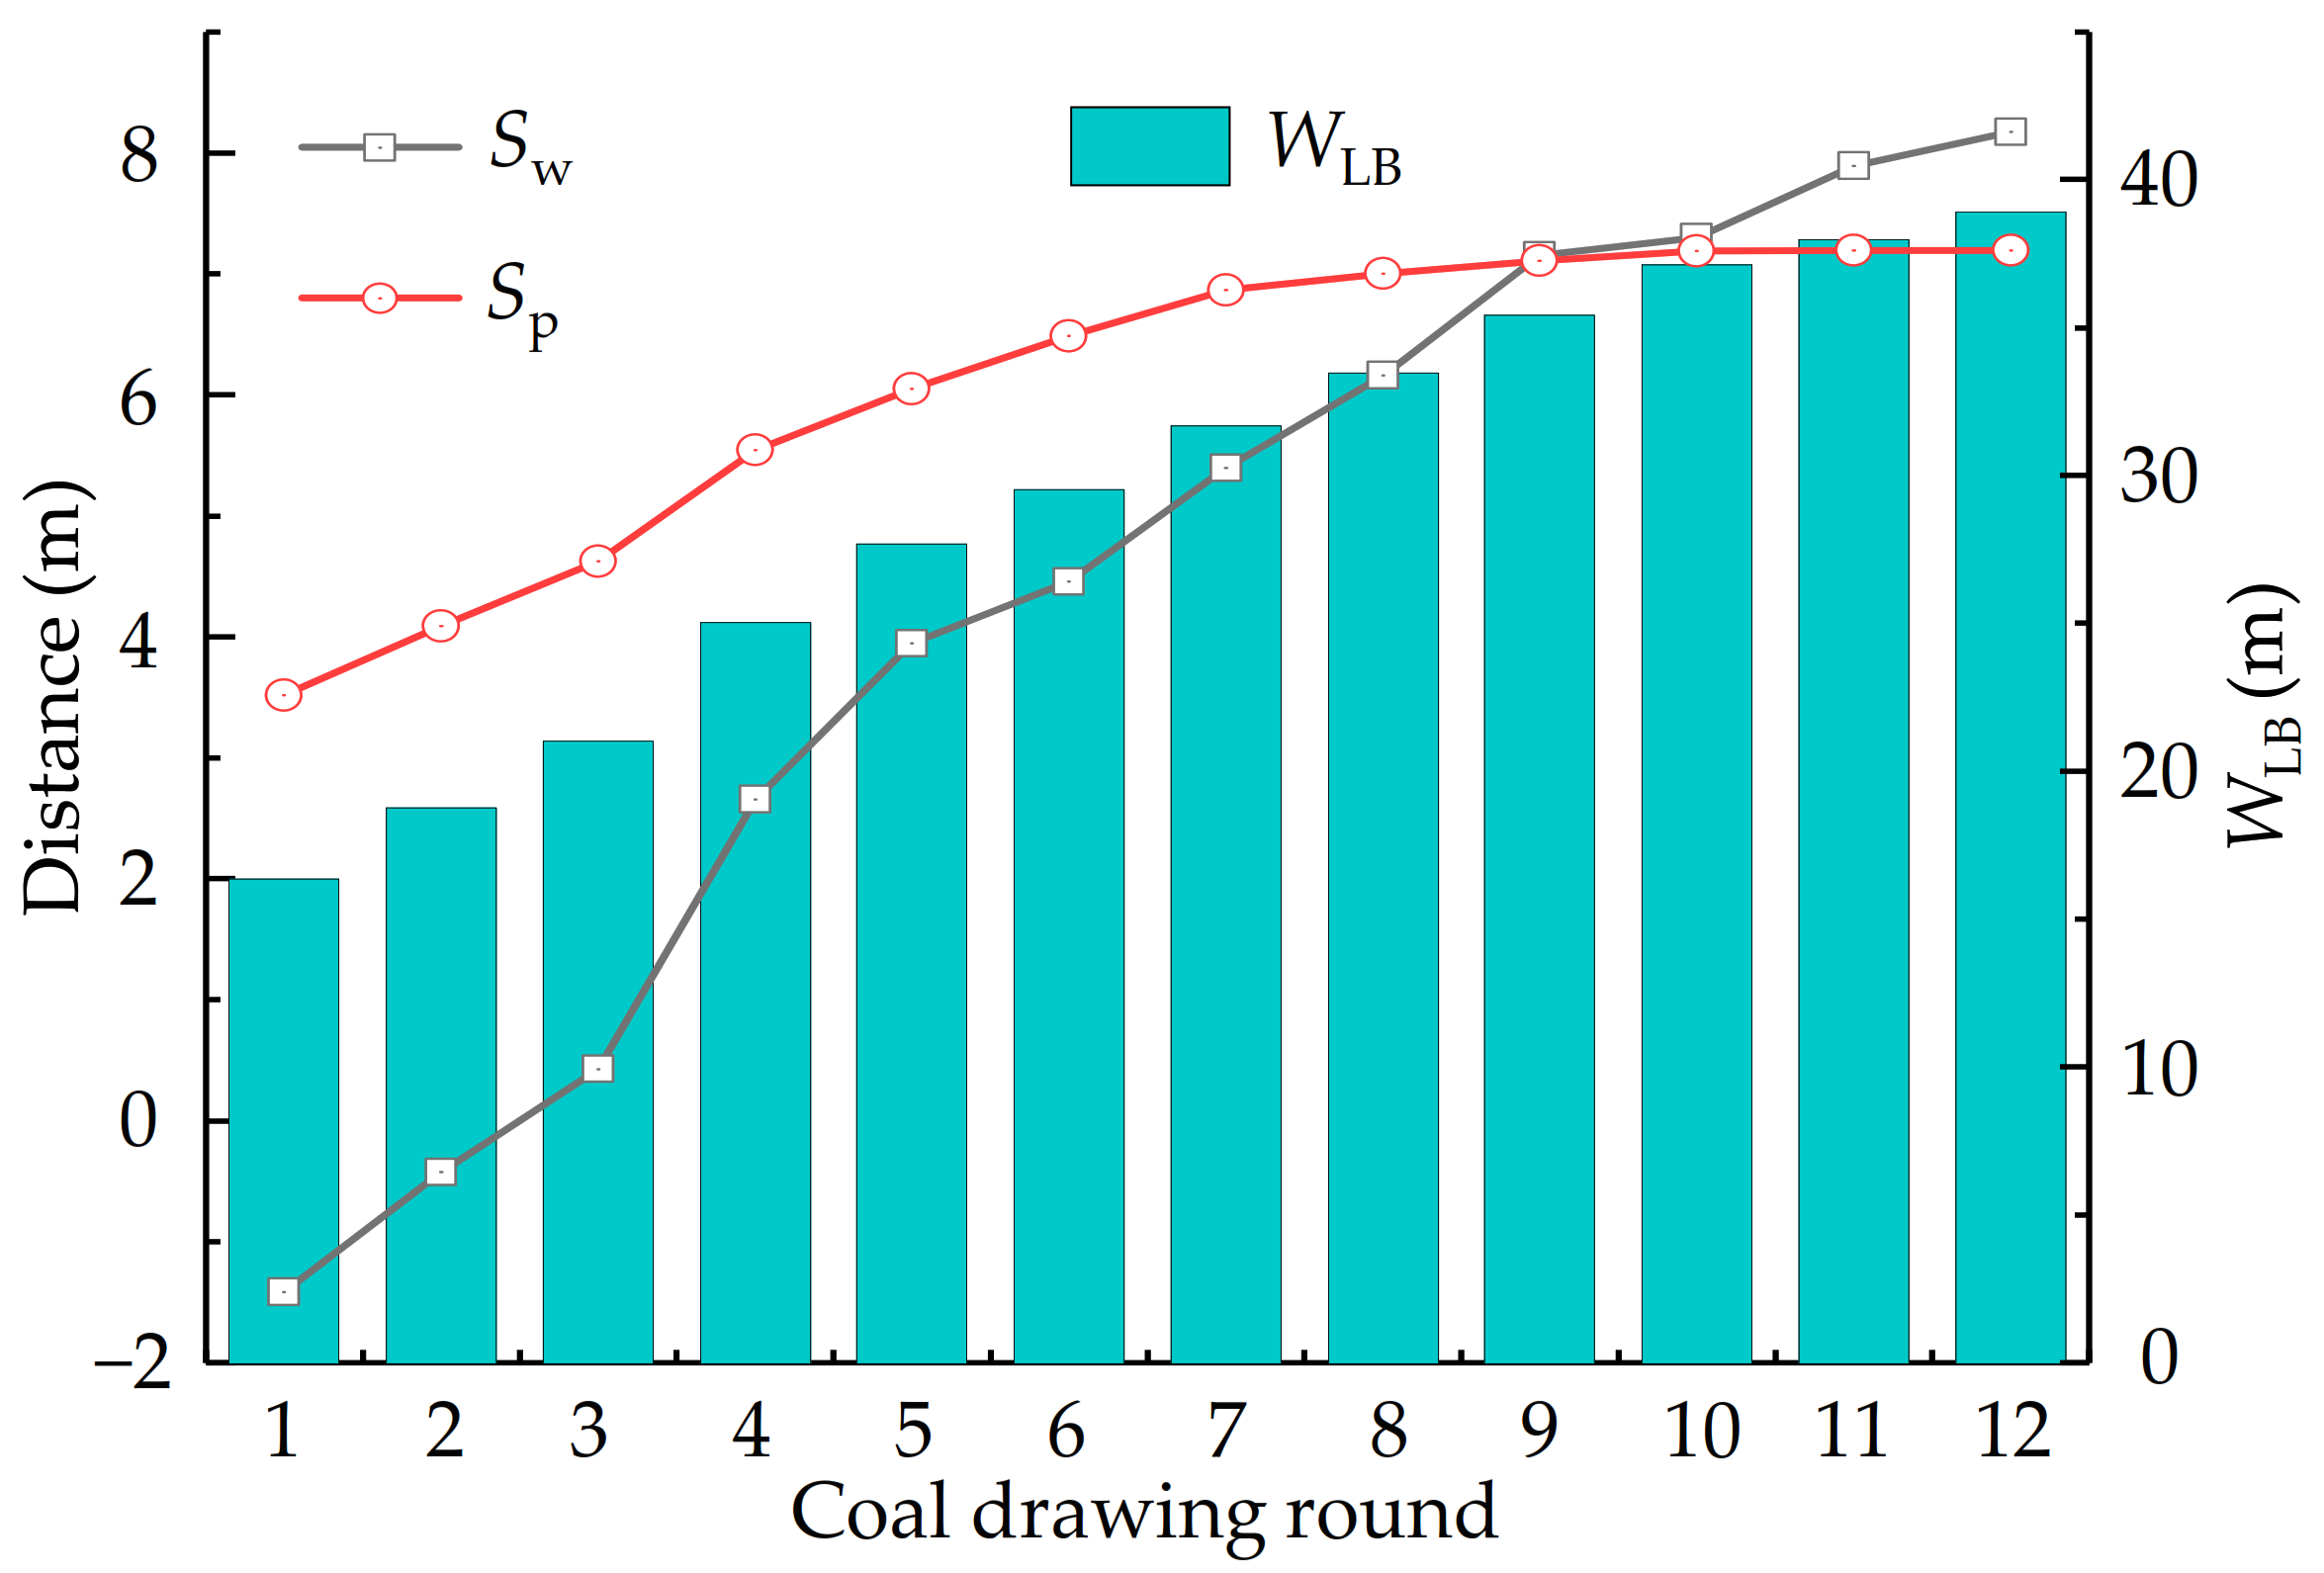
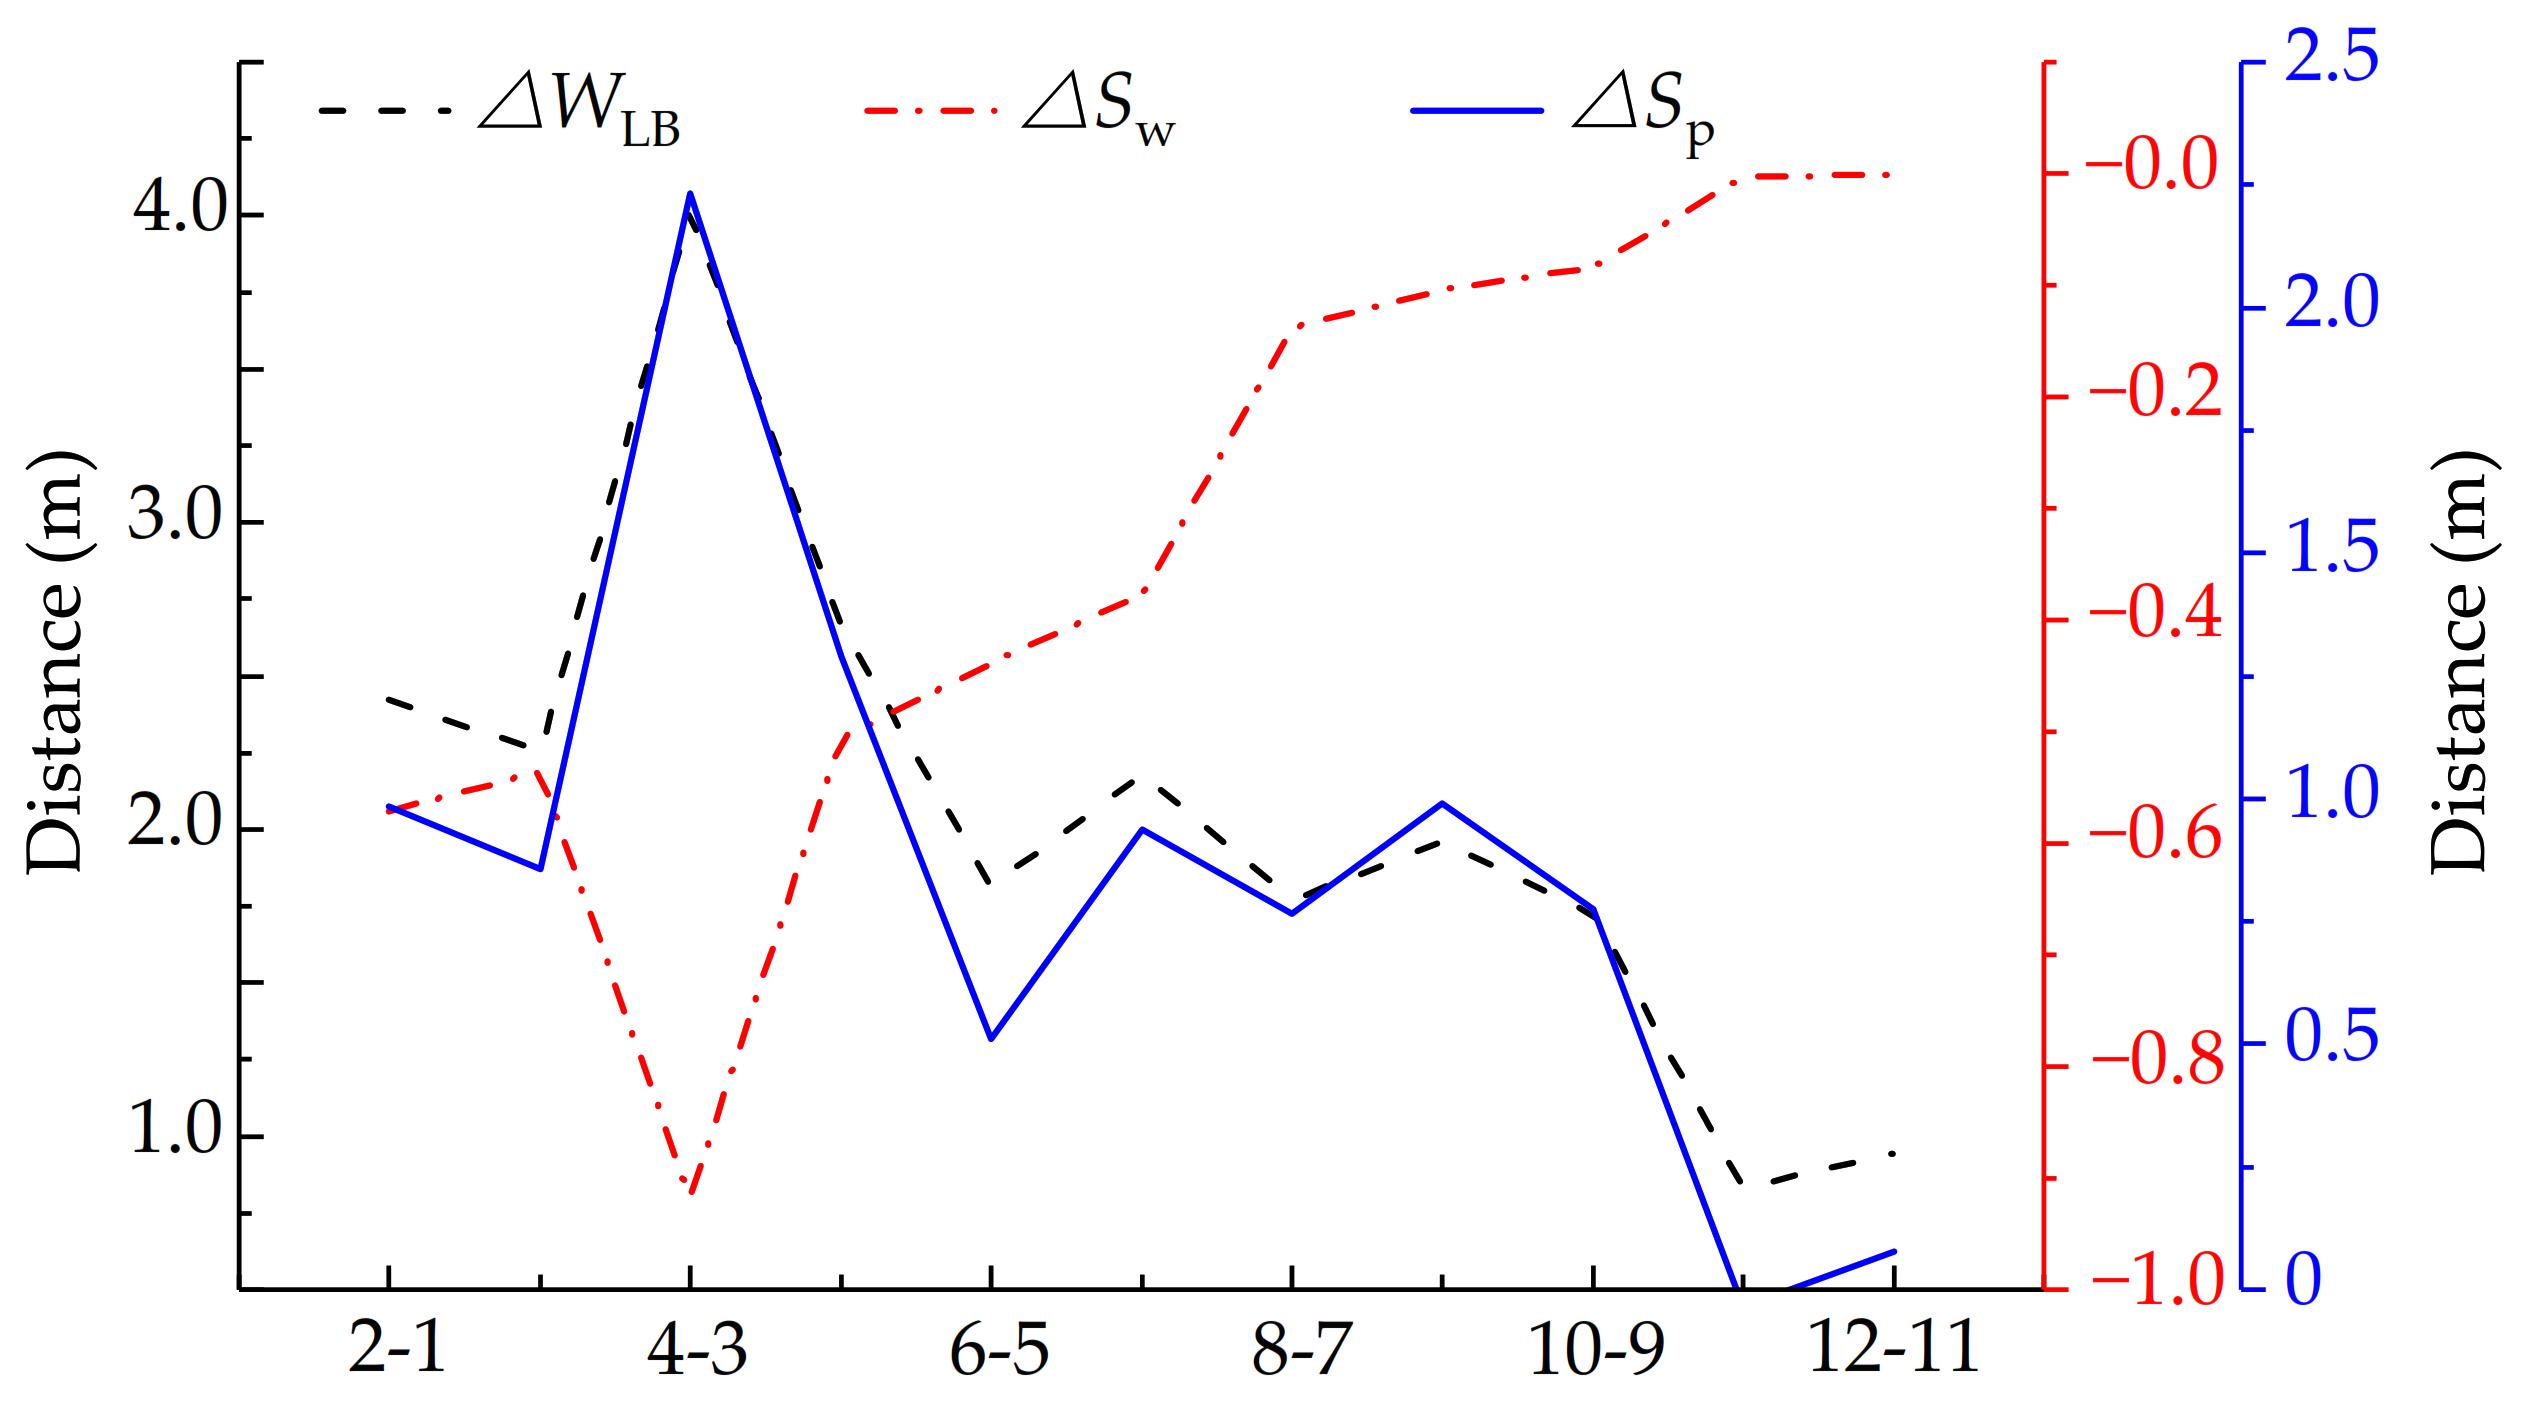
3.2.2. Evolution of LB

The LB refers to the coal and rock loose range caused by top coal caving. Particle displacement diagrams after each drawing round were extracted, as shown in Figure 8. The shape of LB is marked on the basis of the displacement exceeding 25 mm.
As shown in Figure 8, the shape of LB expanded as the working face advanced, from 16.35 m after the first drawing round to 38.92 m after the twelfth drawing round. Throughout the process, the LB expanded towards the working face side and goaf side to different degrees as the working face advanced. With the coal wall and the coal pillar as the benchmark, the horizontal distances between the edge of LB and coal wall (Sw) and coal pillar (Sp) were extracted, respectively. The curve and the total width of LB (WLB) were plotted, as shown in Figure 9.
Figure 9 shows that Sw and Sp first increased, then stabilised as the working face advanced. For Sw, the LB did not reach the coal wall after the first and second drawing rounds, so the distances were negative (−1.41 m and −0.43 m). The LB shape exceeded the constraint of the coal wall from the third drawing round onwards and Sw gradually increased from 0.43 m to 7.93 m after the tenth drawing round and stabilised thereafter (at around 7.9 m). For Sp, it increased from 3.52 m after the first drawing round to 6.86 m after the seventh drawing round, then remained stable (at around 7.0 m). For WLB, it increased from 16.35 m to 38.92 m, but its rate of increase decreased as the working face was advanced. The increment of Sw, Sp, and WLB (ΔSw, ΔSp, and ΔWLB) between drawing rounds was calculated (Figure 10, where the abscissa “2-1” represents the change to the second drawing round from the first).
As shown in Figure 10, during the caving process, ΔSp increased from 0.98 m to 2.23 m, then decreased to around 0 m; ΔSw first increased from 0.57 m to 0.92 m, then decreased to around 0 m; ΔWLB first increased from 2.42 m to 4.01 m, then decreased, and tended to stabilise after the tenth drawing round (around 0.865 m). These simulated results show that ΔSw, ΔSp, and ΔWLB reached their maxima at the fourth drawing round, which agreed with the aforementioned conclusion pertaining to the evolution of DB. ΔSw and ΔSp stabilised during the common drawing stage, then remained unchanged (at around 0), while ΔWLB stabilised during cyclic drawing, then approached 0.865 m, which approximated to the working face advance interval and drawing interval.

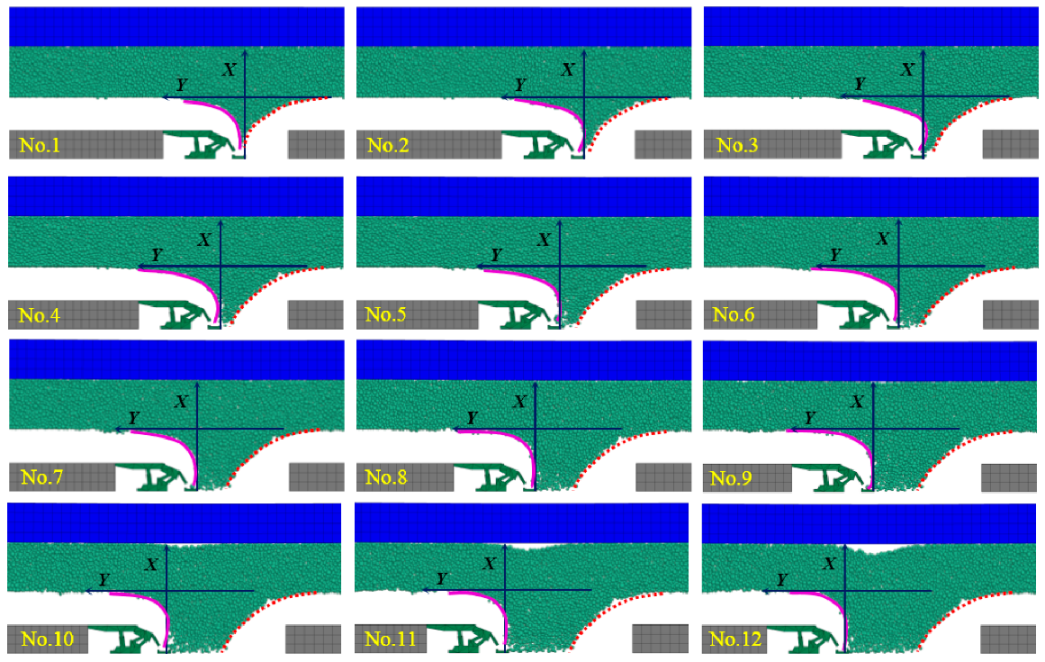
3.2.3. Evolution of TCB

TCB refers to the boundary between the top coal and the immediate roof rock. The TCB formed by coal caving was analysed in this section. The TCB after each caving round was extracted, as shown in Figure 11.
As shown in Figure 11, the shapes of the TCB are different on the goaf side and the working face side. On the goaf side (red dotted line), the TCB is parabolic; its shape was significantly affected by the first three support advances and drawing rounds and it remained practically unchanged since the fourth drawing round and was no longer affected by the advance of the working face or the coal caving. For the working face side (purple solid line in the figure), the evolution of the TCB was differed substantially from that of the goaf side during the advance of the working face, and its characteristics are summarised as follows:
There is a definite horizontal asymptote and the curve is asymmetrical. Horizontally, the curve will approach the original TCB, that is, the original TCB is its definite asymptote. Vertically, the formation of the curve is affected by gravity and the drawing opening, the boundary condition differs from that applied to the horizontal face, indicating that it is asymmetrical.
The curve approaches the horizontal asymptote at a slower rate. The curve above the hydraulic support shield beam, tail beam, and the rear scraper conveyor increases slightly in the vertical direction, that is, the rate at which the TCB approaches the horizontal asymptote is low within this range, especially during the first to the seventh caving rounds.
The curve deflects toward the working face above the rear scraper conveyor. After each caving event, the TCB deflects toward the working face advance direction at the rear scraper conveyor, as shown by the purple dotted arrowhead in Figure 11.
To reveal the evolution of the TCB, a fitting model was selected to fit the TCB on the working face side. A rectangular coordinate system was established (Figure 11), with the plumb line after the rear scraper conveyor as the X-axis and the vertical upwards direction taken as positive, with the horizontal line of the original TCB as the Y-axis and the advance direction of the working face as the positive direction. That is, the TCB lay within the second quadrant of the coordinate system (x < 0). To reduce errors caused by definition-domain limitation during the fitting process, absolute values were taken for the X-coordinate of each point, and a curve symmetrical to the Y-axis with the TCB was obtained. Fitting was performed on this curve. The fitting formula was determined based on the evolution characteristics of the TCB. The curve had an asymptote and was asymmetrical about its own axes, as is the Hook function (of the form f(x) = x + 1/x). The method of determination of the fitting model is described in Figure 12.
The dashed lines in Figure 12 are the Hook function and its two terms (g1(x) = x and g2(x) = 1/x). The expression of Hook function is f1(x) = g1(x) + g2(x) = x + 1/x. This function agrees with the TCB in terms of the horizontal asymptote and its asymmetry, but its rate of change exceeds that of the TCB. Fitting for the TCB cannot be performed through only the aforementioned two terms. To control the rate of change of Y along the negative direction of X, g1(x) = x is substituted by g3(x) = x2, and to control it along the positive direction of X, g4(x) = x1/2 was added. The fitting formula was determined to be as follows:
F(x) = ax2 + b/x + cx1/2 + d
where a, b, c, and d are fitting parameters. It can be shown that a, b, and d > 0, and c < 0. The position and curvature radius of the stagnation point were calculated. x was differentiated to get F(x). Its first-order derivative and second-order derivative are shown in Formula (2):
F x = 2 a x + c 2 x b x 2 F x = 2 a + c 4 x 3 / 2 2 b x 3
We set F’(x) = 0 to obtain the x-coordinate of the stagnation point. The radius of curvature thereat was calculated using Equation (3):
ρ x = 1 + F x 2 3 2 F x
The TCB after each caving round was fitted and calculated based on Equations (1)–(3). The results are collated in Table 4. The fitting curves are shown in Figure 13.
As shown in Figure 13a, the evolution of the TCB can be divided into three stages: the first stage was from the first drawing round to the third drawing round. During this stage, the evolution of the TCB was relatively stable. The second stage was that from the fourth drawing round to the ninth drawing round. A change in the trend arose between each pair of groups, that is, the TCB of each two adjacent drawing rounds was put into one group (three groups in total in this stage), with the shape of each group showing stable development. The third stage was after the tenth drawing round. After this stage, the TCB had a relatively stable shape and advanced with the working face. For the stagnation point position (Figure 13b), in the first stage, it decreased from 4.17 m during the first drawing to 3.97 m. In the second stage, it reduced to some extent within each group. For the first group, it decreased by 0.35 m from 4.21 m (fourth drawing round) to 3.86 m (fifth drawing round), a decrease of 8.31%. For the second group, it decreases by 0.30 m from 4.13 m (sixth drawing round) to 3.83 m (seventh drawing round), a decrease of 7.26%. For the third group, it decreased by 0.21 m from 3.74 m (eighth drawing round) to 3.53 m (ninth drawing round), a decrease of 5.62%. The decrease itself decreased group-to-group. In the third stage, the stagnation point position was relatively stable, with an average height of 3.97 m and standard deviation of 0.079 m. For the radius of curvature at the stagnation point (Figure 13c), in the first stage, it was reduced gradually from 6.48 m (first drawing round) to 3.67 m (third drawing round); in the second stage, it was decreased from 4.47 m (fourth drawing round) to 3.15 m (fifth drawing round) in the first group by 1.32 m and from 5.42 m (sixth drawing round) to 3.54 m (seventh drawing round) by 1.88 m in the second group, but remained relatively stable at 5.00 m (eighth drawing round) and 5.49 m (ninth drawing round) in the third group; in the third stage, it was reduced slightly but remained relatively high, with an average radius of 7.48 m and a standard deviation of 0.94 m. Based on the above information, the evolution of the TCB curve can be divided into three stages from the first caving stage to the common caving stage from the perspective of its shape, stagnation point height and radius of curvature at the stagnation point. The first stage was influenced most by the initial mining process, the second stage represented a transitional drawing stage, and the third stage was the common drawing stage.

4. Discussion

(1)
Numerical model
Based on the FEM-DEM coupled method, a “continuous-discontinuous” numerical model was constructed with the 12309 working face of the Wangjialing coal mine as the engineering background to address the actual problems posed in this paper. ① In this paper we focused on the drawing of the granular top coal without considering its crushing. The linear contact constitutive model was used for all “ball-ball” contact. The top coal and the immediate roof were all regarded as granular media, therefore the top coal and the immediate roof did not break during the advance of the working face. ② During mining operations before caving, the extent of crushing of the top coal did not meet the requirement for caving: the top coal block size must exceed that measured in-situ as the mining pressure was relatively low during this stage, however, as the data cannot be measured, parameters were assigned according to the result of numerical simulation. ③ The motion process of top coal and rocks above the hydraulic power support is affected not only by one hydraulic support, but also inevitably by the support advancement and coal drawing in its neighbouring sections. In the actual condition, there are usually more than 100 hydraulic supports arranged on a working face; besides, the top coal caving mining methods vary greatly, which leads to difference in coal drawing sequence, such as single round sequential coal drawing, single round interval coal drawing, multi-round interval coal drawing, etc. Different coal drawing methods are suitable for different coal seam conditions, the influence of which on the motion of top coal and rocks varies greatly; actually, even different coal drawing time can have different impact on them. In our views, although there are too many uncertainties in the study on the above issues, obviously we can still find a certain rule to follow. We need to consider the influence of multiple supports in synergetic mining on top coal and rocks, which is also one of our top priorities in the future researches. In this paper, taking the “FDM-DEM” numerical model as the carrier, we conduct the study on the movement and drawing rule of loose top coal; especially, our research focus is on the transition process from the first coal drawing stage to the common coal drawing stage; in view of this, we only conduct the 2D analysis. ④ We had tried 2-d software for top coal caving simulation, but the result was not satisfactory, mainly because the particle gaps significantly increased and the force exerted was beyond the range of the 2-d model when the range of the particle size was relatively large, and because all simulated particles were spheres with a regular packing in the 2-d state. The DB was more diamond-shaped than ellipsoidal, producing a poor inversion result. To avoid these problems, 3-d software was used to build the numerical model.
(2)
Limitations and weaknesses of the method
In this paper, a coupling numerical simulation method based on “FDM-DEM” is proposed, which is realized by the bridging function between FLAC3D and PFC3D. The method enables the simulation of top coal caving mining process, including the simulation of hydraulic support and rear scraper conveyor; furthermore, it enables the automatic control of simulation process by using Fishcall function. However, there are obvious limitations and weaknesses in this method. The contact constitutive model between top coal particles is a linear model, that is, in the process of numerical simulation, top coal and immediate roof are considered to be in the loose state (This method has been used by most scholars in their related researches), so the crushing process of top coal and immediate roof under the action of mining pressure is ignored. Currently, our research team has attempted to establish a numerical method for the whole process, which enables the inversion of mining pressure as well as the progressive failure of top coal and immediate roof in the numerical simulation from continuous state to loose state (Particles are no longer simple “Balls”) to final drawing. Moreover, it will also be one of our main research directions in the future.
(3)
Advance abutment pressure
The evolutional process of the TCB is shown in Figure 12. The TCB in front of the working face basically was a horizontal line in first to seventh drawing rounds. However, the line changed into the shape of a wave from the eighth drawing round. The reason for this is as follows: more and more top coal particles were deleted as the working face advanced. The immediate roof particles moved downward to fill the goaf, causing a disconnection between the immediate roof and the main roof (the blank part in Figure 12). The stress of the main roof and the part above was passed to the coal wall front, resulting in stress concentration. Loading and unloading was caused by the unloosening of the top coal and immediate particles within the loose area, particles being “squeezed out.” As a result, the horizontal TCB appeared wavy.
(4)
Transitional Process
In LTCC, the three parameters, the DB, LB, and TCB underwent a transition from the first drawing round to the common drawing stage. The simulation results had some similarities with the relevant researches of other scholars. But in the previous researches, the transition process from the first coal drawing round to the common coal drawing stage has been ignored. Seen from the numerical simulation results, this transitional process had a clear turning point. For the DB and the LB, the fourth drawing round was the key turning point, while for the TCB, the fourth and tenth drawing rounds were both key turning points. As some hypotheses were made in numerical model building and parameter selection, the result did not directly correspond to engineering practice but could provide certain guidance. We believe that the aforementioned transitional process must occur in practice, but due to the complexity of the in-situ conditions, the key transitional point cannot be a certain caving round and there may be multiple key transitional points.

5. Conclusions

A “continuous-discontinuous” numerical model was established to invert the evolution of top coal migration characteristics in LTCC. In terms of DB, LB, and TCB, the transition process from the first drawing round to the common drawing stage was analysed. The following conclusions are drawn:
  • The evolution of DB parameters such as ADB, WDB, HDB, LDB, and θDB from first drawing round to common drawing stage showed a trend whereby they first decreased, then increased, decreased again, and finally stabilised. Specifically, the parameters were observed to reach their respective maxima after the first drawing round and then gradually decrease, only to increase again after the fourth drawing round, and then stabilise. After stabilisation, ADB was around 6 t, WDB was 2.7 m, HDB was 4.0 m, LDB was around 4.0 m, and θDB was around 10°. In the numerical simulation, the fourth drawing round was the key turning point in the DB evolution.
  • The evolution of LB parameters such as WLB, Sw, and Sp and increments thereof was analysed from the first drawing round to the common drawing round. Sw and Sp were close to 0 m in the common caving stage, while WLB was close to the caving interval (0.865 m) in this stage. In the numerical simulation, the fourth drawing round was the key turning point in the LB evolution.
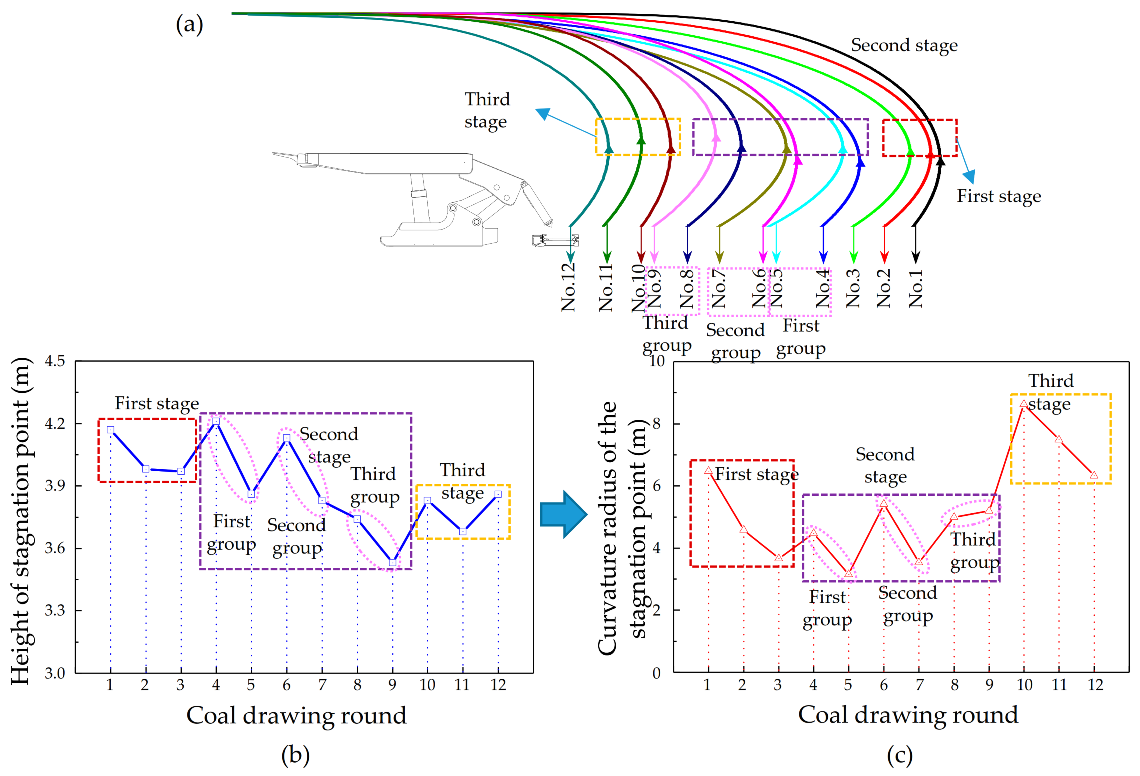
  • The TCBs formed in each drawing round were fitted. From the perspective of the height and radius of curvature stagnation point, the evolution of the TCB was analysed. The process was divided into three stages in the numerical simulation: the first (first to third drawing rounds) was the initial mining influence stage, the second (fourth to ninth drawing rounds) was the transitional caving stage, and the third (after tenth drawing round) represented the common drawing stage.
  • As some hypotheses were made in relation to the boundary conditions, the model, and numerical simulation process, its result did not directly correspond to actual engineering conditions, but can provide reference to some extent. It is believed in this present study that the above-mentioned transitional process must exist during mining operations, but due to the complexity of the in-situ conditions, the key transition point cannot be a certain drawing round and there may be multiple key transition points.
  • We believe that the research results of this paper are applicable to other coal mines in the world with occurrence conditions similar to those of Wangjialing coal mine with the same mining method. In the process of numerical modeling, all parameters are obtained according to the actual site conditions. Under different engineering backgrounds, the obtained parameters are different. Therefore, this numerical method has high flexibility, which is suitable for the simulation of top coal movement in any top coal caving mining.

Author Contributions

Conceptualization, Y.H. and D.Z.; methodology, X.S.; software, Z.W.; validation, Z.W., Y.H. and D.Z.; formal analysis, Y.H.; investigation, Y.H.; resources, X.S.; data curation, Z.W.; writing—original draft preparation, Z.W.; writing—review and editing, Y.H.; visualization, X.S.; supervision, D.Z.; project administration, X.S.; funding acquisition, D.Z. All authors have read and agreed to the published version of the manuscript.

Funding

This research was funded by the National Natural Science Foundation of China, grant number 51904200; the Scientific and Technological Innovation Programs of Higher Education Institutions in Shanxi, grant number 2019L0183; the Open Fund of Shaanxi Key Laboratory of Geological Support for Coal Green Exploitation, grant number DZBZ2020-07; the Shanxi Applied Basic Research Programs, Science and Technology Foundation for Youths, grant number 201901D211032; the China Postdoctoral Science Foundation, grant number 2020M681978.

Conflicts of Interest

The authors declare no conflict of interest.

List of Symbols and Abbreviations

LTCCLongwall top coal caving
FDMFinite difference method
DEMDiscrete element method
DBDrawing body
LBLoose body
TCBTop coal boundary
BBRBody-Boundary-Ratio
ADBDrawing amount
WDBHorizontal width of DB
HDBVertical height of DB
LDBLong-axis length of the DB profile ellipsoid
θDBIncluded angle of the DB profile ellipsoid
SwHorizontal distances between the edge of LB and coal wall
SpHorizontal distances between the edge of LB and coal pillar
WLBTotal width of LB
ΔSwIncrement of Sw
ΔSpIncrement of Sp
ΔWLBIncrement of WLB

References

  1. Tu, S.-H.; Yuan, Y.; Yang, Z.; Ma, X.-T.; Wu, Q. Research situation and prospect of fully mechanized mining technology in thick coal seams in China. In Proceedings of the International Conference on Mining Science & Technology; Ge, S., Liu, J., Guo, C., Eds.; Elsevier: Amsterdam, The Netherlands, 2009; Volume 1, pp. 35–40. [Google Scholar]
  2. Singh, G.S.P.; Singh, U.K. Numerical Modeling Study of the Effect of Some Critical Parameters on Caving Behavior of Strata and Support Performance in a Longwall Working. Rock Mech. Rock Eng. 2010, 43, 475–489. [Google Scholar] [CrossRef]
  3. Bai, Q.-S.; Tu, S.-H.; Wang, F.-T.; Zhang, X.-G.; Tu, H.-S.; Yuan, Y. Observation and Numerical Analysis of the Scope of Fractured Zones Around Gateroads Under Longwall Influence. Rock Mech. Rock Eng. 2014, 47, 1939–1950. [Google Scholar] [CrossRef]
  4. Le, T.D.; Bui, X.N. Effect of Key Parameters on Top Coal First Caving and Roof First Weighting in Longwall Top Coal Caving: A Case Study. Int. J. Geomech. 2020, 20, 5. [Google Scholar] [CrossRef]
  5. Bai, Q.; Tu, S. A General Review on Longwall Mining-Induced Fractures in Near-Face Regions. Geofluids 2019, 2019, 3089292. [Google Scholar] [CrossRef] [Green Version]
  6. Oge, I.F. Prediction of Top Coal Cavability Character of a Deep Coal Mine by Empirical and Numerical Methods. J. Min. Sci. 2018, 54, 793–803. [Google Scholar] [CrossRef]
  7. Bian, Z.; Miao, X.; Lei, S.; Chen, S.-E.; Wang, W.; Struthers, S. The Challenges of Reusing Mining and Mineral-Processing Wastes. Science 2012, 337, 702–703. [Google Scholar] [CrossRef]
  8. Wang, J.; Wei, W.; Zhang, J.; Mishra, B.; Li, A. Numerical investigation on the caving mechanism with different standard deviations of top coal block size in LTCC. Int. J. Min. Sci. Technol. 2020, 30, 583–591. [Google Scholar] [CrossRef]
  9. Wang, J.; Wang, Z.; Li, Y. Longwall Top Coal Caving Mechanisms in the Fractured Thick Coal Seam. Int. J. Geomech. 2020, 20, 06020017. [Google Scholar] [CrossRef]
  10. Yang, S.; Wei, W.; Zhang, J. Top Coal Movement Law of Dynamic Group Caving Method in LTCC with an Inclined Seam. Min. Metall. Explor. 2020, 37, 1545–1555. [Google Scholar]
  11. Song, Z.; Konietzky, H. A particle-based numerical investigation on longwall top coal caving mining. Arab. J. Geosci. 2019, 12, 556. [Google Scholar] [CrossRef]
  12. Wang, J.; Wei, W.; Zhang, J. Effect of the size distribution of granular top coal on the drawing mechanism in LTCC. Granul. Matter 2019, 21, 70. [Google Scholar] [CrossRef]
  13. Wang, J.; Wei, W.; Zhang, J.; Mishra, B. Laboratory and field validation of a LTCC recovery prediction model using relative size of the top coal blocks. Bull. Eng. Geol. Environ. 2020. [Google Scholar] [CrossRef]
  14. Liang, Y.; Li, L.; Li, X.; Wang, K.; Chen, J.; Sun, Z.; Yang, X. Study on Roof-Coal Caving Characteristics with Complicated Structure by Fully Mechanized Caving Mining. Shock Vib. 2019, 2019, 6519213. [Google Scholar] [CrossRef]
  15. Tien Dung, L.; Oh, J.; Hebblewhite, B.; Zhang, C.; Mitra, R. A discontinuum modelling approach for investigation of Longwall Top Coal Caving mechanisms. Int. J. Rock Mech. Min. Sci. 2018, 106, 84–95. [Google Scholar]
  16. Hu, S.; Ma, L.; Guo, J.; Yang, P. Support-surrounding rock relationship and top-coal movement laws in large dip angle fully-mechanized caving face. Int. J. Min. Sci. Technol. 2018, 28, 533–539. [Google Scholar]
  17. Zhang, J.-W.; Wang, J.-C.; Wei, W.-J.; Chen, Y.; Song, Z.-Y. Experimental and numerical investigation on coal drawing from thick steep seam with longwall top coal caving mining. Arab. J. Geosci. 2018, 11, 96. [Google Scholar] [CrossRef]
  18. Klishin, S.V.; Klishin, V.I.; Opruk, G.Y. Discrete element modeling of gravity flow of broken rocks in the technology of longwall top coal caving. In International Scientific Conference Knowledge-Based Technologies in Development and Utilization of Mineral Resources; Fryanov, V., Ed.; IOP Publishing Ltd.: Novokuznetsk, Russia, 2018; Volume 206. [Google Scholar]
  19. Klishin, V.I.; Fryanov, V.N.; Pavlova, L.D.; Opruk, G.Y. Modeling Top Coal Disintegration in Thick Seams in Longwall Top Coal Caving. J. Min. Sci. 2019, 55, 247–256. [Google Scholar] [CrossRef]
  20. Wang, J.; Zhang, J.; Li, Z. A new research system for caving mechanism analysis and its application to sublevel top-coal caving mining. Int. J. Rock Mech. Min. Sci. 2016, 88, 273–285. [Google Scholar] [CrossRef]
  21. Yu, B.; Zhang, R.; Gao, M.-Z.; Li, G.; Zhang, Z.-T.; Liu, Q.-Y. Numerical Approach to the Top Coal Caving Process under Different Coal Seam Thicknesses. Therm. Sci. 2015, 19, 1423–1428. [Google Scholar] [CrossRef]
  22. Zhu, D.; Chen, Z.; Du, W.; Zhang, L.; Zhou, Z. Caving mechanisms of loose top-coal in longwall top-coal caving mining based on stochastic medium theory. Arab. J. Geosci. 2018, 11, 621. [Google Scholar] [CrossRef]
  23. Castro, R.; Gomez, R.; Hekmat, A. Experimental quantification of hang-up for block caving applications. Int. J. Rock Mech. Min. Sci. 2016, 85, 1–9. [Google Scholar] [CrossRef]
  24. Castro, R.L.; Fuenzalida, M.A.; Lund, F. Experimental study of gravity flow under confined conditions. Int. J. Rock Mech. Min. Sci. 2014, 67, 164–169. [Google Scholar] [CrossRef]
  25. Yang, S.; Zhang, J.; Chen, Y.; Song, Z. Effect of upward angle on the drawing mechanism in longwall top-coal caving mining. Int. J. Rock Mech. Min. Sci. 2016, 85, 92–101. [Google Scholar] [CrossRef]
  26. Chi, M.; Zhang, D.; Fan, G.; Zhang, W.; Liu, H. Prediction of top-coal caving and drawing characteristics by the analytic hierarchy process-fuzzy discrimination method in extra-thick coal seams. J. Intell. Fuzzy Syst. 2017, 33, 2533–2545. [Google Scholar] [CrossRef]
  27. Zhang, Q.; Yuan, R.; Wang, S.; Li, D.; Li, H.; Zhang, X. Optimizing Simulation and Analysis of Automated Top-Coal Drawing Technique in Extra-Thick Coal Seams. Energies 2020, 13, 232. [Google Scholar] [CrossRef] [Green Version]
  28. Herezy, Ł.; Janik, D.; Skrzypkowski, K. Powered Roof Support–Rock Strata Interactions on the Example of an Automated Coal Plough System. Studia Geotech. Et Mech. 2018, 40, 46–55. [Google Scholar] [CrossRef] [Green Version]
  29. Krzysztof, S.; Waldemar, K.; Nguyen, D.T. Choice of powered roof support FAZOS-15/31-POz for Vang Danh hard coal mine. J. Pol. Miner. Eng. Soc. 2019, 21, 175–182. [Google Scholar]
  30. Huo, Y.; Song, X.; Sun, Z.; Wang, Z.; Li, H. Evolution of mining-induced stress in fully mechanized top-coal caving under high horizontal stress. Energy Sci. Eng. 2020, 8, 2203–2215. [Google Scholar] [CrossRef]
  31. Huo, Y.; Song, X.; Zhu, D. Numerical Investigation of Top-Coal Migration in the First Coal-Drawing Process by an FDM-DEM Coupling Method. Energies 2020, 13, 5493. [Google Scholar] [CrossRef]
  32. Zhu, D.; Song, X.; Li, H.; Liu, Z.; Wang, C.; Huo, Y. Cooperative load-bearing characteristics of a pillar group and a gob pile in partially caved areas at shallow depth. Energy Sci. Eng. 2020, 8, 89–103. [Google Scholar] [CrossRef] [Green Version]
  33. Zhu, D.; Wu, Y.; Liu, Z.; Dong, X.; Yu, J. Failure mechanism and safety control strategy for laminated roof of wide-span roadway. Eng. Fail. Anal. 2020, 111, 104489. [Google Scholar] [CrossRef]
Figure 1. Hydraulic support and scraper conveyors [31].
Energies 14 00219 g001
Figure 2. Measured results.
Energies 14 00219 g002
Figure 3. Numerical model [31].
Energies 14 00219 g003
Figure 4. Flowchart for numerical simulation.
Energies 14 00219 g004
Figure 5. Range of loose body (LB). (af) respectively refers to the range of LB formed from when the support stays in place to after it is removed for the 5th time.
Energies 14 00219 g005
Figure 6. The shape of DB. (a) The Shape of DBs; (b) Evolution of ADB in the process of coal drawing; (c) Evolution of HDB and WDB in the process of coal drawing.
Energies 14 00219 g006
Figure 7. Length (LDB) and the included angle (θDB) of long axis of the DB profile ellipsoid. (a) Extraction of LDB and θDB; (b) Evolution curves of LDB and θDB.
Energies 14 00219 g007
Figure 8. The evolutional process of LB.
Energies 14 00219 g008
Figure 9. Curve of LB advance distance evolution.
Energies 14 00219 g009
Figure 10. Increment curve.
Energies 14 00219 g010
Figure 11. The evolutional process of TCB.
Energies 14 00219 g011
Figure 12. Fitting formula determination.
Energies 14 00219 g012
Figure 13. Fitting curves. (a) Fitting curve of each coal drawing round; (b) Evolution of height of stagnation point during coal drawing; (c) Evolution of curvature radius of stagnation point during coal drawing.
Energies 14 00219 g013
Table 1. Coal seam histogram [30].
NameThickness (m)Lithology
Main roof4.2Fine sandstone
Immediate roof5.4siltstone
Top coal3.5coal
Bottom coal3.0
Floor1.6Fine sandstone
Table 2. Particle mass fraction [31].
Diameter Range (cm)Particle Mass Fraction (%)
Top CoalImmediate Roof
0–913.83\
9–1846.31\
18–2720.34\
27–3619.5213.83
36–45\46.31
45–54\20.34
54–63\19.52
Table 3. Numerical parameters [2,8,21].
Stratum
Name
Unit TypeConstitutive ModelYoung’s Modulus (GPa)Density
(kg/m3)
Poisson’s RatioFircdp
Nratio
dp
Sratio
kn
(N/m)
ks
(N/m)
Main roofZoneElastic15.0426600.35-----
Immediate roofBallLinear13.582650-0.50.30.34 × 1084 × 108
Top coalBallLinear2.401390-0.50.30.32 × 1082 × 108
Bottom coalZoneElastic2.4013900.25-----
Notes: firc—Friction coefficient; dp_nratio—Normal critical damping ratio; dp_sratio—Shear critical damping ratio; kn—Normal stiffness; ks—Shear stiffness.
Table 4. Fitting parameters.
Caving StepFitted ResultStagnation Point Point PositionRadius of Curvature at the Stagnation Point
1F1(x) = 0.157x2 + 0.123/x − 5.321x1/2 + 8.4604.176.477
2F2(x) = 0.223x2 + 0.182/x − 7.046x1/2 + 10.2253.984.579
3F3(x) = 0.274x2 + 0.025/x − 8.681x1/2 + 12.4253.973.665
4F4(x) = 0.230x2 + 0.281/x − 7.899x1/2 + 12.0514.214.467
5F5(x) = 0.319x2 + 0.042/x − 9.666x1/2 + 13.8083.863.146
6F6(x) = 0.185x2 + 0.018/x − 6.207x1/2 + 9.4554.135.417
7F7(x) = 0.283x2 + 0.022/x − 8.480x1/2 + 11.8663.833.541
8F8(x) = 0.206x2 + 0.212/x − 5.894x1/2 + 8.2733.744.996
9F9(x) = 0.202x2 + 0.284/x − 5.262x1/2 + 6.9403.535.188
10F10(x) = 0.122x2 + 0.222/x − 3.604x1/2 + 5.2383.838.629
11F11(x) = 0.141x2 + 0.236/x − 3.921x1/2 + 5.5223.687.481
12F12(x) = 0.165x2 + 0.256/x − 4.942x1/2 + 7.2033.866.322
Publisher’s Note: MDPI stays neutral with regard to jurisdictional claims in published maps and institutional affiliations.

