LAEND: A Model for Multi-Objective Investment Optimisation of Residential Quarters Considering Costs and Environmental Impacts


Institute for Industrial Ecology (INEC), Pforzheim University, Tiefenbronner Str. 65, D-75175 Pforzheim, Germany
*
Author to whom correspondence should be addressed.
Energies 2020, 13(3), 614; https://doi.org/10.3390/en13030614
Submission received: 20 December 2019
/
Revised: 16 January 2020
/
Accepted: 23 January 2020
/
Published: 1 February 2020
(This article belongs to the Special Issue Model Coupling and Energy Systems)
Abstract
:Renewable energy systems are especially challenging both in terms of planning and operation. Energy system models that take into account not only the costs but also a wide range of environmental impacts support holistic planning. In this way, burden-shifting caused by greenhouse gas mitigation can be identified and minimised at an early stage. The Life cycle Assessment based ENergy Decision support tool LAEND combines a multi-criteria optimising tool for energy system modelling and an integrated environmental assessment for the analysis of decentral systems. By a single or multi-objective optimisation, considering costs, environmental impact indicators as well as weighted impact indicator sets, the model enables the determination of optimal investment planning and dispatch of the analysed energy system. The application of LAEND to an exemplary residential quarter shows the benefit of the model regarding the identification of conflicting goals and of a system that compensates for the different objectives. The observed shift of environmental impacts from the use phase to the production phase of the renewable electricity generators points further to the importance of the integration of the entire life cycle.
1. Introduction
Energy is needed for economic activities and to secure the economic welfare of nations as energy use and gross domestic product bear bidirectional causality [1,2,3]. Nevertheless, providing and using energy causes negative impacts on the environment. Burning fossil and nuclear fuels to fulfil energy demand is considered to be one of the main originators for global and regional environmental impacts (e.g., climate change and eutrophication) as well as direct disease burdens for humans (e.g., toxicity and particulate matters) [4,5]. The energy sector is responsible for 47% of the worldwide anthropogenic greenhouse gas (GHG) emissions between 2000 and 2010 and contributes significantly to further environmental impacts [4,6].
Renewable energies are considered as the key technology for the transition towards a carbon-free and sustainable energy supply. Increasing shares of renewable energies imply an increased sector coupling (particularly heat and electricity) and the decentralisation of the energy systems. They lead to a shift of paradigms: Whereas for example in Germany, most of the conventional power plants are owned by energy utilities, about 40% of the renewable power plants are projects in the hands of private citizens, co-operatives or funds with civic participation [7]. The number of actors involved in energy supply thus rises and the local circumstances (e.g., local renewable potentials, housing structure) need detailed consideration. On the community level, less technical, administrative and economic resources for sustainable energy projects are available which hinders a successful transition. Decision support at the community level, therefore gains importance [8].
With regard to climate impacts, renewable energies are often considered carbon-free in general and to emit less or no emissions to the air in the use phase (besides the burning of biomass) [9]. But the utilisation of renewable energies like e.g., wind and photovoltaics, lead to new conflicts of goals only partly implicated by storage needs: use of resources, especially the exploitation of rare earth materials, toxicities, land use and the loss of biodiversity might increase [10,11,12,13]. Additionally, the environmental impacts shift from the use phase (key emission phase of fossil energies) to the manufacturing phase of the energy converters (key emission phase of renewable energies and storages) [14].
Thus, decision support considering the environmental impact of decentral energy systems gains importance and needs to cope with additional requirements in terms of:
- indicators under consideration as both conventional and renewable energy systems impact different environmental categories, and in terms of;
- life cycle phases under consideration as the impact of conventional energy systems on the one hand and renewable energy systems on the other hand, concentrates on different stages of the life cycle.
To close this gap, we decided to develop a multi-criteria optimising tool combining the strength of traditional energy system modelling for decentral energy systems with an integrated environmental assessment. By opting for a multi-objective decision-making approach we follow Rauner and Budzinsiki’s conclusion that the full spectrum of solutions needs consideration for an integrated environmental assessment [14]. An earlier version of the model has been presented at the 16th IAEE European Conference [15]. (In contrast to the first model coupling approach, we improved and extended the methods and materials. Battery investment structure was improved and costs and life cycle assessment data updated. Due to solver issues that we encountered handling with very small values for several impact categories we implemented correction factors and switched to the CPLEX solver instead of Gurobi. Furthermore, we extended the functionality for a better evaluation of full life cycle impact assessment results for each optimisation.)
Energy system modelling has been applied for decades and a huge number of tools have been developed. Over the last decade, the model enhancements especially concerned the adequate representation of intermittent renewables. A detailed review of tools for energy systems with high shares of renewables can be found in [16]. Most energy system models use costs as a determining factor but models are increasingly including GHG and single emissions such as CO2, NOX, SOX or CH4 as constraints to meet environmental policy requirements or goals [16]. Decision support from an environmental perspective, however, needs to go beyond cost optimisation and environmental constraints and demands for more environmental categories. Life cycle assessment (LCA) accounts for these requirements and is increasingly implemented into decision-making procedures inside and outside the energy sector (cf. e.g., [17,18,19,20,21]). The need for an a priori integration of life cycle assessment (LCA) into energy optimisation modelling is recurrently mentioned in literature and frameworks, as well models have been developed by different authors. Focussing on electricity systems, Azapagic et al. developed a DEcision-Support Framework IntegRating Economic, Environmental and Social Sustainability called DESIRES. They coupled sustainability assessment, optimisation and multi-attribute decision analysis and applied it to the electricity generation in the UK. The objective function considers costs, social and environmental indicators selected by stakeholders. Besides the identification of a sustainable electricity mix, the focus of DESIRES lies in stakeholder integration into the decision making and facilitating a consensus between different stakeholder groups [22]. The consideration of additional sectors to electricity is described by Su et al. In the example of Beijing, they propose a multi-criteria optimisation model to distribute the four main energy resources coal, oil, natural gas, and electricity to the key sectors agriculture, industry, construction, transportation, commerce, and household. The approach is not differentiating technologies but calculates aggregated environmental indicators for the four main energy sources. The major outcome besides the targeted distribution of energy sources is that under the consideration of environmental impacts, energy savings gain importance [23]. García-Gusano et al. integrate life cycle indicators into energy optimisation models in the case of the Norwegian and the Spanish electricity systems. They take into account selected midpoint (like climate change, ozone depletion) and endpoint impact categories (such as human health or ecosystem quality) but follow a single criterion techno-economic optimisation. Their results demonstrate that in the Norwegian case, most of the impacts are linked to the installation of wind turbines and hydropower [24,25]. Rauner and Budzinski include life cycle-based sustainability assessment into an energy system model. The developed MOrOSA (Multi-Objective Optimisation Sustainability Assessment) framework considers all relevant products and processes of the global supply chain and takes into account an extensive set of impact categories. The environmental impact categories are aggregated to a single score and used together with costs to calculate a Pareto front. Similar to the results of García-Gusano et al., the application of MOrOSA on the German power sector reveals the shift of the environmental intervention from the use phase to the production of the generation converters under the application of renewables. The major conclusion regarding the importance of an integrated optimisation is the enabling of the decision-maker to select the most preferred solution while being aware of the trade-off [14]. Recently, Vandepaer et al. published their analyses on the integration of batteries in the Swiss electricity system. On the base of the Swiss TIMES model, they calculate the environmental impact of different battery types under the consideration of system changes introduced by the batteries. The comprehensive set of impact categories under consideration is not taken account for in the objective function, but is subject to current research activities [26].
We can observe that frameworks for an assessment of energy systems considering LCAs have been developed and models with an application mostly on national power grids are existent. The level of detail in the described models is limited due to the spatial resolution or in the case of Su et al. due to the specific question at hand. In this study, we present a hybrid model for a residential quarter with an applicable level of detail. The model supports decision support at the local level and offers a more precise representation of demand, renewable potential and energy converters as well as storages. Furthermore, the reviewed studies either represent the multi-criteria objective of an environmental assessment by cost optimisation solved under a limitation on GHG emissions or by early weighting procedures providing aggregated results. A whole integration of the full array of impact indicators into the objective function is seen as a necessity. In addition, information on individual results for the impact indicators is essential to deliver a holistic picture of the system and to develop communicable results. Using the example of the electricity system of a typical German residential quarter, we present the model’s benefits in terms of identifying conflicts of goals as well as deriving holistically optimised energy systems.
The paper is organised as follows: In Section 2 we present our methodology by introducing briefly the two basic models before describing our hybrid approach. Furthermore, we highlight the benefits and drawbacks of our approach and give an overview of the model application. Section 3 presents the results and discussion of the single criterion and the multi-criteria optimisation applied to a typical German residential quarter. Furthermore, conflicts of goals between the different optimisation criteria are derived. In Section 4, we discuss the limitations of our study before we draw conclusions in Section 5.
2. Materials and Methods
A growing number of energy system models have opened their code base and allow them to reuse and modify the models as well as to improve efficiency, scrutiny, reproducibility, reusability and transparency in energy system modelling [27]. Python is widely applied in science and commonly used LCA software such as openLCA and Umberto growingly implements the support of python scripts. Thus, we focussed on energy system models using python as a programming language to ease the coupling of the model with LCA tools. For our modelling approach, we coupled the open-source energy system modelling framework oemof with the open-source LCA modelling software openLCA. Due to extended parametrisation needs in openLCA, a soft-linking approach has been implemented.
2.1. Energy System Modelling Framework Oemof
The linear optimisation model oemof provides the main prerequisites in terms of the technical resolution of a decentralised residential energy system and economic variables. Furthermore, oemof offers an adjustable timely resolution, wide flexibility, sophisticated packages for load curves and the feed-in of renewable (e.g., feedinlib and windpowerlib), and is open for modifications [27].
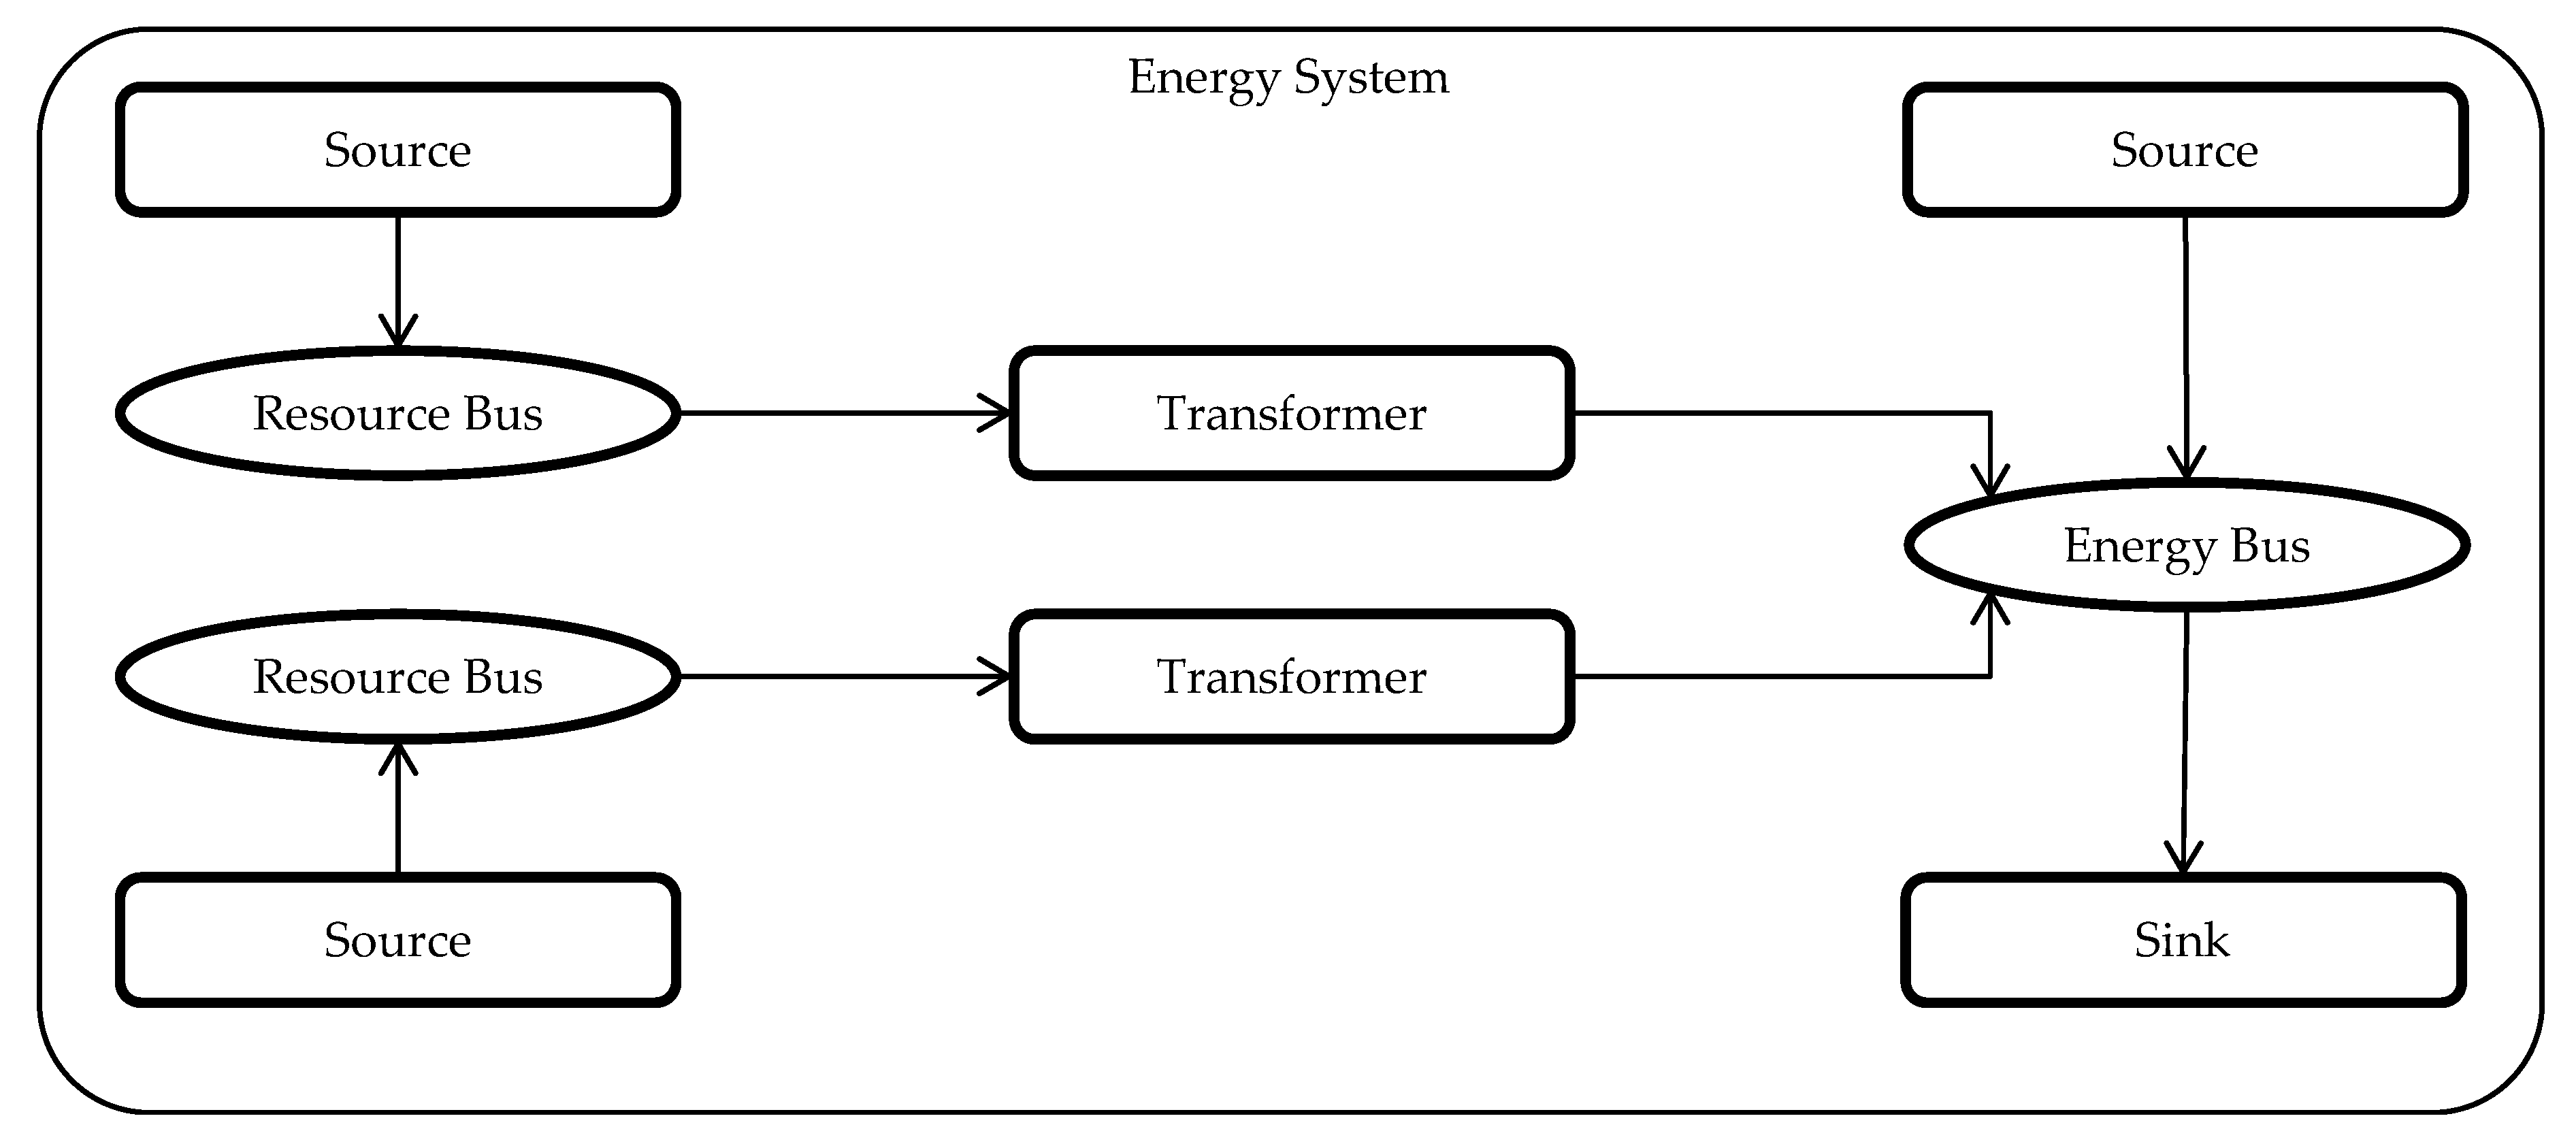
Oemof’s logic follows the representation of energy systems as a bipartite graph with flows as directed edges and nodes differentiated in buses and components. Components are used to represent consumers, producers and processes of the energy systems, whereas buses describe the connection between components (see Figure 1). All components are parametrised with economic and technical data, such as variable costs, investment, and efficiencies (loading and unloading efficiencies for storages). The modelling approach allows both dispatch and investment optimisation. [27].
2.2. Life Cycle Assessment with openLCA and Ecoinvent
For the integrated environmental analyses, we apply openLCA developed by GreenDelta as an open-source tool. It provides for the analysis of the whole life cycle of a product, service or system and covers the extraction of the raw materials to processing, usage, recycling and disposal of the materials. It is flexible concerning the use of different life cycle inventory (LCI) databases like ecoinvent, ProBas, and European Reference Life Cycle Database (ELCD). The user can build their own processes and product-service systems to determine the cumulated LCI that lists all input and output flows to and from the ecosphere associated with the object under investigation. OpenLCA aggregates and characterizes the items of the LCI to conduct the life cycle impact assessment. The user is free to make methodological choices concerning the use of different life cycle impact assessment methods (such as CML, ReCiPe, and Eco-indicator99). Due to a python interpreter, calculations with openLCA can be automated which allows for sensitivity analyses under the alteration of parameters [28].
For LCI, the database ecoinvent v3.5 (cut-off system model on unit process level) was implemented to openLCA (cf. [29]). Ecoinvent includes a wide range of processes from mineral extraction to services like transport or waste treatment. Modelling of electricity supply chains including the different generation technologies is adequately covered since energy supply is often found to be crucial in LCA results. The database contains datasets on a unit process level, which cover inputs from the technosphere (e.g., steel), inputs from the ecosphere (e.g., water) and outputs to the ecosphere (e.g., CO2 emissions) required to produce one unit of the reference product.
2.3. Life Cycle Assessment Based Energy Decision Support Tool LAEND
The development of the Life cycle Assessment based ENergy Decision support tool LAEND is subdivided into three major steps:
- the parametrisation of the LCA data for implementation into oemof,
- the installation of a link between oemof and openLCA, and
- the integration of LCA parameters into oemof and the extension of the objective function to implement a multi-criteria sustainability array.
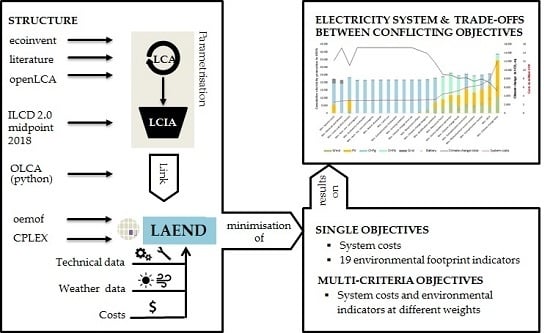
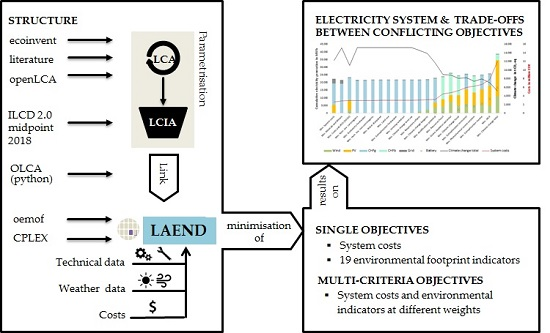
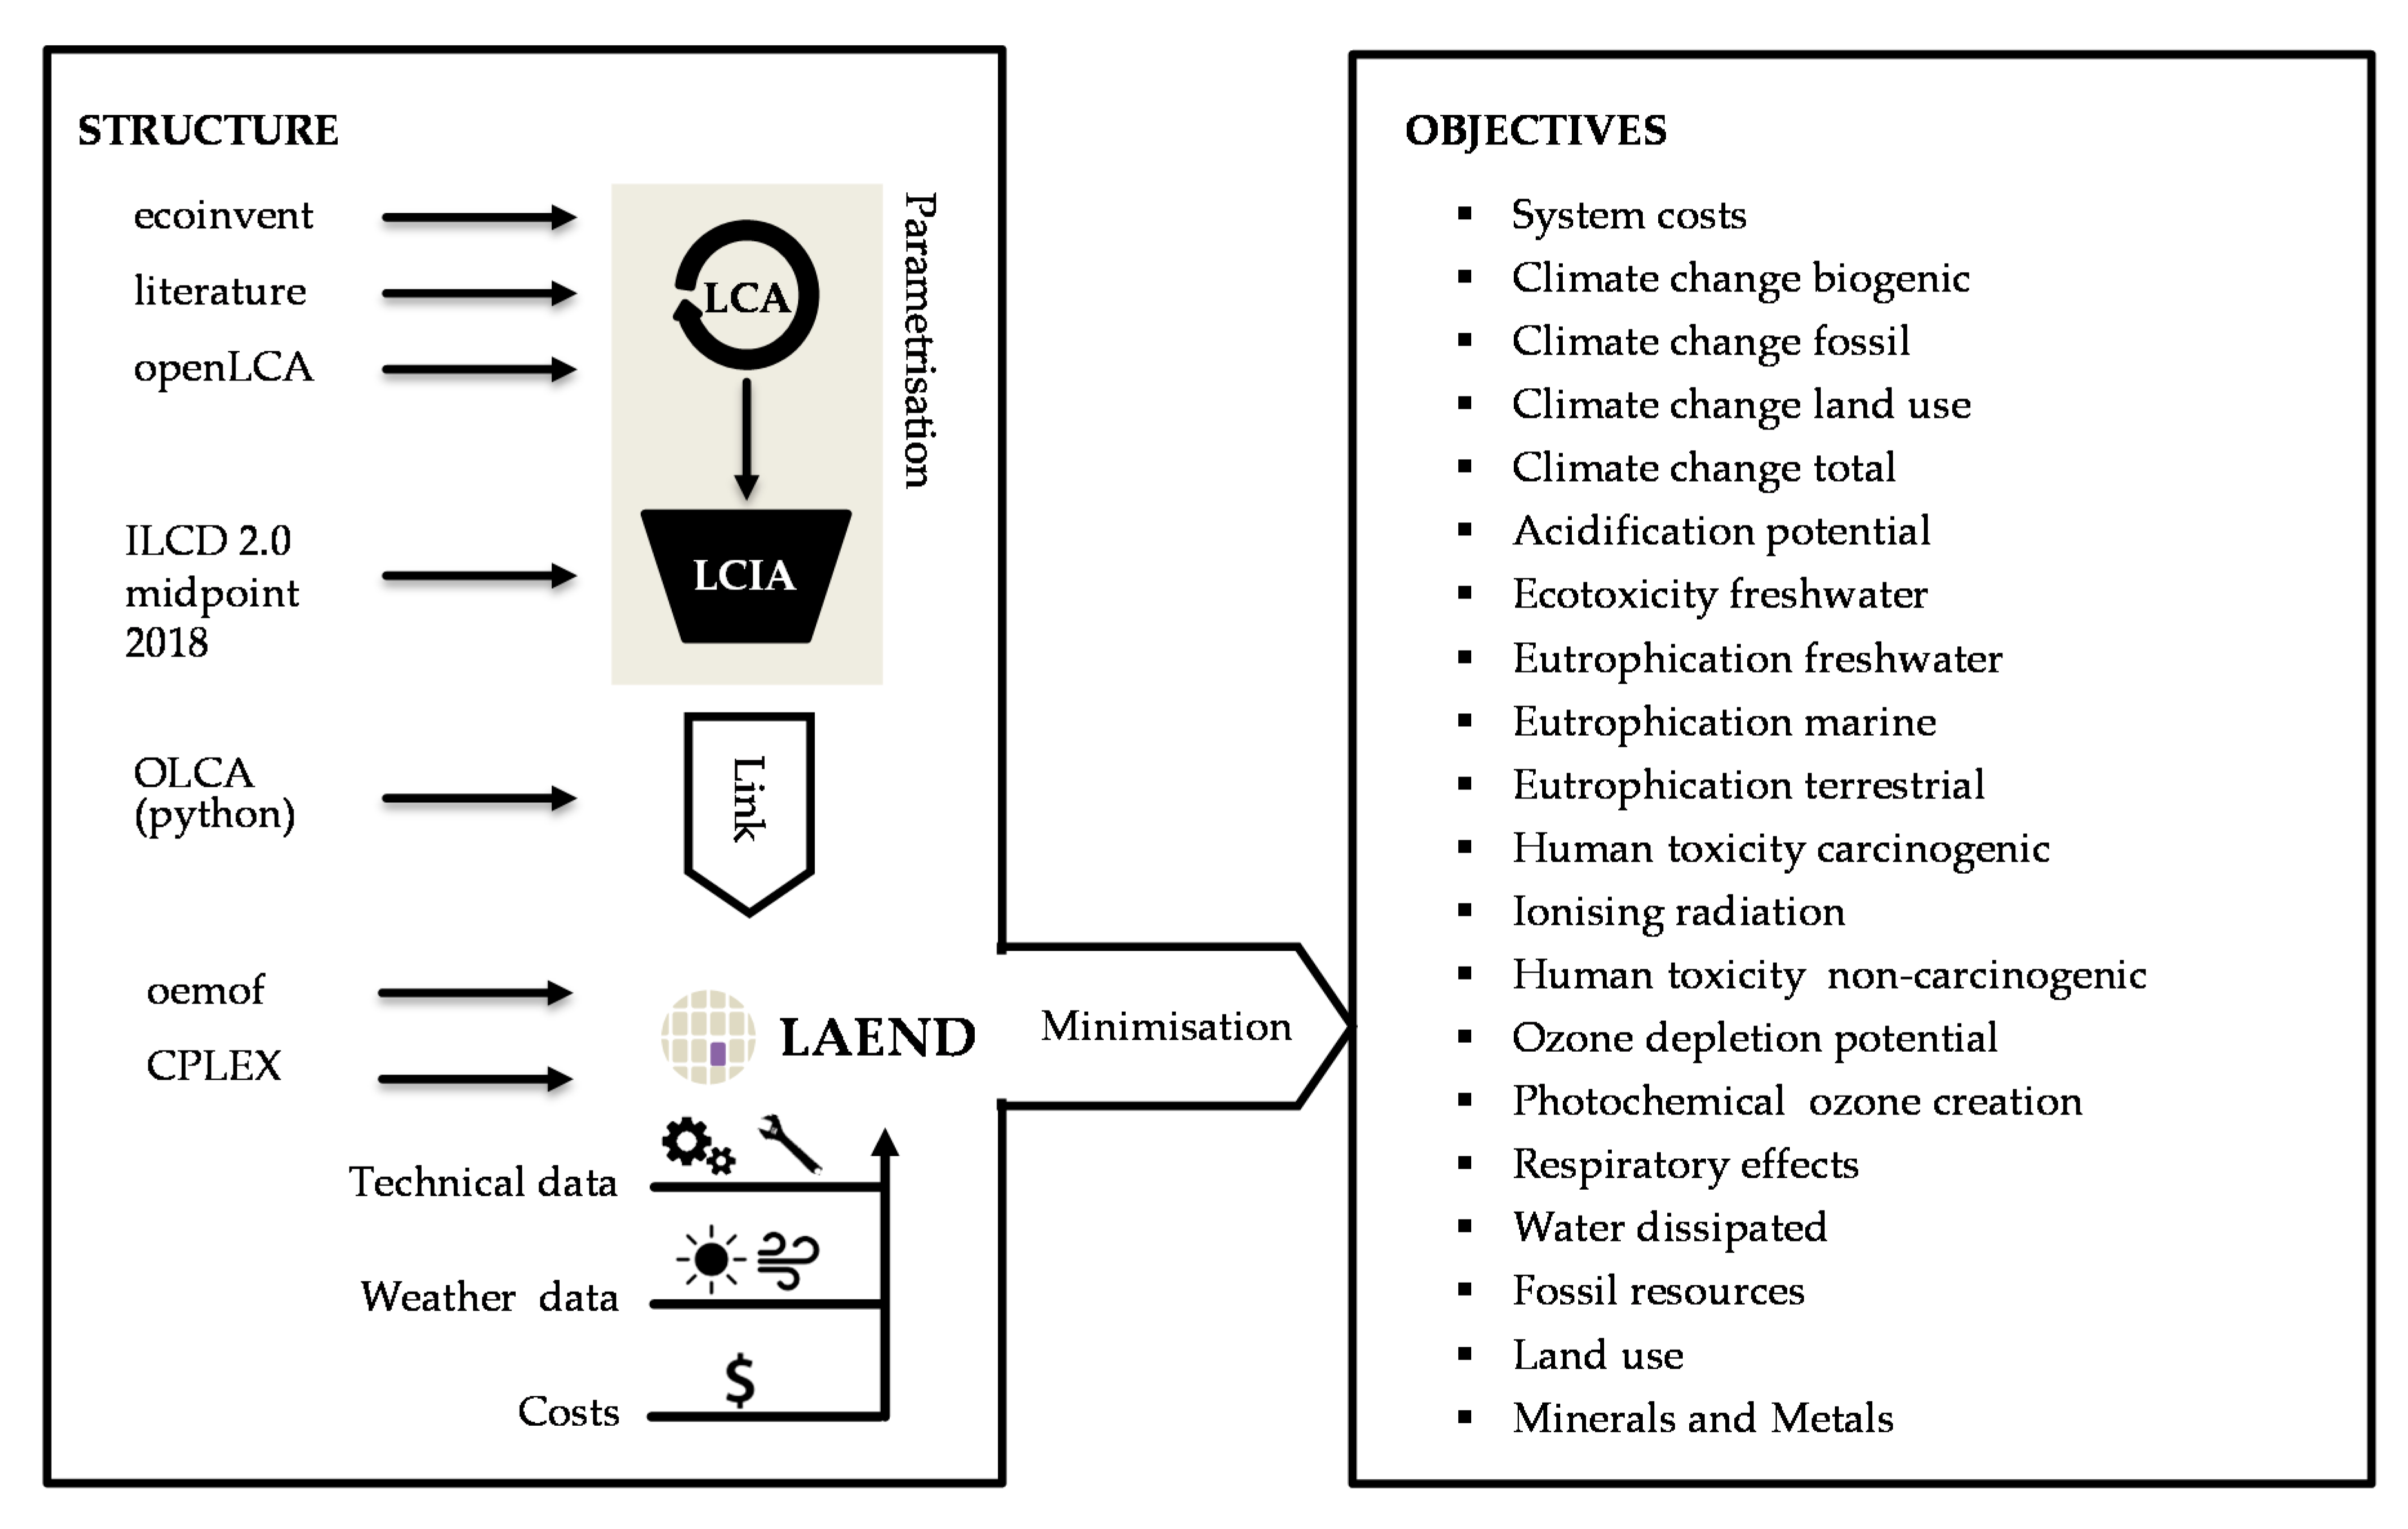
An overview of LAEND’s structure and objectives is given in Figure 2.
According to the economic data structuring, the LCI data is parametrised into construction (investment) and operational (variable) environmental intervention for the integration into the energy system model. This approach overcomes the static character of the LCA data by accounting for production/disposal and operation separately. The LCIs are following ISO 14040, 14044 and recent ILCD recommendations (cf. [31,32,33]). We apply the ecoinvent v3.5 database and supplement data from literature where needed (e.g., for battery technologies as the data is so far very basic in ecoinvent). Environmental footprint (EF) life cycle impact assessment method 2.0 is used as it is a current method that also provides normalisation and weighting to aggregate the different environmental impacts to a single score (cf. [34]).
For the coupling of oemof and openLCA, we use olca ipc (cf. [35]). This allows benefiting from the whole usability of the openLCA interface and at the same time the communication with python-based software via inter process communication.
In addition to the initial economic and technical parametrisation provided by oemof, all objects are complemented with environmental parameters. The batteries are further limited by their maximum number of cycles. To consider environmental impacts within oemof’s objective function, we add an environmental attribute to the original objective function. This attribute can either represent a single environmental impact or the (weighted) sum of several indicators. Thereby, we can assess total system costs and each environmental impact separately to calculate minima scenarios for each indicator on the one hand. On the other hand, this extension allows for combined economic-environmental scenarios by using weights. The altered term for the objective function consists of the originally implemented costs terms and the extended environmental terms as follows:
where are the variable costs, the environmental interventions of the different impacts in the use phase, the environmental interventions associated with the manufacturing and installation phase, and denote the variables (flows and capacity) associated with edges, and the variables associated with nodes, the node and the indices denote start and end node. The parameter is given to costs and environmental intervention for weighting and normalisation. The time step is set by and the year by . comprises fixed costs and the annuity of the investment considering a cost decrease to allow for technical progress over the years :
These extensions result in the optimisation of investment and dispatch considering multi-criteria. Depending on technical, economic and ecologic parameters (e.g., efficiencies, variable costs, maximum capacity, climate change) the capacity and utilisation of generators and storages are determined. The source code containing the extended parametrisation is provided as a Supplement to this article.
2.4. Benefits and Drawbacks of the Selected Approach
The integrated optimisation of costs and environmental impacts has strong advantages. Taking multiple objectives into account, the optimum out of the full set of possible solutions is determined. Hereby, not only the environmental impacts of the use phase but also the production of the generation and storing technologies are accounted for. The integration of the full set of environmental indicators allows for the identification of conflicts of goals and trade-offs–not only between costs and environmental indicators but also between the environmental indicators themselves. The contribution of different technologies to the overall environmental impacts can be depicted and conclusions are drawn regarding improvements e.g., in terms of materials to be substituted. Due to the modelling approach using perfect foresight, future cradle-to-grave environmental impacts are minimised.
In general, our flexible approach allows for the application of different life cycle impact assessment methods with the applicable set of impact categories and weighting sets. LAEND can be applied easily to different cases and be further methodologically advanced. For example, the integration of social indicators is possible as well as other multi-objective decision support techniques (e.g., distance-to-target). The open-source licensing of the software tools, embedded in the dynamic programming language environment of Python, allows a transparent and flexible analysis meeting scientific standards.
From the modelling side, on the one hand, the high time resolution and the future extendibility to sector coupling increases the results probability to match real-world system behaviour. On the other hand, the linear optimisation and scaling of systems in both the energy system model and the environmental assessment set limits to this. This applies especially for linear optimisation as small changes to data and assumptions can lead to very different electricity mixes (penny switching effect). Furthermore, uncertainties are introduced by the LCA approach as the impacts occurrence is only potentially predictable and impact quantities are associated with high uncertainties.
Inherent for many modelling applications is the data availability and data quality. Coupling approaches from different disciplines pose special challenges as the consistency of the data needs to be assured. With regard to our approach, especially the development of the environmental impact over the period under consideration needs to be questioned. In order to capture the environmental impacts more precisely, prospective datasets which reflect also future changes in the background processes should be applied. But these are not available in easily accessible ways like the ecoinvent database.
2.5. Research Design and Data Assumptions
In order to demonstrate the comprehensive analyses that can be carried out with LAEND we calculate results for the minimisation of the following objectives:
- system costs,
- each of the 19 EF indicators (climate change (biogenic), climate change (fossil), climate change (land use), climate change (total), acidification potential, freshwater ecotoxicity, freshwater eutrophication, marine eutrophication, terrestrial eutrophication, human toxicity (carcinogenic), ionising radiation, human toxicity (non-carcinogenic), ozone depletion potential, photochemical ozone creation, respiratory effects, water dissipated, fossil resources, land use, mineral and metal resources),
- a multi-criteria environmental objective named JRCII to minimise the total environmental impacts applying normalisation and weighting factors provided by the European Commission’s Joint Research Centre (JRC) to the EF indicators as listed in Table A1 of Appendix A (cf. [36,37]) (the following impact categories are not considered as no weighting and normalisation factors are available: climate change biogenic, climate change fossil, and climate change land use.), and
- a combined multi-criteria objective targeting the minimisation of normalised system costs and normalised JRCII weighted each 50% (labelled Costs and JRCII (50:50)).
Exemplarily, LAEND is applied to cover the electricity demand totalling 21,513 MWh of a typical residential quarter near Pforzheim, Germany. The period under consideration is 2020 to 2050 and the temporal resolution is set to one hour. The functional unit of the LCA is, therefore, meeting the electricity demand for every hour from 2020 to 2050.
Besides electricity from the grid, the following technologies are available to fulfil the demand: multi-crystalline silicon photovoltaics (PV), natural gas/biogas combined heat and power (CHP), and wind power. As the application focuses on the electricity sector, for CHP only the electricity-generating processes are considered. Costs and environmental impacts are allocated to heat and electricity by exergy. As the simplified exemplary application focuses on the electricity sector, a sink for the heat as a by-product from the CHP units is modelled. Two battery storage technologies are furthermore integrated: lithium iron phosphate/lithium titanate battery (LFP) and vanadium redox flow battery (VRF) according to [38,39].
The main economic data, efficiency and lifetime for the different technologies are given in Table 1. Investment is the amount of money needed for the installation of the technologies. Fixed costs occur after the installation independently from the utilisation, whereas variable costs depend on the utilisation level. Grid electricity is available at 0.14 €/kWhel, natural gas at 0.06 €/kWh, and biogas at 0.1 €/kWh [40,41,42]. The interest rate for the weighted average cost of capital and the annual cost decrease due to technical progress is assumed with 1%, respectively.
We use electrical load profiles of residential buildings in Germany covering one year (cf. [49]). Feed-in profiles for the last 10 years for Pforzheim are taken from the photovoltaic geographical information system and wind data covering 2006 to 2017 from the German Meteorological Service is used (cf. [45,50]). Both time series are extrapolated for the period under consideration.
Wind power is calculated with the wind turbine power coefficient c_p for the turbine Nordex N50 800 kW, which represents data of wind turbines smaller than 1 MW in ecoinvent. The yield is calculated by the oemof feed-in modules feedinlib and windpowerlib and its basic model SimpleWindTurbine, which is sufficient for singular wind turbine installations.
The lifetime of LFP and VRF is limited by the number of cycles. The charge rates (C-rates) have been assumed on a low level (1C) to reach the expected cycle lifetime of the battery [51].
Concerning the LCA of the energy system, the whole life cycle of each technology is taken into account. Upstream and downstream processes are consistently considered according to the ecoinvent methodology. Datasets of electricity-generating processes are separated into infrastructure and operation. Whereas the infrastructure is scaled by capacity and lifetime, the operation is scaled by energy generation to determine the reference flows. Table A2 of Appendix A provides an overview of all LCI datasets used for LAEND.
3. Results and Discussion of the Application to a Typical Residential Quarter in Germany
Our results and discussion are subject to the assumptions and simplifications applied. As the choice of assumptions and the disregard of restrictions have been made from a methodological point to show the benefits of the hybrid approach, the results shall not be seen as a base for practical recommendations. Instead, they shall contribute to further model development.
LAEND determines the optimum energy mix for a residential quarter under the different optimisation objectives. The main results for the individual (single-criterion) or integrated (multi-criteria) optimisation are presented and discussed in Section 3.1. and trade-offs between the different objectives are shown in Section 3.2. Section 3.3. provides results and their discussion for altered weightings.
3.1. Electricy Mix and Installed Capacity under Different Optimisation Objectives
Depending on the optimisation objective, LAEND leads to different compositions for the energy system of the residential quarter. Figure 3 presents an overview of the total electricity generation aggregated over the period 2020 to 2050 for the different optimisation criteria. The height of the bars depicts the generated electricity on the left axis and the colours indicate the source of electricity generation. Electricity supplied from storage is inserted as crosses (left axis). As additional information, system costs (red line, right axis) and climate change total (black line, right axis) are depicted.
Under the assumptions made, the optimisation for climate change results in the highest system costs of 11.9 million Euros, which is 4.6 times higher than the system cost optimum of about 2.5 million Euros. The average costs per kWh generated electricity show only a 2.7 times higher value as the optimisation for climate change results in higher total electricity generation.
In general, we nevertheless observe that costs are negatively correlated with the minimisation of climate change, though the cost-optimal system does not cause the highest climate change impact. On the one hand, the decrease of fossil-fuel-based energy technologies is connected with lower impacts on climate change. On the other hand, system costs increase with growing renewable energy shares, with less grid power, with the reduction of CHP and battery storage. Particularly the use of wind power together with battery storage leads to steep cost increases. The cost increase partly stems from the higher overall electricity generation for systems with intermittent renewables. Electricity from wind and PV is fed to the grid in case of insufficient electricity demand and storage capacity within the quarter. The minimisation of ozone depletion potential does not deploy batteries, in contrast to other optimisation objectives choosing renewable energies to a great extent. The production of trichloromethane and chlorodifluoromethane which are necessary for battery cell manufacturing contributes mainly to relatively high ozone depletion potential.
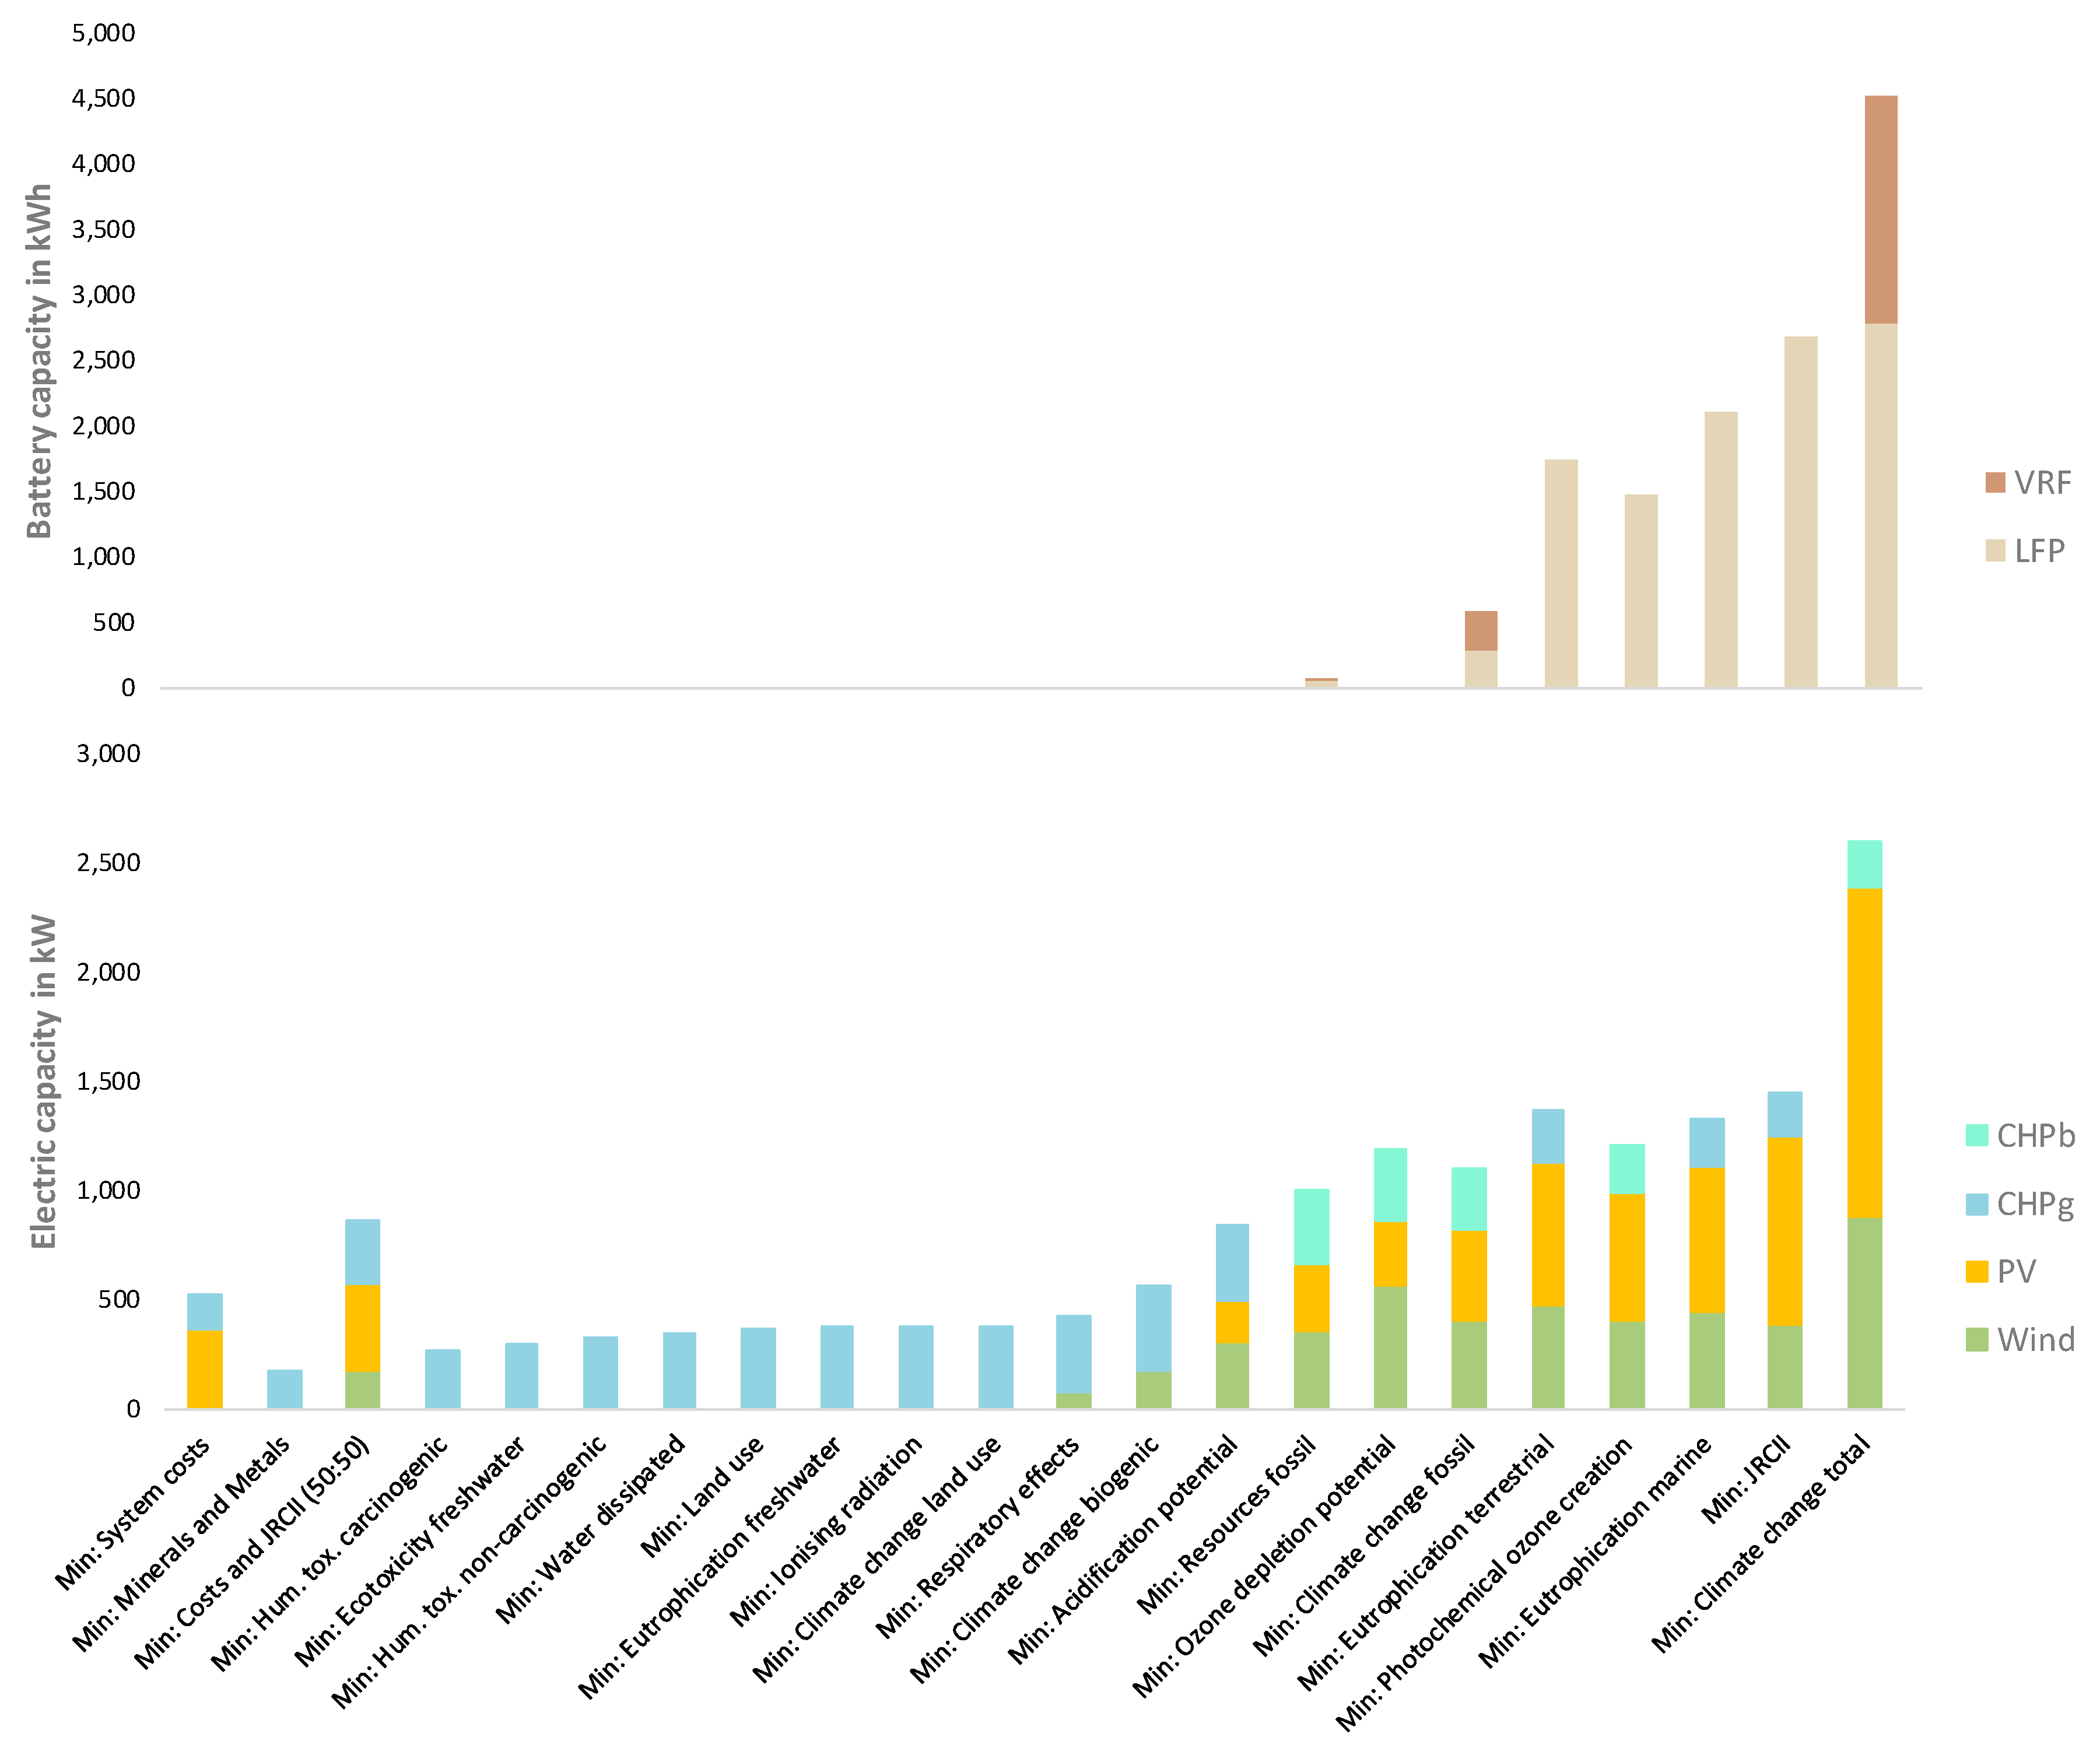
Figure 4 indicates the total investment needed over the period under consideration (2020-2050): greenfield investment and reinvestment. Most of the reinvestment occurs after the calendric lifetime of the installed capacities. The limitation of 8000-10,000 cycles for batteries in the model requires the reinvestment of batteries in 2030. Minor investments are induced by weather variations and for the system costs optimisation due to the devaluation of future investments.
For all optimisation objectives, CHP power is part of the solution. Optimisation results with low values for climate change comprise a mix of wind, PV, battery storage and CHP for buffering intermittent electricity generation. Biogas uses less fossil resources and therefore emits minor fossil related GHG. During the pipeline transportation of natural gas ozone-depleting substances, Halon 1211 and HCFC-22 are released which can be avoided by the use of biogas. Thus, biogas-fired CHP can further reduce the environmental impact categories climate change (total and fossil), ozone depletion, photochemical ozone creation and fossil resources. In contrast, natural gas-fired CHP is preferred in all other environmental impact category optimisations as the production of biogas e.g., has a high impact on acidification and eutrophication due to ammonia emissions. The model is mostly relying on LFP batteries, with the exception of the optimisation of climate change (total and fossil) and fossil resources, where a mix of LFP and VRF batteries is used. The different cost structure, efficiencies, cycle lifetimes and GHG emissions from the production of LFP in comparison to VRF give the reason for this switch.
The multi-criteria optimisation JRCII has the second-best performance in climate change, succeeding the climate change total optimisation objective. Considering costs and JRCII (50:50) with equal weights leads to medium climate change impact at third-lowest system costs. Compared to the JRCII objective, increased use of CHP followed by a decrease of battery storage, PV and wind lead to the cost reduction but impact environmental categories.
3.2. Trade-Offs Between the Optimisation Objectives
The application of LAEND to the exemplary residential quarter derives the absolute value for each criterion for all optimisation runs. For the further analysis of our results, we calculate the normalised distance for each criterion for each optimisation run:
- To determine the absolute distance, the minimum absolute value for an indicator (received by the single criteria optimisation for this indicator) is subtracted from each resulting absolute value for this indicator of other optimisation runs (single optimisation runs for other indicators and multi-criteria optimisation runs).
- This received absolute distance is divided by the minimum absolute value for normalisation.
- The result shows by which factor the value is higher than the minimum.
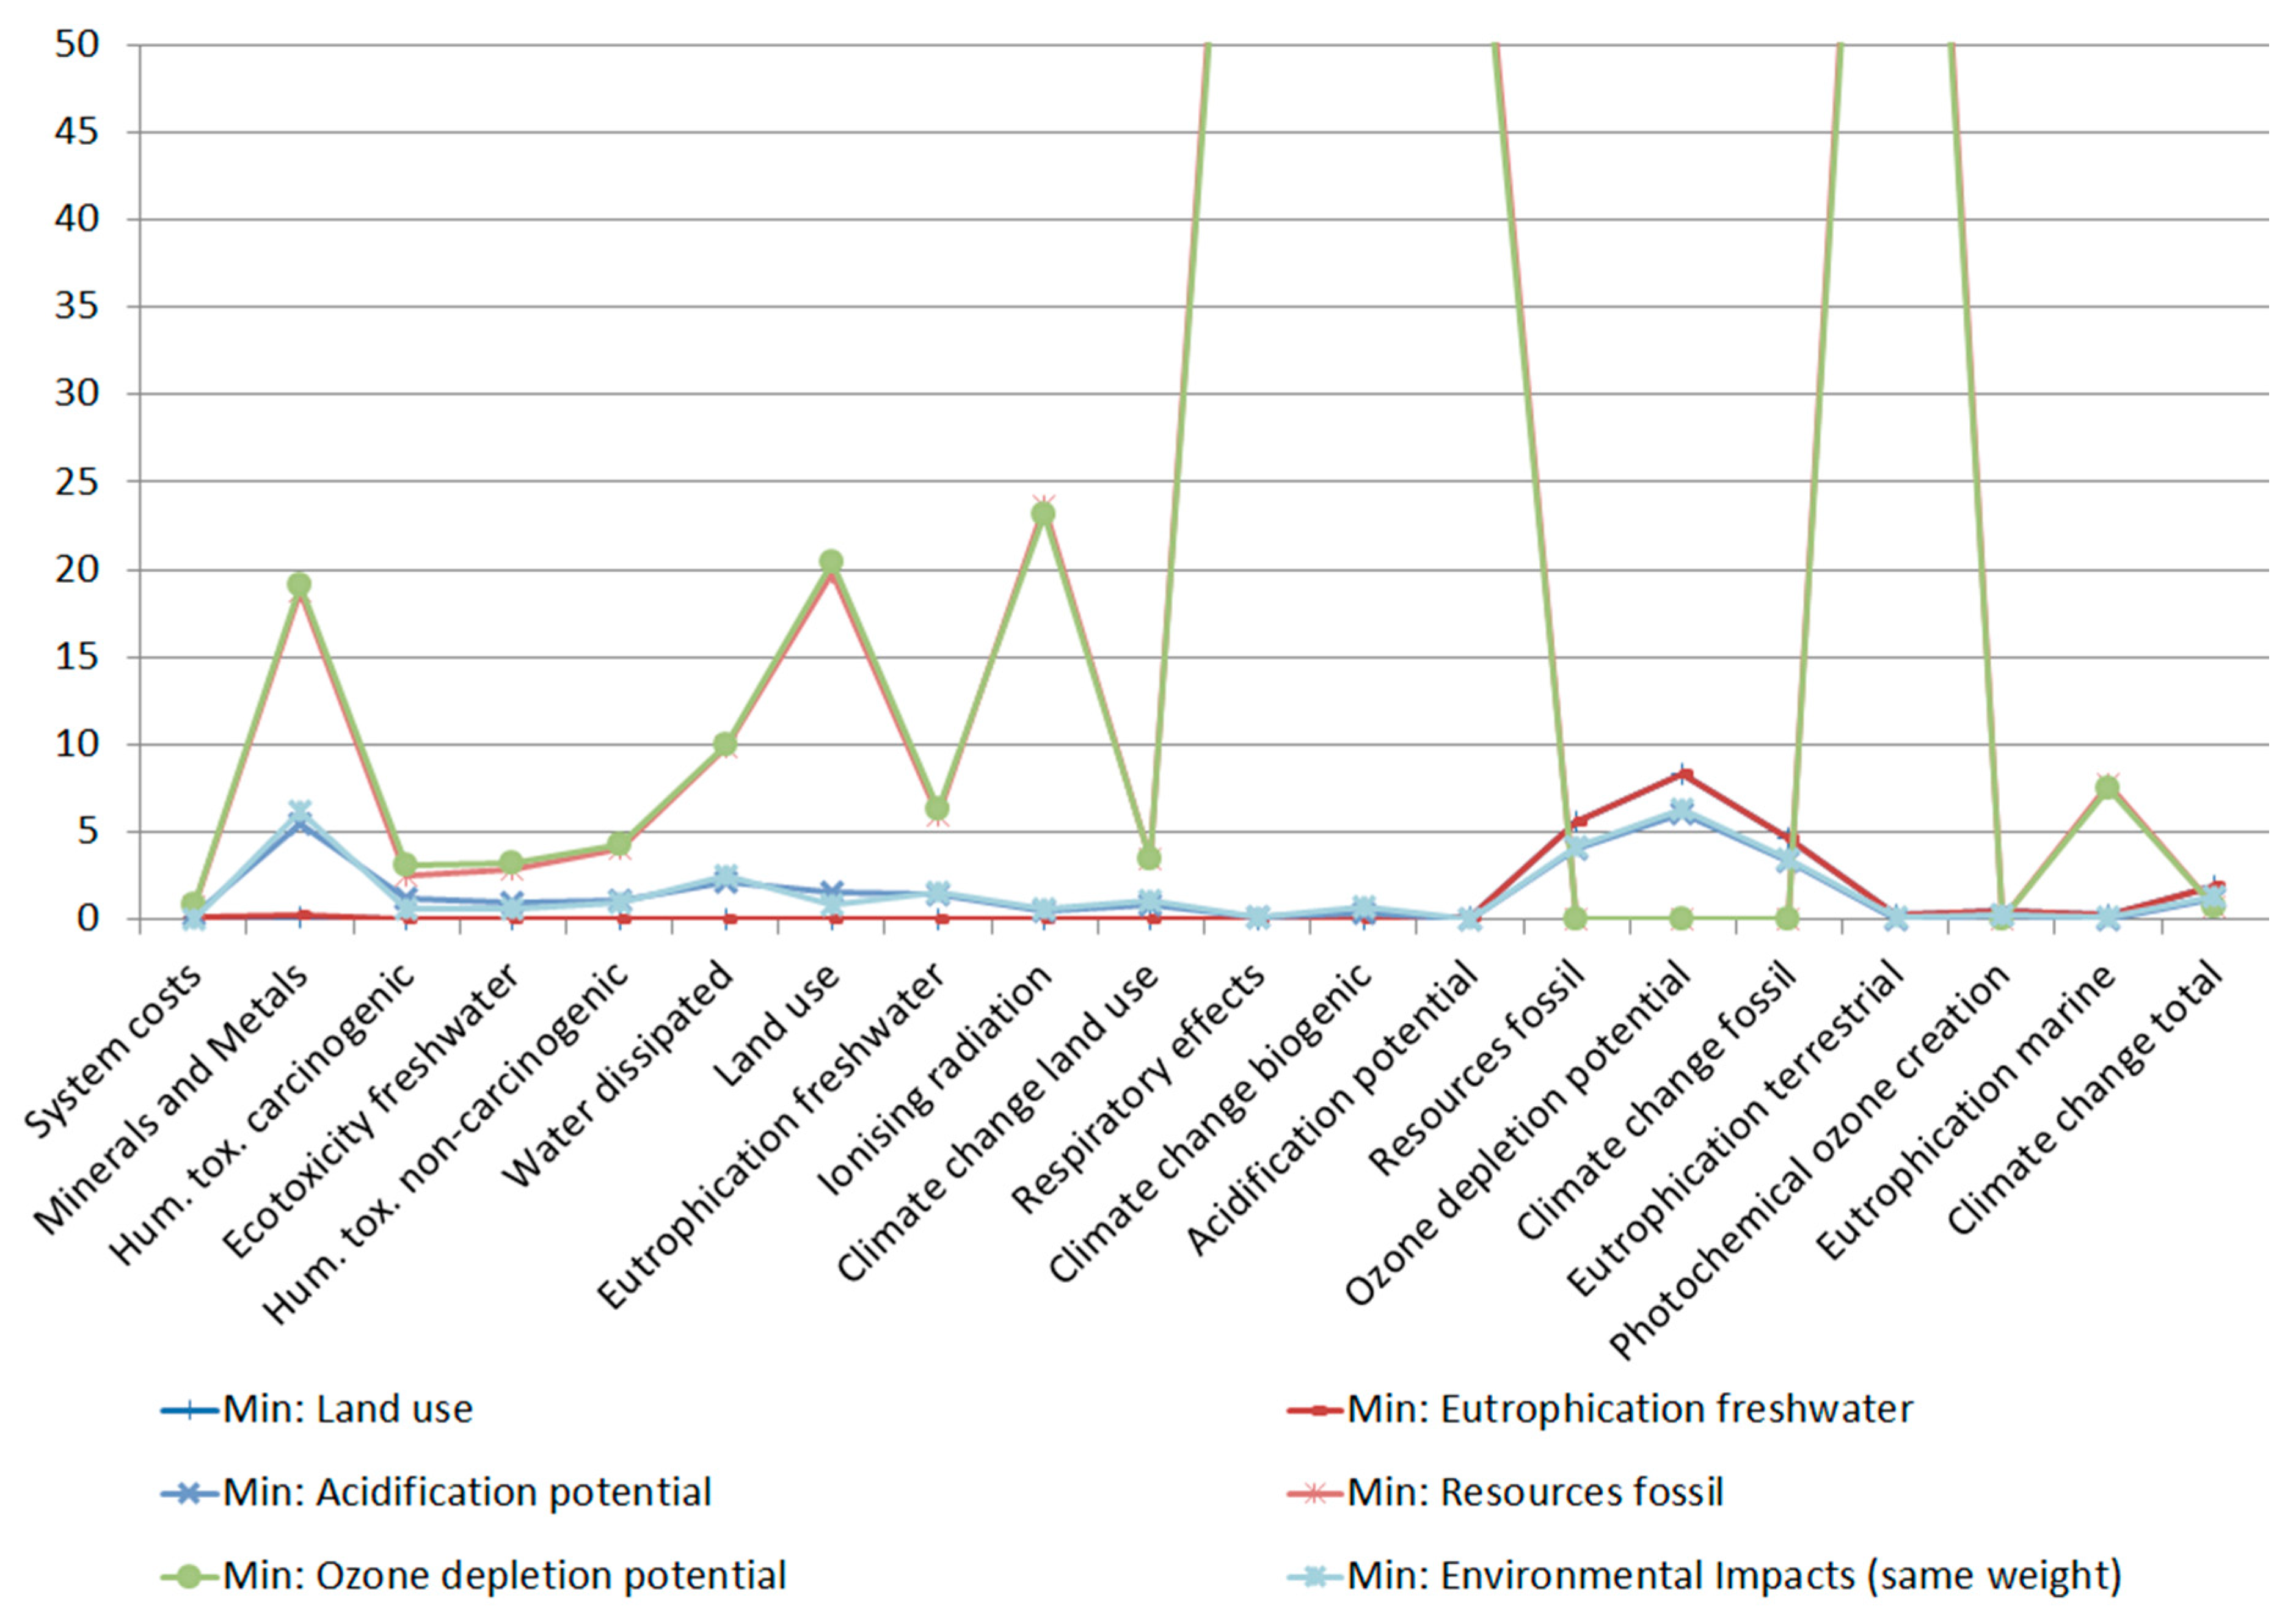
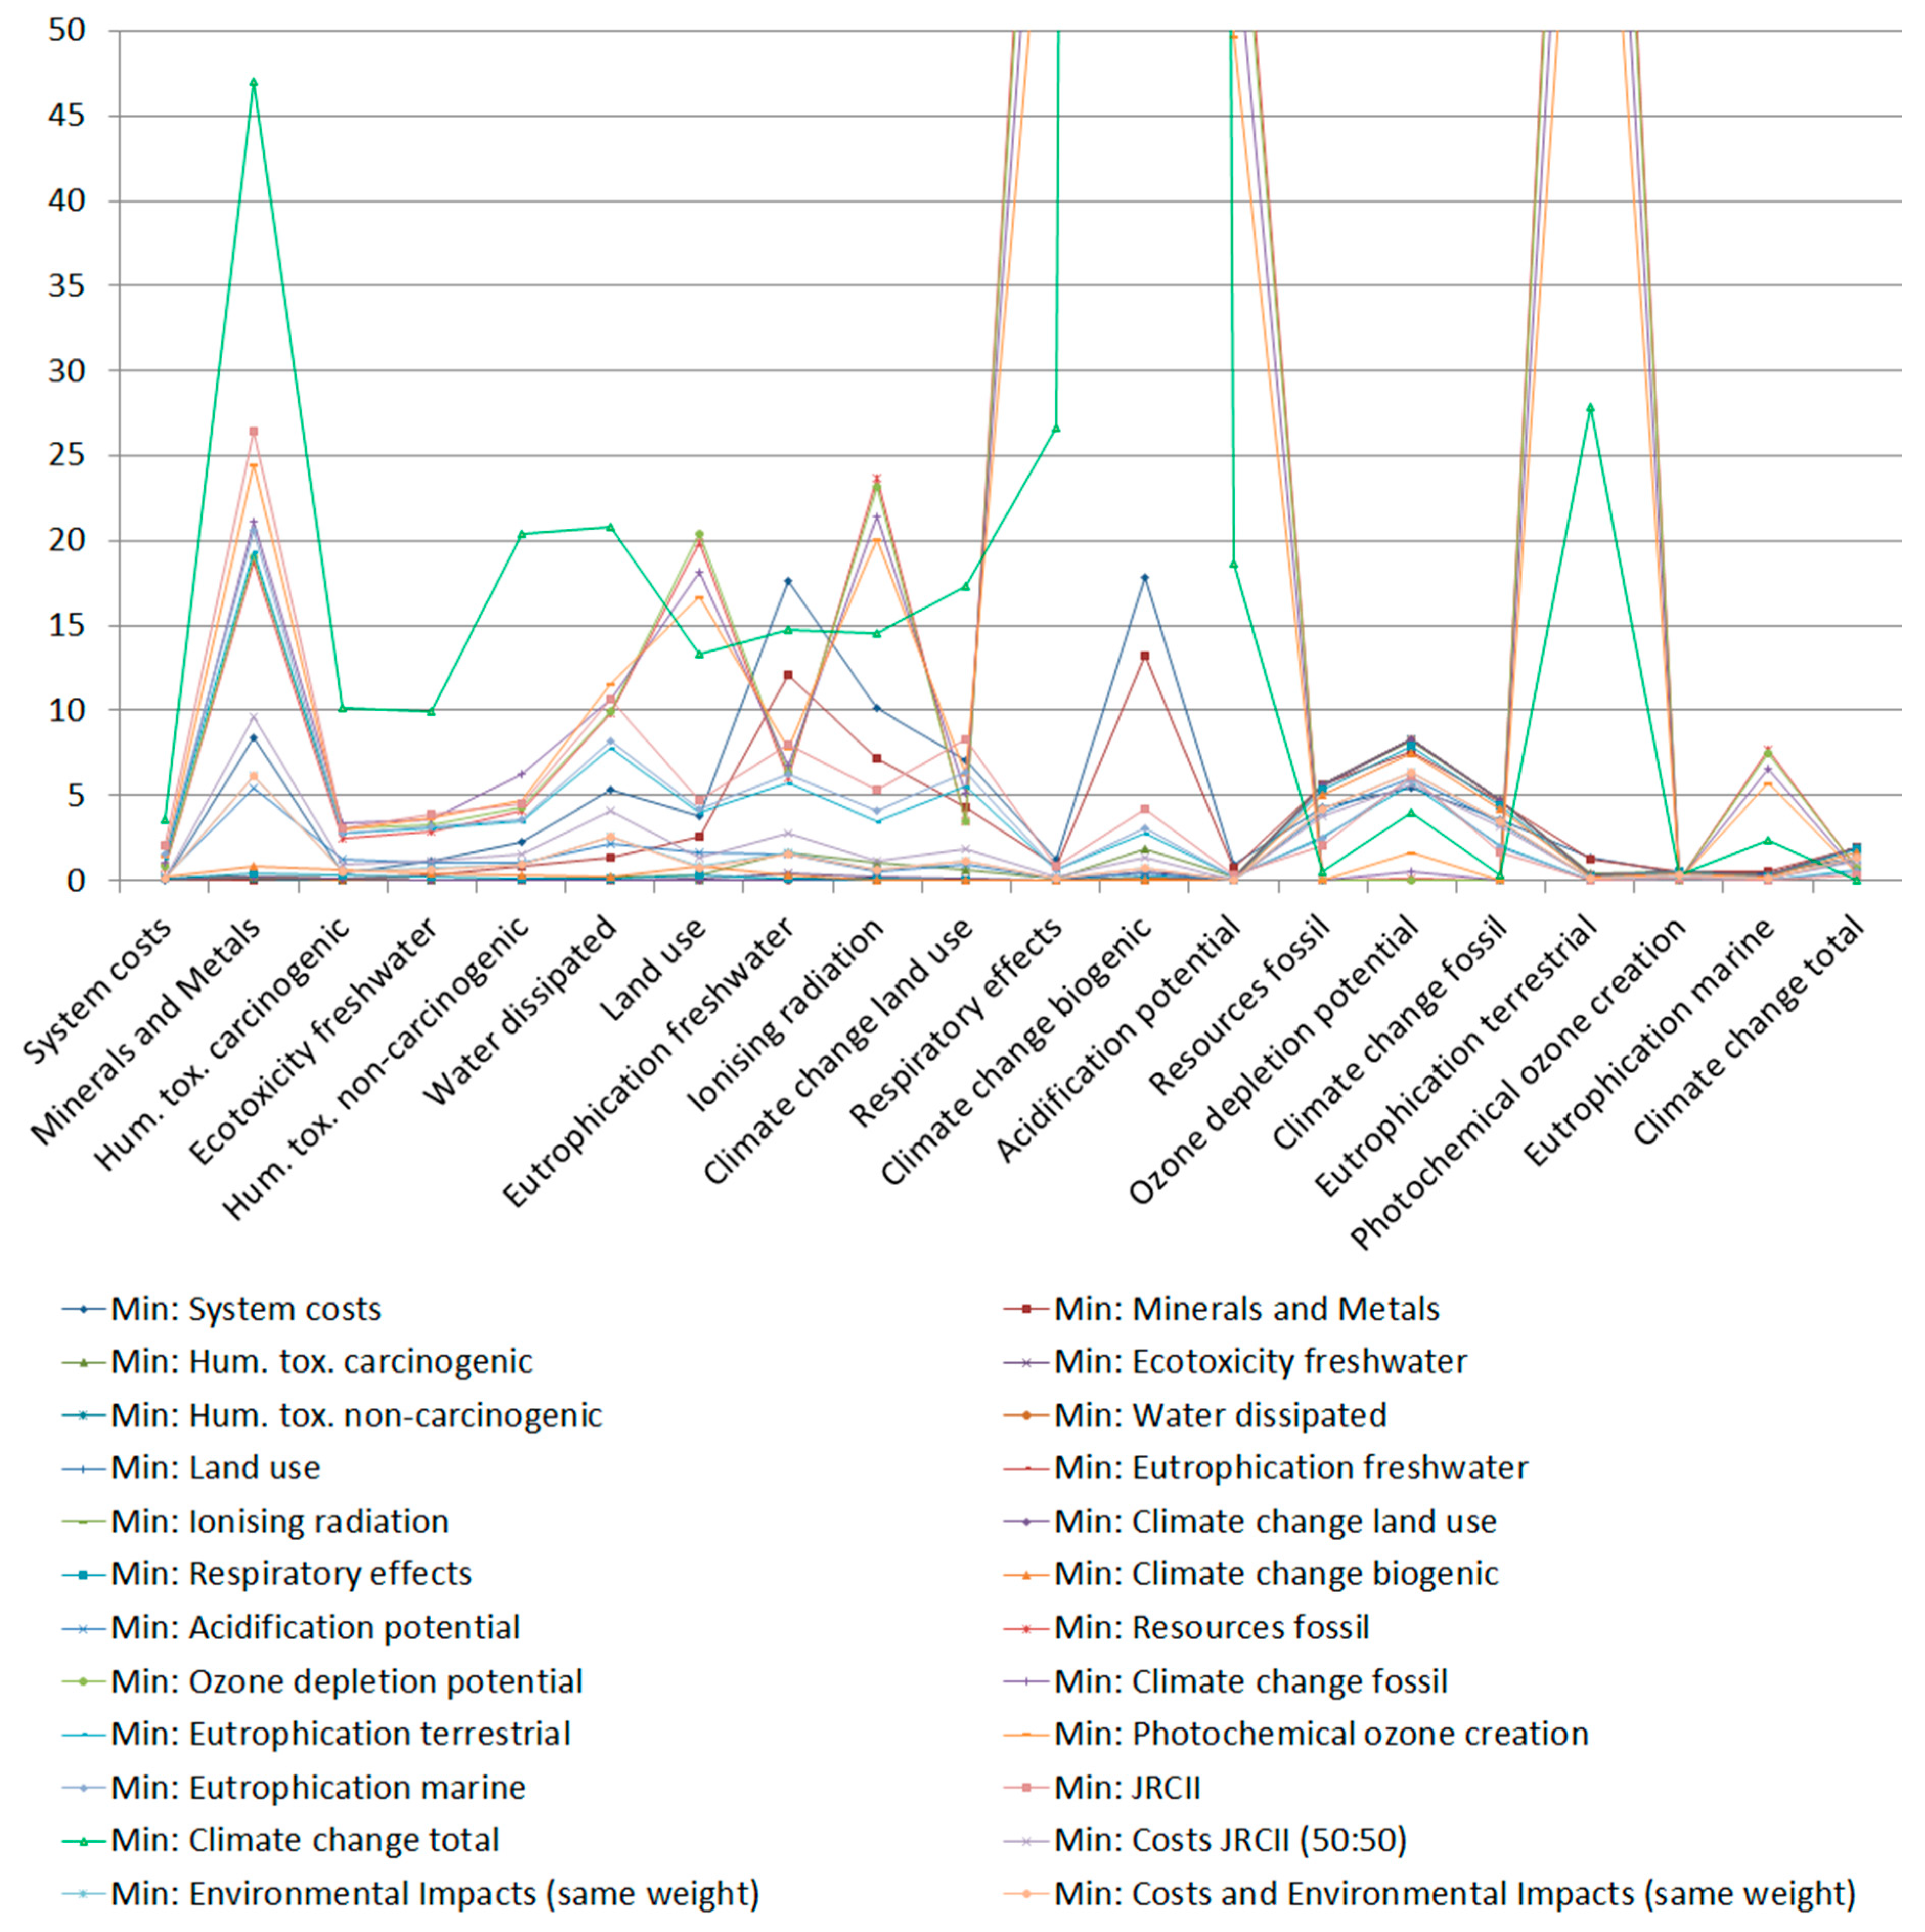
Exemplary results for the different optimisation targets in each calculation are shown in Figure 5. The results of all calculation runs are given in Figure A1 of Appendix B. For most criteria, the maximum normalised distance stays below 30. The criterion climate change total shows the smallest values of normalised distances of below 2 for all other optimisations. For the optimisation criteria climate change biogenic, respiratory effects, acidification potential, and terrestrial eutrophication extreme deviations (up to 3600) arise. The higher resource demand of renewables compared to fossil energy generators can be exemplary observed for the impact category minerals and metals, which has a relatively high distance in optimisation results preferring wind, PV and battery storage.
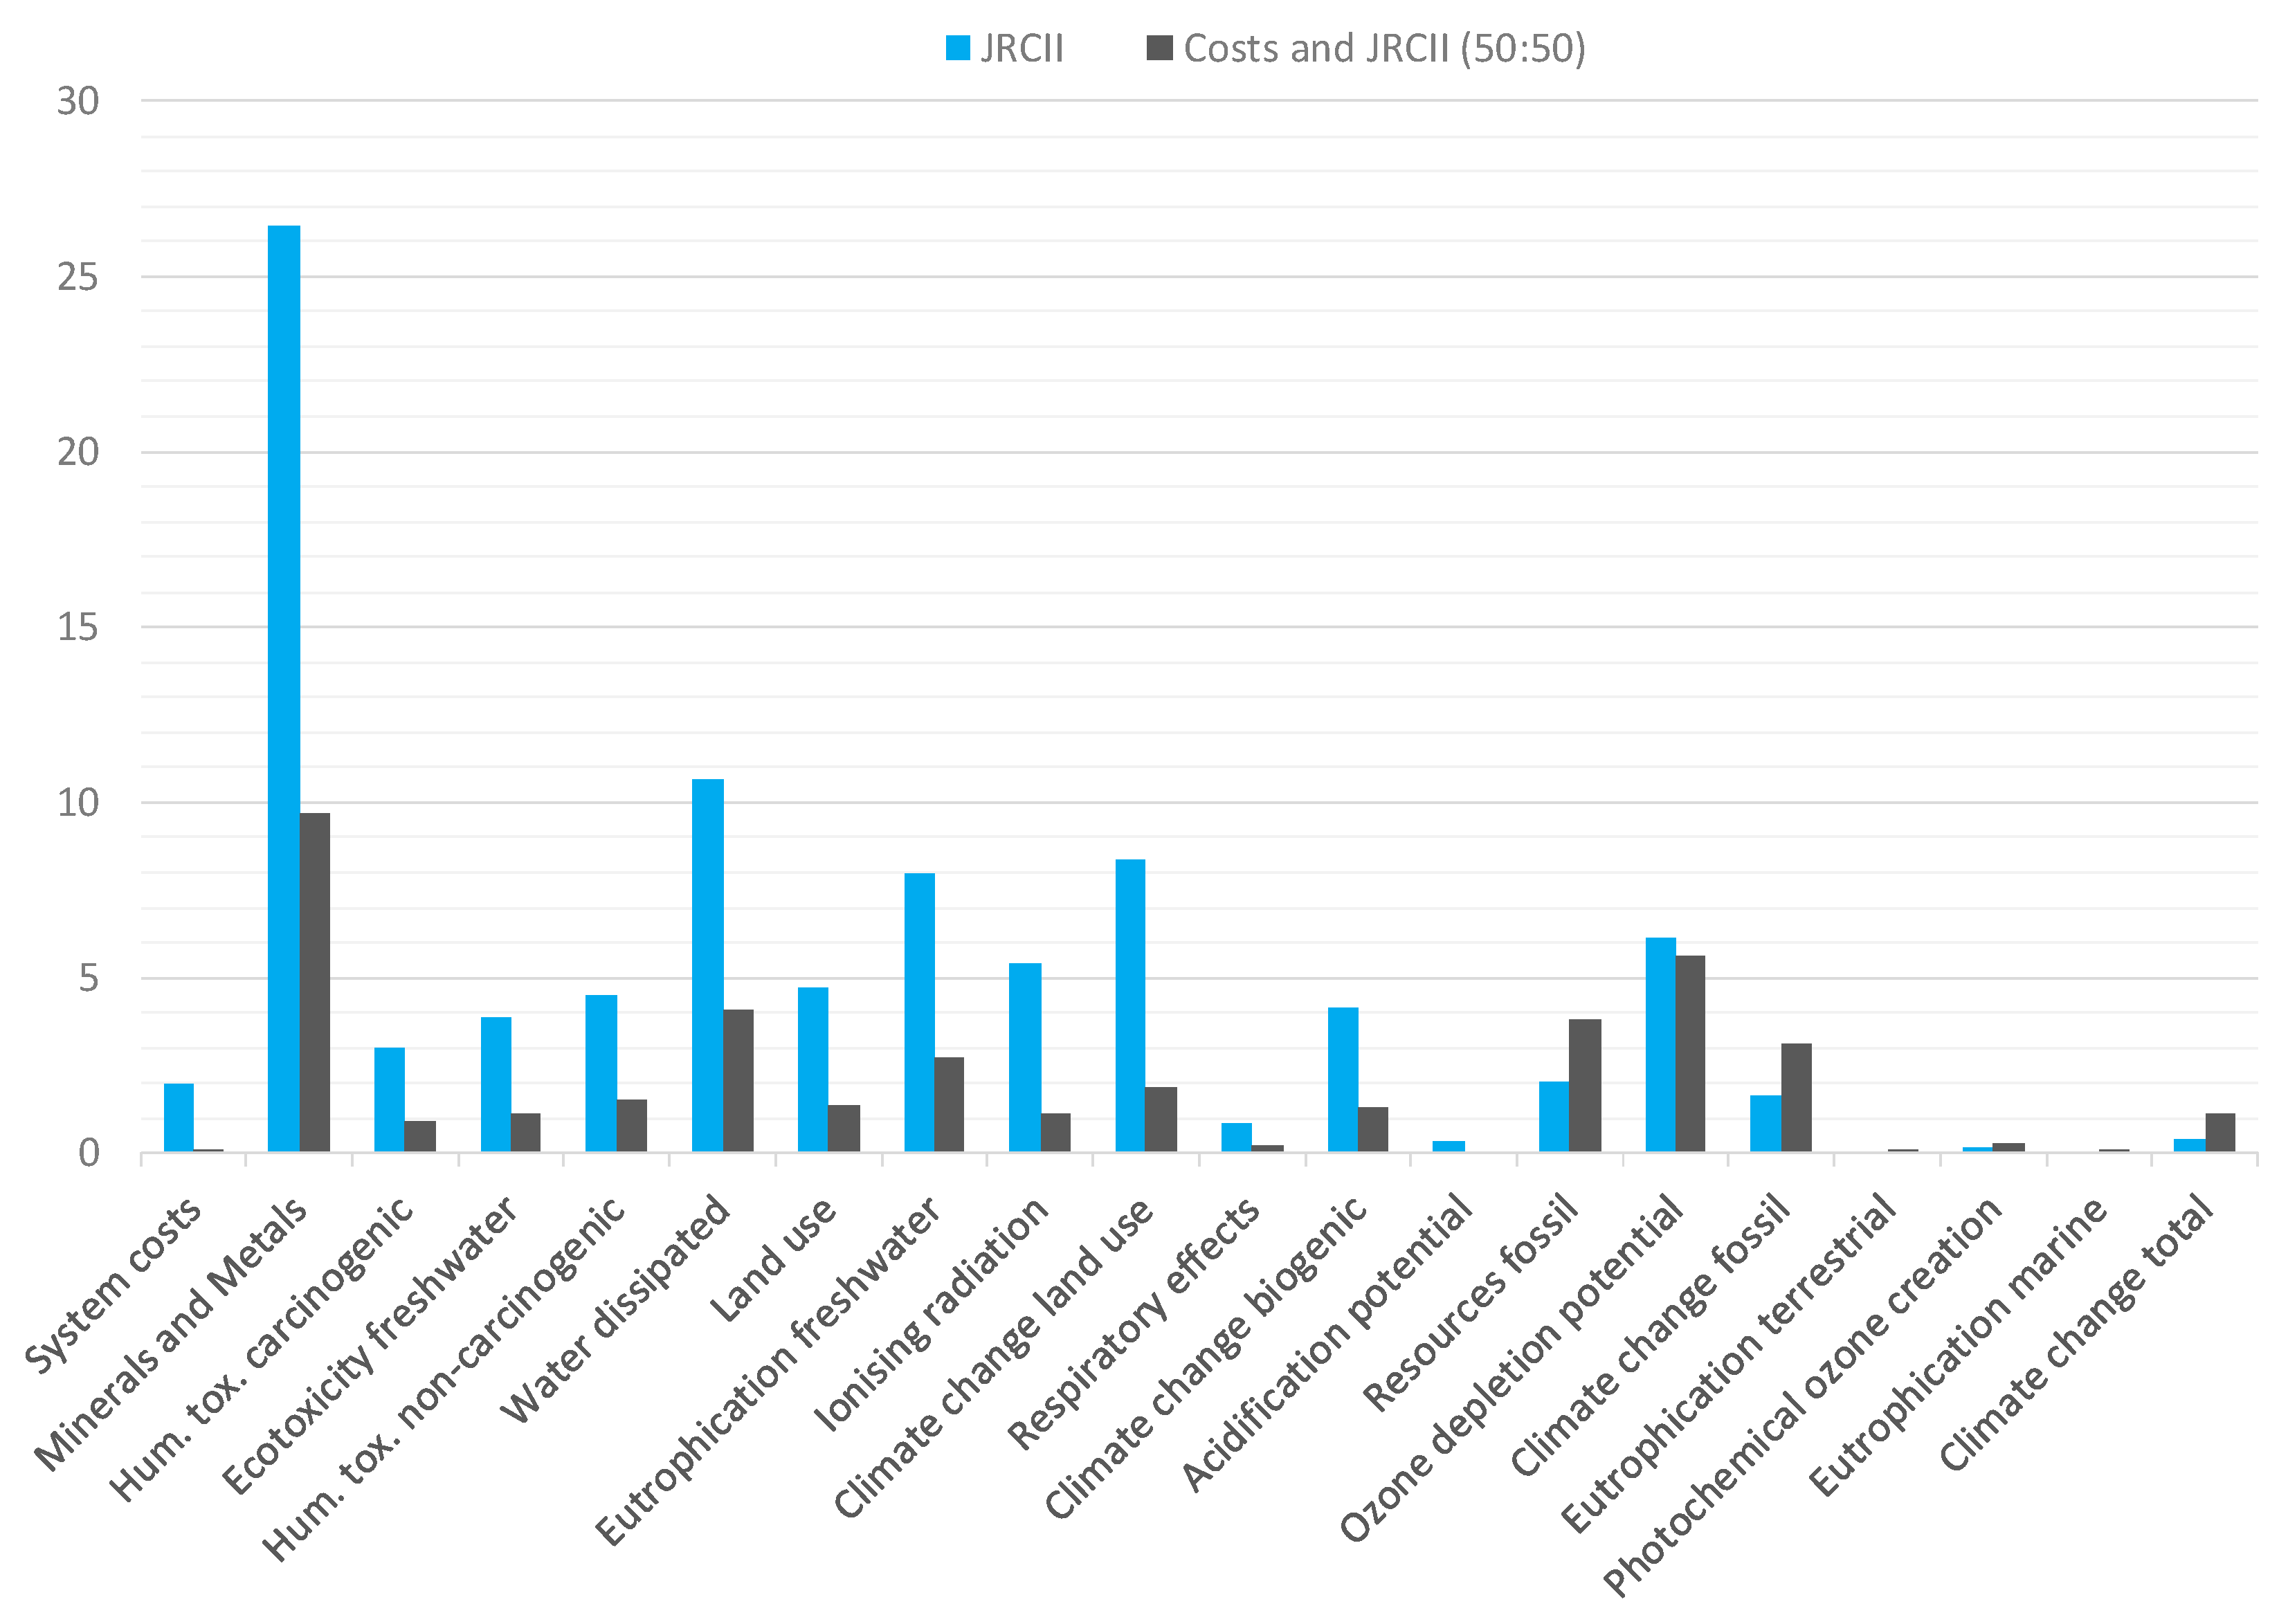
Energy systems with more balanced results for all optimisation criteria are possible as the normalised distances for the single criteria minimisation of land use and eutrophication freshwater (see Figure 5) and the multi-criteria optimisation JRCII as well as Costs and JRCII show (Figure 6). For most criteria, JRCII shows higher deviations than the combined optimisation for Costs and JRCII (50:50). The highest deviation occurs for both weightings in the impact category minerals and metals, indicating the resource needs for PV, wind and batteries. In general, it can be observed that the impact categories with high distances under the single-criterion optimisation are no longer showing outliers under the multi-criteria optimisations. This proves the benefits of multi-criteria optimisation as the overall environmental impact is taken into account.
3.3. Energy System and Trade-Offs Using Altered Weights
To analyse the influence of different weightings, LAEND permits for altering weights. In the following, we will at first use altered weights to derive deeper insight into the trade-offs before we analyse the impact of different weights on the resulting energy system.
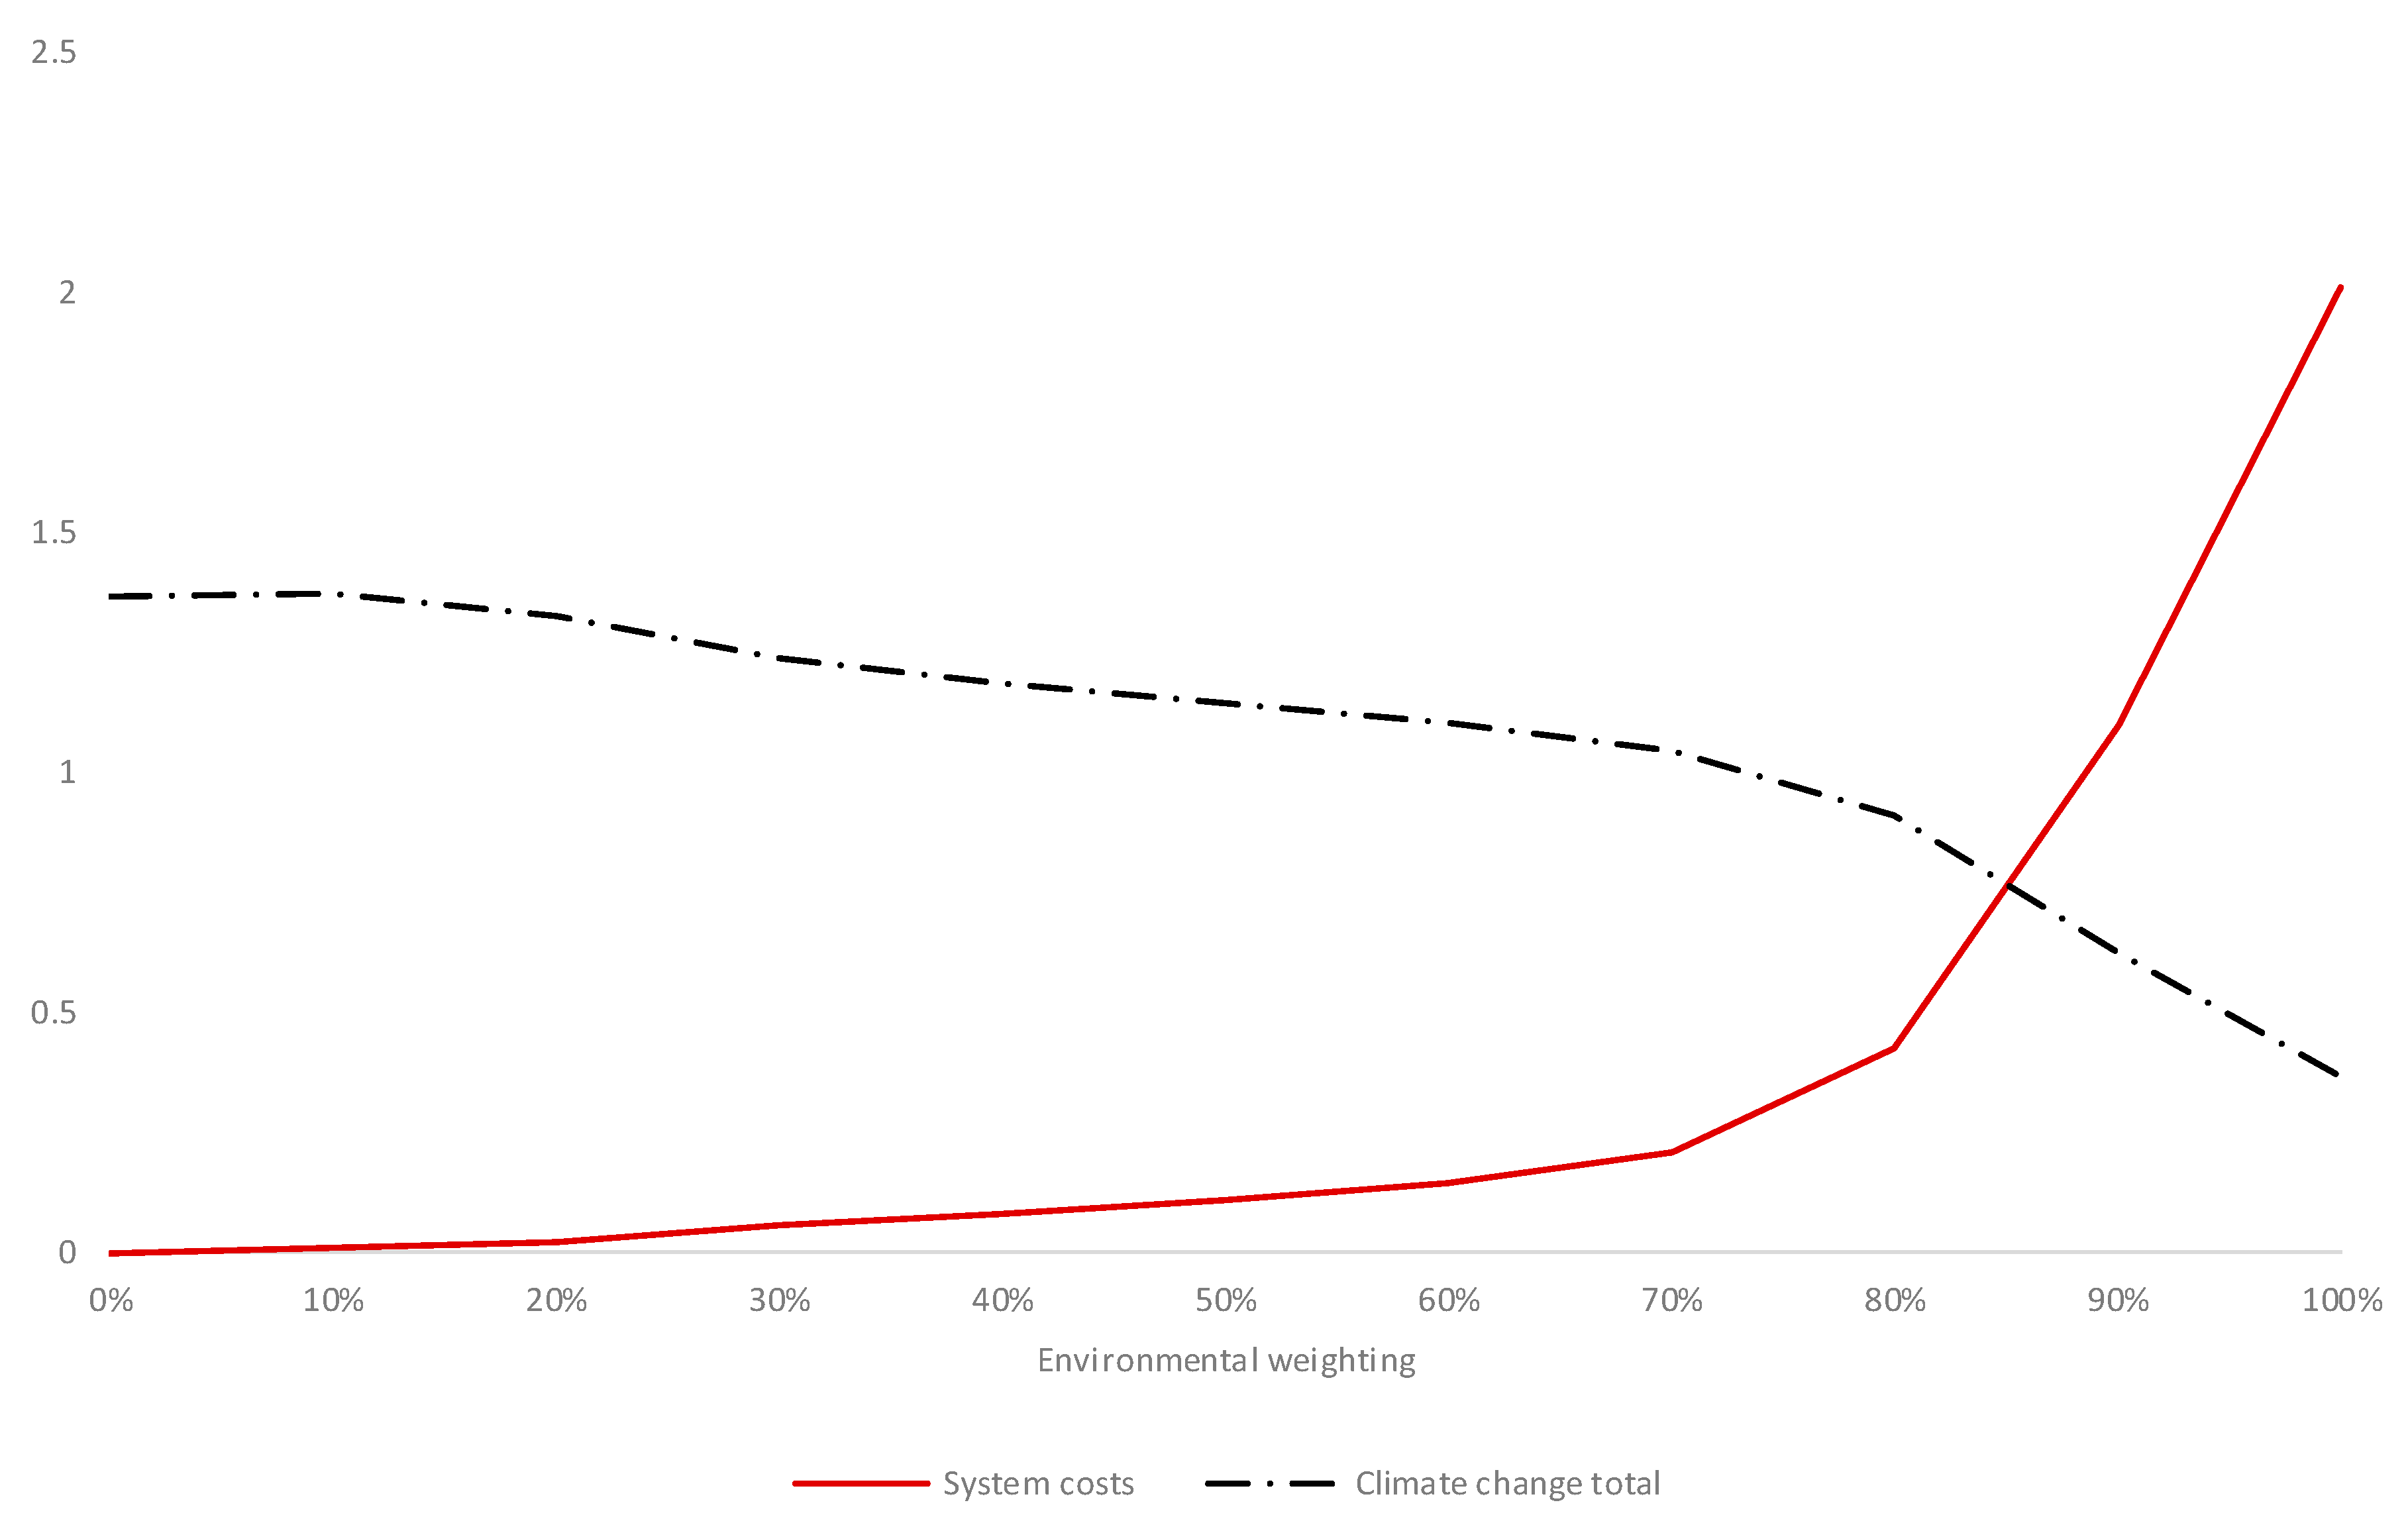
We stepwise alter the weight relation to gain a deeper understanding of the influence of the weights for costs compared to environmental impacts (0% environmental weight equals the single criterion optimisation for system costs, 100% the single criterion optimisation for JRCII). Figure 7 reveals the nearly linear increase of the system costs up to 70% environmental weighting followed by a steep acceleration in costs. Again, this cost increase is associated with higher total electricity generation (for details see Table A3 in Appendix B). In contrast, climate change total is slowly falling down to 80% environmental weighting where its decrease accelerates.
For other impact categories an almost parabolic trend can be seen in Figure 8 (so for the impact categories acidification, freshwater eutrophication, ionising radiation, human toxicity non-carcinogenic, respiratory effects, water dissipated and land use). Thus, we derive that due to the conflicts within the environmental goals, the minimum distance is not necessarily achieved at a hundred percent environmental weighting but for many impact categories at a weighting of about 50% as applied in the Costs and JRCII (50:50) optimisation.
Figure 9 and Table A4 in Appendix B show the results for the multi-criteria analyses of the above-described scenarios JRCII and Costs and JRCII (50:50) and for the following alternative weightings:
- all normalised environmental indicators have equal weights (1/16) (in analogy to the JRC weighting set climate change fossil, climate change land use and climate change biogenic are excluded to avoid double counting), the weight for system costs is set to zero (thus, optimisation only for environmental impacts), and
- all normalised environmental indicators and normalised total system costs are assigned the same weight (1/17).
In contrast to JRCII, the other three weighting sets lead to similar results: electricity generation from wind and PV, a small share of battery, and electricity generated from natural gas-fired CHP. The installed capacity, as well as the total electricity supply, is significantly higher for the minimisation of JRCII than for the other weightings. Thus, the possibility to perform sensitivity analyses for weighting factors is important as the resulting energy system might differ significantly. This is of special importance as for real-world applications a robust result regarding the technological choice is needed.
4. Limitations of the Study
The results presented in this article are subject to a set of assumptions and modelling choices. This leads to limitations of the study which are discussed in the following.
With regard to environmental performance, the choice of impact assessment methodology has a strong influence on the results. Impact assessment methodologies vary in terms of impact categories, applied indicators and calculation methods. The induced uncertainties differ between the impact categories but in general, the ecologic assessment rather provides trends than absolute results.
The assumptions on the future development of technologies are of major importance. Due to data availability, we apply current LCI data not considering future recycling of decommissioned generators. This discriminates resource-intense technologies like PV and batteries. Furthermore, there is the possibility that batteries are inserted into a second life cycle (cf. [52]). Sensitivity analyses regarding the development of different technologies are thus required to test the robustness of results. First, simplified analyses with LAEND showed that e.g., for batteries, tremendous changes to economic and environmental data are necessary to significantly alter the results (cf. [15]).
Model inputs such as load profiles for consumers are fixed for 30 years and PV generation profiles only vary for 10 years. This only reflects reality to a limited extent, as the future development of electricity consumption and its hourly distribution are unknown. In addition, battery modelling is subject to uncertainties, as battery aging depends on a variety of parameters and different battery models exist with different accuracy (cf. [53,54]).
Total electricity production differs between the optimisation objectives. Disadvantages for intermittent generators arise from the fact that the surplus electricity fed into the grid is fully attributed to the system under study. Future analyses shall tackle the question of how to account for surplus electricity in a decentralised surrounding.
Furthermore, the current (2012) grid mix with high shares of fossil energy is applied. This favours local electricity generation from renewables against grid electricity. Besides, the static use of current instead of time-dependent prospective production data for renewables disfavours renewable capacity. Consequently, overall lower total GHG emissions, than depicted in our results are likely. Altering the environmental impacts over time as described by Vandepaer et al. and García-Gusano et al. constitutes an approach to test for the influence of the future importance of climate change on the results and shall be applied for future studies (cf. [24,55]).
The results provided in this study show the biggest possible deviations as LAEND optimises free without restrictions for the different objectives. We expect a restriction forcing decarbonisation in the use phase (as policies in place demand) to smoothen the differences between the results for the different objectives. Furthermore, we intend to enlarge the approach to a combined modelling of heat and electricity to exploit the potentials for sector coupling. This will also increase the match of the results to the real world as the presented results need to be questioned, whether there is an actual demand for the heat produced in CHP at all time steps.
5. Conclusions
Our exemplary application of LAEND to a residential quarter leads to manifold and complex results. On the one hand, the analyses and communication of the results are thus challenging especially for the recommendation of actions. Nevertheless, this applies in general to multi-criteria decision making (e.g., cf. [14,22,26]). On the other hand, the transparent approach helps in understanding the relations and conflicts between different goals and assists in solving the complexity of future energy systems. A comprehensive target system provided by science and/or politics would ease this challenge.
As the data used for the system under study represent a simplified typical and not a real-world quarter, the presented results rather need to be seen in the context of the model development and not to derive immediate policy implications. The conflicts of goals we derive fit with the results of other studies in terms of indicating a high need for minerals and metals for energy systems with high shares of wind, PV and batteries (e.g., cf. [56,57,58]). Furthermore, investigating the underlying LCI datasets, we observe the shift of impact majorities from the operational to the production phase comparing renewable to fossil energy systems (as described in [14,24]). Hence, impact categories affiliated to the production processes show a high distance in the renewable dominated energy system results.
The comparison of the results for the single-criterion and multi-criteria optimisation allows in general for a deeper understanding of interdependencies. The results for the normalised distances prove the importance of multi-criteria approaches and reveal the conflicts of goals between the environmental indicators themselves. As agreed by scientists, all environmental impact categories need consideration and the multi-criteria optimisation provides for (more) balanced results and prevents from burden-shifting. The flexible weighting approach within LAEND allows for the consideration of individual preferences. This is relevant as depending on the location of the residential quarter, some impact categories might be more important than others (e.g., in special preserve areas). Furthermore, our results show the necessity of testing altered weightings regarding their impacts on the resulting electricity mix. Robust results are a prerequisite for long-term investment decisions.
Overall, LAEND fits well with the requirements of the electricity expansion planning for a residential quarter considering multi objectives. The observed shift of environmental impacts from the use phase to the production phase of the electricity generators for energy systems with high shares of renewables and storages, points to the importance of the integration of the entire life cycle. The consideration of a comprehensive set of environmental indicators and costs provides transparent and manifold results reflecting the complexity of real-world energy systems. Arising conflicts of goals can be identified and the relationship between different objectives derived. Thus, even though the communication of the manifold results is complex, the deeper insight assist in developing future energy systems with lower environmental impacts.
Supplementary Materials
The following are available online at https://www.mdpi.com/1996-1073/13/3/614/s1, LAEND source code.
Author Contributions
I.T. and L.L. contributed substantially to all sections. I.T. led introduction, methodology, discussion, conclusions and limitations, L.L. is responsible for the coding, led the results and contributed to the method development. H.H. contributed to the method description concerning environmental modelling and to writing the paper S.L. contributed to the modelling of battery storages and to writing the paper. I.T. managed the reviewing and editing process, contributed to the model implementation, initiated and supervised the research, and supported policy backgrounds. All authors have read and agreed to the published version of the manuscript.
Funding
This research received no external funding.
Conflicts of Interest
The authors declare no conflict of interest.
Appendix A

| Indicator | JRCII Weighting | JRCII Normalisation |
|---|---|---|
| Climate change biogenic | 0 | 1 |
| Climate change fossil | 0 | 1 |
| Climate change land use | 0 | 1 |
| Climate change total | 0.2106 | 5.34998 × 10¹³ |
| Acidification potential | 0.062 | 3.83 × 10¹¹ |
| Ecotoxicity freshwater | 0.0192 | 8.14693 × 10¹³ |
| Eutrophication freshwater | 0.028 | 17,600,000,000 |
| Eutrophication marine | 0.0296 | 1.95 × 10¹¹ |
| Eutrophication terrestrial | 0.0371 | 1.22 × 10¹² |
| Human toxicity carcinogenic | 0.0213 | 265,544.3645 |
| Ionising radiation | 0.0501 | 2.91018 × 10¹³ |
| Human toxicity non-carcinogenic | 0.0184 | 3,274,782.609 |
| Ozone depletion potential | 0.0631 | 161,052,494.6 |
| Photochemical ozone creation | 0.0478 | 2.8 × 10¹¹ |
| Respiratory effects | 0.0896 | 4,390,385.028 |
| Water dissipated | 0.0851 | 7.90869 × 10¹³ |
| Resources fossil | 0.0832 | 4.5 × 10¹⁴ |
| Land use | 0.0794 | 9.20229 × 10¹⁵ |
| Minerals and Metals | 0.0755 | 399,000,000 |
Table A2.
LCI datasets used for LAEND with adaptions and scaling factors to combine oemof values and LCI data.
Table A2.
LCI datasets used for LAEND with adaptions and scaling factors to combine oemof values and LCI data.
| Technology | Dataset Adaption | Process Name | Source | Dataset Unit | Scaling Factor LAEND |
|---|---|---|---|---|---|
| CHP biogas (CHPb) | Separation of input flows | biogas, burned in micro gas turbine 100 kWe [CH]–electricity, low voltage removed input flows: methane, 96% by volume, from biogas, low pressure, at user; micro gas turbine, 100 kW electrical; storage, 10,000 L | ei v3.5 | kWh | 1 |
| Scaling of separated input flow | methane production, 96% by volume, from biogas, from high pressure network, at service station [CH] | ei v3.5 | MJ | 1 kWh | |
| Scaling of separated input flow | micro gas turbine production, 100 kW electrical [CH] | ei v3.5 | unit | 1/100 kW/ 20 a | |
| Scaling of separated input flow | market for storage, 10,000 L [GLO] | ei v3.5 | unit | 1/100 kW/ 20 a | |
| CHP natural gas (CHPg) | Separation of input flows | natural gas, burned in micro gas turbine, 100 kWe [CH]–electricity, low voltage removed input flows: natural gas, low pressure; micro gas turbine, 100 kW electrical; storage, 10,000 L | ei v3.5 | kWh | 1 |
| Scaling of separated input flow | market for natural gas, low pressure [CH] | ei v3.5 | m−3 | 1/39 MJ m−3 kWh (39 MJ/m−3, ecoinvent inquiry) | |
| Scaling of separated input flow | micro gas turbine production, 100 kW electrical [CH] | ei v3.5 | unit | 1/100 kW/ 20 a | |
| Scaling of separated input flow | market for storage, 10,000 L [GLO] | ei v3.5 | unit | 1/100 kW/ 20 a | |
| PV | Separation of input flows | electricity, photovoltaic, 3 kWp slanted-roof installation, multi-Si [DE] removed input flow: photovoltaic flat-roof installation, 3 kWp, multi-Si, on roof | ei v3.5 | kWh | 1 |
| Scaling of separated input flow | photovoltaic, 3 kWp slanted-roof installation, multi-Si, on roof [DE] | ei v3.5 | unit | 1/3 kW/30 a | |
| Wind | Separation of input flows | electricity production, wind, <1 MW turbine, onshore [DE] removed input flows: wind power plant, 800 kW, fixed parts; wind power plant, 800 kW, moving parts | ei v3.5 | kWh | 1 |
| Scaling of separated input flow | market for wind power plant, 800 kW, fixed parts [GLO] | ei v3.5 | unit | 1/800 kW/ 20 a | |
| Scaling of separated input flow | market for wind power plant, 800 kW, moving parts [GLO] | ei v3.5 | unit | 1/800 kW/ 20 a | |
| Grid (Import) | Scaling | electricity, high voltage, production mix [DE] | ei v3.5 | kWh | 1/0.98 (efficiency low voltage) |
| LFP Battery | Scaling, efficiency adjustment | battery, Lithium-ion LFP-LTO | [47] * | kg | 1/0.0379 kWh0.9/15 a |
| VRF Battery | Scaling, efficiency adjustment | vanadium redox flow battery | [48] * | kg | 1/0.0194 kWh 0.75/15 a |
CH = Switzerland; DE = Germany; GLO = Global (Dataset geography according to the availability in the database); ei = ecoinvent. * Data for batteries from literature: We thankfully acknowledge the implementation of the data to the ecoinvent based openLCA datasets accomplished by Jens Buchgeister (Karlsruhe Institute for Technology, Germany).
Appendix B
Table A3.
Total electricity generation depending on environmental weighting.
| Environmental Weighting | Electricity Generation (MWh) |
|---|---|
| 0.0 | 22,381.77 |
| 0.1 | 22,514.79 |
| 0.2 | 22,619.05 |
| 0.3 | 22,724.41 |
| 0.4 | 22,880.13 |
| 0.5 | 23,070.91 |
| 0.6 | 23,316.54 |
| 0.7 | 23,572.06 |
| 0.8 | 23,965.22 |
| 0.9 | 24,697.52 |
| 1.0 | 25,456.47 |
Table A4.
Total electricity generation by technology for different multi-criteria optimisation goals.
Table A4.
Total electricity generation by technology for different multi-criteria optimisation goals.
| Electricity Generation (MWh) | |||||||
|---|---|---|---|---|---|---|---|
| Optimisation Objective | Sum (w/o Batteries) | Wind | PV | CHP Gas | CHP Biogas | Grid | Batteries |
| Min: Costs and environmental impacts (same weights) | 21,748.06 | 1302.90 | 3750.52 | 16,667.48 | 0 | 27.16 | 36.16 |
| Min: Environmental impacts (same weights) | 21,747.48 | 1416.69 | 3735.57 | 16,570.66 | 0 | 24.57 | 87.59 |
| Min: Costs and JRCII (50:50) | 23,070.91 | 2264.33 | 5900.84 | 14,832.79 | 0 | 72.95 | 50.85 |
| Min: JRCII | 25,456.47 | 4939.87 | 12,961.90 | 7553.31 | 0 | 1.39 | 17,573.82 |
Figure A1.
Normalised distances from optimum for the individual criterion depending on the objective function.
Figure A1.
Normalised distances from optimum for the individual criterion depending on the objective function.
References
- Tang, C.F.; Tan, B.W.; Ozturk, I. Energy consumption and economic growth in Vietnam. Renew. Sustain. Energy Rev. 2016, 54, 1506–1514. [Google Scholar] [CrossRef]
- Belke, A.; Dreger, C.; Haan, F.D. Energy Consumption and Economic Growth. New Insights into the Cointegration Relationship; RWI: Essen, Germany, 2010; ISBN 9783867882149. [Google Scholar]
- Wang, S.; Li, Q.; Fang, C.; Zhou, C. The relationship between economic growth, energy consumption, and CO2 emissions: Empirical evidence from China. Sci. Total Environ. 2016, 542, 360–371. [Google Scholar] [CrossRef]
- IPCC. Climate Change 2014: Mitigation of Climate Change; Cambridge University Press: NewYork, NY, USA, 2014. [Google Scholar]
- Von Hirschhausen, C.; Gerbaulet, C.; Kemfert, C.; Reitz, F.; Ziehm, C. German nuclear phase-out enters the next stage: Electricity supply remains secure—Major challenges and high costs for dismantling and final waste disposal. DIW Econ. Bull. 2015, 5, 293–301. [Google Scholar]
- Goldemberg, J.; Johansson, T.B.; Anderson, D. World Energy Assessment. Overview: 2004 Update; United Nations Development Programme, Bureau for Development Policy: New York, NY, USA, 2004; ISBN 9789211261677. [Google Scholar]
- Heinrich-Böll-Stiftung; Green European Foundation; European Renewable Energy Federation; Le Monde Diplomatique. Energieatlas 2018; Heinrich-Böll-Stiftung: Berlin, Germany, 2018. [Google Scholar]
- McKenna, R.; Bertsch, V.; Mainzer, K.; Fichtner, W. Combining local preferences with multi-criteria decision analysis and linear optimization to develop feasible energy concepts in small communities. Eur. J. Oper. Res. 2018, 268, 1092–1110. [Google Scholar] [CrossRef]
- Zahedi, A. A review of drivers, benefits, and challenges in integrating renewable energy sources into electricity grid. Renew. Sustain. Energy Rev. 2011, 15, 4775–4779. [Google Scholar] [CrossRef]
- Fthenakis, V.; Kim, H.C. Land use and electricity generation: A life-cycle analysis. Renew. Sustain. Energy Rev. 2009, 13, 1465–1474. [Google Scholar] [CrossRef] [Green Version]
- Gagnon, L.; Bélanger, C.; Uchiyama, Y. Life-cycle assessment of electricity generation options: The status of research in year 2001. Energy Policy 2002, 30, 1267–1278. [Google Scholar] [CrossRef]
- Immendoerfer, A.; Tietze, I.; Hottenroth, H.; Viere, T. Life-cycle impacts of pumped hydropower storage and battery storage. Int. J. Energy Environ. Eng. 2017, 49, 4825. [Google Scholar] [CrossRef] [Green Version]
- Pehnt, M. Dynamic life cycle assessment (LCA) of renewable energy technologies. Renew. Energy 2006, 31, 55–71. [Google Scholar] [CrossRef]
- Rauner, S.; Budzinski, M. Holistic energy system modeling combining multi-objective optimization and life cycle assessment. Environ. Res. Lett. 2017, 12, 124005. [Google Scholar] [CrossRef]
- Lazar, L.; Tietze, I. Integrating energy system modelling and life cycle assessment for both cost and environmental optimisation of a decentralised regional energy system. In Proceedings of the Energy Challenges for the Next Decade, 16th IAEE European Conference, Ljubljana, Slovenia, 25–28 August 2019. [Google Scholar]
- Ringkjøb, H.-K.; Haugan, P.M.; Solbrekke, I.M. A review of modelling tools for energy and electricity systems with large shares of variable renewables. Renew. Sustain. Energy Rev. 2018, 96, 440–459. [Google Scholar] [CrossRef]
- Meyer, D.E.; Upadhyayula, V.K.K. The use of life cycle tools to support decision making for sustainable nanotechnologies. Clean Technol. Environ. Policy 2014, 16, 757–772. [Google Scholar] [CrossRef]
- Maxim, A. Sustainability assessment of electricity generation technologies using weighted multi-criteria decision analysis. Energy Policy 2014, 65, 284–297. [Google Scholar] [CrossRef]
- Kigle, S.; Pichlmaier, S.; Huber, J.; Regett, A. Ökobilanzen strombasierter synthetischer Kraftstoffe: Worauf es ankommt. EW 2019, 2019, 18–23. [Google Scholar]
- Yilmaz, O.; Anctil, A.; Karanfil, T. LCA as a decision support tool for evaluation of best available techniques (BATs) for cleaner production of iron casting. J. Clean. Prod. 2015, 105, 337–347. [Google Scholar] [CrossRef]
- Li, C.; Wang, N.; Zhang, H.; Liu, Q.; Chai, Y.; Shen, X.; Yang, Z.; Yang, Y. Environmental impact evaluation of distributed renewable energy system based on life cycle assessment and fuzzy rough sets. Energies 2019, 12, 4214. [Google Scholar] [CrossRef] [Green Version]
- Azapagic, A.; Stamford, L.; Youds, L.; Barteczko-Hibbert, C. Towards sustainable production and consumption: A novel decision-support framework integrating economic, environmental and social sustainability (DESIRES). Comput. Chem. Eng. 2016, 91, 93–103. [Google Scholar] [CrossRef]
- Su, M.; Chen, C.; Yang, Z. Urban energy structure optimization at the sector scale: Considering environmental impact based on life cycle assessment. J. Clean. Prod. 2016, 112, 1464–1474. [Google Scholar] [CrossRef]
- García-Gusano, D.; Garraín, D.; Dufour, J. Prospective life cycle assessment of the Spanish electricity production. Renew. Sustain. Energy Rev. 2017, 75, 21–34. [Google Scholar] [CrossRef]
- García-Gusano, D.; Iribarren, D.; Martín-Gamboa, M.; Dufour, J.; Espegren, K.; Lind, A. Integration of life-cycle indicators into energy optimisation models: The case study of power generation in Norway. J. Clean. Prod. 2016, 112, 2693–2696. [Google Scholar] [CrossRef] [Green Version]
- Vandepaer, L.; Cloutier, J.; Bauer, C.; Amor, B. Integrating batteries in the future Swiss electricity supply system: A consequential environmental assessment. J. Ind. Ecol. 2019, 23, 709–725. [Google Scholar] [CrossRef]
- Hilpert, S.; Kaldemeyer, C.; Krien, U.; Günther, S.; Wingenbach, C.; Plessmann, G. The open energy modelling framework (OEMOF)—A new approach to facilitate open science in energy system modelling. Energy Strategy Rev. 2018, 22, 16–25. [Google Scholar] [CrossRef] [Green Version]
- Ciroth, A.; Di Noi, C.l.; Lohse, T.; Srocka, M. openLCA 1.9 Comprehensive User Manual; GreenDelta GmbH: Berlin, Germany, 2019. [Google Scholar]
- Wernet, G.; Bauer, C.; Steubing, B.; Reinhard, J.; Moreno-Ruiz, E.; Weidema, B. The ecoinvent database version 3 (part I): Overview and methodology. Int. J. Life Cycle Assess. 2016, 21, 1218–1230. [Google Scholar] [CrossRef]
- Icons8 LLC. Free Icons. Available online: https://icons8.com/icons (accessed on 14 May 2019).
- International Organization for Standardization. Environmental Management—Life Cycle Assessment—Requirements and Guidelines; ISO 14044:2006; ISO: Geneva, Switzerland, 2006. [Google Scholar]
- International Organization for Standardization. Environmental Management—Life Cycle Assessment—Principles and Framework; ISO 14040:2006; ISO: Geneva, Switzerland, 2006. [Google Scholar]
- European Commission, Joint Research Centre. Reference Life Cycle Data System (ILCD) Handbook—General Guide for Life Cycle Assessment—Detailed Guidance; Publications Office of the European Union: Luxembourg, 2010. [Google Scholar]
- Fazio, S.; Castellani, V.; Sala, S.; Schau, E.M.; Secchi, M.; Zampori, L.; Diaconu, E. Supporting Information to the Characterisation Factors of Recommended EF Life Cycle Impact Assessment Method: New Models and Differences with ILCD; Publications Office of the European Union: Luxembourg, 2018. [Google Scholar]
- PyPi. olca-ipc 0.0.7. Available online: https://pypi.org/project/olca-ipc/ (accessed on 13 May 2019).
- Sala, S.; Crenna, E.; Secchi, M.; Pant, R. Global Normalisation Factors for the Environmental Footprint and Life Cycle Assessment; Publications Office of the European Union: Luxembourg, 2017. [Google Scholar]
- Huppes, G.; van Oers, L. Evaluation of Weighting Methods for Measuring the EU-27 Overall Environmental Impact; Publications Office of the European Union: Luxembourg, 2011. [Google Scholar]
- Peters, J.F.; Weil, M. Providing a common base for life cycle assessments of Li-Ion batteries. J. Clean. Prod. 2018, 171, 704–713. [Google Scholar] [CrossRef]
- Weber, S.; Peters, J.F.; Baumann, M.; Weil, M. Life cycle assessment of a vanadium redox flow battery. Environ. Sci. Technol. 2018, 52, 10864–10873. [Google Scholar] [CrossRef] [PubMed]
- Fraunhofer ISE. Energy Charts. 2019. Available online: https://www.energy-charts.de (accessed on 10 December 2018).
- Bundesnetzagentur. Biogas—Monitoringbericht 2014: Bericht der Bundesnetzagentur über die Auswirkungen der Sonderregelungen für die Einspeisung von Biogas in das Erdgasnetz; Bundesnetzagentur: Bonn, Germany, 2014.
- Bundesnetzagentur. Monitoringbericht 2017; Bundesnetzagentur: Bonn, Germany, 2017.
- Klein, C.; Rozanski, K.; Gailfuß, M.; Kukuk, J.; Beck, T. BHKW-Kenndaten 2014/2015: Module, Anbieter, Kosten; ASUE: Berlin, Germany, 2014. [Google Scholar]
- Wirth, H. Aktuelle Fakten zur Photovoltaik in Deutschland. Fassung vom 18.03.2019; Fraunhofer ISE: Freiburg, Germany, 2019. [Google Scholar]
- European Commission. Photovoltaic Geographical Information System (PVGIS). Available online: http://re.jrc.ec.europa.eu/pvg_tools/en/tools.html#PVP (accessed on 13 May 2019).
- IRENA. Renewable Power Generation Costs in 2017; International Renewable Energy Agency: Abu Dhabi, UAE, 2018. [Google Scholar]
- Baumann, M.; Peters, J.; Weil, M. Ökologische und ökonomische Performance stationärer Li-ion-Batteriespeicher. In Proceedings of the 15. Symposium Energieinnovation, Gratz, Austria, 14–16 February 2018. [Google Scholar]
- Peters, J.; Baumann, M.; Zimmermann, B.; Braun, J.; Weil, M. The environmental impact of Li-Ion batteries and the role of key parameters—A review. Renew. Sustain. Energy Rev. 2017, 67, 491–506. [Google Scholar] [CrossRef]
- Tajden, T.; Bergner, J.; Weniger, J.; Quaschning, V. Representative Electrical Load Profiles of Residential Buildings in Germany with a Temporal Resolution of One Second; HTW Berlin—University of Applied Sciences: Berlin, Germany, 2015. [Google Scholar]
- DWD. Climate Data Center. Available online: https://cdc.dwd.de/portal/201809260905/index.html (accessed on 13 May 2019).
- Wikner, E.; Thiringer, T. Extending battery lifetime by avoiding high SOC. Appl. Sci. 2018, 8, 1825. [Google Scholar] [CrossRef] [Green Version]
- Bobba, S.; Mathieux, F.; Ardente, F.; Blengini, G.A.; Cusenza, M.A.; Podias, A.; Pfrang, A. Life cycle assessment of repurposed electric vehicle batteries: An adapted method based on modelling energy flows. J. Energy Storage 2018, 19, 213–225. [Google Scholar] [CrossRef]
- Jongerden, M.R.; Haverkort, B.R. Battery aging, battery charging and the kinetic battery model: A first exploration. In Proceedings of the Quantitative Evaluation of Systems: 14th International Conference, QEST 2017, Berlin, Germany, 5–7 September 2017; pp. 88–103, ISBN 9783319663357. [Google Scholar]
- Barcellona, S.; Piegari, L. Lithium ion battery models and parameter identification techniques. Energies 2017, 10, 2007. [Google Scholar] [CrossRef] [Green Version]
- Vandepaer, L.; Treyer, K.; Mutel, C.; Bauer, C.; Amor, B. The integration of long-term marginal electricity supply mixes in the ecoinvent consequential database version 3.4 and examination of modeling choices. Int. J. Life Cycle Assess. 2019, 24, 1409–1428. [Google Scholar] [CrossRef] [Green Version]
- Deetman, S.; Pauliuk, S.; van Vuuren, D.P.; van der Voet, E.; Tukker, A. Scenarios for demand growth of metals in electricity generation technologies, cars, and electronic appliances. Environ. Sci. Technol. 2018, 52, 4950–4959. [Google Scholar] [CrossRef] [PubMed] [Green Version]
- Hertwich, E.G.; Gibon, T.; Bouman, E.A.; Arvesen, A.; Suh, S.; Heath, G.A.; Bergesen, J.D.; Ramirez, A.; Vega, M.I.; Shi, L. Integrated life-cycle assessment of electricity-supply scenarios confirms global environmental benefit of low-carbon technologies. Proc. Natl. Acad. Sci. USA 2015, 112, 6277–6282. [Google Scholar] [CrossRef] [PubMed] [Green Version]
- Lieberei, J.; Gheewala, S.H. Resource depletion assessment of renewable electricity generation technologies—Comparison of life cycle impact assessment methods with focus on mineral resources. Int. J. Life Cycle Assess. 2017, 22, 185–198. [Google Scholar] [CrossRef]
Figure 1.
Schematic illustration of an energy system represented as an open-source energy system modelling framework oemof network [27].
Figure 1.
Schematic illustration of an energy system represented as an open-source energy system modelling framework oemof network [27].

Figure 2.
Structure and objectives of the model LAEND. Source: authors’ illustration (icons from [30]).
Figure 2.
Structure and objectives of the model LAEND. Source: authors’ illustration (icons from [30]).

Figure 3.
Optimum energy mix 2050 (bars), system costs (red line) and climate change (black line) for different optimisation goals.
Figure 3.
Optimum energy mix 2050 (bars), system costs (red line) and climate change (black line) for different optimisation goals.
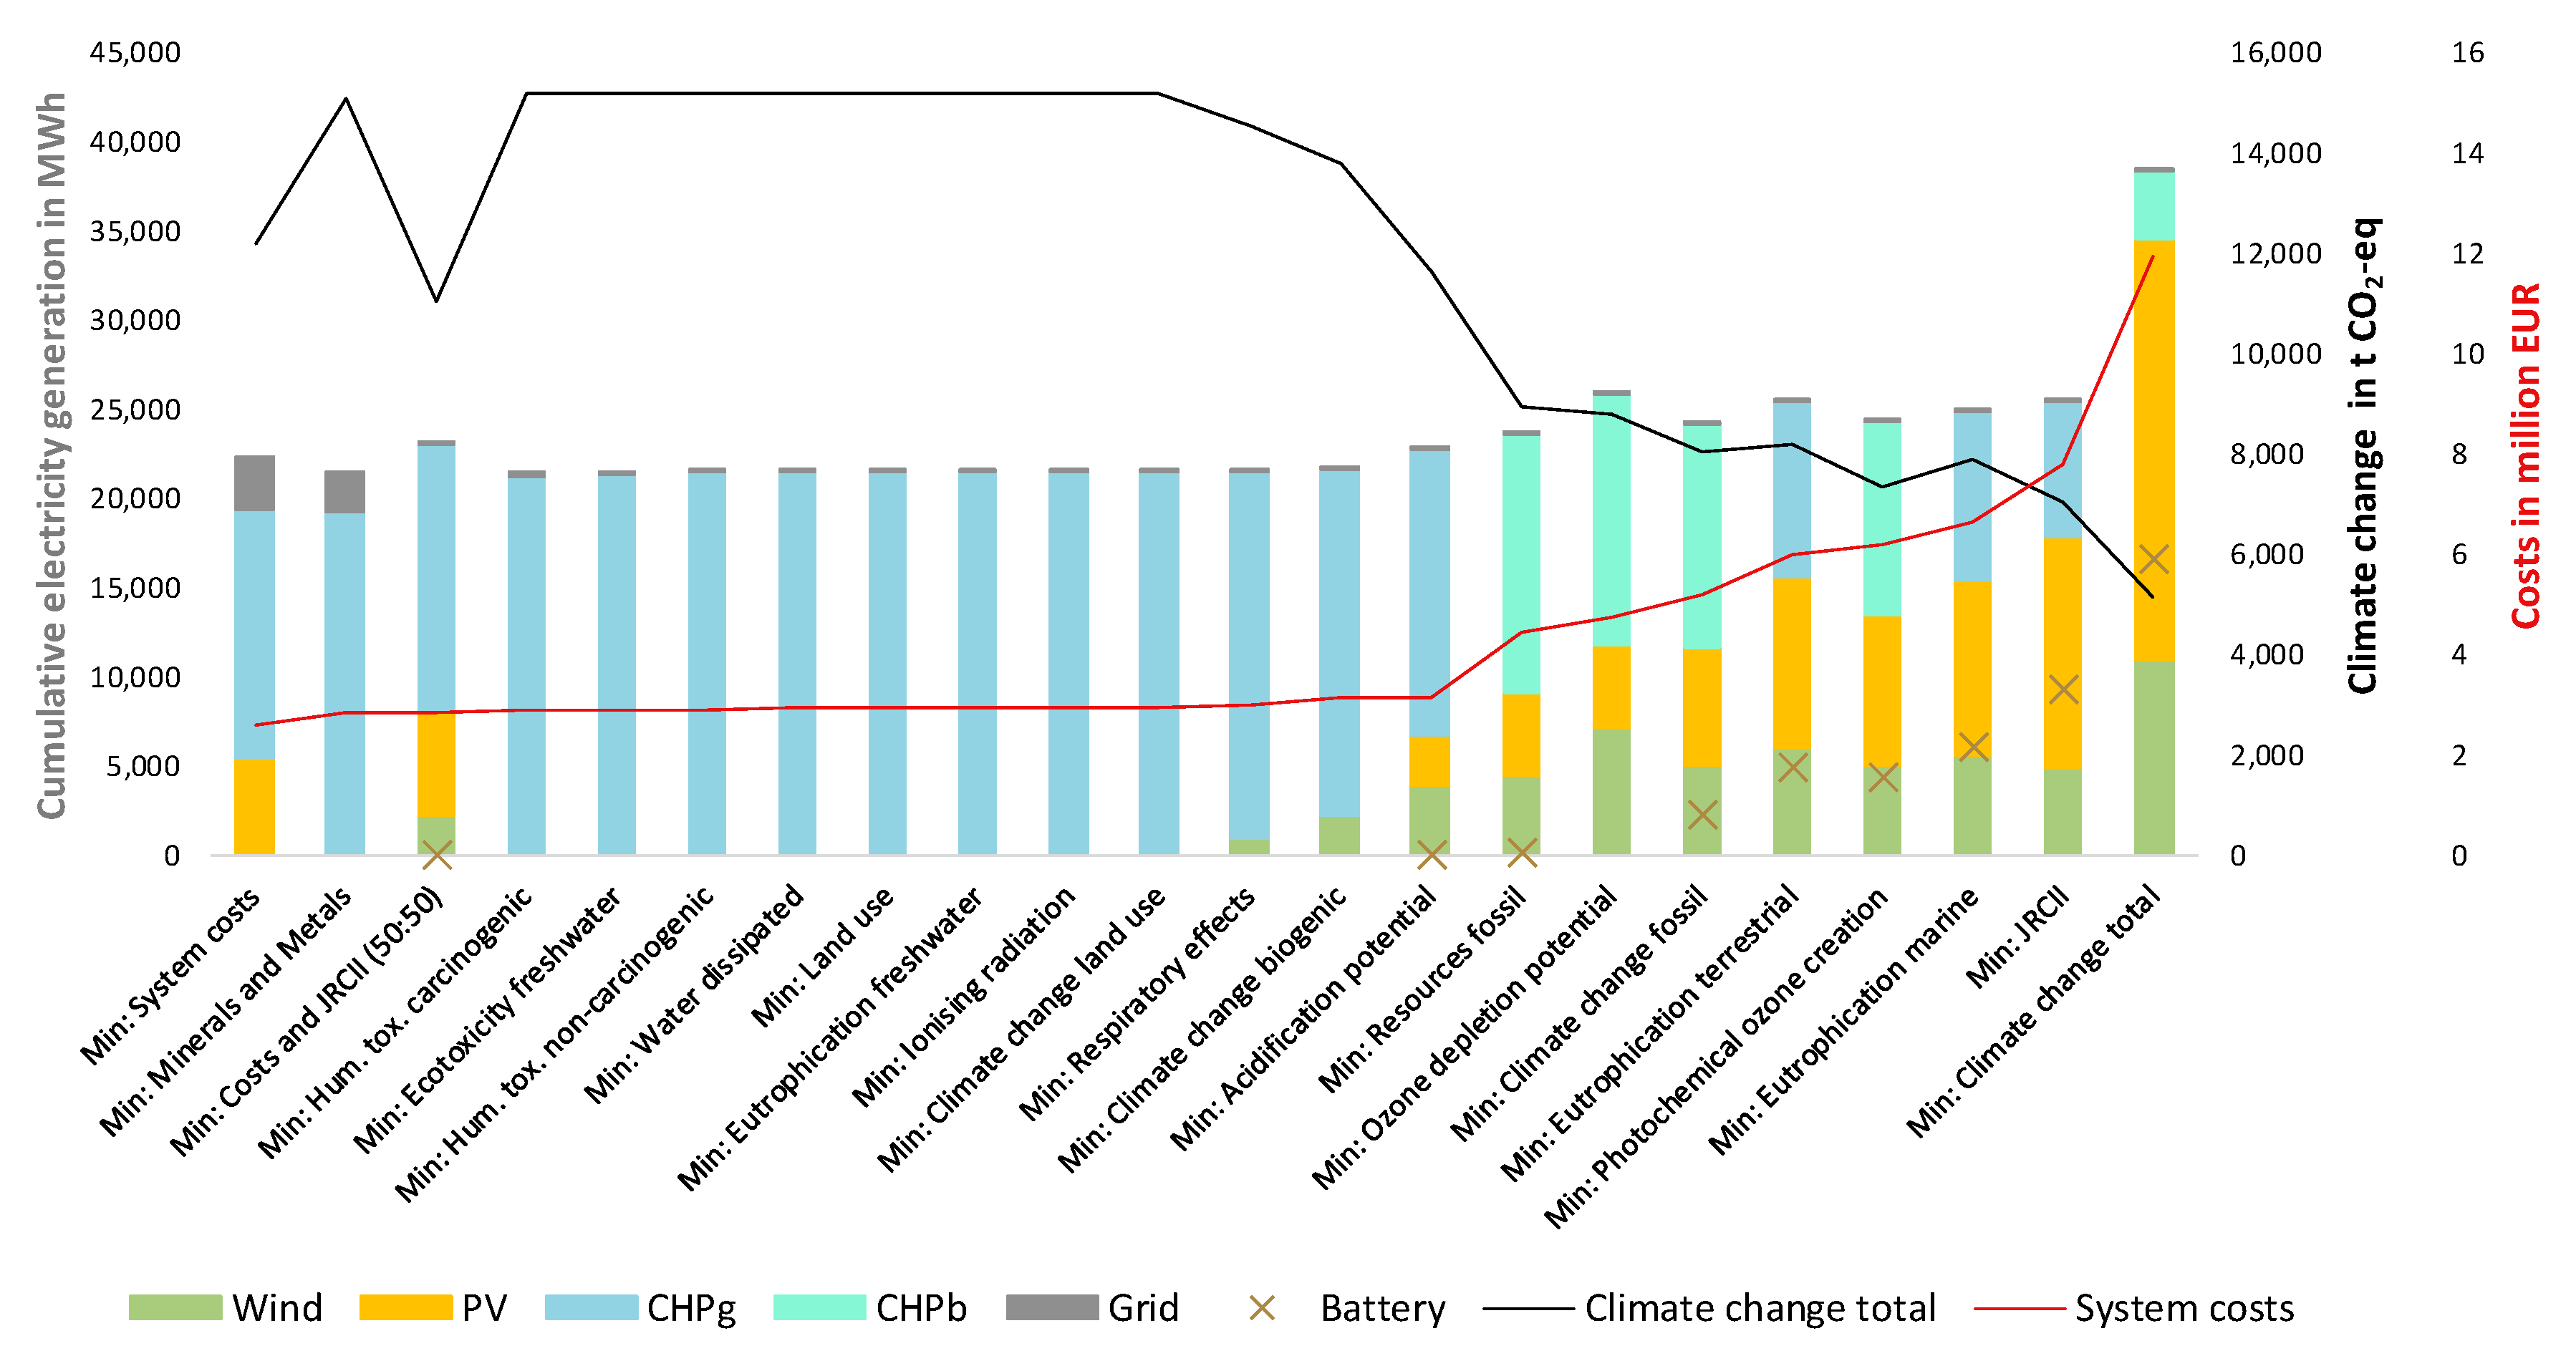
Figure 4.
Total installed capacity from 2020 to 2050.

Figure 5.
Normalised distances from optimum for the individual criterion of selected objective functions (selection of optimisation runs with the two highest (min: Ozone depletion potential, min: Eutrophication freshwater, lowest (min: Acidification potential, min: Environmental Impacts (same weight) and medium (min: Land use, min: Eutrophication freshwater) standard deviations of normalised distances of all indicators).

Figure 6.
Normalised distance from the minimum for each single optimisation objective under multi-objective optimisation.
Figure 6.
Normalised distance from the minimum for each single optimisation objective under multi-objective optimisation.

Figure 7.
Normalised distance from minimum in the categories system costs and climate change total in dependence of the total environmental weighting compared to costs.
Figure 7.
Normalised distance from minimum in the categories system costs and climate change total in dependence of the total environmental weighting compared to costs.

Figure 8.
Normalised distance from minimum for environmental impact categories in dependence of the total environmental weighting compared to costs (logarithmic scale).
Figure 8.
Normalised distance from minimum for environmental impact categories in dependence of the total environmental weighting compared to costs (logarithmic scale).
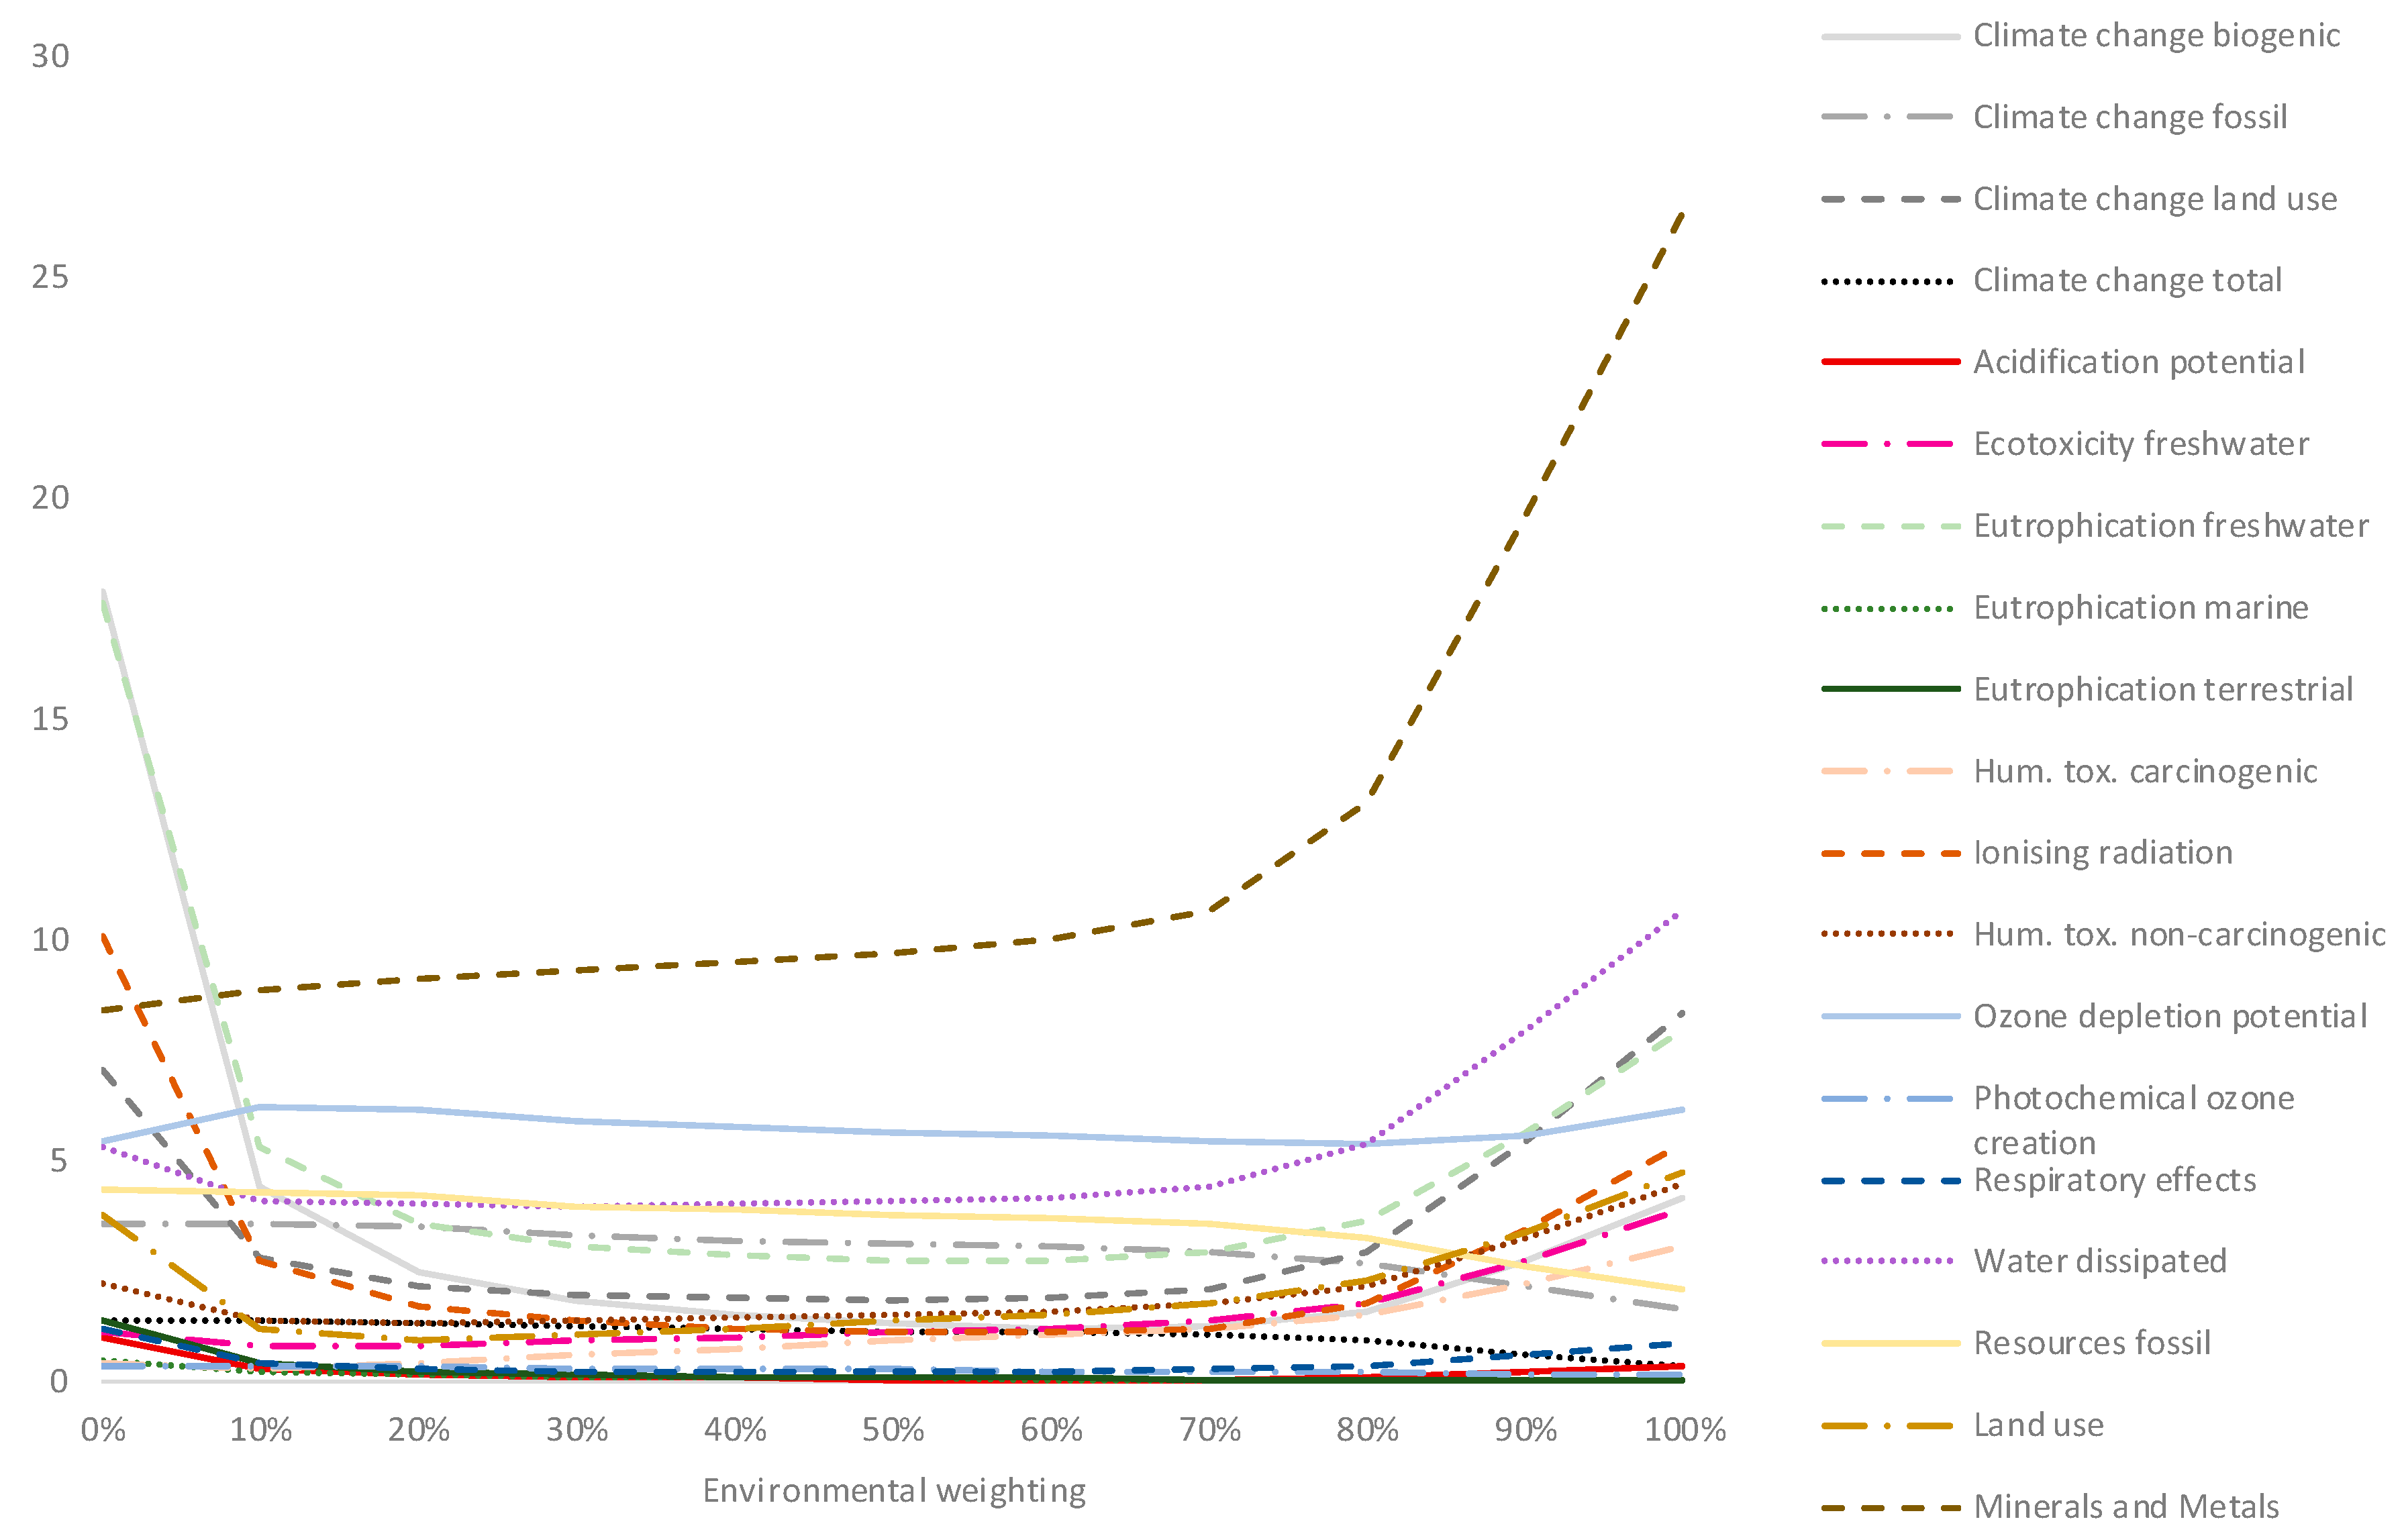
Figure 9.
Total installed capacity from 2020 to 2050 applying different weights for the multi-criteria optimisation.
Figure 9.
Total installed capacity from 2020 to 2050 applying different weights for the multi-criteria optimisation.
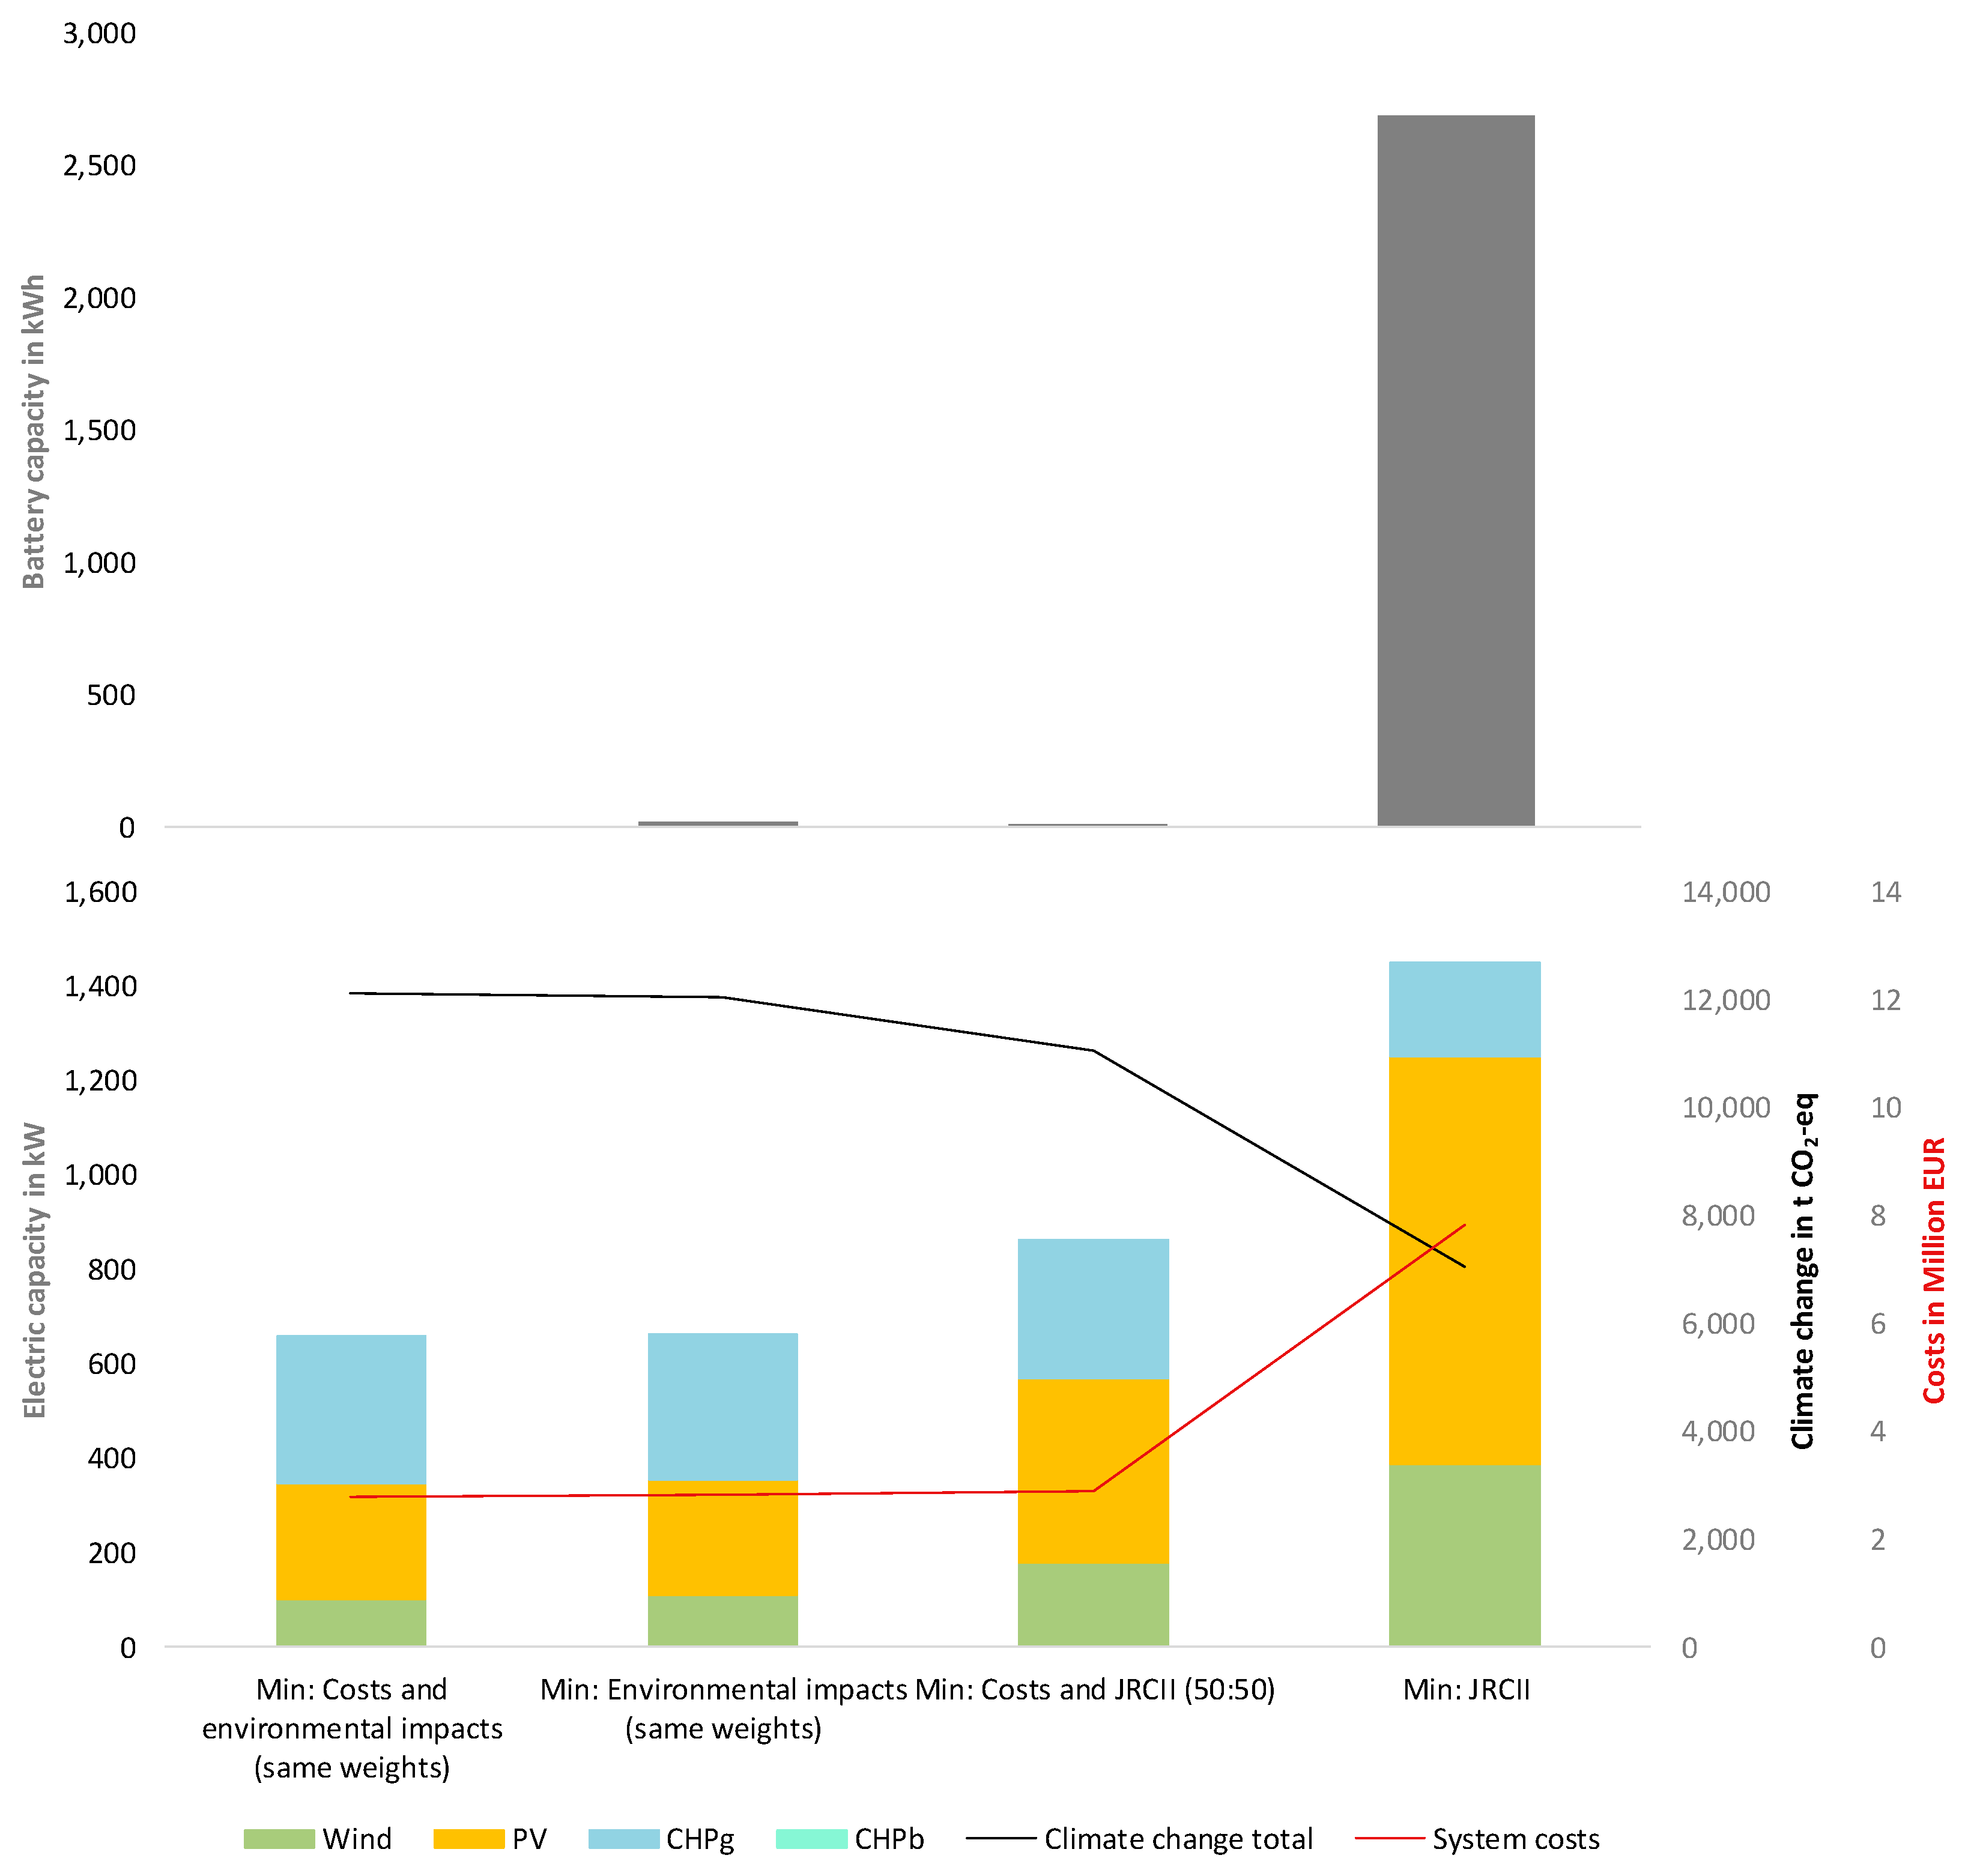
Table 1.
Costs, efficiency and lifetime of the different technologies.
| Technology | Variable Costs [€/kWhel] | Fixed Costs [€/kWel/a] | Investment [€/kWel, €/kWp for PV, €/kWh for LFP and VRF] | Efficiency | Lifetime | Reference |
|---|---|---|---|---|---|---|
| CHP natural gas | 0.01 | N/A | 1148 | el. 37%, th. 49 % | 20 years | [43] |
| CHP biogas | 0.02 | N/A | 1148 | el. 39%, th. 49 % | 20 years | [43] |
| PV | N/A | 130 | 1300 | 14% | 30 years | [44,45] |
| Wind | 0.03 * | 59 * | 1558 * | N/A | 20 years | [46] |
| LFP | N/A | 25 | 1949 | 90%, 1C | 8000 cycles | [47,48] |
| VRF | N/A | 40 | 1507 | 75%, 1C | 10,000 cycles | [47,48] |
* converted from USD at 0.89 EUR/USD.
© 2020 by the authors. Licensee MDPI, Basel, Switzerland. This article is an open access article distributed under the terms and conditions of the Creative Commons Attribution (CC BY) license (http://creativecommons.org/licenses/by/4.0/).
Share and Cite
MDPI and ACS Style
Tietze, I.; Lazar, L.; Hottenroth, H.; Lewerenz, S. LAEND: A Model for Multi-Objective Investment Optimisation of Residential Quarters Considering Costs and Environmental Impacts. Energies 2020, 13, 614. https://doi.org/10.3390/en13030614
AMA Style
Tietze I, Lazar L, Hottenroth H, Lewerenz S. LAEND: A Model for Multi-Objective Investment Optimisation of Residential Quarters Considering Costs and Environmental Impacts. Energies. 2020; 13(3):614. https://doi.org/10.3390/en13030614
Chicago/Turabian StyleTietze, Ingela, Lukas Lazar, Heidi Hottenroth, and Steffen Lewerenz. 2020. "LAEND: A Model for Multi-Objective Investment Optimisation of Residential Quarters Considering Costs and Environmental Impacts" Energies 13, no. 3: 614. https://doi.org/10.3390/en13030614
Note that from the first issue of 2016, this journal uses article numbers instead of page numbers. See further details here.