Assessment of Commercial Building Lighting as a Frequency Regulation Resource


1
Distributed Electrical Systems Laboratory, EPFL, Route Cantonale, 1015 Lausanne, Switzerland
2
Department of Civil, Environmental and Architectural Engineering, University of Colorado, Boulder, CO 80309, USA
3
National Renewable Energy Laboratory, Golden, CO 80401, USA
4
Renewable and Sustainable Energy Institute, Boulder, CO 80309, USA
5
Acuity Brands Lighting, Boulder, CO 80302, USA
*
Author to whom correspondence should be addressed.
Energies 2020, 13(3), 613; https://doi.org/10.3390/en13030613
Submission received: 3 January 2020
/
Revised: 28 January 2020
/
Accepted: 29 January 2020
/
Published: 1 February 2020
(This article belongs to the Special Issue Application of Advanced Lighting Systems in Buildings)
Abstract
:This paper evaluates the potential for automated lighting control as a resource for frequency regulation of the electric grid system in the context of current energy policies, economic incentives, and technological trends. The growing prevalence of renewable energy has increased the need for ancillary services to maintain grid frequency and stability. While demand side resources like heating, ventilating, and air-conditioning systems, as well as water treatment plants are already evaluated as regulation service providers, the potential application to electrical lighting systems has largely been ignored. Yet, aggregations of lighting systems that are retrofitted with intelligent controls could conceivably contribute to frequency regulation services with little impact on user comfort. To further explore the feasibility of lighting potential, this paper explores (1) how lighting control systems are limited by visual comfort perception and acceptability, (2) how such limitations impact the performance of the lighting system as an frequency regulation resource, and (3) how the market potential of lighting systems as demand side resources compares in different regional transmission organizations. Finally, the impact of developing technologies on the application of lighting systems for frequency regulation is discussed.
1. Introduction
1.1. Motivation
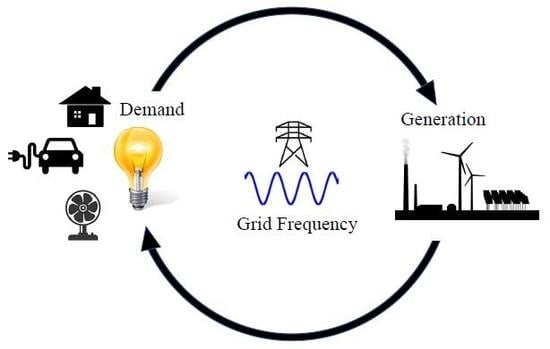
As the foundation of many aspects of modern society, the maintenance of the electric grid is a critical challenge in the 21st century. Electric grids are a complex network of generators, renewable resources, consumers, distribution and transmission lines, and control centers. Operators must balance demand and supply of power quickly to maintain an overall grid frequency of 60 Hz, for the case of the United States of America (U.S.). While bulk generators are committed to operate according to day-ahead predictions, second-to-second variations in consumer demand and intermittent generation need to be compensated for, in order to regulate the frequency and maintain electric grid stability.
To address this need for frequency regulation (FR), flexible demand side resources that are not critical and can be changed with little impact on the users can be adjusted to match the supply from the generators. While demand response (DR) is normally viewed as a load shedding approach during times of grid stress, FR provision by demand side resources can be viewed as a form of DR. Many resources like water boilers, ventilation, and air-conditioning are already considered for FR. However, lighting control systems have not been fully assessed. Lighting is a promising means for frequency regulation as devices outfitted with proper controls can respond quickly to operator commands and ramp up and down equally with little impact on the lifespan of the devices.
This paper will explore the potential of lighting resources as an FR supplier, particularly focusing on the required capacity and flexibility to participate in FR markets. The limitations imposed by human comfort need to be addressed, as this will impact the magnitude and rate of the allowed lighting changes. The topic of required control technologies and feasibility of retrofitting existing systems will be discussed. Finally, the potential for lighting based FR in various energy markets across the U.S. will be assessed considering prices, market infrastructure, and incentives for ancillary services.
1.2. Regulatory Organizations
A basic understanding of the regulation and markets relevant to grid operations in the United States is beneficial when debating the market potential of lighting based FR resources. At the top of the regulatory hierarchy is the Federal Energy Regulatory Commission (FERC), an independent, non-profit organization within the U.S. Department of Energy (DOE) that administers interstate electricity trade and transmission and promotes the growth and stability of competitive markets and reliable grid infrastructure [1]. Below FERC is the North American Electric Reliability Council (NERC), the electric reliability organization (ERO) of the U.S. [1], which enforces reliability standards for the grid.
Regional transmission organizations (RTOs) or independent system operators (ISOs) maintain the regional grid’s stability and wholesale markets [2]. The major RTOs in the U.S. that we will consider in this paper are California IS0 (CAISO), Pennsylvania Jersey Maryland (PJM), New York ISO, ISO New England, Midwest ISO, and Southwest Power Pool, as shown in Figure 1. The last RTO, the Electric Reliability Council of Texas (ERCOT), is distinctive in that it operates as the sole balancing authority in its interconnection and is not under FERC regulation because there is no interstate commerce which would invoke its involvement [3]. As of 2009, RTOs controlled more than 60% of the power distributed in the U.S. [4], while the remainder is managed by independent utilities.
1.3. Market Overview
The U.S. energy markets are divided into retail (energy purchased by end users from the utilities) and wholesale markets (bulk sales by energy generators to utility companies). The wholesale market is composed of the energy market, which is responsible for matching bulk demand, and the ancillary service market, which maintains grid stability through the deployment of backup reserves and frequency regulation [6]. Both energy and ancillary service markets have day-ahead and real-time (or spot market) sectors. While day-ahead users purchase electricity based on the predicted loads for the next day, real-time users buy supplemental supplies to compensate for unexpected loads during the current operating day. A breakdown of the electric grid markets is shown in Figure 2.
1.4. Ancillary Services
The ancillary service market is broken into a number of services that are responsible for balancing supply to and demand from the grid on various time scales. Specifically:
- FR involves finer, real-time adjustments of supply or demand to maintain grid stability on the order of seconds.
- Voltage control maintains grid voltages by injecting or absorbing reactive power [7].
- Spinning reserves are resources that are already running on the grid (synchronized to the grid’s frequency) and can respond in well under 10 min to disturbances in demand or supply.
- Supplemental reserves are the third line of defense, after the FR and spinning reserves, and can be offline resources that are able to respond within 10 min.
- Replacement reserves are used to restore spinning and supplemental reserves within 30 min after an event [7].
In summary, in the case of a disturbance in the grid, FR is the first responder, or primary control, which attempts to stabilize the grid’s frequency within seconds. If the event is too large, secondary control, the reserves, kicks in to compensate and, soon after, replacement reserves are deployed (see Figure 3).
2. Frequency Regulation
2.1. Frequency Balancing Fundamentals
Frequency regulation plays an essential role in minimizing short-term fluctuations in grid frequency. Grids operating at “off-nominal frequencies” [9] risk damage to generators, reduced economic efficiency and, in the worst case, service outages. To avoid this, balancing authorities are responsible for maintaining grid frequency throughout their interconnection. During normal operating hours, balancing authorities deploy regulation and load following services to continuously balance grid frequency during the operating day. While FR (or regulation) manages small variations from second-to-second, load following adjusts for the overall ramping up or down of consumer loads [7] as shown in Figure 4.
FR is managed by the automatic generation control (AGC), which uses grid information collected by the supervisory control and data acquisition (SCADA) system to determine how the grid should respond to disturbances [10]. Selected operating units are called on to adjust their energy consumption or output according to an AGC dispatch signal, which is computed to optimally balance the grid. The signal is updated every 2–4 seconds, thereby requiring technologies capable of rapid responses and high flexibility [11].
2.2. Resource Qualifications for FR
To qualify as an FR resource, units must pass capacity and performance tests enforced by resident RTOs. Specifically, for the RTO PJM, the unit must provide a minimum of 100 kW of FR capacity and be able to receive and follow the AGC signal to an acceptable degree of precision over a 40-min period [12]. Resources can participate in either dynamic (RegD) or traditional (RegA) regulation depending on their capacity and speed of movement [12]. For instance, fast ramping resources, like flywheels and batteries, have limited capacity but are capable of reacting quickly to the AGC signal and therefore receive the RegD signal. In contrast, RegA resources (e.g., generators) have large capacity but slower response times. Furthermore, some regulation markets are divided into RegUp and RegDown to distinguish between resources that can only ramp up or down their power output or consumption.
FERC Order 755 stipulates that resources that pass or exceed these criteria must be compensated proportional to their performance. In response to this ruling, each RTO created a method for FR compensation. The regulation interval performance score (RIPS) devised by ISO New England and the performance based regulation (PBR) rule created by PJM both grade how an FR resource’s actual response to the AGC signal compares with an ideal resource of infinite capacity and instantaneous reaction time [9,13]. For PJM, the performance score depends on delay, accuracy and precision, each evaluating the resource’s response time and ability to match the reference signal.
Accuracy A is defined as the maximum correlation coefficient r between the response and test signal with time delays varying from 0 sec to 5 min at intervals of 10 s. The calculation is summarized as follows [9],
The delay score D is found using the following equation [9],
where is the delay at the point of highest correlation (see accuracy score). A delay of less than 10 s between the reference signal and the unit’s response corresponds to a perfect score of 1, while a delay greater than 5 min results in a zero.
Finally, precision P is measured using the following Equation [9], which indicates how well the resource tracks the test signal when delay is included. Note that n is the number of samples of the signal.
The final score for the resource is the average of the delay, accuracy, and precision results. Resources must receive a score of 75% or greater to be considered for FR [9].
2.3. Conventional and Novel FR Resources
The conventional method for coping with fluctuations in demand involved generator governors, which adjusted the energy input into generators to maintain frequency, much like speed control in a car [10]. However, there are many drawbacks to employing generators to address grid fluctuations. Generators have typically slow ramp rates which limits their ability to respond to the AGC signal in the required time frame. Furthermore, using generators for FR typically involves damage to the equipment (resulting from heat rate degradation and low-efficiency operation) and lost market opportunities for generators that are providing regulation services rather than participating in the main energy market [14].
To exacerbate this problem, the increased penetration of renewable energy resources (e.g., wind and solar) introduces an increased degree of variability, which conventional FR resources, though still in use, are struggling to satisfy. To address this need, utilities have drawn on demand side resources to supply FR services. The most common strategies of demand side regulation rely upon systems that have the capacity to store power or delay consumption. Examples of this approach include wastewater treatment plants, HVAC systems, industrial production lines and irrigation systems [15] that can reduce or ramp-up power consumption quickly with little perceived impact on users. Alternatively, storage devices (flywheels, batteries, compressed air energy storage (CAES), pumped hydro, etc.) [9] allow for electricity to be accumulated or delayed and deployed for FR during times of high fluctuation. Despite the opportunity for additional demand side contributions, lighting resources have been largely ignored.
3. Lighting as an FR Resource
Accounting for nearly 404 billion kWh in 2015, indoor electrical lighting is a promising resource for regulation services [16]. Unlike generators or HVAC systems with relatively slow ramp rates, properly addressed lighting systems can respond within seconds to an AGC signal [17], thereby providing a flexible demand resource for both up and down regulation. Additionally, while frequent transitions between up and down ramping reduces the lifespan of generators and HVAC systems, lighting adjustments have little impact on the device’s longevity [17]. That said, FR resources based on lighting systems are not without shortcomings. The following sections will examine existing literature on lighting as a DR resource, and the impact of lighting changes on human comfort, which may restrict ramp rates and regulation capacity. Based on these studies, a simple assessment of the capacity and flexibility of a lighting based FR resource is conducted herein and the performance metrics are evaluated. Finally, we discuss the updates in communication and control technologies and the potential in various RTO regulation markets.
3.1. Relevant Research
A previous feasibility study on the applications of dimmable lighting in ancillary services was conducted in 2010 at the Ernest Orland Lawrence Berkeley National Laboratory [18]. Researchers focused on California’s lighting capacity as it relates to regulation and non-spinning reserves. Evaluating the number, size, and lighting power consumption of large commercial buildings in the CAISO region, the study estimated the following:
- For lighting resources to compete in ancillary services $1.8 billion and 56 million dimming ballasts would be needed to outfit enough commercial buildings.
- With proper control systems, lighting in large buildings in California could provide as much as 450 MW of regulation up or down, an amount that exceeds CAISO’s current regulation requirement of 350 MW [19].
The study also explored similar topics to this paper, including the impact of FR systems on human comfort and the technical requirements for regulation resources.
Various studies have been conducted on the potential for other demand side resources to participate in FR. For instance, in “Building-to-Grid Integration Through Combined System Resources for Frequency Regulation Service”, the potential for HVAC systems to contribute to regulation services was explored [9]. Specifically, they looked at the methods of control of combined HVAC systems, modeled and tested the response of these systems to AGC signals, and analyzed the resulting performance parameters. They concluded that HVAC systems could indeed work together to accurately follow an AGC signal and provide sufficient FR capacity. While HVAC systems typically consume more energy than individual lighting systems, the paper is still relevant as it demonstrates that the aggregation of resources (lights or other building systems) allows relatively low power devices to participate in FR services.
3.2. Limitations: Human Comfort
Using lighting systems to address FR needs can result in reduced performance (including dimming and flickering) of the light source. Since the ramp rate and dimming capacity of lighting systems is likely limited by what is acceptable for users, identifying the key parameters of the human perception of lighting is essential to developing lighting as an FR resource. In this context, understanding the sensitivity of the human visual system to the rate and magnitude of change in light levels will be critical. If rapid and sizable adjustments in the ambient light level of a room are found to be disruptive for occupants, a limit would need to be imposed on both the rate and magnitude of change for the lighting system. Such restrictions could negatively impact the performance score for the resource, reducing its competitiveness in the FR market.
To address these questions, a literature review was conducted on the human perception of ambient light levels with a focus on determining the impact of rate and amplitude change. Studies generally considered several parameters including (1) dimming range (percent reduction), (2) initial illuminance level, (3) presence of other lighting sources, and (4) the existence of distracting activities (computer work, performing calculations). A review of the field by Newsham and Birt [20] found that:
Separately, Kryszcsuk and Boyce [21] reported a correlation between the percentage of individuals detecting an illuminance change and the percentage reduction from the initial illuminance. As seen in Figure 5, approximately 50% of the population noticed a 20% reduction in lighting levels while only 15% of participants noticed a 15% reduction. Sessions A and B had an initial illuminance of 1000 lux while sessions C and D started at 500 lux. Change rates in the range of 3–300 lux/s were used with little perceivable impact on the detection threshold, indicating that, independent of the rate, a 15%–20% change in illuminance was unnoticeable [21].
Additionally, Neeches and Akashi [22] performed an experiment on the level of acceptability of lighting reductions for purposes of load shedding. Subjects seated at a desk, either unoccupied or performing a simple paper task, experienced a reduction in illuminance over a period of 10 s. After the event, the subjects were asked to report if they had detected a change and if the change was acceptable. The study found that 50% of participants noticed a 15% change and accepted up to a 40% change, which agrees with the conclusions of previously mentioned reports. The researchers found that when participants were educated on the topic and motivation for the study, the level of acceptable reduction increased by 10% [24]. While this conclusion shows the positive effects of education on energy conservation efforts, it does not necessarily apply to the field of FR, as the frequency of illumination changes would be much higher for FR than for load shedding.
With a focus on educational indoor environments, a recent study suggests that lighting quality and the achievement of adequate levels of visual comfort are more than a matter of simply verifying that illuminance levels are compliant with the prevailing standards [25]. Instead, they proposed a comprehensive and hierarchical lighting quality assessment method for the evaluation of lighting in educational spaces, whose effectiveness in characterizing visual comfort was validated through an extensive field study in Italy. Such a method may be deployed to gain a more complete assessment of the impact of frequency regulation provisions on visual comfort.
Together these studies suggest that humans are generally sensitive to changes in light levels greater than 20%. Based on this conclusion, a conservative estimate of ±15% change in light levels would be largely undetectable by occupants. For the purposes of FR, adjustments across the total light level range must be undetectable so that the light level can be ramped from the lowest to the highest intensity (or visa versa) without user detection. Therefore, we decided that a conservative range of ±8% illuminance around the nominal operating value would be acceptable for FR applications. In addition, if adjustments in the light level are within this narrow range of the nominal value, the ramp rate would not be a limiting factor for FR. We conclude therefore, that the potential for lighting as an FR resource is limited by the amplitude of change rather than the rate.
3.3. Methodology
Knowing the requirements of an FR resource and the limitations of lighting systems, a first order model can be created to evaluate the resource’s potential. In particular, the model’s ability to satisfy the FR capacity and flexibility requirements needs to be estimated. The following steps will be taken to quantify the performance of a lighting-based FR resource:
- The model of a lighting resource will be described (specifically the types of lights and required controls).
- The capacity of the theoretical resource will be evaluated using lighting standards and the conclusions on detectable light levels as discussed in Section 3.2.
- The flexibility will be examined using a sample AGC signal and information on the control technology. The technical computing environment Matlab and Simulink will be used to implement ramp filters and expected communication delays on the AGC signal to produce the expected output of the hypothetical lighting resource.
- The performance metrics discussed in Section 2.2 will be used to evaluate the resource and determine if it meets the standards for an FR supplier.
3.4. First Order Model of a Lighting FR System
In order to supply the necessary 100 kW required to participate in FR, numerous lighting systems would have to be aggregated and controlled together. For this reason, we consider a university campus equipped with a centralized control system and addressable ballasts for 60 W fluorescent lights. If we assume that all lights normally operate at a nominal 80% light level, the operating point of each dimming ballast is 50 W [18]. As discussed in Section 3.2, a conservative range of adjustment of ±8% would be undetectable to humans.
As displayed in Figure 6, adjustments of ±8% around the operating light output would correspond to fluctuations of ±4 W around the 50 W operating point. This would allow for modulations of up to 8 W per ballast. To supply 100 kW, the aggregated system would need to draw a minimum of 625 kW during nominal operating conditions.
In academic facilities, ASHRAE Standard 90.1-2007 dictates a maximum lighting power density of 0.9–1.4 W/sf for dining spaces and classrooms [26]. Assuming the lower lighting level, the described system would require 694,000 sf, the combined floor space of more than 12 football fields in order to qualify for the FR market. For large university campuses or businesses this is a conceivable capacity.
A simple model was also created to visualize the flexibility of lighting resources in this scenario. PJM’s AGC test signal (see Section 2.1) was scaled to local capacity, then shifted so that fluctuations occurred around a nominal operating value of 625 kW. The signal was then passed through a rate limiter and delay in Simulink to demonstrate the restrictions imposed by control devices and occupant comfort levels. Since we concluded that, within the illuminance threshold of ±8%, the rate of change had little impact on detectability, the rate limiter was found to be largely unnecessary. Accounting for the time for the control system to receive and process the signal and send commands to each of the individual lights, lighting units could conceivably respond to changes in the AGC signal in approximately 4 to 10 s [17]. Conservatively assuming an average delay of 10 s, the resource response (Figure 7) is remarkably close to the AGC signal. When compared to the resource response and corresponding performance scores of battery and hydro systems (Figure 8), the lighting resource performs well.
3.5. Evaluation of FR Performance
The resource was scored using PJM’s delay, accuracy, and precision scoring rubric. As explained in Section 2.2, accuracy was defined as the maximum correlation between the AGC signal and the response with a delay varying from 0 to 5 min at an interval of 10 s; delay was the time corresponding to the maximum correlation (note that the PJM 10-sec grace period was not used in the calculation of this delay score); and precision was calculated as the error between the actual response and the AGC signal. The results are shown in Table 1. The average across these metrics must exceed 75% to qualify as an FR resource. The overall performance score for the hypothetical lighting resource was 0.9773, which is comparable to that of the battery in Figure 8.
3.6. Relevant Technologies
Lighting has not seriously been considered for regulation due to the lack of required infrastructure for control systems. Current lighting potential for regulation services is limited by this deficiency, with only 1% to 2% of buildings in the U.S. equipped with dimming control systems [18] and therefore capable of receiving the AGC signal.
However, the potential for lighting to participate in the regulation market is growing quickly. Advancements in communication and control technology allow for the control of bulk systems to minimize communication latencies [17]. For instance, Lutron, a lighting controls company, has developed a set of addressable dimming ballasts that act intelligently on commands and feedback from sensors in the environment [28]. To make retrofitting of old buildings easier, Lutron has also produced an array of wireless solutions for control systems that act on low frequency bandwidths and minimize wiring requirements [29]. While both systems are currently designed to receive signals from sensors, the technology could conceivably be modified to receive AGC signals.
Utilities are also encouraging the use of controllable lighting systems through discounts, with the National Grid in New England states offering a rebate of $40 per ballast and PSE&G (Public Service Electric and Gas) in New Jersey offering a return of $25 for every luminaire with daylight harvesting controls [20]. Not only would installation of daylight harvesting sensors, centralized control systems and addressable ballasts allow lighting resources to participate in the FR market, but such upgrades would reduce the overall energy consumption and cost.
3.7. Lighting Resource Potential
Ideally, when considering the best location to draw on lighting systems for FR, (1) market incentives, (2) resource capacity, and (3) existing infrastructure should be evaluated. This section examines the market configurations and prices for FR in each RTO. Additional work must be done to evaluate the capacity for lighting in each region and the proportion of buildings outfitted with appropriate control systems, in order to estimate the required investment and expected return for this resource.
Each RTO/ISO has a unique configuration of the regulation market and list of acceptable resources that can participate (Table 2). According to a report by the Lawrence Berkeley National Lab [30], “PJM and ERCOT have the most favorable conditions for (demand resource) DR in ancillary service markets”. PJM is particularly promising for DR contributions to regulation activities with market clearing prices of $30/MWh [19] and opportunities for both storage and demand resources. During peak hours, PJM reported a regulating requirement of 700 MW, with 525 MW required during off-peak hours [12].
ERCOT, though not under FERC oversight, has integrated controllable load resources (CLRs) into the regulation market (CLRs are defined as loads that can receive and react to AGC signals) [31]. MacDonald and others [30] note that the ERCOT regulation market is particularly favorable for demand side resources because it divides regulation into RegUp and RegDown markets, allowing resources that favor one to participate. They suggest that ERCOT will be the best market for CLRs when aggregations of resources are permitted.
CAISO, which previously experienced major market setbacks including corporate malfeasance and market deregulation, culminating in the Western energy crisis of 2000 [1], has since recovered significantly. In 2016, the regulation requirement for CAISO doubled from the previous year with the increased penetration of wind and solar, tripling prices from $5/MWh to $15/MWh [32].
In short, the best opportunities for demand resources in FR seem to exist in PJM and ERCOT. However, while FERC Order 719 [33] was introduced in 2008 to promote the participation of demand resources in wholesale markets, several RTOs have not yet established sufficient market infrastructure and incentives to support demand side resource (e.g., lighting) participation in FR [34]. It is conceivable that the development of DR favorable markets, together with the increased penetration of renewable energy into the grid, would greatly improve the potential for loads to contribute to FR services.
4. Discussion and Recommendations
Given sizable investments in control infrastructure and communication technology, the electrical lighting systems in commercial buildings have significant potential as a frequency regulation resource. Lighting is ideally designed for regulation since it is able to respond rapidly, reverse ramping direction almost instantaneously, and receive and track command signals with proper control systems.
However, the resource is largely limited by regulation capacity and poor infrastructure. Modern lighting systems combine electrical lighting and daylight through daylight dimming control systems. These, however, affect only perimeter spaces that have a connection to the outdoors and not core spaces of commercial buildings during time periods when daylight harvesting is feasible. Nevertheless, as more dimmable lighting controls are installed, the resource’s capacity drops. Lutron, for instance, claims that the addressable ballast can reduce energy consumption by up to 20% [28]. Additional analysis would be required to determine the minimum lit floor area to provide the minimum FR capacity required to qualify as a frequency regulation resource.
Furthermore, specialists in lighting predict that energy efficient solid state lighting systems (LEDs) will eventually replace fluorescent lights, significantly cutting power consumption. For a resource with already limited power consumption, control systems and more energy efficient light sources could nearly eliminate the regulation capacity of lighting systems.
Essentially, it is likely that future lighting systems will be unable to participate in the regulation of the grid as it is currently designed. However, a smart grid could potentially revolutionize this playing field. As an automated, intelligent system involving two-way communication and energy flow between supply and demand, a smart grid could detect and react to disturbances in the grid in real-time. In this exciting evolution of the grid, participation of demand side resources will be essential.
The greatest challenge of this development will be fast, accurate communication to millions of devices across great distances. Controlling units on such a massive scale could be accomplished via widespread use of wireless communication to broadcast AGC signals [17]. Alternatively, devices could potentially sense grid voltage levels and act independently, rather than responding to a formulated signal dispatched by their balancing authority. This hyper-connected system has the potential to be a seamlessly integrated, flexible, and an almost organic network of renewable resources, responsive loads, and intelligent control systems.
Author Contributions
Conceptualization, G.H. and W.B.; methodology, A.K., G.H. and W.B.; software, A.K.; validation, A.K., G.H. and W.B.; formal analysis, A.K.; investigation, A.K.; resources, A.K. and G.H.; data curation, A.K.; writing—original draft preparation, A.K.; writing—review and editing, A.K., G.H. and W.B.; visualization, A.K.; supervision, G.H. and W.B.; project administration, G.H. and W.B. All authors have read and agreed to the published version of the manuscript.
Funding
This research received no external funding.
Conflicts of Interest
The authors declare no conflict of interest.
References
- Borlase, S. Smart Grids: Infrastructure, Technology and Solutions; Taylor & Francis: Boca Raton, FL, USA, 2012. [Google Scholar]
- Regulatory Assistance Project. Electricity Regulation in the US: A Guide; Regulatory Assistance Project: Monpelier, VT, USA, 2011. [Google Scholar]
- Hoff, S. U.S. Electric System is Made Up of Interconnections and Balancing Authorities. 2020. Available online: https://www.eia.gov/todayinenergy/detail.php?id=27152 (accessed on 30 January 2020).
- EIA. About 60 % of the U.S. Electric Power Supply is Managed by RTOs; EIA: Washington, DC, USA, 2011. [Google Scholar]
- FERC. Regional Transmission Organizations (RTO)/Independent System Operators (ISO); FERC: Washington, DC, USA, 2019. [Google Scholar]
- PJM. PJM Learning Center: PJM Structure; PJM: Norristown, PE, USA, 2016. [Google Scholar]
- Kirby, J.B. Frequency Regulation Basics and Trends; Technical Report; Oak Ridge National Laboratory: Oak Ridge, TE, USA, 2004. [Google Scholar]
- Hodge, D.B.M. Lecture 10: Transmission System Operations; University Lecture; University of Colorado Boulder: Boulder, CO, USA, 2016. [Google Scholar]
- Zhao, P.; Henze, G.P.; Brandemuehl, M.J.; Cushing, V.J.; Plamp, S. Dynamic frequency regulation resources of commercial buildings through combined building system resources using a supervisory control methodology. Energy Build. 2015, 86, 137–150. [Google Scholar] [CrossRef]
- NERC. Balancing and Frequency Control; NERC: Atlanta, GA, USA, 2011. [Google Scholar]
- Hiskens, I. Introduction to Power Grid Operation; University Lecture; Michigan Engineering: Florence, Italy, 2013. [Google Scholar]
- Pilong, C. PJM Manual 12: Balancing Operations; PJM: Norristown, PE, USA, 2016. [Google Scholar]
- Zhou, Z.; Levin, T.; Conzelmann, G. Survey of U.S. Ancillary Services Markets; Technical Report; Argonne National Laboratory: Argonne, IL, USA, 2016.
- ISO-NE. Internal Market Monitor: Spring 2016 Quarterly Markets Report; ISO-NE: Holyoke, MA, USA, 2016. [Google Scholar]
- Dragoon, K.; Papaefthymiou, G. Power Systems Flexibility Strategic Roadmap; Ecofys: Berlin, Germany, 2015. [Google Scholar]
- EIA. In FAQ: How Much Electricity is Used for Lighting in the United States? EIA: Washington, DC, USA, 2016.
- Donnelly, M.; Mattix, S.; Trudnowski, D.; Dagle, J. Autonomous Demand Response for Primary Frequency Regulation; Technical Report; Pacific Northest National Laboratory: Berkeley, CA, USA, 2012.
- Rubinstein, F.; Xiaolei, L.; Watson, D. Using Dimmable Lighting for Regulation Capacity and Non-Spinning Reserves in the Ancillary Services Market. A Feasibility Study; Technical Report; Lawrence Berkeley National Laboratory: Berkeley, CA, USA, 2010.
- Tacka, N. RTO or ISO Regulation Market Comparison. 2016. Available online: https://www.pjm.com/-/media/committees-groups/task-forces/rmistf/20160413/20160413-item-03-rto-iso-benchmarking.ashx (accessed on 30 January 2020).
- Newsham, G.; Birt, B. Demand-responsive lighting—A field study. J. Illum. Eng. Soc. 2010, 6, 203–226. [Google Scholar] [CrossRef]
- Kryszczuk, K.M.; Boyce, P.R. Detection of slow light level reduction. J. Illum. Eng. Soc. 2002, 31, 3–10. [Google Scholar] [CrossRef]
- Akashi, Y.; Neches, Y. Detectability and acceptability of illuminance reduction for load shedding. J. Illum. Eng. Soc. 2004, 33, 3–13. [Google Scholar] [CrossRef]
- Newsham, G. Detection and acceptance of demand responsive lighting in offices with and without daylight. J. Illum. Eng. Soc. 2008, 4, 139–156. [Google Scholar] [CrossRef] [Green Version]
- Akashi, Y. Is it okay to dim your lights for load shedding? J. Illum. Eng. Soc. 2004. Available online: https://www.yumpu.com/en/document/read/24170216/rs-1-lda-covps-illuminating-engineering-society/6 (accessed on 30 January 2020).
- Leccese, F.; Salvadori, G.; Rocca, M.; Buratti, C.; Belloni, E. A method to assess lighting quality in educational rooms using analytic hierarchy process. Build. Environ. 2020, 168, 106501. [Google Scholar] [CrossRef]
- ASHRAE/IESNA. Standard 90.1-2007: Table 9.6.1 Lighting Power Densities Using the Space-by-Space Method. 2007. Available online: https://www.ashrae.org/File%20Library/Technical%20Resources/Standards%20and%20Guidelines/Standards%20Addenda/90-1-2007/90_1_2007_bx_by_ca_cb_cc.pdf (accessed on 30 January 2020).
- Benner, S. Performance, Mileage and the Mileage Ratio; PJM: Norristown, PE, USA, 2015. [Google Scholar]
- Lutron. Fluorescent Dimmming Systems: Technical Guide; Lutron: Coopersburg, PA, USA, 2011. [Google Scholar]
- Lutron. Lutron Energy-Saving Products: Retrofit Solutions; Lutron: Coopersburg, PA, USA, 2011. [Google Scholar]
- MacDonald, J.; Cappers, P.; Duncan, C.; Kiliccote, S. Demand Response Providing Ancillary Services: Comparison of Opportunities and Challenges in the US Wholesale Markets. 2012. Available online: https://pdfs.semanticscholar.org/ddd5/758bd434a7341d155a9f7fc92fc796b0485d.pdf (accessed on 30 January 2020).
- Patterson, M. Demand Response in the ERCOT Markets; Department of Energy: Washington, DC, USA, 2011. [Google Scholar]
- CAISO. Q1 2016 Report on Market Issues and Performance; CAISO: Folsom, CA, USA, 2016. [Google Scholar]
- FERC. FERC Order 719: Wholesale Competition in Regions with Organized Electric Markets; FERC: Washington, DC, USA, 2008. [Google Scholar]
- Rahimi, F.; Ipakchi, A. Demand response as a market resource under the smart grid paradigm. IEEE Trans. Smart Grid 2010, 1, 82–88. [Google Scholar] [CrossRef]
Figure 1.
United States of America (U.S.) Balancing authorities including regional transmission organizations (RTOs), independent system operators (ISOs,) and independent utilities [5].
Figure 1.
United States of America (U.S.) Balancing authorities including regional transmission organizations (RTOs), independent system operators (ISOs,) and independent utilities [5].
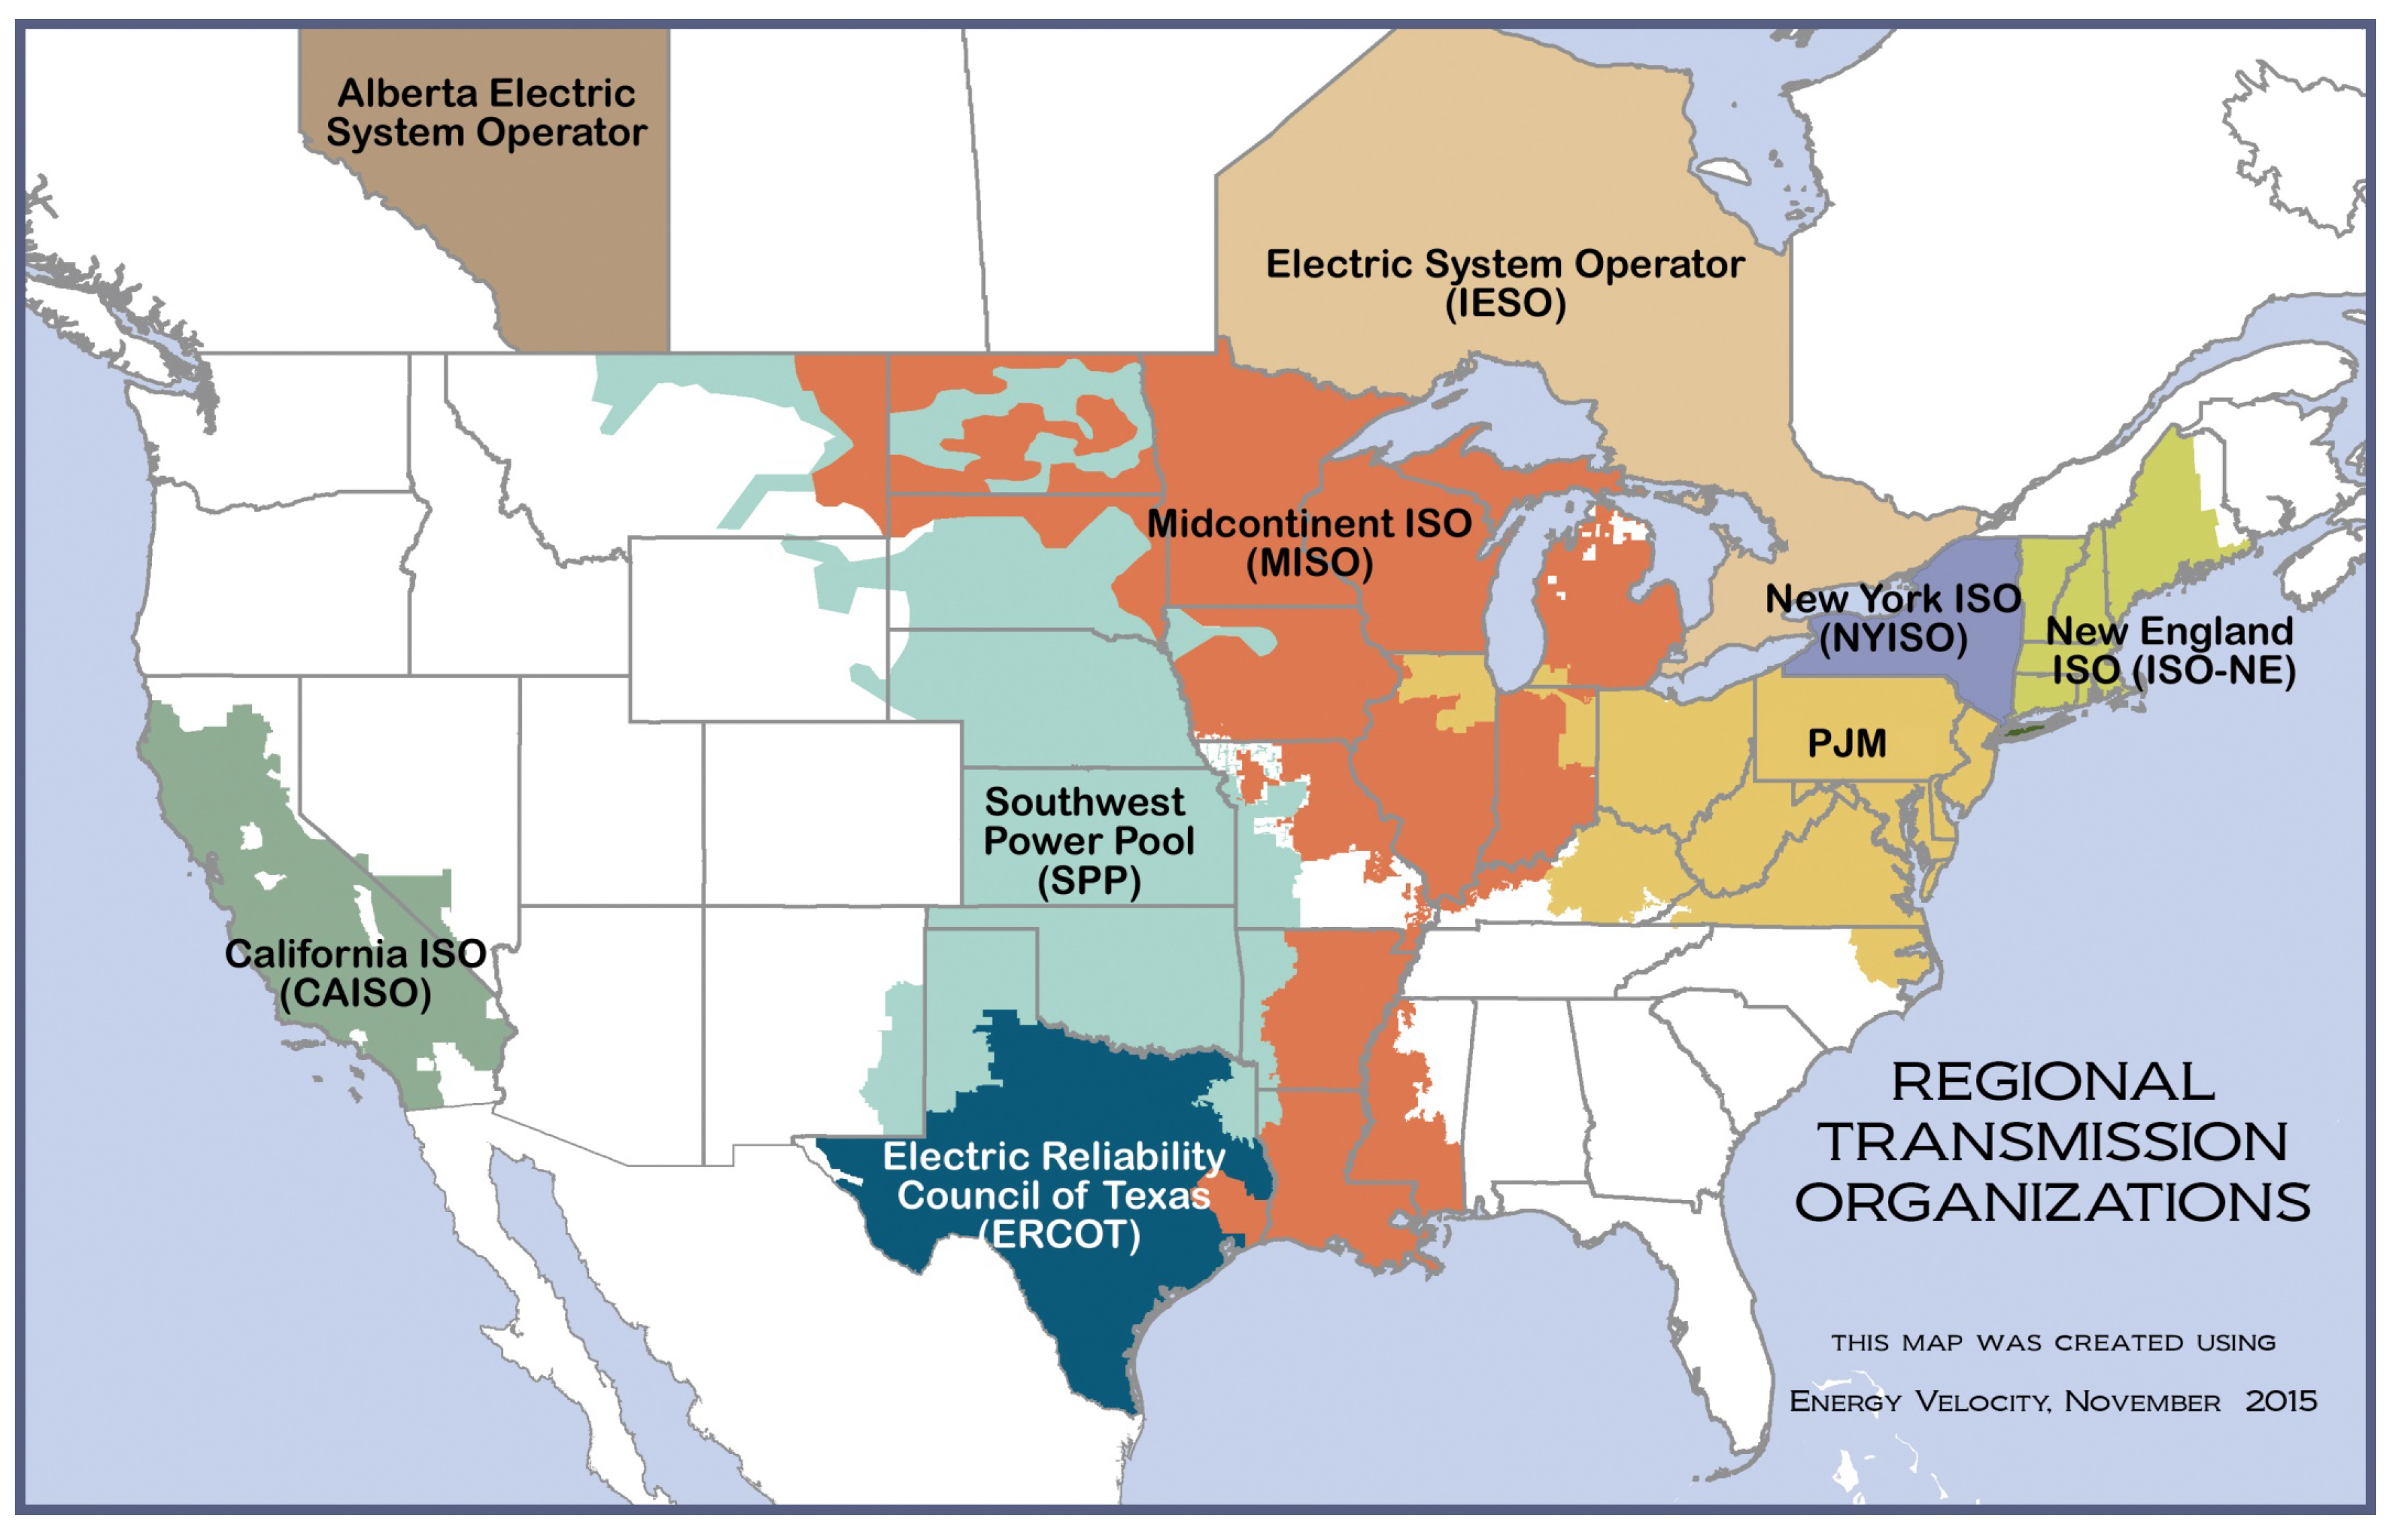
Figure 2.
Breakdown of the electric grid markets in deregulated energy markets.
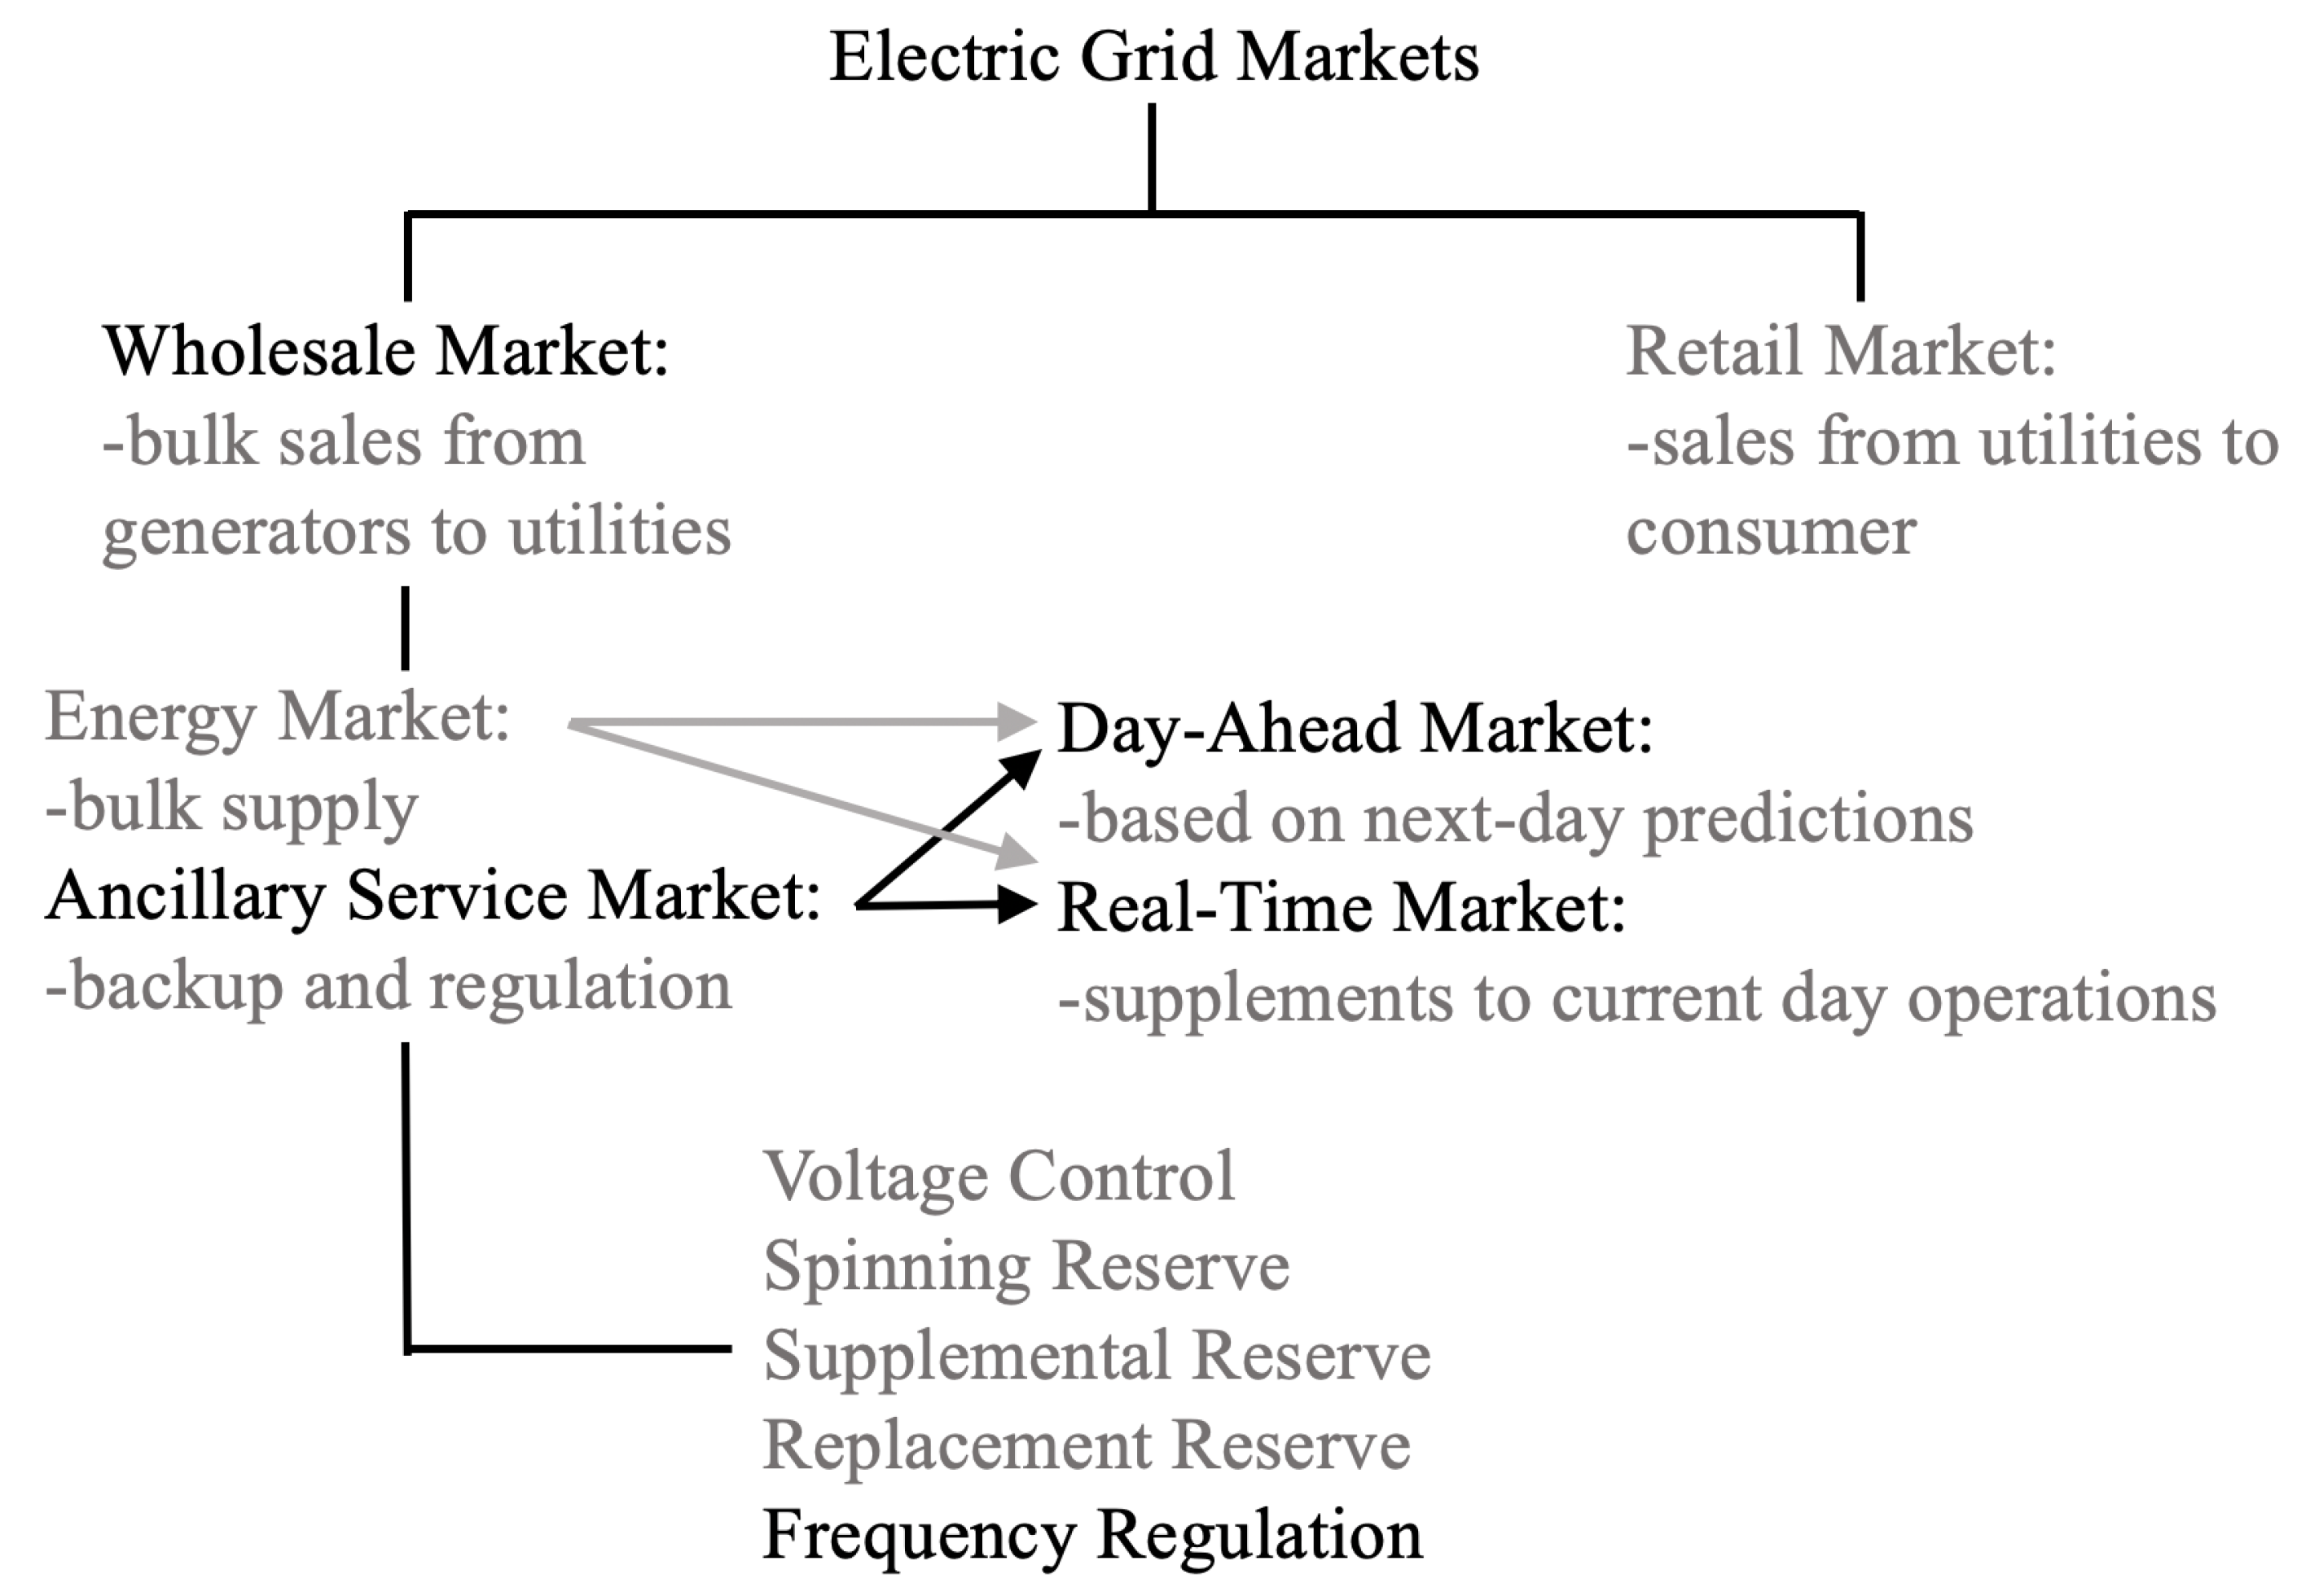
Figure 3.
Contingency reserves in the case of a grid event (a sudden drop or spike in demand) [8].
Figure 3.
Contingency reserves in the case of a grid event (a sudden drop or spike in demand) [8].

Figure 4.
Timescales of balancing power systems [8].
Figure 4.
Timescales of balancing power systems [8].
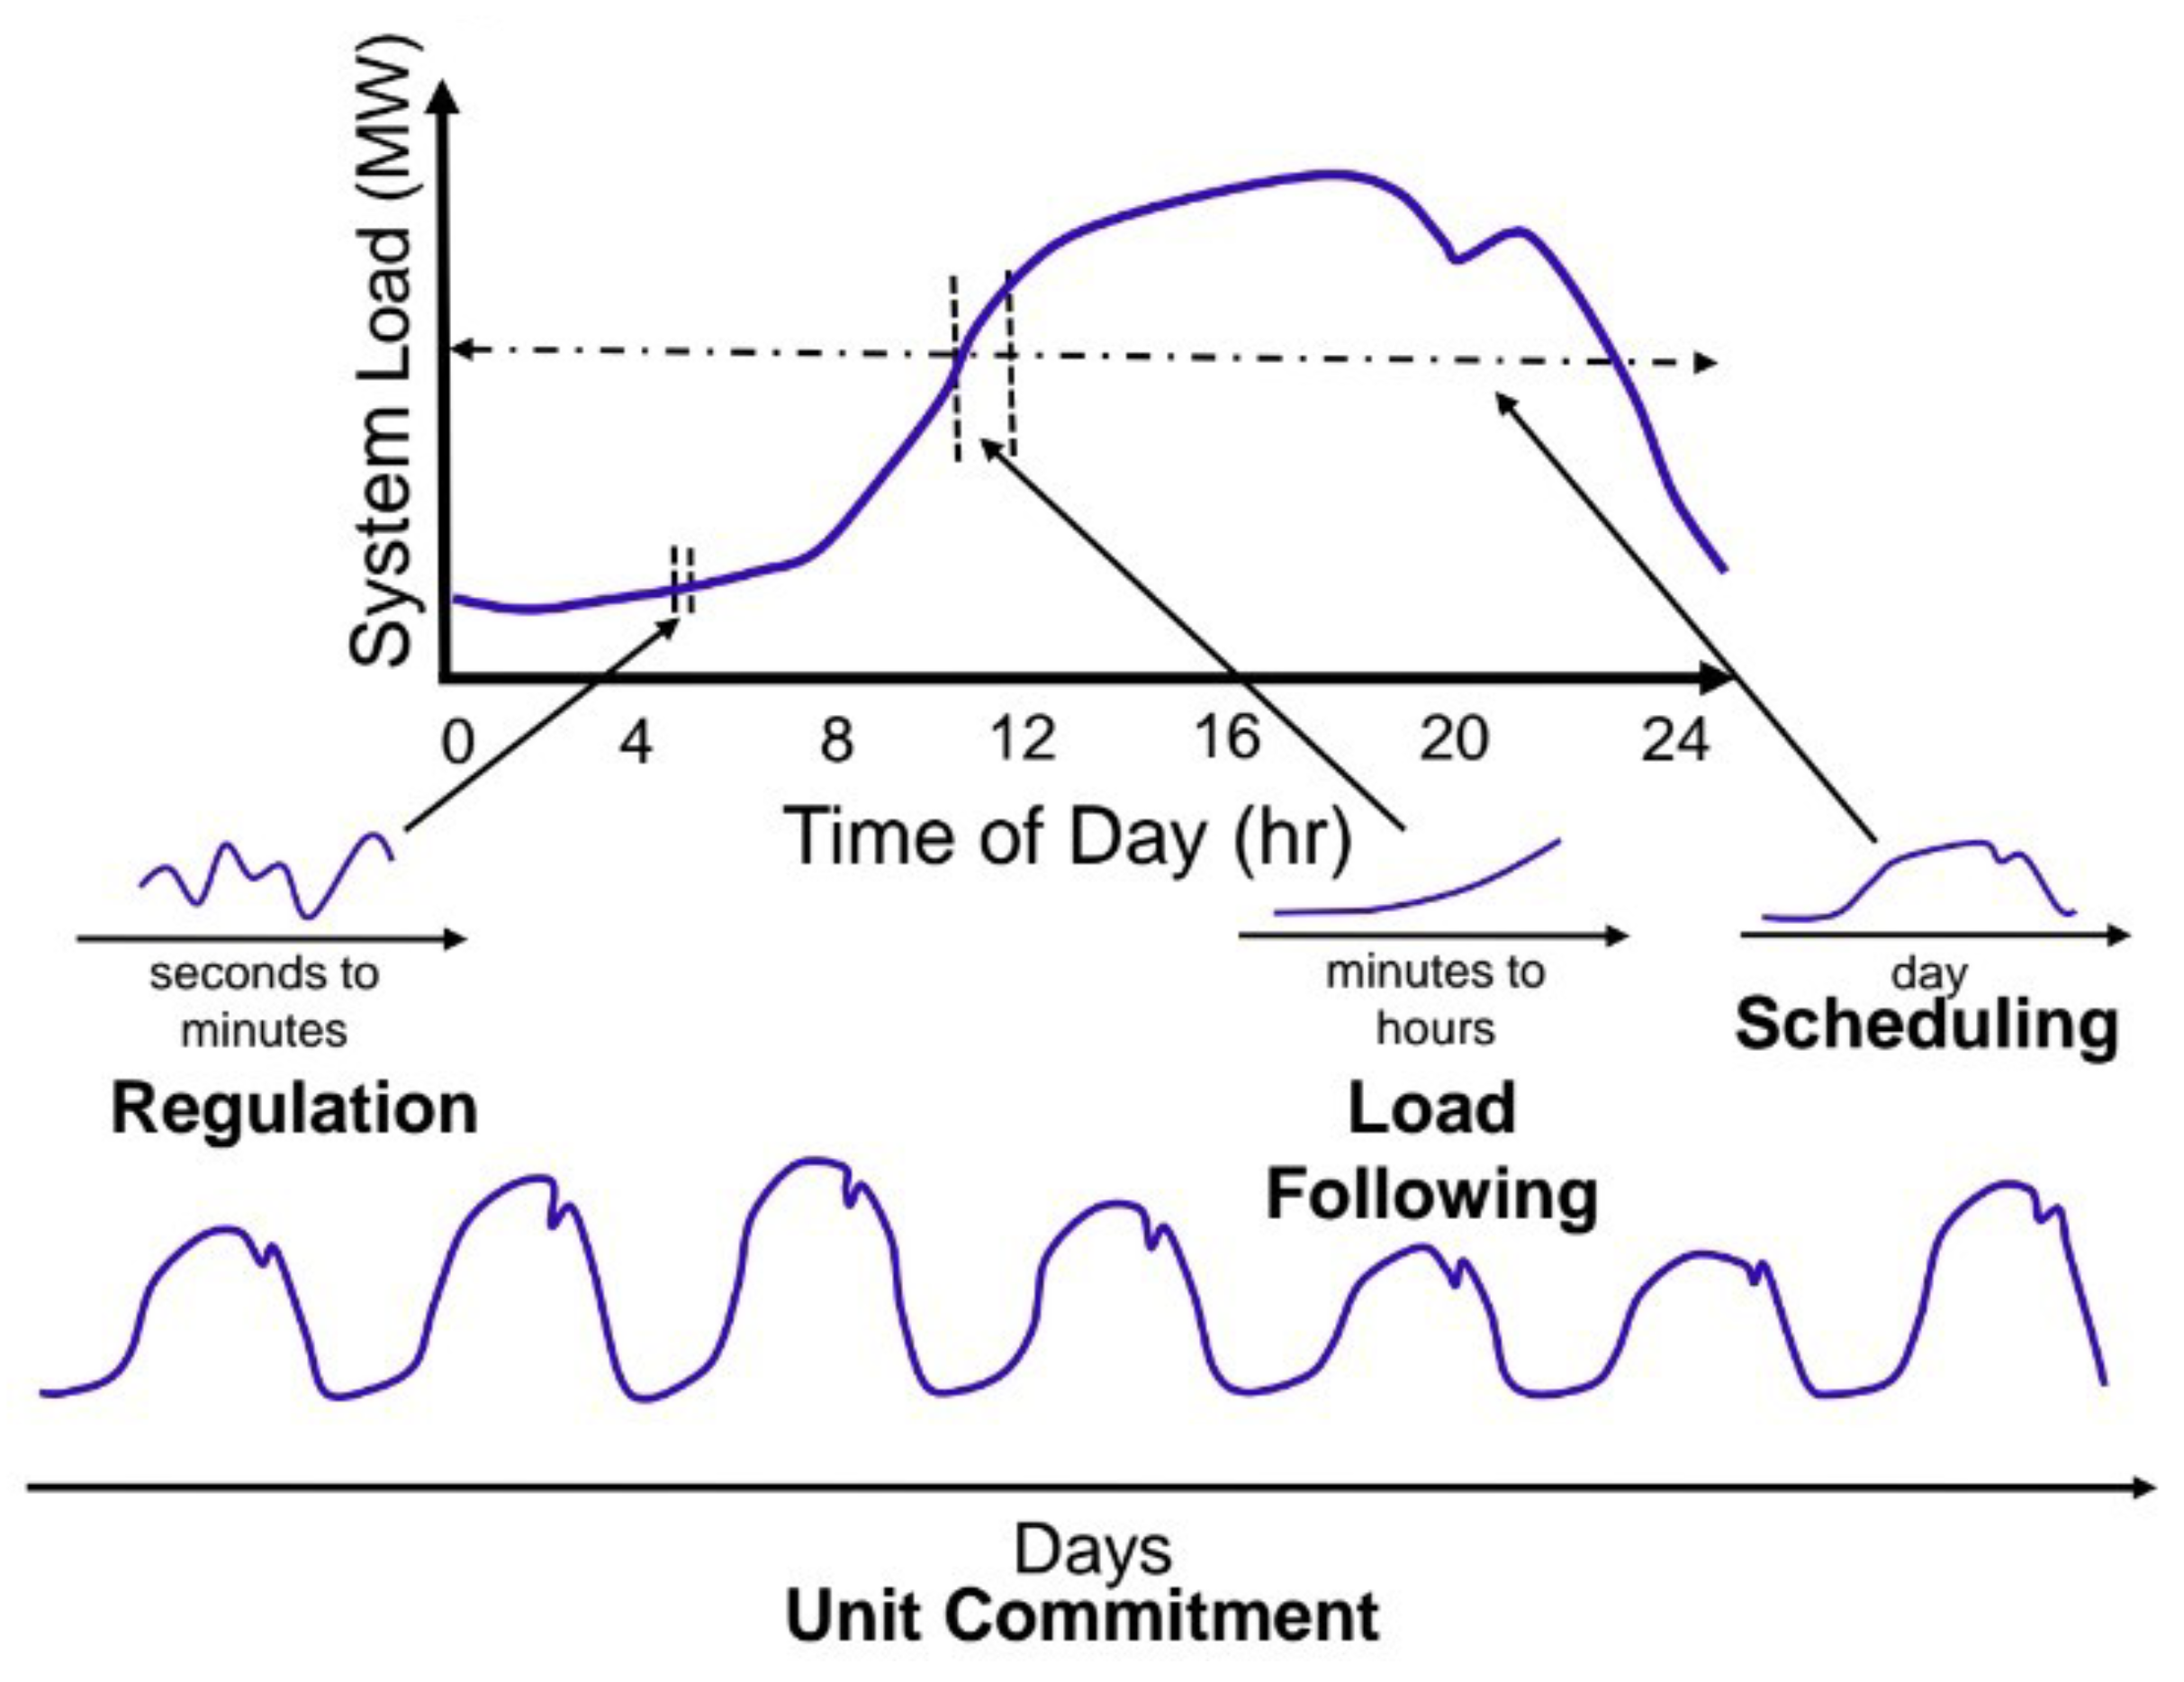
Figure 5.
The percentage of subjects who detected the reduction in illuminance as a function of the percentage reduction in illuminance [21].
Figure 5.
The percentage of subjects who detected the reduction in illuminance as a function of the percentage reduction in illuminance [21].
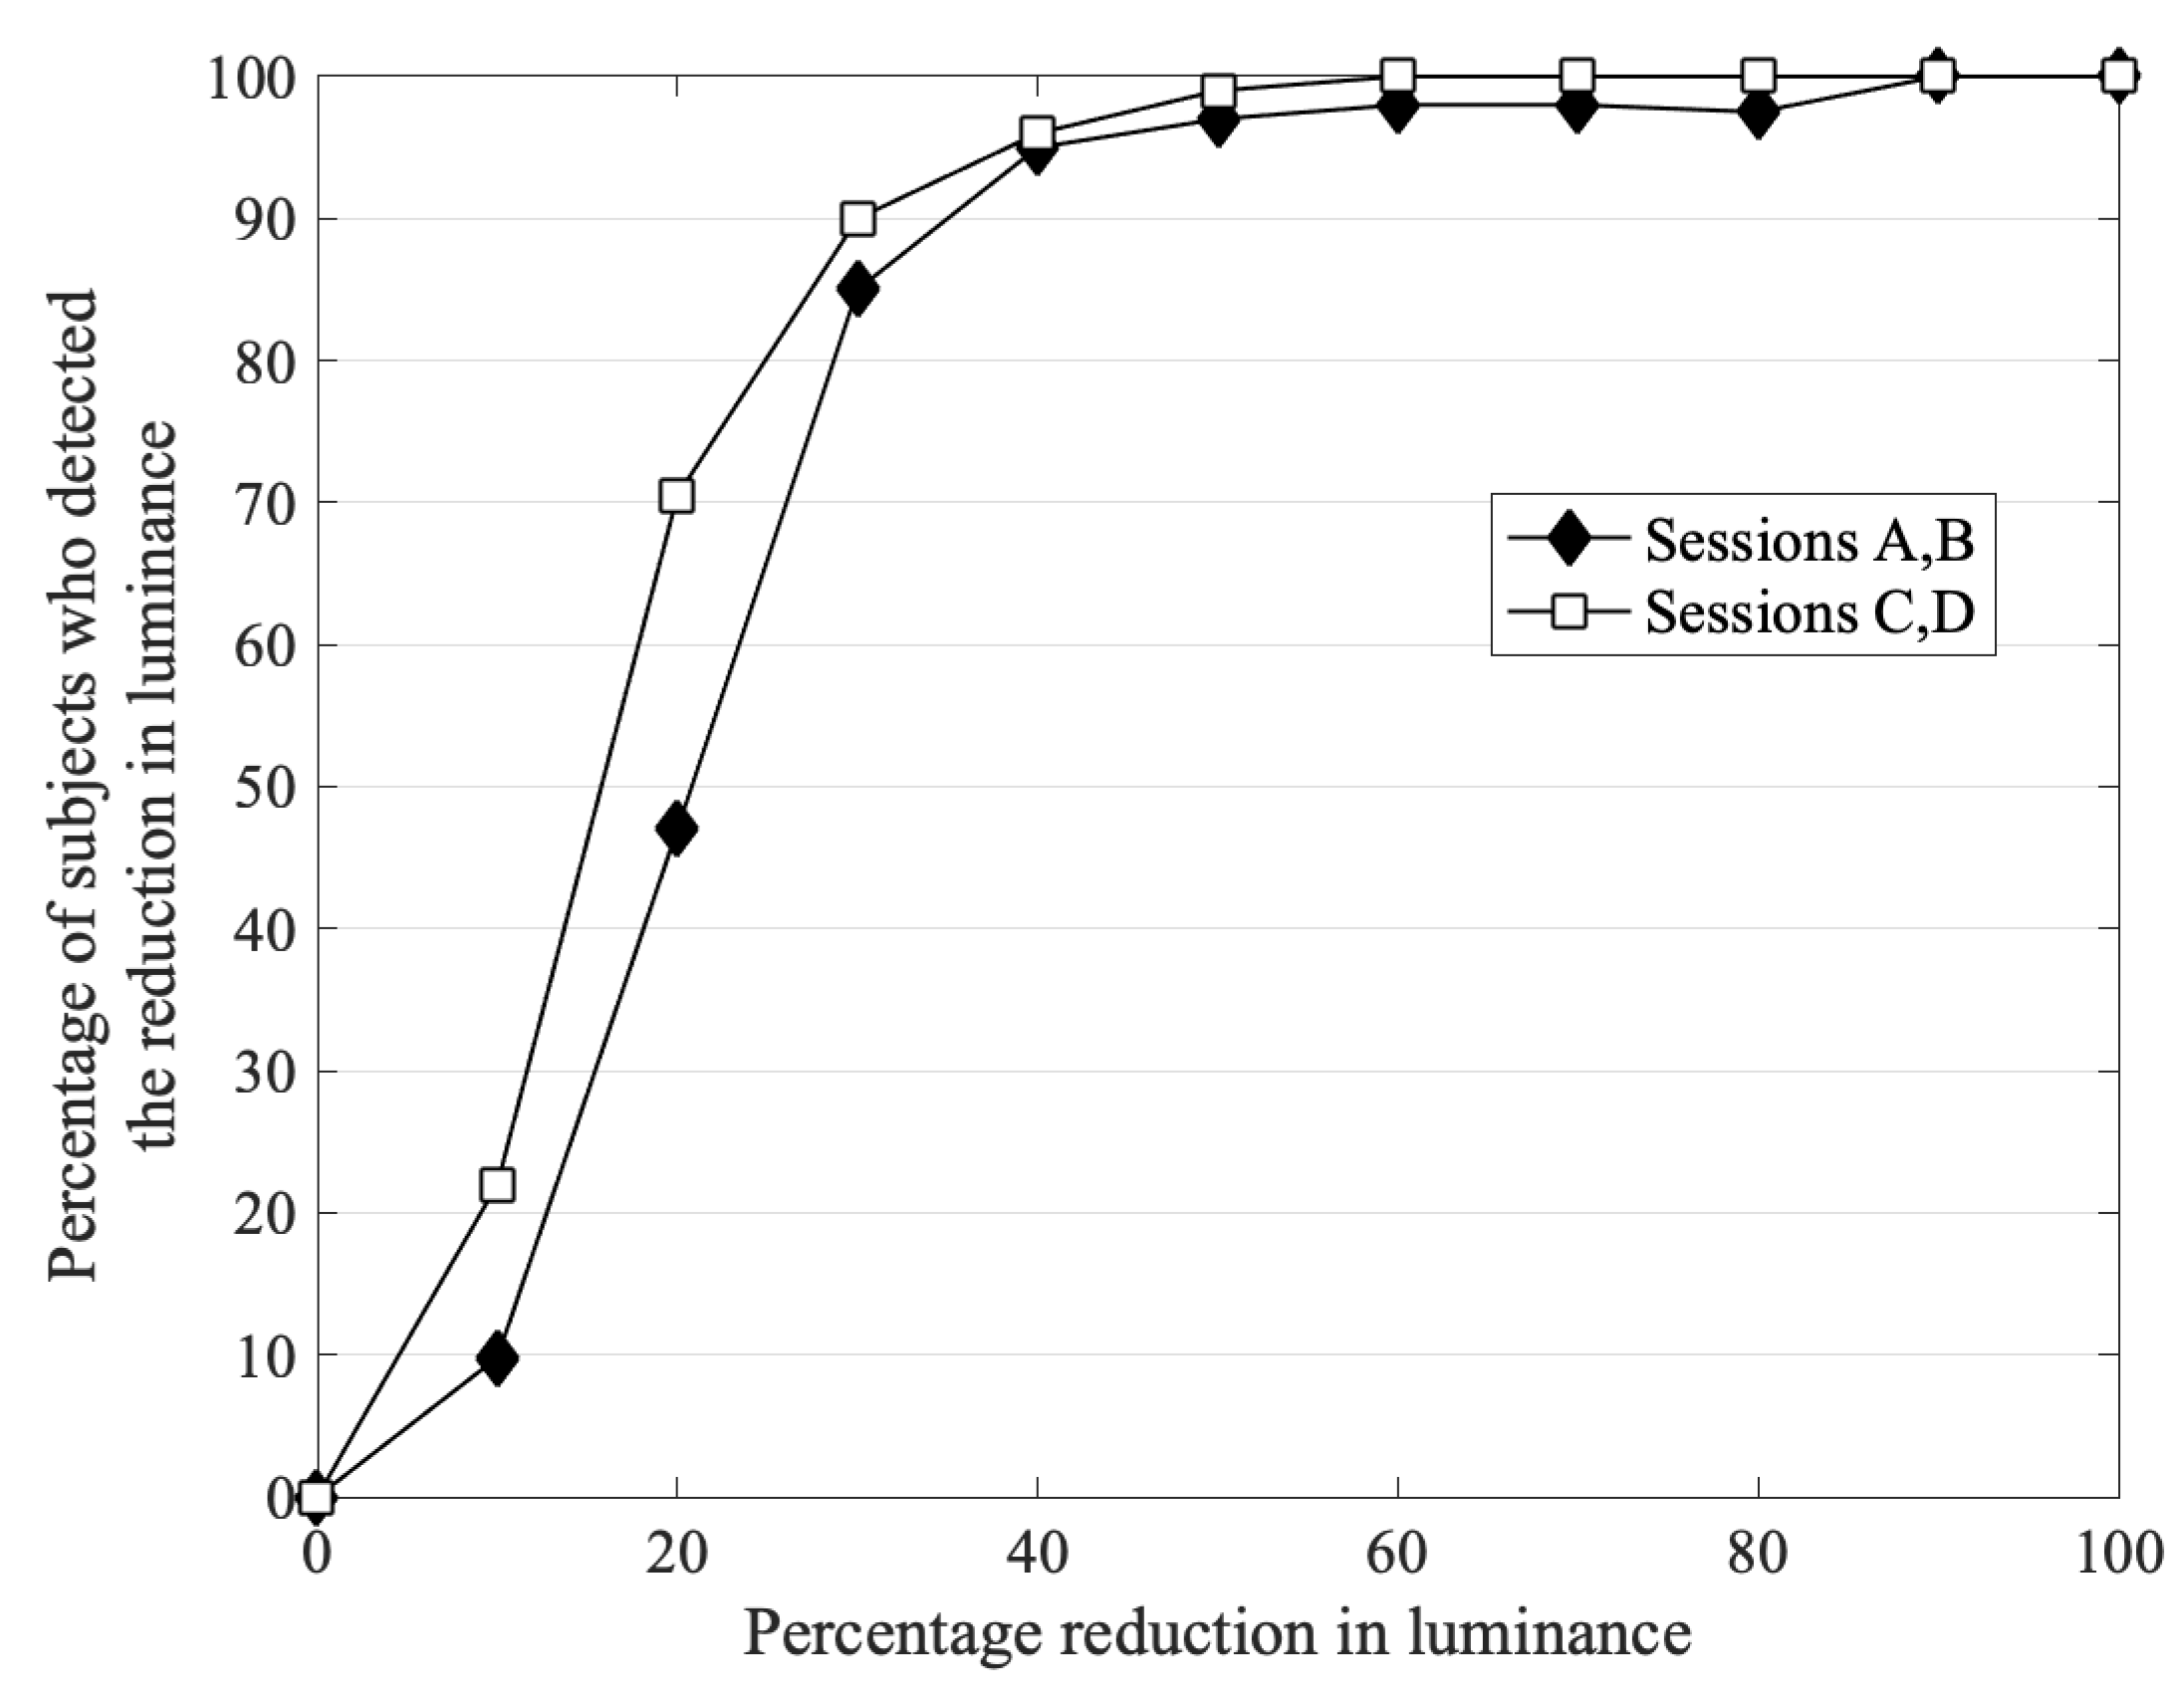
Figure 6.
The frequency regulation (FR) dimming range assuming a detection threshold of ±8% for a fluorescent dimming ballast [18].
Figure 6.
The frequency regulation (FR) dimming range assuming a detection threshold of ±8% for a fluorescent dimming ballast [18].
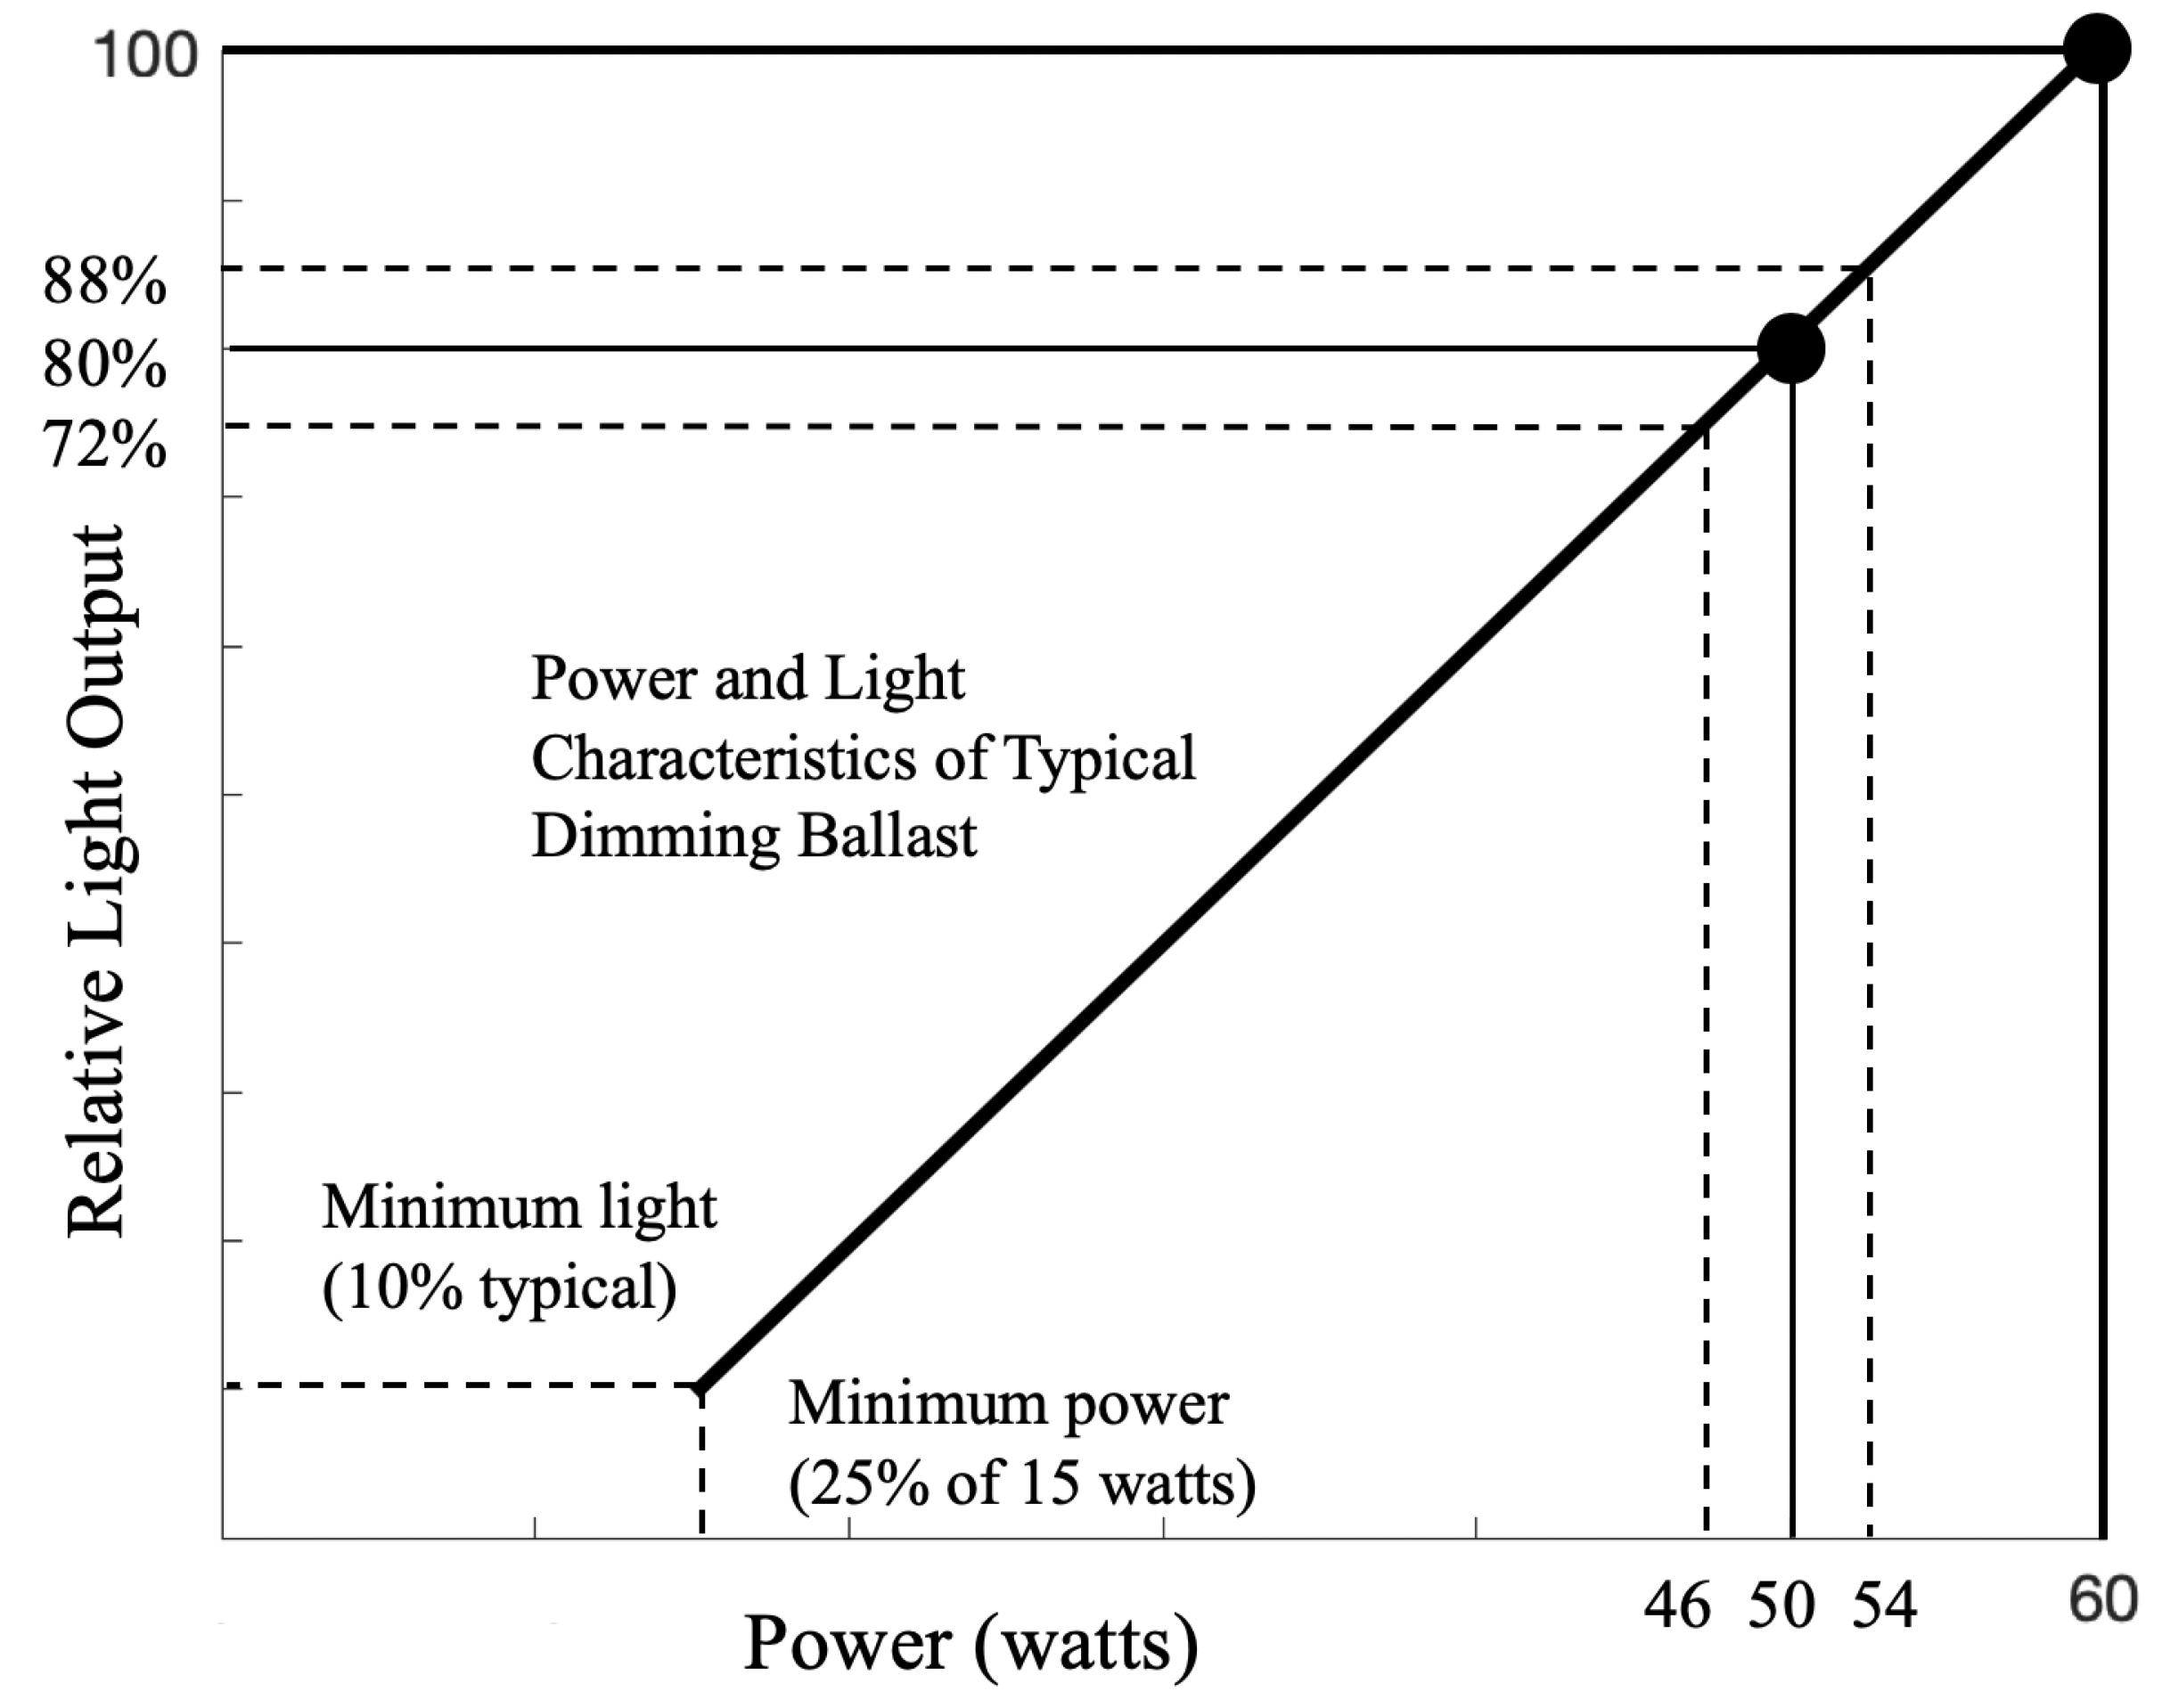
Figure 7.
Simulated theoretical response of lighting system to the automatic generation control (AGC) signal.
Figure 7.
Simulated theoretical response of lighting system to the automatic generation control (AGC) signal.
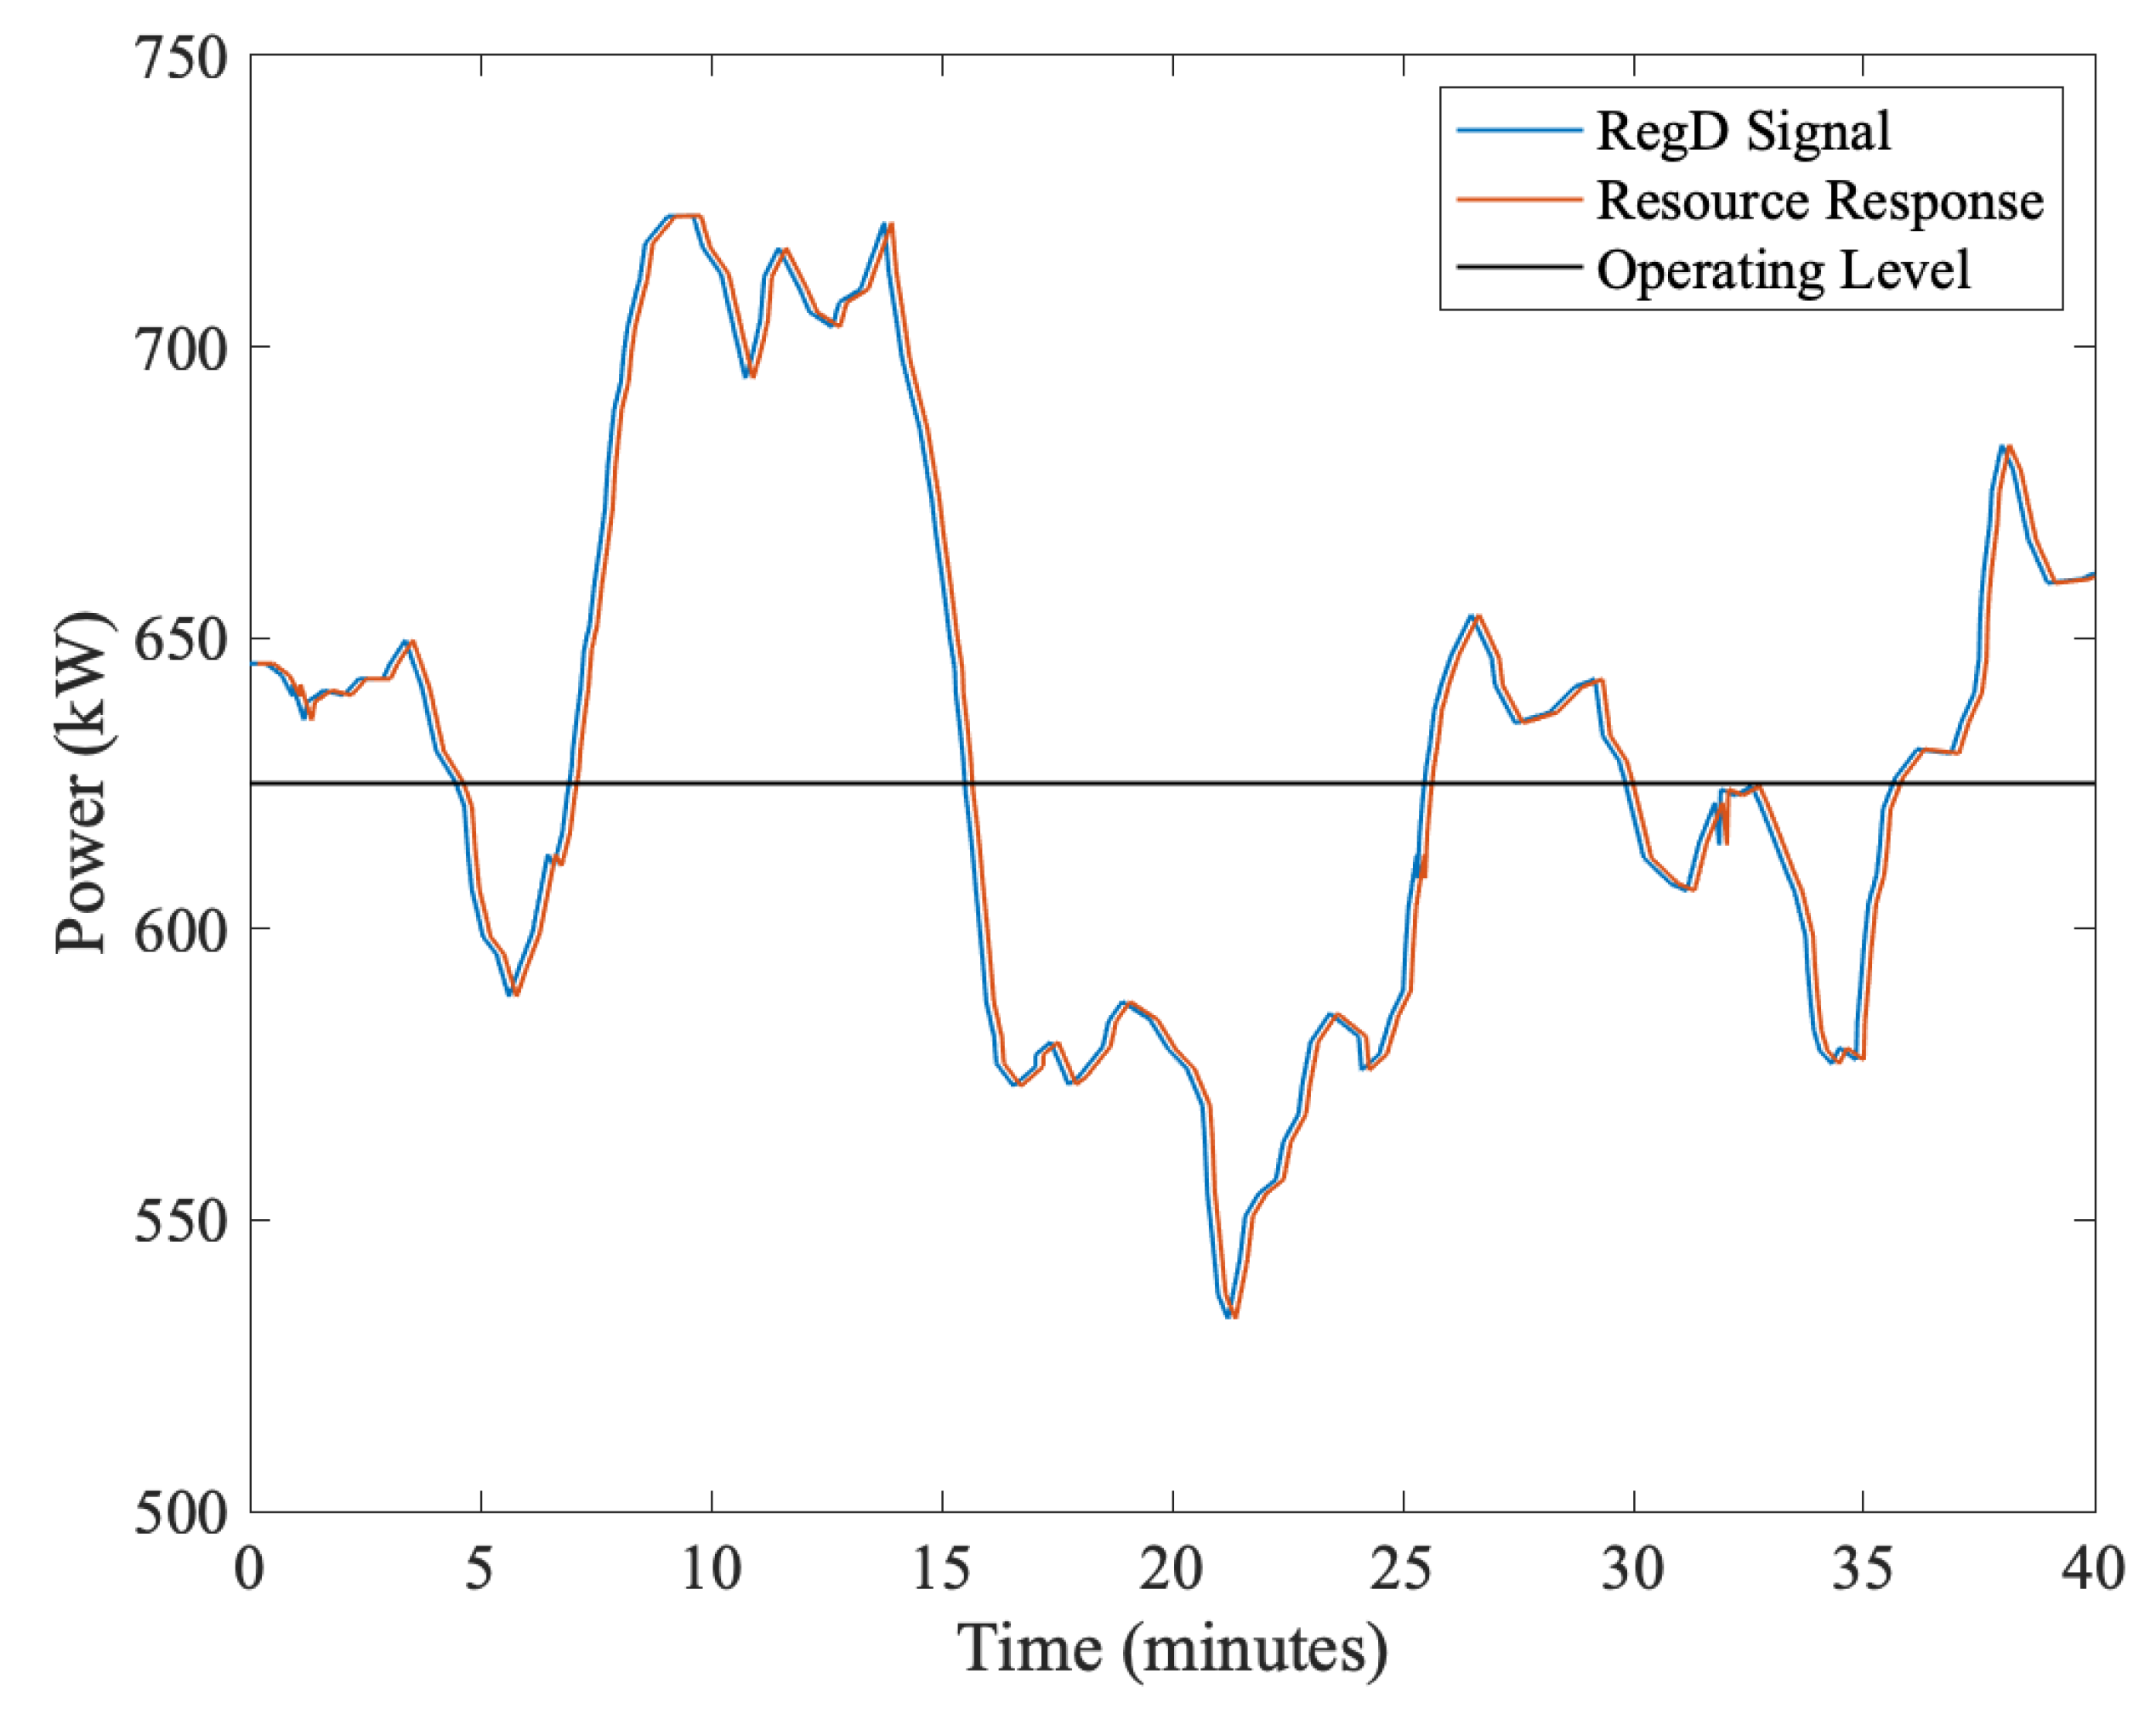
Figure 8.
Resource response of battery and hydro systems to the AGC signal for dynamic regulation (RegD) [27].
Figure 8.
Resource response of battery and hydro systems to the AGC signal for dynamic regulation (RegD) [27].


Table 1.
The FR performance scores for a theoretical lighting resource.
| Variable | Value |
|---|---|
| Delay | 0.9660 |
| Accuracy | 0.9667 |
| Precision | 0.9993 |
| Performance | 0.9773 |
Table 2.
Comparison of RTO regulation markets [19].
Table 2.
Comparison of RTO regulation markets [19].
| RTO | Requirements | Resources | Market Prices |
|---|---|---|---|
| PJM | 700 MW (peak), 525 MW (off-peak) | generators, storage, DR | $30.73/MWh |
| ISO NE | average 60 MW | generators only | $25.28/MWh |
| MISO | average 400 MW | mostly generators, | $7.49/MWh |
| small % battery and DR | |||
| ERCOT | RegUp: 459 MW | generators (CC), DR | RegUp $10.25/MWh |
| RegDown: 456 MW | RegDown $5.35/MWh | ||
| SPP | average 350 MW | mostly generators | RegUp $9.29/MWh |
| dispatchable wind | RegDown $8.93/MWh | ||
| CAISO | average 350 MW | generators, storage and DR | RegUp $4.64/MWh |
| RegDown $3.75/MWh | |||
| NYISO | average 220 MW | generators, storage, DR | $8.79/MWh |
© 2020 by the authors. Licensee MDPI, Basel, Switzerland. This article is an open access article distributed under the terms and conditions of the Creative Commons Attribution (CC BY) license (http://creativecommons.org/licenses/by/4.0/).
Share and Cite
MDPI and ACS Style
Karpilow, A.; Henze, G.; Beamer, W. Assessment of Commercial Building Lighting as a Frequency Regulation Resource. Energies 2020, 13, 613. https://doi.org/10.3390/en13030613
AMA Style
Karpilow A, Henze G, Beamer W. Assessment of Commercial Building Lighting as a Frequency Regulation Resource. Energies. 2020; 13(3):613. https://doi.org/10.3390/en13030613
Chicago/Turabian StyleKarpilow, Alexandra, Gregor Henze, and Walter Beamer. 2020. "Assessment of Commercial Building Lighting as a Frequency Regulation Resource" Energies 13, no. 3: 613. https://doi.org/10.3390/en13030613
Note that from the first issue of 2016, this journal uses article numbers instead of page numbers. See further details here.