Effect of Demagnetization on a Consequent Pole IPM Synchronous Generator


1
Faculty of Engineering, Universidad Autónoma de Yucatán, Mérida 97000, Mexico
2
Department of Electrical Machines, Drives and Measurements, Wroclaw University of Science and Technology, 50-105 Wroclaw, Poland
*
Author to whom correspondence should be addressed.
Energies 2020, 13(23), 6371; https://doi.org/10.3390/en13236371
Submission received: 13 November 2020
/
Revised: 27 November 2020
/
Accepted: 29 November 2020
/
Published: 2 December 2020
(This article belongs to the Special Issue Design and Application of Electrical Machines)
Abstract
:The design and analysis of a permanent magnet synchronous generator (PMSG) are presented. The interior permanent magnet (IPM) rotor was designed asymmetric and with the consequent pole approach. The basis for the design was a series-produced three-phase induction motor (IM) and neodymium iron boron (Nd-Fe-B) cuboid magnets were used for the design. For the partial demagnetization analysis, some of the magnets were extracted and the results are compared with the finite element analysis (FEA).
1. Introduction
In the last three decades, the advances in material sciences have brought about higher-energy density products (BHmax) in rare-earth permanent magnet materials, like neodymium iron boron (Nd-Fe-B) and samarium-cobalt (Sm-Co) [1,2]. This characteristic allowed electrical machines to have higher efficiency and to be more compact [3]. Nonetheless, special attention must be taken in the design of electrical machines with Nd-Fe-B magnets since they have temperature-dependent magnetization curves with lower coercivity than other materials [4]. Further, some novel applications like magnetic refrigeration or refrigeration by the magnetocaloric effect require the magnetic material to work at extreme temperatures, as stated in [5]. For that reason, Nd-Fe-B magnets can suffer irreversible demagnetization or partial demagnetization at high temperatures (>80 °C), and this is even below the Curie temperature, which is much higher, as explained in [6].
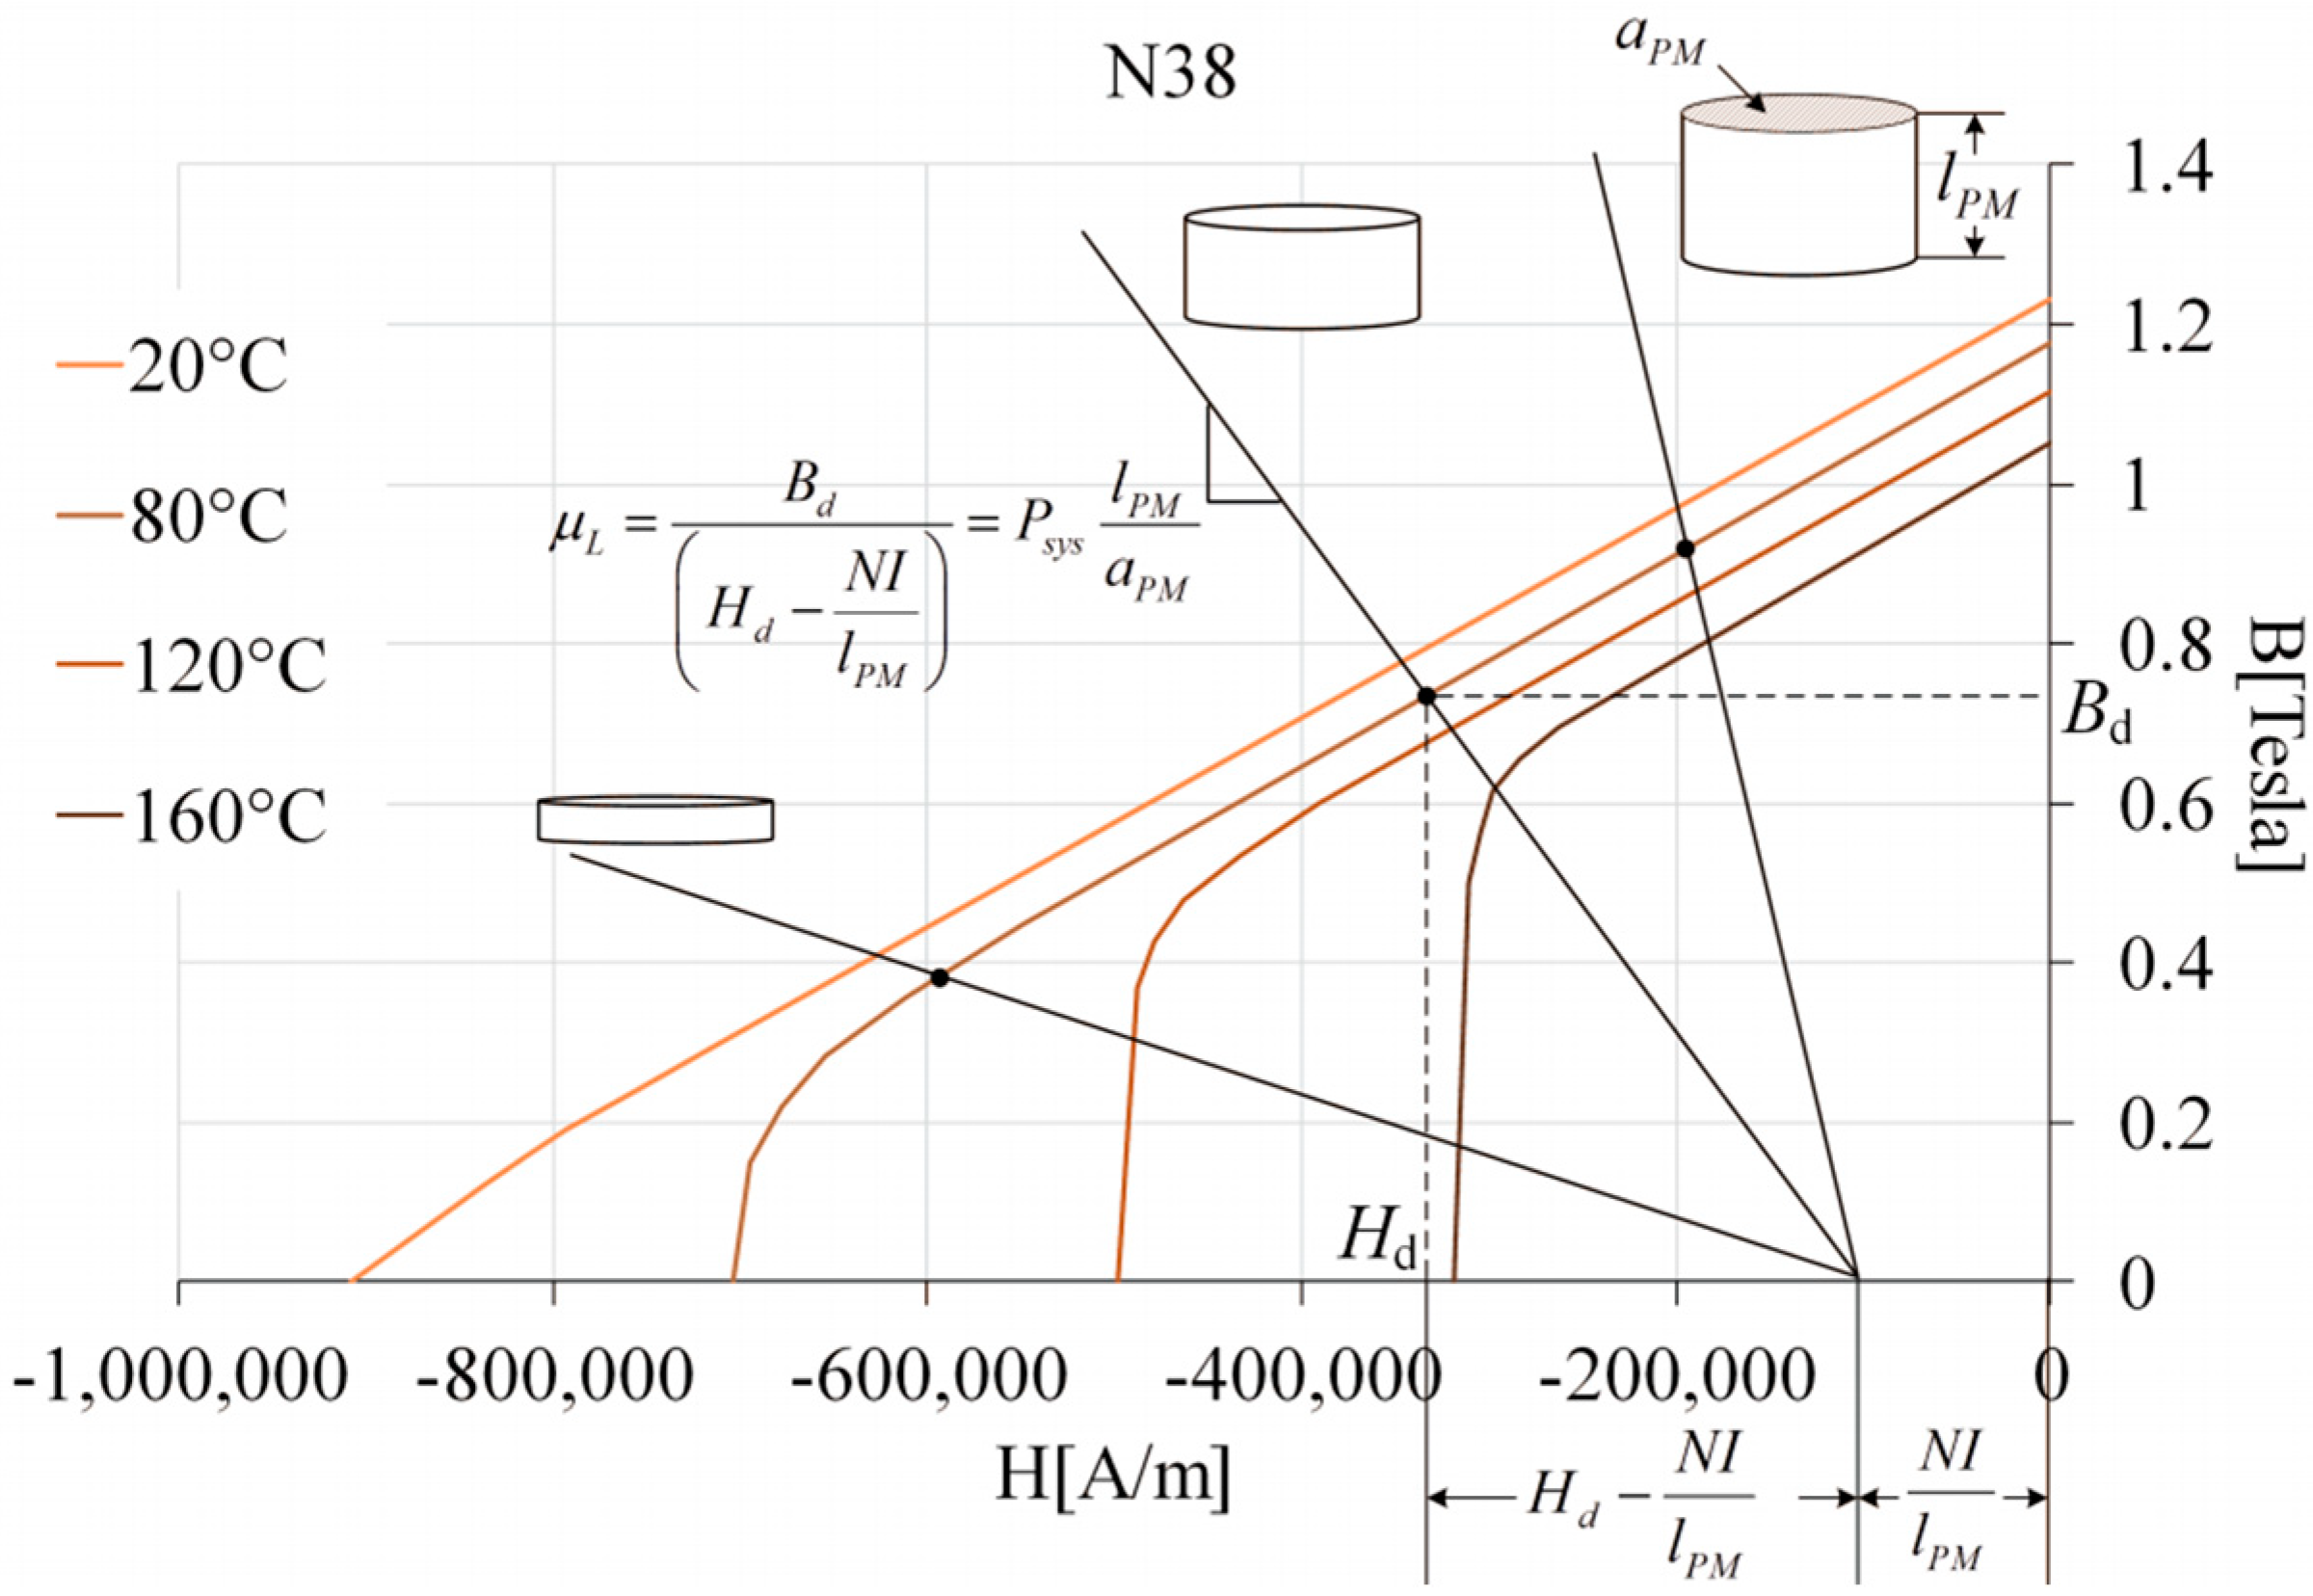
In Figure 1, three operating points over the 80 °C curve are shown. The difference between these depends on the magnet shape. Notice that the slope of the line crossing the B-H curve (load line) is calculated as
where μL is the permeance coefficient, Bd is the operating point’s magnetic flux density, Hd is the permanent magnet’s field intensity, N is the number of turns in the coil, I is the current in amperes, lPM is the length of the permanent magnet, Psys is the system’s permeance, and aPM is the permanent magnet’s area transverse to the magnetic flux. These are important figures of merit when designing a permanent magnet machine since, as explained before, the volume (mass) of rare earth’s permanent magnet impacts directly on the machine cost.
In Figure 2, a simplified magnetic circuit C1 is shown. Note that the slope of the load line when the current I = 0 depends on the geometry of the magnet (aPM, lPM) and the geometry of the air gap (ag, lg). This is a very important relation since the operating point should not lie close to the B-H curve’s knee, as this would mean that the magnet is at demagnetization risk because, as shown in Figure 1, the load line will move to the left as a response to the armature reaction; in other words, the opposing magnetic field produced by the machine coils will move the operating point further to the left perhaps after the knee point, causing demagnetization. This is a very similar effect to the one described for small ferromagnetic material samples in cylindrical shapes from [7,8,9].
This paper shows the design and measurements of an interior permanent magnet (IPM) rotor for a permanent magnet synchronous generator (PMSG). The finite element analysis (FEA) is conducted based on the designed geometry and then validated with measurements performed in the laboratory. Finally, some results from the FEA with a partially demagnetized rotor are presented and discussed.
2. Design of the PMSG
The design of the PMSG was based on the series-produced three-phase induction motor (IM) of 1.5 kW, the Sh90-L4 [10]. The housing, stator geometry, and windings are the same as the IM. The parameters of the IM are presented in Table 1. The air gap of the PMSG is 0.5 mm and therefore the rotor has 81 mm diameter with the same 30 mm diameter shaft. The Sh90L-4 IM has a 0.3 mm air gap but it is common for permanent magnet machines to have a bigger air gap.
The magnets available for the design exploration were 18 by 4 by 30 mm rectangular cuboid N38SH Nd-Fe-B magnets, where the rating SH refers to a suggested maximum operating temperature of 150 °C (see [11]). This is due to the magnetic material powder’s content of dysprosium (Dy) which makes the magnet more resistant to demagnetization but at the same time more expensive, since Dy is even more expensive than neodymium.
In Figure 3, the W shape of the consequent poles is shown. The W shape was selected due to its field-focusing abilities and low total harmonic distortion (THD) of the back EMF, as studied in [12].
Notice in Figure 3 that the upper and lower poles are not symmetrical. This was done on purpose to lower even further the THD of the back EMF and cogging torque. Further, notice that the rotor has 4 poles but only two W shapes are visible. This is because of the “consequent pole” approach [13], sometimes also called induced pole in the literature [14], that was used in the design.
A detailed explanation of the design process and optimization of the W shape’s angles was published in [15]. One of the most important issues of the process was the design space delimited by the shaft (inner circle) and the dotted line (Figure 4). This limit is given by the rotor diameter of 81 mm (outer circle) minus a bridge or small part of the steel sheet lamination that will hold the magnets inside the rotor. The minimum size for this bridge is given by the mechanical strength of the steel sheet from which the rotor laminations are cut, but also from the saturation due to the magnetic flux density since the flux should go through the stator and not through the bridge. For this project, a 0.5 mm bridge was chosen as the constraint for the design space, but also because the rotor laminations were cut by laser on a computer numerical controlled (CNC) machine whose precision is about ±0.1 mm. This distance is later analyzed by stress calculation in the FEA software to ensure a proper safety factor.
Moreover, in Figure 4, a relation between angle and angle is shown. These are angles between the magnets which form the W shape. In order to obtain the maximum flux density through the stator, the tip of the outer magnets in the W shape should be coincident with the dotted line.
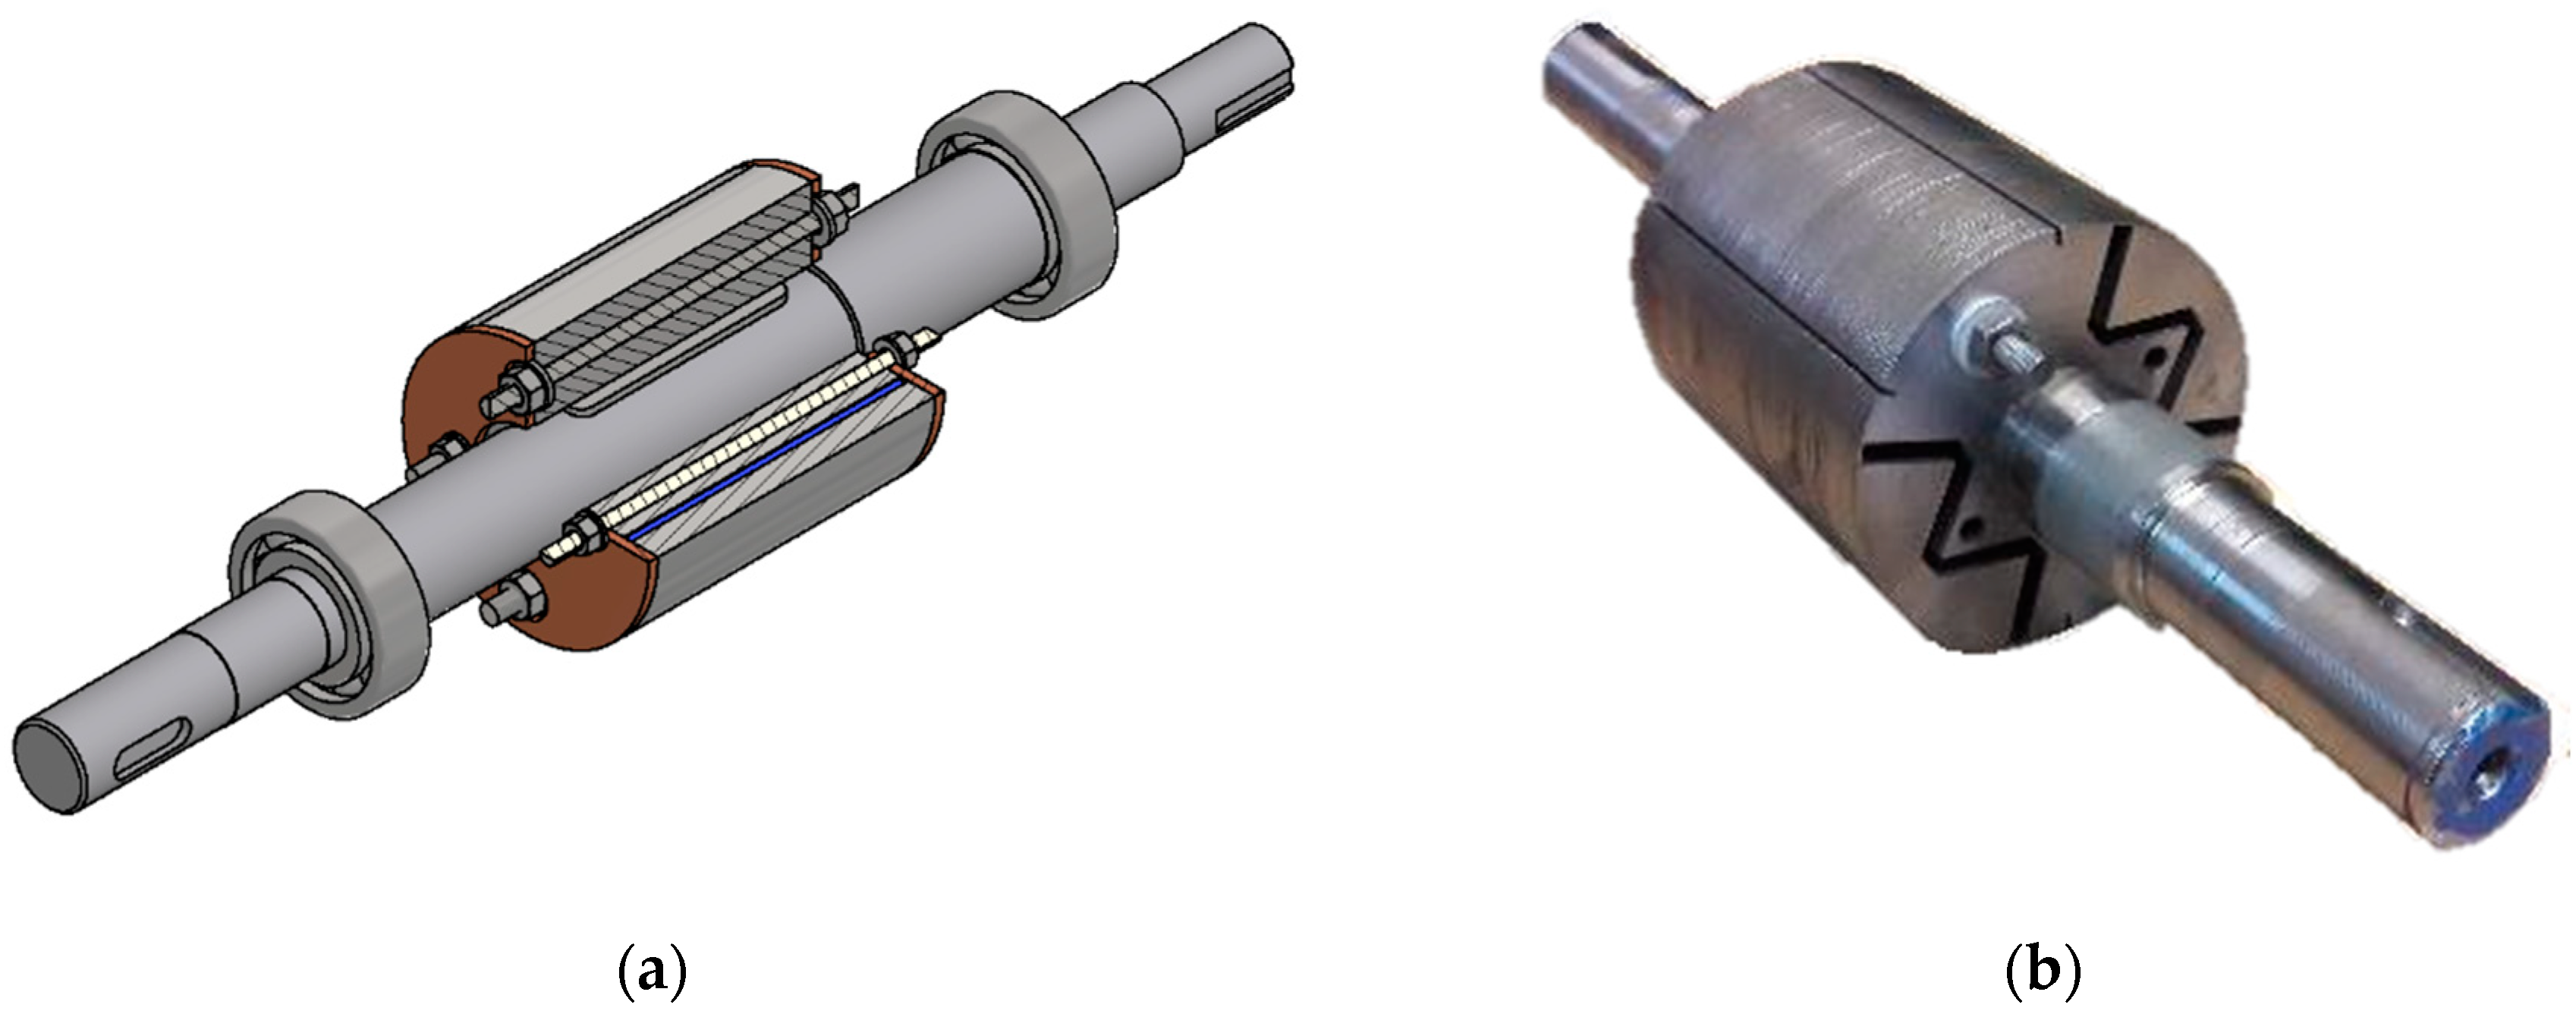
The rotor was built and tested in the laboratory in order to validate the FEA results. In Figure 5, the isometric view of the rotor is shown. Notice that it uses 4 threaded rods with hex nuts at both ends. Two of these rods are for holding the steel sheets together, and the other two are for holding the end plates at each end of the rotor stack. The space between the tip of the outer magnets and the air gap is determined by two factors. The first one is the precision of the laser cutter with which the prototype was manufactured. The second is the mechanical strength at high-speed rotation at which the generator may operate (1.2 times the maximum speed of 3000 rpm according to the norm IEC 60034 part 1). The stress on that space of the steel lamination, called the bridge, must be calculated to ensure a proper safety factor.
In Figure 6, the results of mechanical stress analyses are shown. During the first analysis, the rotor speed was 1.2 times the maximum speed (nmax = 3000 rpm) without any torque on the rotor shaft. During the second analysis, the rotor speed was equal to the rated speed and the shaft torque was 2 times the rated shaft torque (tn = 16 Nm). The maximum yield strength of M400-50A steel is 325 MPa. A safety factor equal to 2 allows a maximum strength of 162.5 MPa. The maximum mechanical stress during the analyses was about 43 MPa. This clearly demonstrates that the bridge will withstand the centrifugal forces of the generator spinning inside the nominal speed range and shaft torque even two times greater than the nominal one.
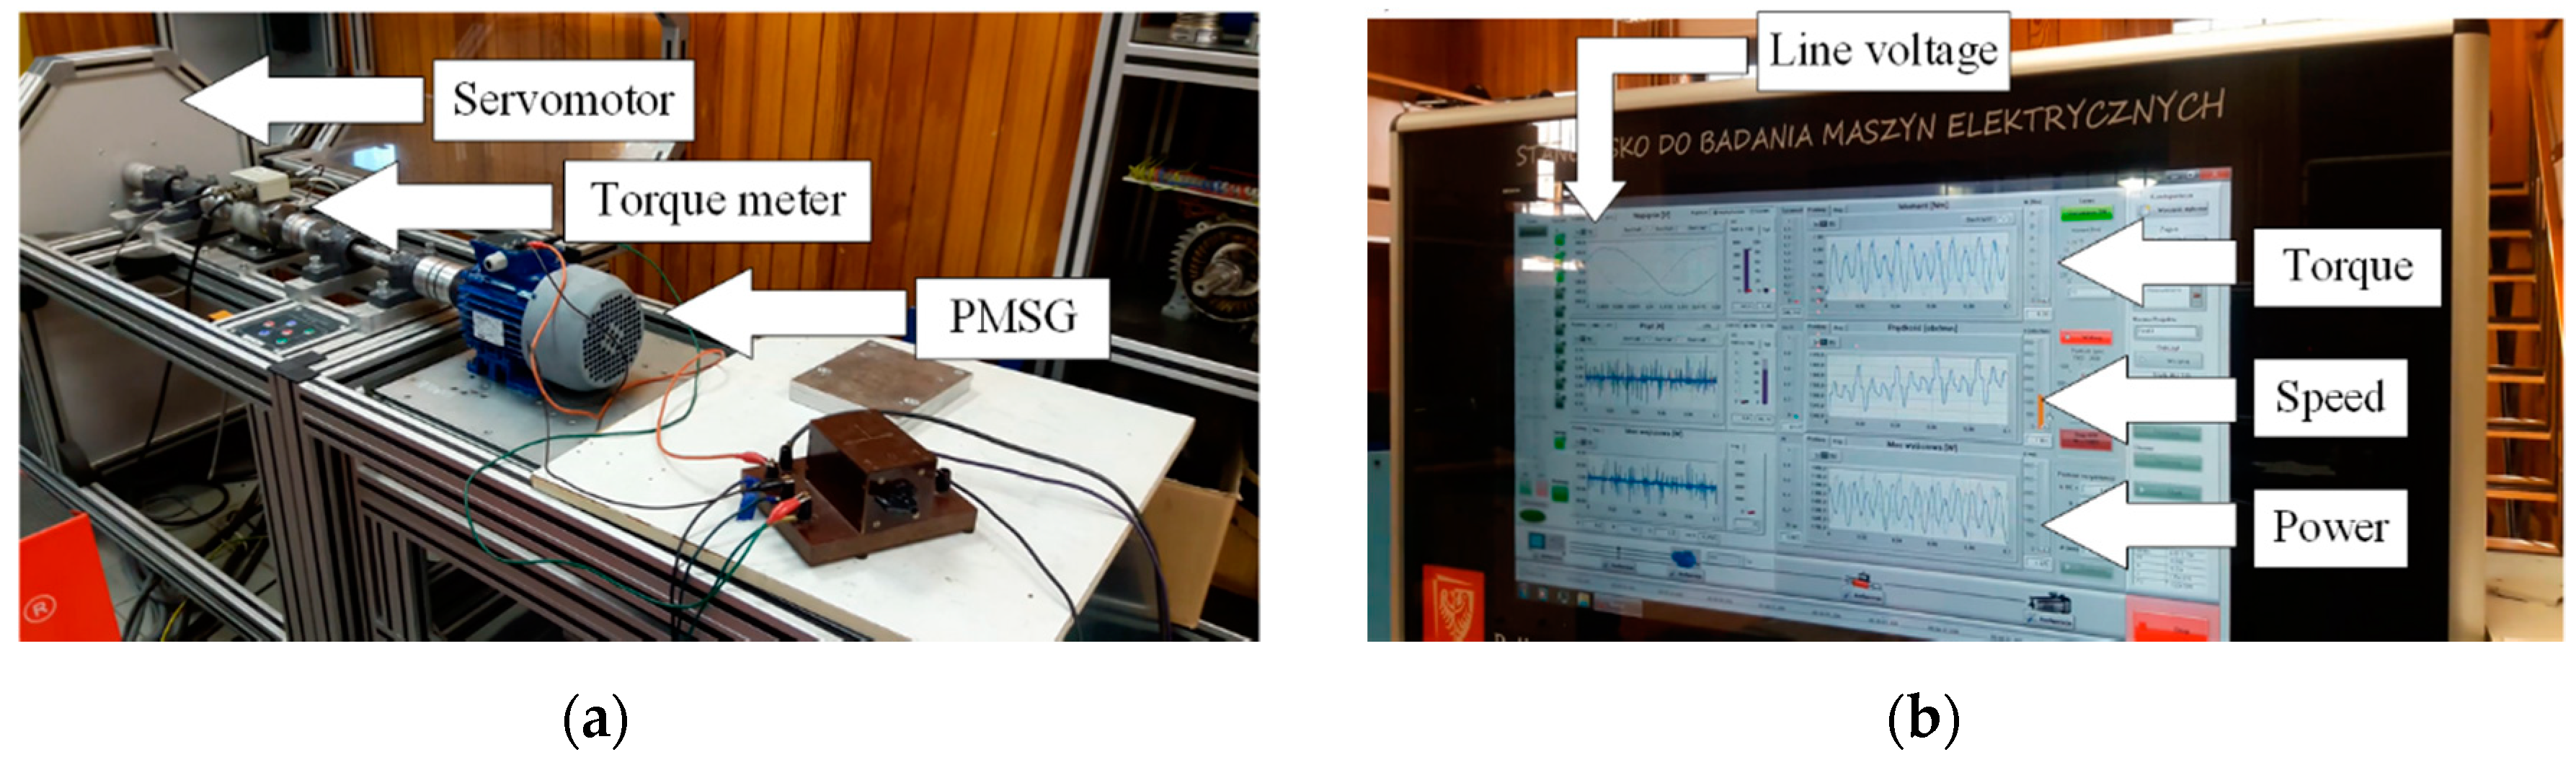
In Figure 7, the test setup is presented. The measurements were conducted in the Laboratory of Electric Machines at Wroclaw University of Science and Technology in Poland. The generator was driven by the servomotor which can work both as a motor or as a brake.
In Figure 8, the back EMF of the PMSG is shown. Notice the similarities between the FEA (dotted lines) and the measurements conducted at nominal speed.
FEA results predicted 90% efficiency when operating at 1500 rpm and a nominal input torque of 16 Nm. This can be confirmed by the measurements shown in Figure 9.
In Figure 10, the calculated efficiency map of the generator is shown. Notice that the calculated maximum efficiency is about 90%. This was corroborated by laboratory measurements also shown in Table 2. These measurements were conducted only with a three-phase resistor (56 ohm). The FEA results appear to be in good agreement with the measurements conducted in the laboratory. Once again, the similarities between the measurements and FEA transient results are evident.
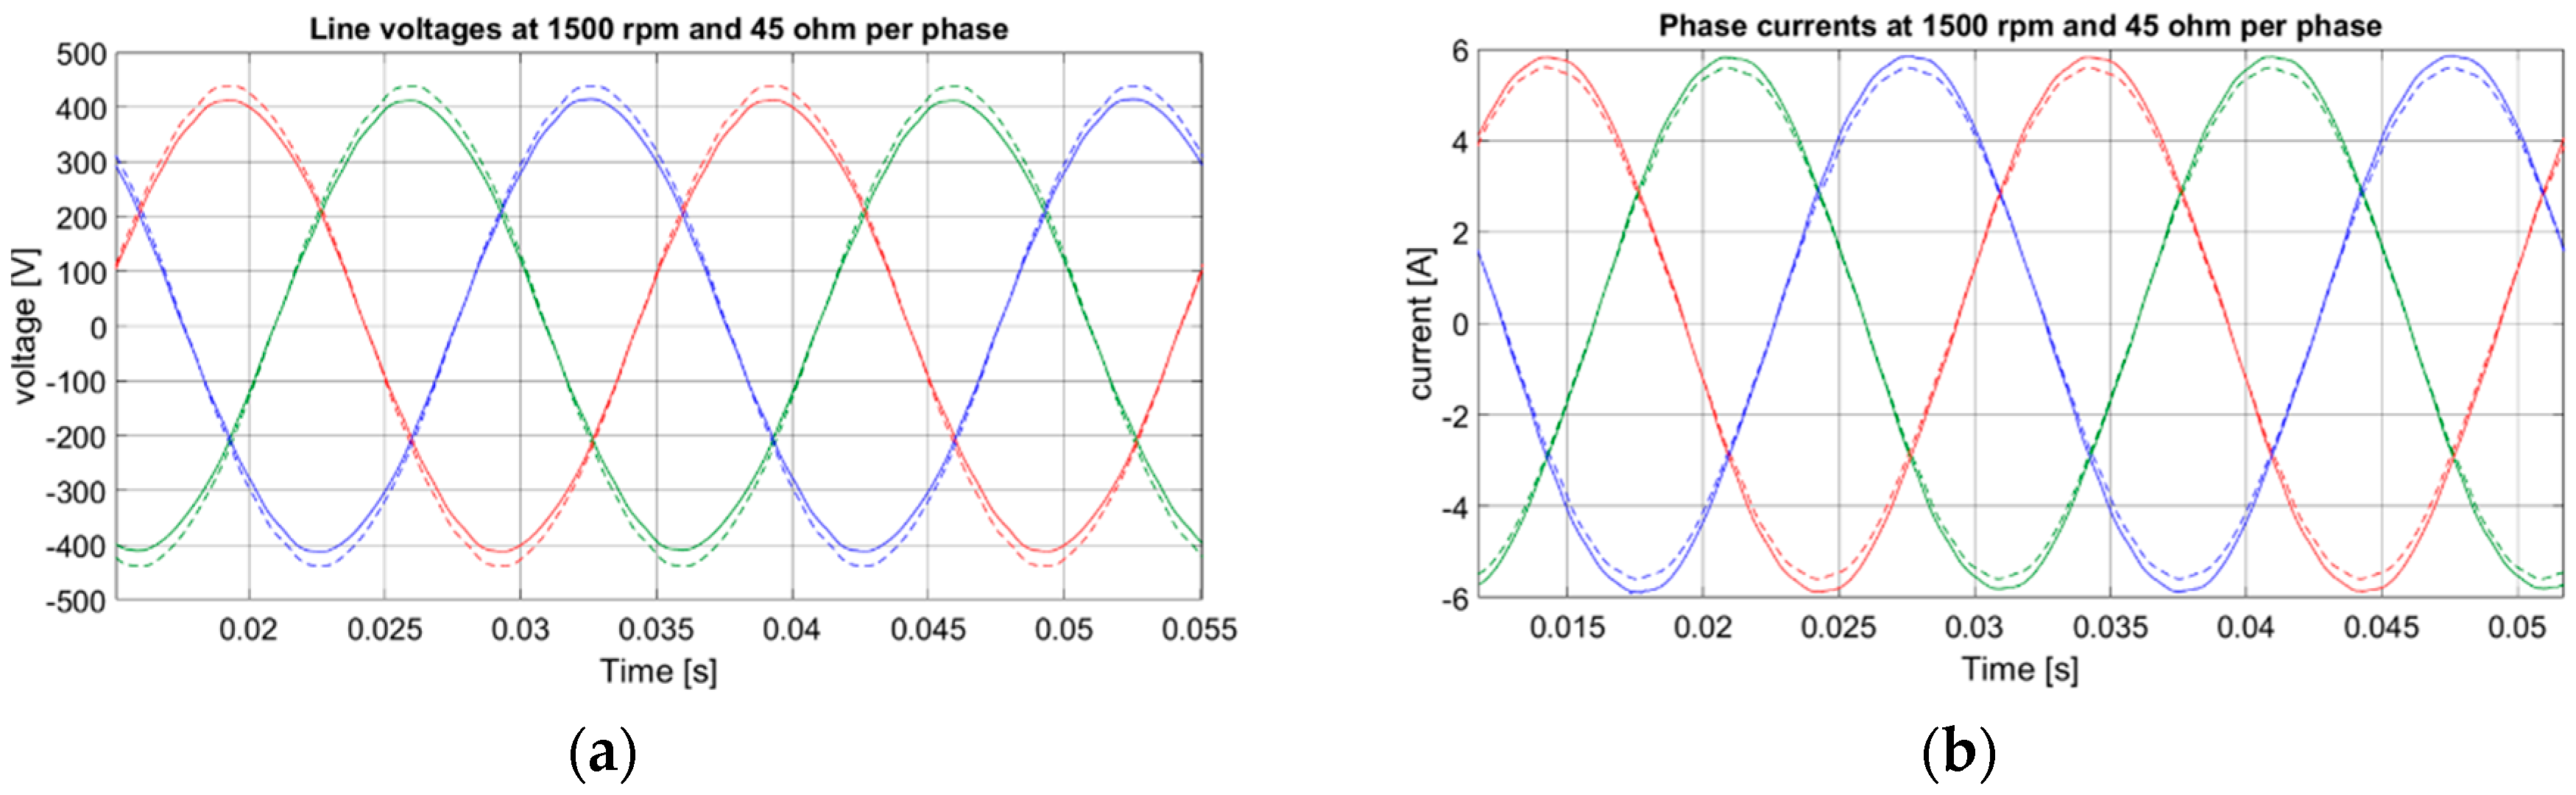
In Figure 11, the PMSG was loaded with a resistive load of 45 Ω per phase, providing 291 Vrms line voltage and 4.16 A phase current with an output power of 2.35 kW.
Once the validation was conducted, the PMSG FEA was used for the analysis of partial demagnetization’s effects. First, an experiment (transient simulation) was designed in order to demagnetize the PMSG in the time-stepping FEA.
3. Demagnetization Analysis
Once the validation was conducted, the PMSG FEA was used for the analysis of partial demagnetization’s effects. First, an experiment (transient simulation) was designed in order to demagnetize the PMSG in the time-stepping FEA. The results are analyzed and presented. Then, some validation of the demagnetization was conducted. The demagnetization model embedded in the FEA software was first presented in [16], where it is explained as a formulation of the Newton–Raphson method using the true Jacobian matrix.
3.1. Recoil Line
The phenomenon of demagnetization can be explained better with Figure 12. In Figure 12, the recoil line is shown in red. First, the magnet is at the operating point A, then a demagnetizing current moves the operating point to B; notice that the load line moves parallel to the original but further to the left thanks to the armature reactance (NI/lPM). Now, the operating point is below the knee of the B-H curve for 80 °C. When the opposing magnetic field is turned off, the magnet’s operating point returns to C. This means that the magnet has lost its original BHmax. Note that the recoil line is parallel to the linear part of the B-H curves.
Another failure mechanism that will obtain the same results (operating point C) is to augment the temperature from 80 to 160 °C. This is clear in Figure 12 because the operating point C coincides with the 160 °C B-H curve.
In Figure 13, a qualitative depiction of the hysteresis curves (B-H curves) for two different temperatures is shown. Notice the change in the remanence Br and coercivity Hc when the temperature rises. In the magnet’s data sheet, this rate of change (reversible temperature coefficients) is expressed as ΔBr and ΔHc, both expressed in %/°C. These figures of merit are useful for the non-linear model of the magnetic material in the FEA since they are used to calculate the new B-H curve when the temperature changes.
3.2. Three-Phase Short-Circuit Demagnetization
The FEA was connected to the circuit shown in Figure 14, in order to simulate a three-phase short-circuit fault that would generate the currents necessary to drive the PMSG magnets’ operating point below the knee point of the magnetization curves. This was first studied by Professor Jahns in [17] and more recently in [18]. In this last reference, the authors used the non-linear B-H characteristics of the magnets as a data for the FE simulation to improve the accuracy of the demagnetization analysis.
In this paper, a temperature-dependent demagnetization model of permanent magnets for FEA (first used in [19]) was used in the transient simulation, although the temperature was kept constant for each experiment, as shown in Table 3.
For each temperature shown in Table 3, a transient simulation was performed and the back EMF value in Vrms was calculated before the short circuit and after the short circuit. In Figure 15, the amplitude of the back EMF before and after the short circuit is shown. The difference is bigger at 150 °C because the knee point in the demagnetization curve is closer to the operating point, as shown in Figure 1. Further, notice the difference between the initial back EMF (before the short circuit) with magnets at 60 °C in Figure 15a and at 150 °C in Figure 15b. This difference is due to the different magnetization curves calculated by the model for each temperature.
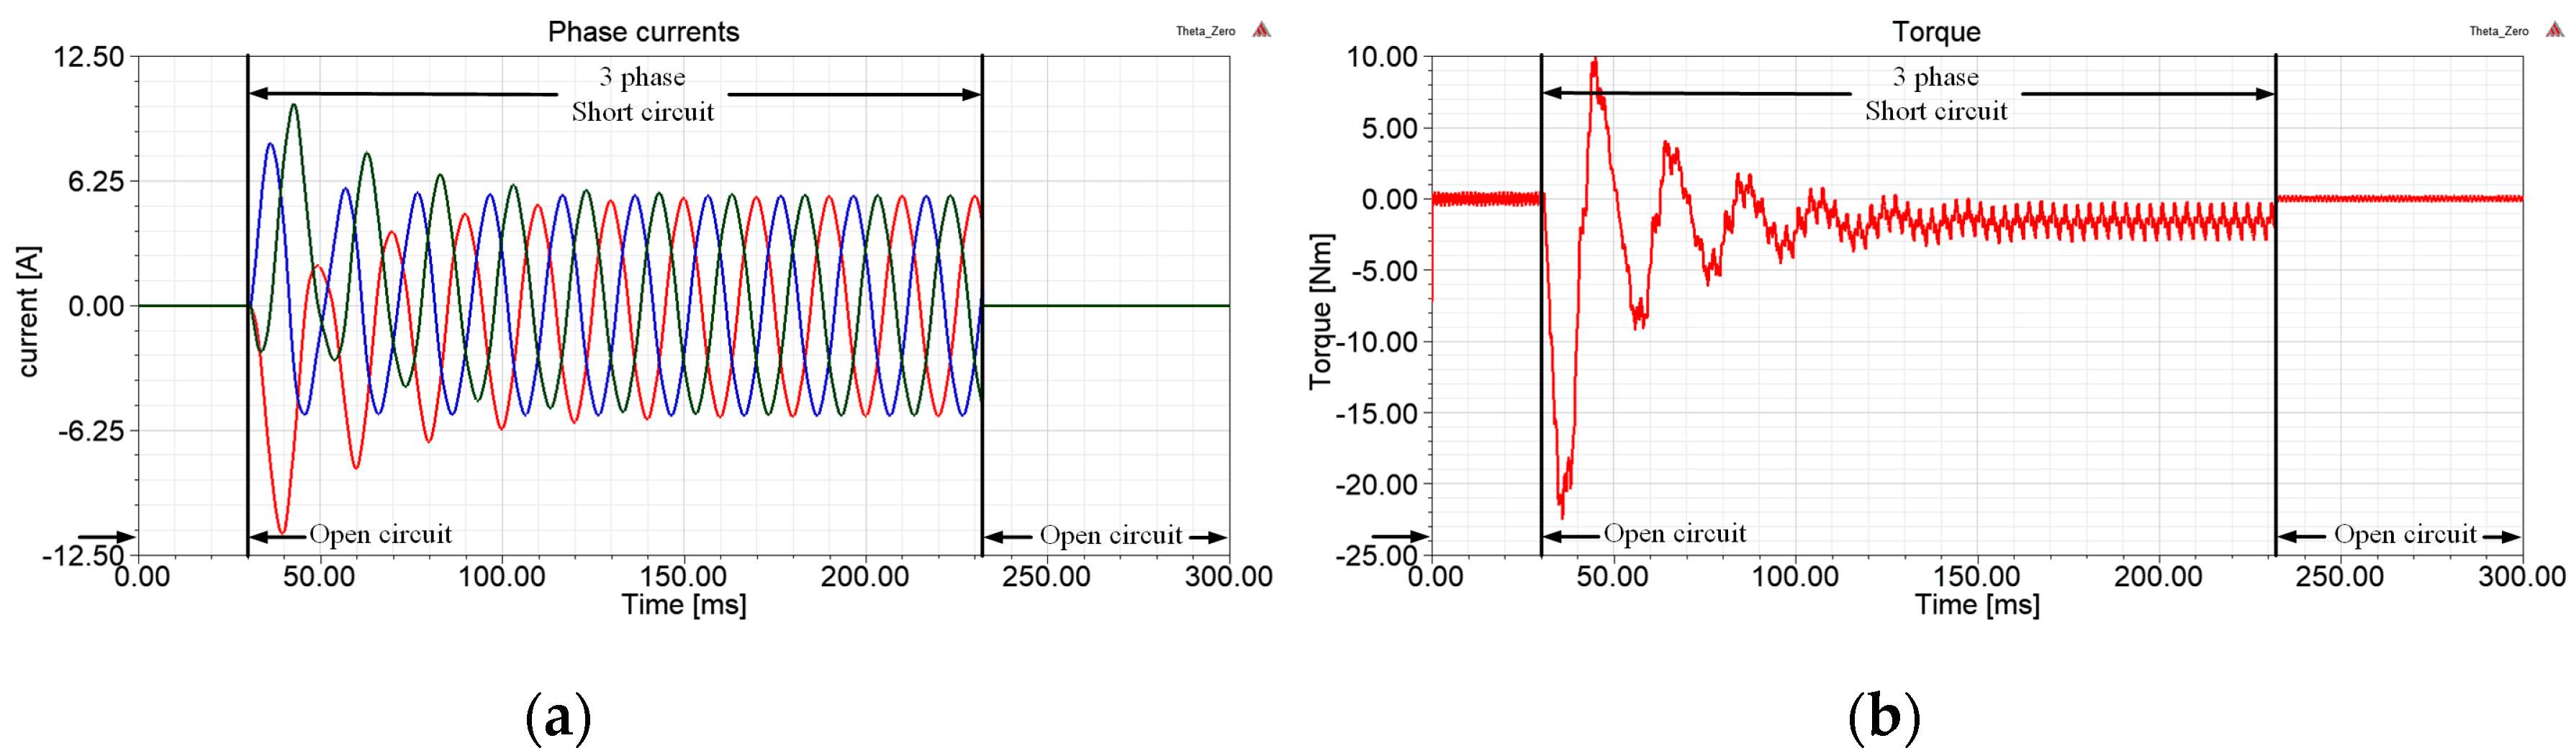
In Figure 16, the results of the first test at 60 °C are shown. Note that the tests were made with a constant speed input. This means that before the short circuit, during the short circuit, and after the short circuit, the speed is kept constant at 1500 rpm. In Figure 16b, the torque at the shaft is presented, and the PMSG behaves as an electromagnetic brake during the three-phase-to-ground fault, opposing the input torque with about a 5 Nm average.
In Figure 17, the results of the same test (open circuit–short circuit–open circuit) for a higher temperature of 150 °C are presented. Here, the opposing torque is only of about 2 Nm in the steady state (between 150 and 230 ms).
In Figure 18, the magnetic flux density distribution inside the magnets at 150 °C is shown. Notice in Figure 17b that the red circles indicate where the highest demagnetization has happened. If we take into account that the direction of rotation is counter-clockwise, then the results are in good agreement with the ones reported in [20,21]; this means the trailing edge of the magnets is the one that gets partially demagnetized first.
In Figure 19, the results for three analyses are summarized. This means two other similar tables to Table 3 were produced for 500 and 2500 rpm. Notice how after 130 °C, the difference in the back EMF before and after the short circuit becomes bigger than 50 Vrms, all the way to 170 Vrms at 160 °C. This indicates a very high demagnetization rate.
Further, in Figure 19, the other lines corresponding to the same analysis but for a different constant speed indicate that the speed of operation of the PMSG, before and during the fault, also has an impact on the level of demagnetization that the IPM machine will get. A bigger ΔVrms is worse. From Figure 19, it can be concluded that the PMSG can be operated up to 120 °C without the risk of high demagnetization in case of a fault, or even at higher temperatures but at low speed. Keep in mind that all the tests shown in this section were conducted at constant speed, namely no acceleration occurring during the fault.
In order to analyze the partial demagnetization of the W-shape PMSG, an experiment was conducted in the laboratory by taking out two of the cuboid magnets from the rotor. This is a common procedure widely used in the literature, e.g., [22,23,24]. The magnets that were taken out are shown in Figure 20. As mentioned in Section 2, the cuboid magnets are only 30 mm long; therefore, to fill the 90 mm rotor stack, three of them must be inserted in each hole of the W shape. The difference between those two measured cases is small. The difference becomes more evident when the Vrms is analyzed. For the healthy case, 394 Vrms back EMF is obtained. For the demagnetized rotor, only 382 Vrms is obtained.
4. Conclusions
The authors developed a novel PMSG on the basis of an IM (Sh90-L4). The PMSG was designed as an IPM with the same stator of the IM (overlapping, distributed three-phase windings). In order to save costs, an approach in the literature called “consequent pole” was adopted. Specifically, this means the usage of both sides of the magnets to avoid using double the number of magnets.
Analyses of the effects of the partial demagnetization of the W-shape PMSG are presented. By virtue of the FEA material’s non-linear properties, the demagnetization by short-circuit currents is studied. It was found that the demagnetization risk is higher when operating at speeds higher than nominal.
The magnet thickness was chosen not only to produce the necessary magnetic flux density in the air gap but also to avoid possible demagnetization, by having operating points close to the B-H curve’s knee. As was shown in the article, the selection of the N38SH material for the Nd-Fe-B magnets allowed for a continuous operation with magnet temperatures up to 100 °C with almost no risk of demagnetization.
These results demonstrate the need to simulate possible failure modes when designing a PMSG, especially one with Nd-Fe-B.
This work was part of the PhD thesis by the first author, were demagnetization effects of the PMSG with a voltage-source converter (VSC) was analysed [25].
Future work should include more experimental verifications of the demagnetization and measurements of the demagnetized rotor in order to better detect and assess this kind of fault.
Author Contributions
Methodology, software, validation, writing and visualization R.E.Q.P. Conceptualization, resources, project administration and data curation M.G. All authors have read and agreed to the published version of the manuscript.
Funding
R.E.Q.P. thanks the funding from the Mexican Council of Science and Technology CONACYT and the Department of Research, Innovation and Higher Education of the Yucatan State SIIES grant number 312140. Calculations have been carried out using resources provided by Wroclaw Centre for Networking and Supercomputing (http://wcss.pl), grant No. 400.
Conflicts of Interest
The authors declare no conflict of interest.
References
- Wang, A.; Li, S. Investigation of E-Core Modular Permanent MagnetWind Turbine. Energies 2020, 13, 1751. [Google Scholar] [CrossRef] [Green Version]
- Eriksson, S. Permanent Magnet Synchronous Machines. Energies 2019, 12, 2830. [Google Scholar] [CrossRef] [Green Version]
- Gutfleisch, O.; Willard, M.A.; Brück, E.; Chen, C.H.; Sankar, S.G.; Liu, J.P. Magnetic Materials and Devices for the 21st Century: Stronger, Lighter, and More Energy Efficient. Adv. Mater. 2011, 23, 821–842. [Google Scholar] [CrossRef] [PubMed]
- Cao, Z.; Li, W.; Li, J.; Zhang, X.; Li, D.; Zhang, M. Research on the Temperature Field of High-Voltage High Power Line Start Permanent Magnet Synchronous Machines with Different Rotor Cage Structure. Energies 2017, 10, 1829. [Google Scholar] [CrossRef] [Green Version]
- Zhang, H.; Gimaev, R.; Kovalev, B.; Kamilov, K.; Zverev, V.; Tishin, A. Review on the materials and devices for magnetic refrigeration in the temperature range of nitrogen and hydrogen liquefaction. Phys. B Condens. Matter 2019, 558, 65–73. [Google Scholar] [CrossRef]
- Zverev, V.I.; Gimaev, R.R.; Tishin, A.M.; Mudryk, Y.; Gschneidner, K.A.; Pecharsky, V.K. The role of demagnetization factor in determining the “true” value of the Curie temperature. J. Magn. Magn. Mater. 2011, 323, 2453–2457. [Google Scholar] [CrossRef]
- Joseph, R.I. Ballistic Demagnetizing Factor in Uniformly Magnetized Cylinders. J. Appl. Phys. 1966, 37, 4639. [Google Scholar] [CrossRef]
- Kobayashi, M.; Ishikawa, Y. Surface magnetic charge distributions and demagnetizing factors of circular cylinders. IEEE Trans. Magn. 1992, 28, 1810–1814. [Google Scholar] [CrossRef]
- Chen, D.-X. Demagnetizing factors of long cylinders with infinite susceptibility. J. Appl. Phys. 2001, 89, 3413–3415. [Google Scholar] [CrossRef]
- Indukta Electrical Machine Factory. Sh90-L4 Electrical Parameters. Available online: https://www.cantonigroup.com/celma/en/page/offer/details/1/146/Sh90L-4 (accessed on 11 September 2020).
- Supermagnete. What Temperatures Can Magnets Withstand? Frequently Asked Questions. Available online: https://www.supermagnete.de/eng/faq/What-temperatures-can-magnets-sustain (accessed on 3 September 2020).
- Gwozdziewicz, M. Limitation of torque ripple in medium power line start permanent magnet synchronous motor. Przegląd Elektrotechniczny 2017, 1, 3–6. [Google Scholar] [CrossRef]
- Tapia, J.; Leonardi, F.; Lipo, T. Consequent-pole permanent-magnet machine with extended field-weakening capability. IEEE Trans. Ind. Appl. 2003, 39, 1704–1709. [Google Scholar] [CrossRef] [Green Version]
- Ugale, R.T.; Pramanik, A.; Baka, S.; Dambhare, S.; Chaudhari, B.N. Induced pole rotor structure for line start permanent magnet synchronous motors. IET Electr. Power Appl. 2014, 8, 131–140. [Google Scholar] [CrossRef]
- Gwozdziewicz, M.; Quintal-Palomo, R.E. Induced pole permanent magnet synchronous generator. In Proceedings of the 2017 International Symposium on Electrical Machines (SME), Naleczow, Poland, 18–21 June 2017; Institute of Electrical and Electronics Engineers (IEEE): New York, NY, USA, 2017; pp. 1–4. [Google Scholar]
- Fu, W.N.; Ho, S.L. Dynamic Demagnetization Computation of Permanent Magnet Motors Using Finite Element Method with Normal Magnetization Curves. IEEE Trans. Appl. Supercond. 2010, 20, 851–855. [Google Scholar] [CrossRef]
- Welchko, B.; Jahns, T.; Soong, W.; Nagashima, J. IPM synchronous machine drive response to symmetrical and asymmetrical short circuit faults. IEEE Trans. Energy Convers. 2003, 18, 291–298. [Google Scholar] [CrossRef] [Green Version]
- Choi, G.; Jahns, T.M. Interior permanent magnet synchronous machine rotor demagnetization characteristics under fault conditions. In Proceedings of the 2013 IEEE Energy Conversion Congress and Exposition, Denver, CO, USA, 15–19 September 2013; pp. 2500–2507. [Google Scholar] [CrossRef]
- Zhou, P.; Lin, D.; Xiao, Y.; Lambert, N.; Rahman, M.A. Temperature-Dependent Demagnetization Model of Permanent Magnets for Finite Element Analysis. IEEE Trans. Magn. 2012, 48, 1031–1034. [Google Scholar] [CrossRef]
- Kim, K.-T.; Lee, Y.-S.; Hur, J. Transient Analysis of Irreversible Demagnetization of Permanent-Magnet Brushless DC Motor with Interturn Fault Under the Operating State. IEEE Trans. Ind. Appl. 2014, 50, 3357–3364. [Google Scholar] [CrossRef]
- Kim, H.K.; Hur, J. Dynamic Characteristic Analysis of Irreversible Demagnetization in SPM- and IPM-Type BLDC Motors. IEEE Trans. Ind. Appl. 2017, 53, 982–990. [Google Scholar] [CrossRef]
- Roux, W.L.; Harley, R.G.; Habetler, T.G. Detecting rotor faults in permanent magnet synchronous machines. In Proceedings of the 4th IEEE International Symposium on Diagnostics for Electric Machines, Power Electronics and Drives, SDEMPED 2003, Atlanta, GA, USA, 24–26 August 2003; Institute of Electrical and Electronics Engineers (IEEE): New York, NY, USA, 2003; Volume 22, pp. 198–203. [Google Scholar]
- Yang, Z.; Shi, X.; Krishnamurthy, M. Vibration monitoring of PM synchronous machine with partial demagnetization and inter-turn short circuit faults. In Proceedings of the 2014 IEEE Transportation Electrification Conference and Expo (ITEC), Dearborn, MI, USA, 15–18 June 2014; pp. 1–6. [Google Scholar] [CrossRef]
- Park, Y.; Fernandez, D.; Bin Lee, S.; Hyun, D.; Jeong, M.; Kommuri, S.K.; Cho, C.; Reigosa, D.D.; Briz, F. Online Detection of Rotor Eccentricity and Demagnetization Faults in PMSMs Based on Hall-Effect Field Sensor Measurements. IEEE Trans. Ind. Appl. 2019, 55, 2499–2509. [Google Scholar] [CrossRef]
- Quintal Palomo, R. Operation and Faults Analysis of energy-Saving Permanent Magnet Synchronous Generator for Small Wind Turbine. Ph.D Thesis, Wroclaw University of Science and Technology, Wroclaw, Poland, 2020. [Google Scholar]
Figure 1.
Three operating points for three different permeance coefficients.

Figure 2.
C-core and load line when I = 0 A.

Figure 3.
Transverse view of the PMSG geometry.

Figure 4.
The PMSG parametrized rotor design space limitation.

Figure 5.
Isometric view of: (a) the designed rotor and (b) the built rotor without magnets.

Figure 6.
Results of the mechanical FEA: (a) with rotor speed n = 2.0 nn and shaft torque t = 0, (b) with rotor speed n = 1.0 nn and shaft torque t = 2 tn.
Figure 6.
Results of the mechanical FEA: (a) with rotor speed n = 2.0 nn and shaft torque t = 0, (b) with rotor speed n = 1.0 nn and shaft torque t = 2 tn.

Figure 7.
Laboratory: (a) test bench and (b) measurement’s display interface.

Figure 8.
Back EMF of the healthy PMSG; dotted lines are FEA results.

Figure 9.
Efficiency and reactive power ratio measurements at 1500 rpm.

Figure 10.
Efficiency and reactive power ratio measurements at 1500 rpm.

Figure 11.
Loaded PMSG: (a) line voltages and (b) currents; dotted lines are FEA results.

Figure 12.
Recoil line of the N38 magnet at 80 °C.

Figure 13.
Qualitative depiction of the B-H curves under different temperatures.

Figure 14.
Maxwell’s Circuit Editor schematic; red rectangle shows the short circuit position.

Figure 15.
Back EMF before, during, and after the three-phase short circuit for (a) 60 °C and (b) 150 °C.
Figure 15.
Back EMF before, during, and after the three-phase short circuit for (a) 60 °C and (b) 150 °C.

Figure 16.
Open circuit–short circuit–open circuit test at 60 °C: (a) currents and (b) torque.

Figure 17.
Open circuit–short circuit–open circuit test at 150 °C: (a) currents and (b) torque.

Figure 18.
Magnetic flux density distribution inside the magnets: (a) at 150 °C before the fault and (b) after the fault.
Figure 18.
Magnetic flux density distribution inside the magnets: (a) at 150 °C before the fault and (b) after the fault.

Figure 19.
Back EMF difference (before and after the fault) at 3 different speeds.

Figure 20.
Back EMF measurements with: (a) healthy magnets and (b) partially demagnetized magnets.


Table 1.
Parameters of the induction motor (IM), which the permanent magnet synchronous generator (PMSG) is based on.
Table 1.
Parameters of the induction motor (IM), which the permanent magnet synchronous generator (PMSG) is based on.
| Phases | 3 |
|---|---|
| Nominal power | 1.5 kW |
| Nominal speed | 1410 rpm |
| Nominal frequency | 50 Hz |
| Nominal current | 3.5 A |
| Nominal torque | 10.16 Nm |
| Number of poles | 4 |
| Stator Slots | 36 |
| Shaft diameter | 30 mm |
Table 2.
Results of the investigated generator at 1500 rpm and 56 ohm load.
| Pmech [W] | Line Voltage [Vrms] | Current per Phase [Arms] | Pelectrical [W] | Efficiency [%] | |
|---|---|---|---|---|---|
| FEA | 2530 | 320 | 3.603 | 2275 | 89.0 |
| Measurements | 2530 | 316 | 3.661 | 2250 | 88.9 |
Table 3.
Back EMF at 1500 rpm before and after the three-phase short circuit.
| Before | After | |
|---|---|---|
| 60 °C | 416 Vrms | 415 Vrms |
| 70 °C | 413 Vrms | 412 Vrms |
| 80 °C | 410 Vrms | 408 Vrms |
| 90 °C | 407 Vrms | 404 Vrms |
| 100 °C | 403 Vrms | 399 Vrms |
| 110 °C | 400 Vrms | 392 Vrms |
| 120 °C | 396 Vrms | 382 Vrms |
| 130 °C | 392 Vrms | 367 Vrms |
| 140 °C | 387 Vrms | 329 Vrms |
| 150 °C | 382 Vrms | 272 Vrms |
| 160 °C | 376 Vrms | 206 Vrms |
Publisher’s Note: MDPI stays neutral with regard to jurisdictional claims in published maps and institutional affiliations. |
© 2020 by the authors. Licensee MDPI, Basel, Switzerland. This article is an open access article distributed under the terms and conditions of the Creative Commons Attribution (CC BY) license (http://creativecommons.org/licenses/by/4.0/).
Share and Cite
MDPI and ACS Style
Palomo, R.E.Q.; Gwozdziewicz, M. Effect of Demagnetization on a Consequent Pole IPM Synchronous Generator. Energies 2020, 13, 6371. https://doi.org/10.3390/en13236371
AMA Style
Palomo REQ, Gwozdziewicz M. Effect of Demagnetization on a Consequent Pole IPM Synchronous Generator. Energies. 2020; 13(23):6371. https://doi.org/10.3390/en13236371
Chicago/Turabian StylePalomo, Roberto Eduardo Quintal, and Maciej Gwozdziewicz. 2020. "Effect of Demagnetization on a Consequent Pole IPM Synchronous Generator" Energies 13, no. 23: 6371. https://doi.org/10.3390/en13236371
Note that from the first issue of 2016, this journal uses article numbers instead of page numbers. See further details here.