Techno-Economic Optimization Analysis of an Autonomous Photovoltaic Power System for a Shoreline Electrode Station of HVDC Link: Case Study of an Electrode Station on the Small Island of Stachtoroi for the Attica–Crete Interconnection

 ,
, 
Abstract
:1. Introduction
- The optimization methods for the sizing of PVs and energy storage items, which can be:
- ➢
- ➢
- Numerical iterative, which simulate several combinations of stand-alone photovoltaic (SAPV) components size based on the electric load demand and meteorological data of a typical year in the hourly or daily time step, with one or more objective functions and conditions, as technical (i.e., loss of load probability, loss of energy expected, and PV panel tilt angle), economic (i.e., annualized life cost, net present value, levelized cost of energy, life cycle cost, and life cost unit cost), environmental (i.e., life cycle assessment, embodied energy, and CO2 emissions), and social (i.e., job creation) [2,12,13,14],
- ➢
- ➢
In any case the separating limits between the methods are not always clear, as a great number of methods, indicators, constraints, and data are involved [18,19,20,21,22,23,24,25,26]. Additional methods for off-grid hybrid power systems [27,28,29,30] and for energy storage systems [31,32] can be also found in the literature. - The configuration of PVs and ESSs, where the connection can be through either a DC bus for small electric load demand installation (smaller than 3 kW [10]) using DC–DC converters and energy storage chargers, or an AC bus for bigger electric load demand installation (bigger than 3 kW [10]) using rectifiers, inverters, and energy storage charger/de-chargers. The ESSs are:
- ➢
- ➢
- ➢
- ➢
- ➢
- ➢
- Combination of hydrogen storage tanks, a pumped-storage hydroelectric plant, and batteries [39].
In the case of energy storage combination the batteries are used for short-term operation, while the other storage systems for long-term operation. The addition of other sources beyond the PV one, such as wind turbine [21,38], diesel generators [36], hydro plants [21], biogas and biomass generators [4,21], fuel cells without an electrolyzer and storage tank [21], and forms of the hybrid autonomous power system instead of SAPV. - The design principles of SAPV for specific installations, as:
- The definition of the electrical and architectural design principles of SAPV configuration for the off-grid power supply of the load demand for the shoreline electrode station of a HVDC link with very high requirements of availability,
- The proposed techno-economic optimization process, which can jointly determine the type and the size of PVs and batteries from real technical data directly based on the equivalent annual total cost minimization taking into account all possible combinations iteratively. Even if this numerical method looks simple, it should overcome a large number of problems, i.e., the calculation of the capital cost for different PV configurations, which can include various converters, roof expanding, etc. In other relative research works [3,4,8,9,10,11,12,13,14,15,16,17] the discrete cost of the converters, roof expanding, etc., are ignored using typical capital cost functions for PVs panels, batteries, etc.
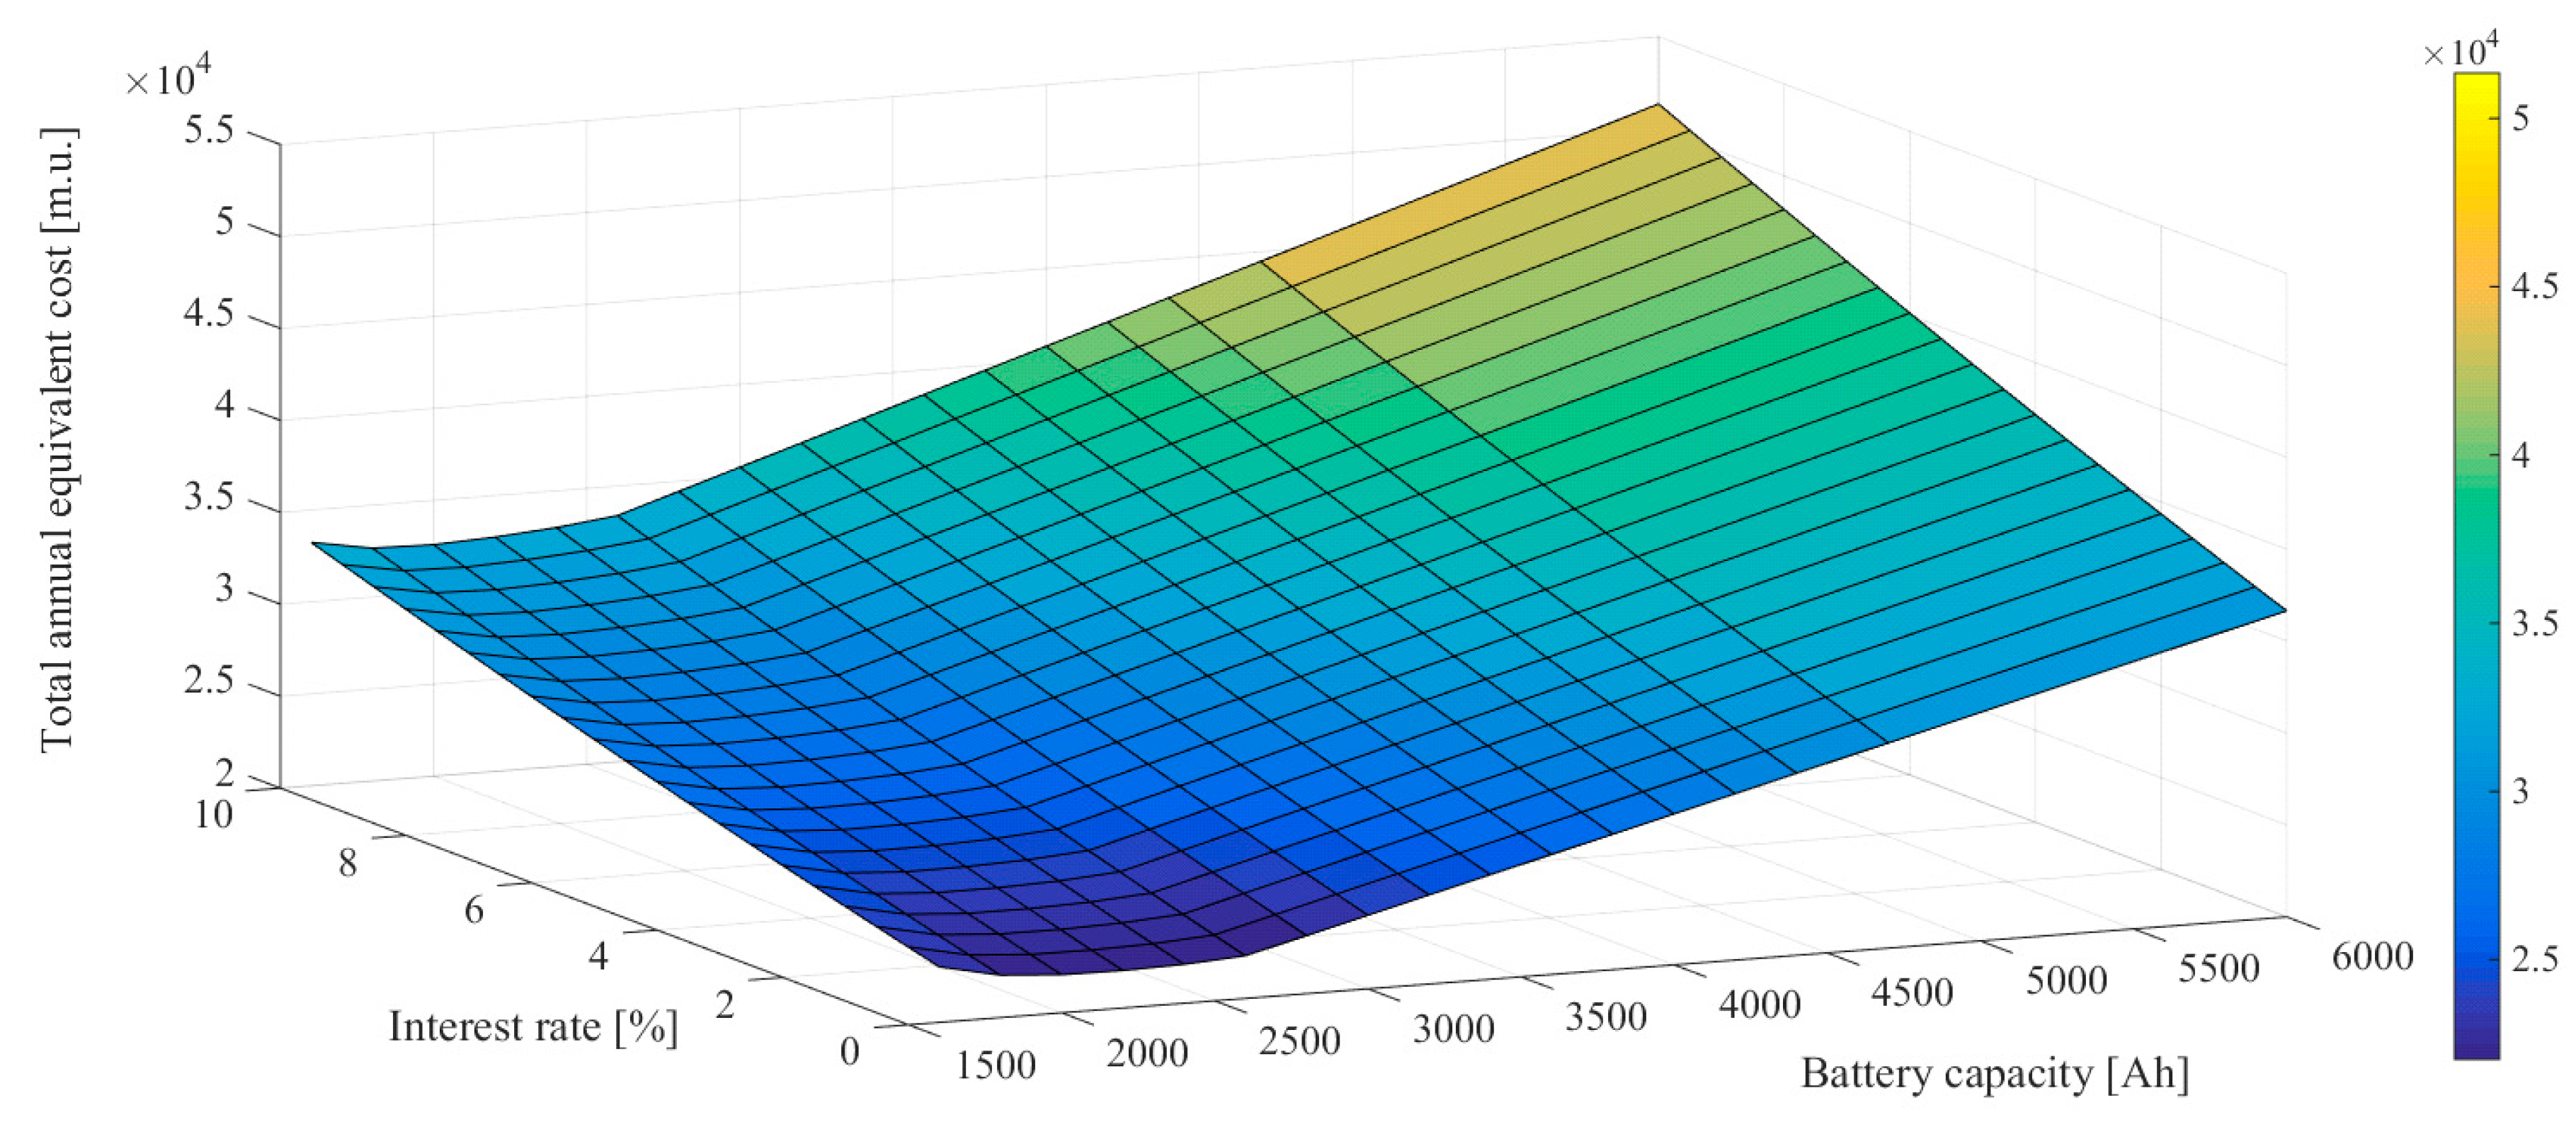
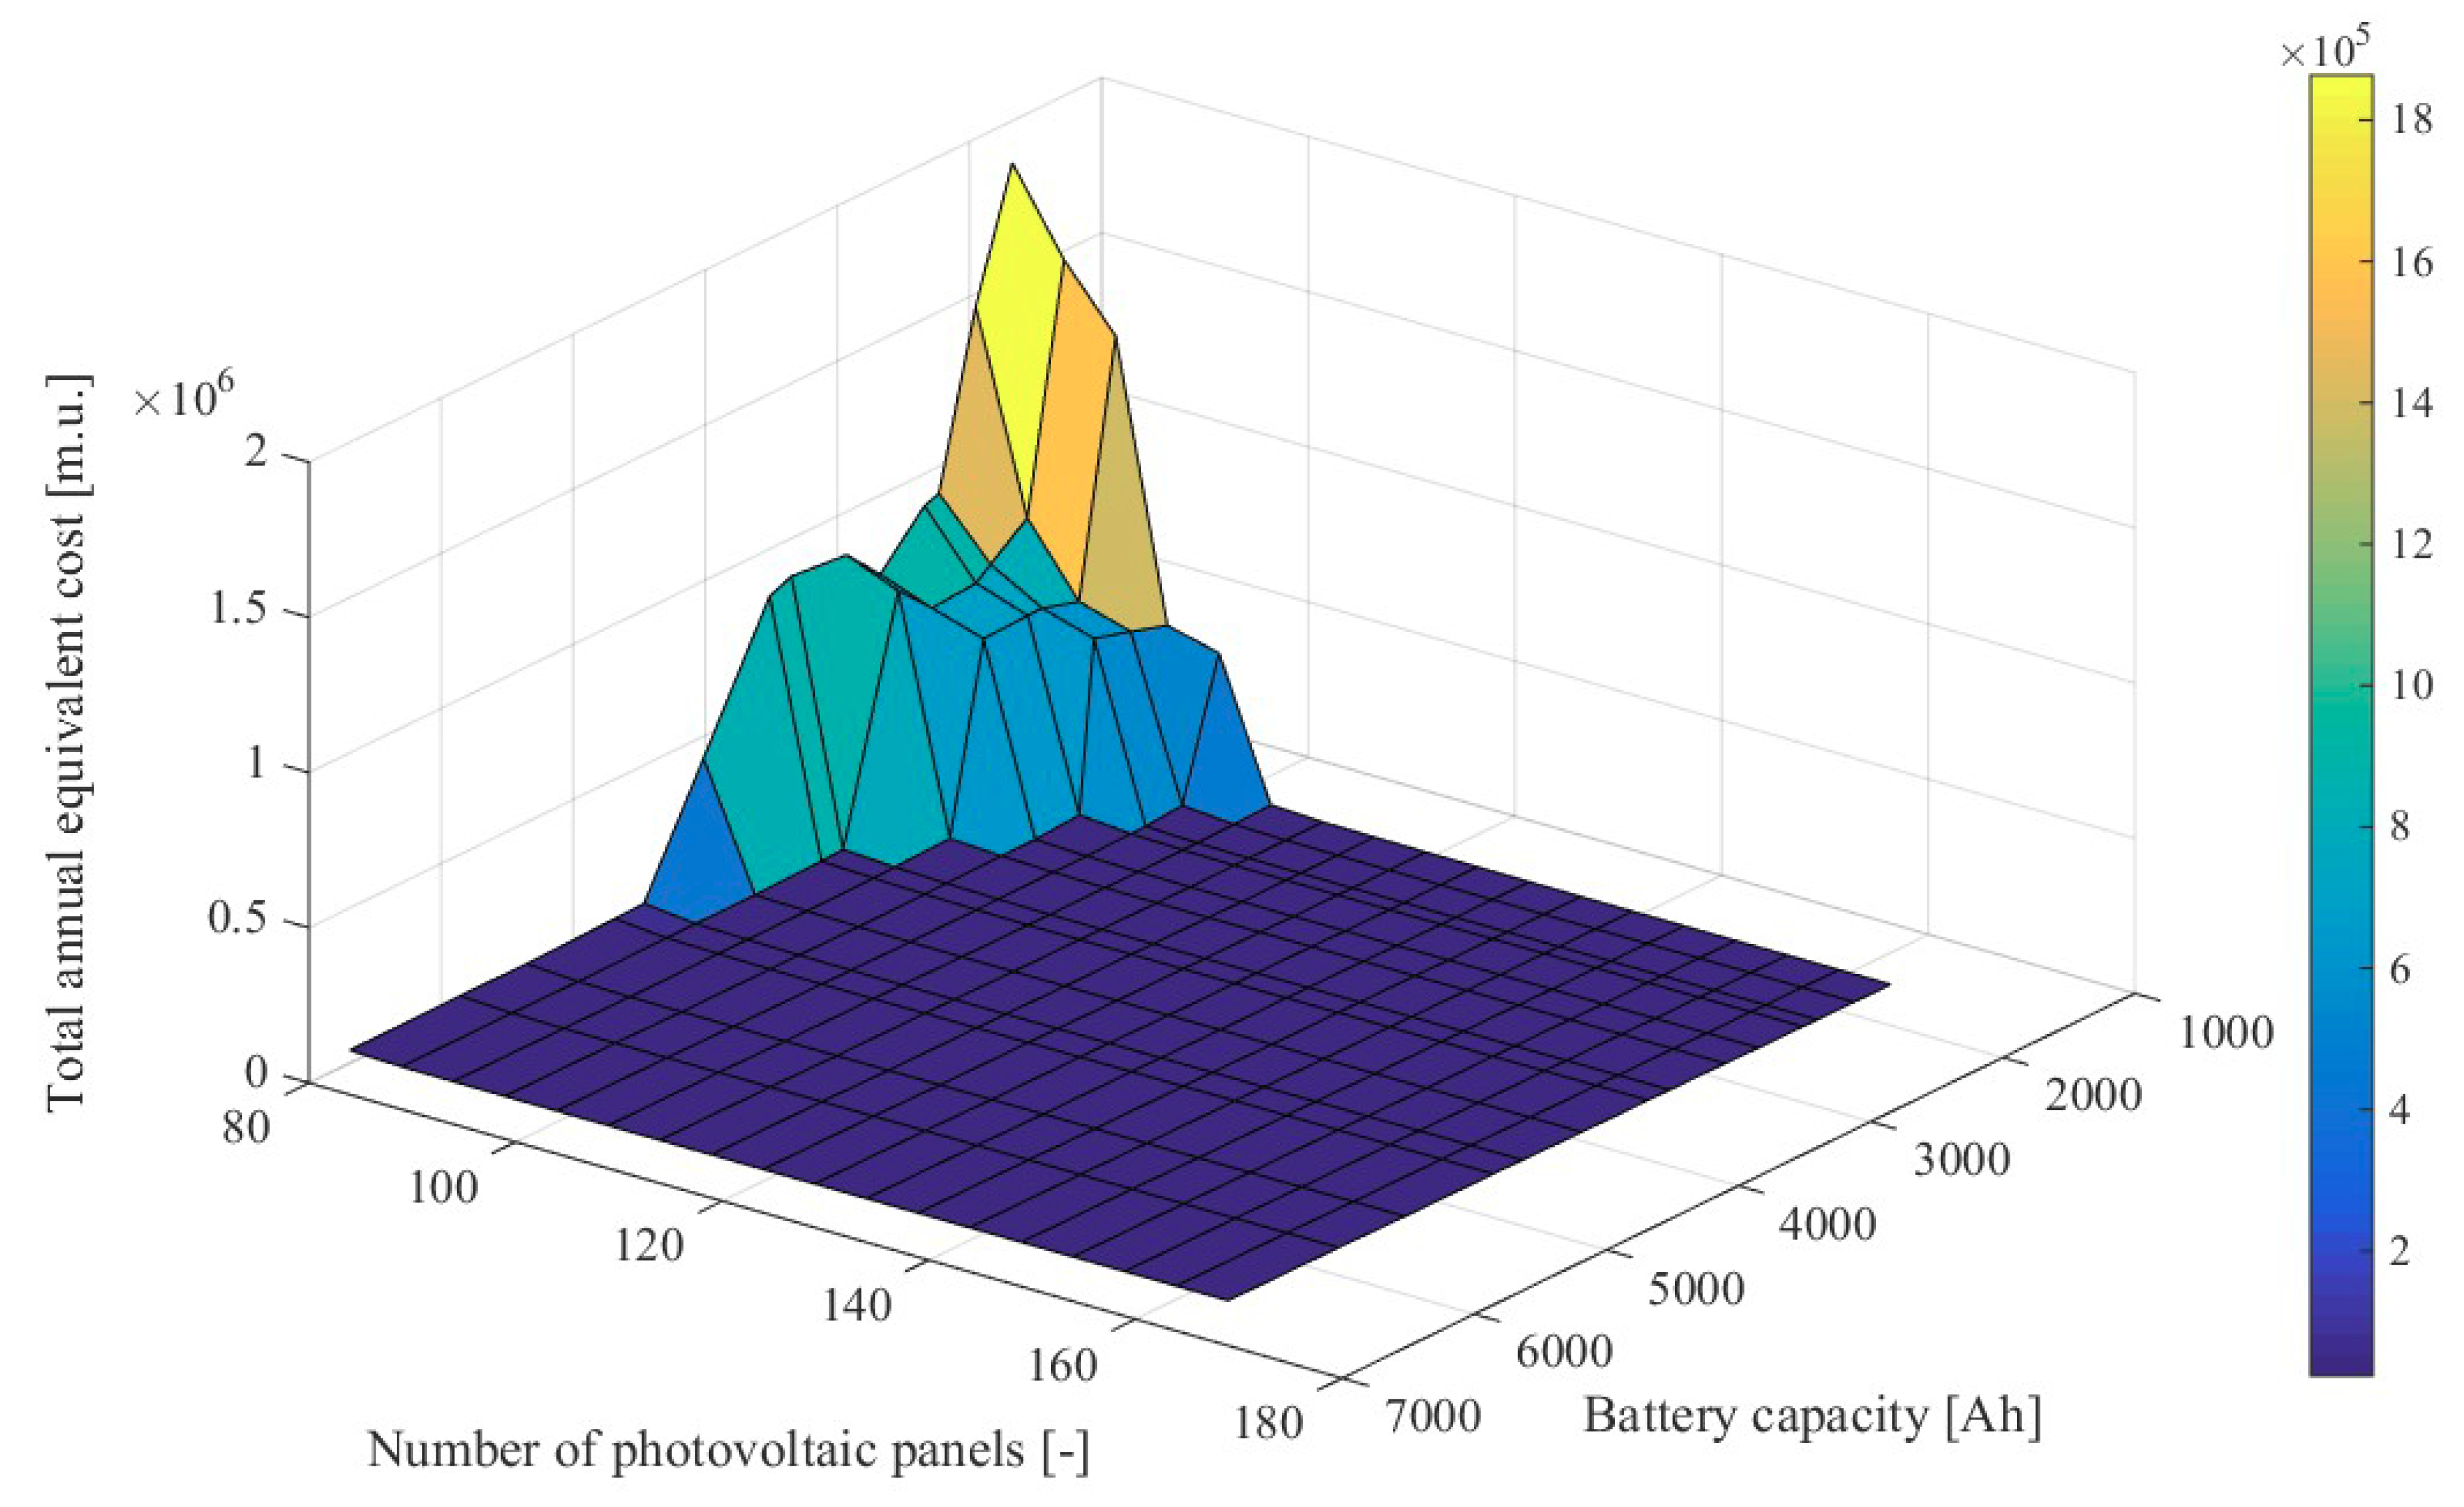
- The proposed sensitivity analysis, which is based on the variation of the equivalent annual total cost with respect to (a) the size of the PVs and of the batteries for every possible type combination of PVs and batteries and (b) the interest rate without inflation. The parametric interest rate allows the evaluation of the stability of the configuration of PVs and batteries for different financial scenarios.
- The mathematical formulation of PV power production, where the available solar irradiation for a time period of a specific day is calculated by the proposed solar radiation modification factor based on the respective available mean monthly irradiation. In this way different timescales for available data (i.e., temperature and solar radiation, which influence the load demand and the power production respectively) are bridged.
- The estimation of the economic lifetime of the battery, which takes into consideration (a) the battery capacity degradation and (b) the operation failure of the SAPV due to energy deficiency of the PVs-batteries system. The energy deficiency avoidance ensures high reliability in the operation of the SAPV system from the energy supply capacity point of view.
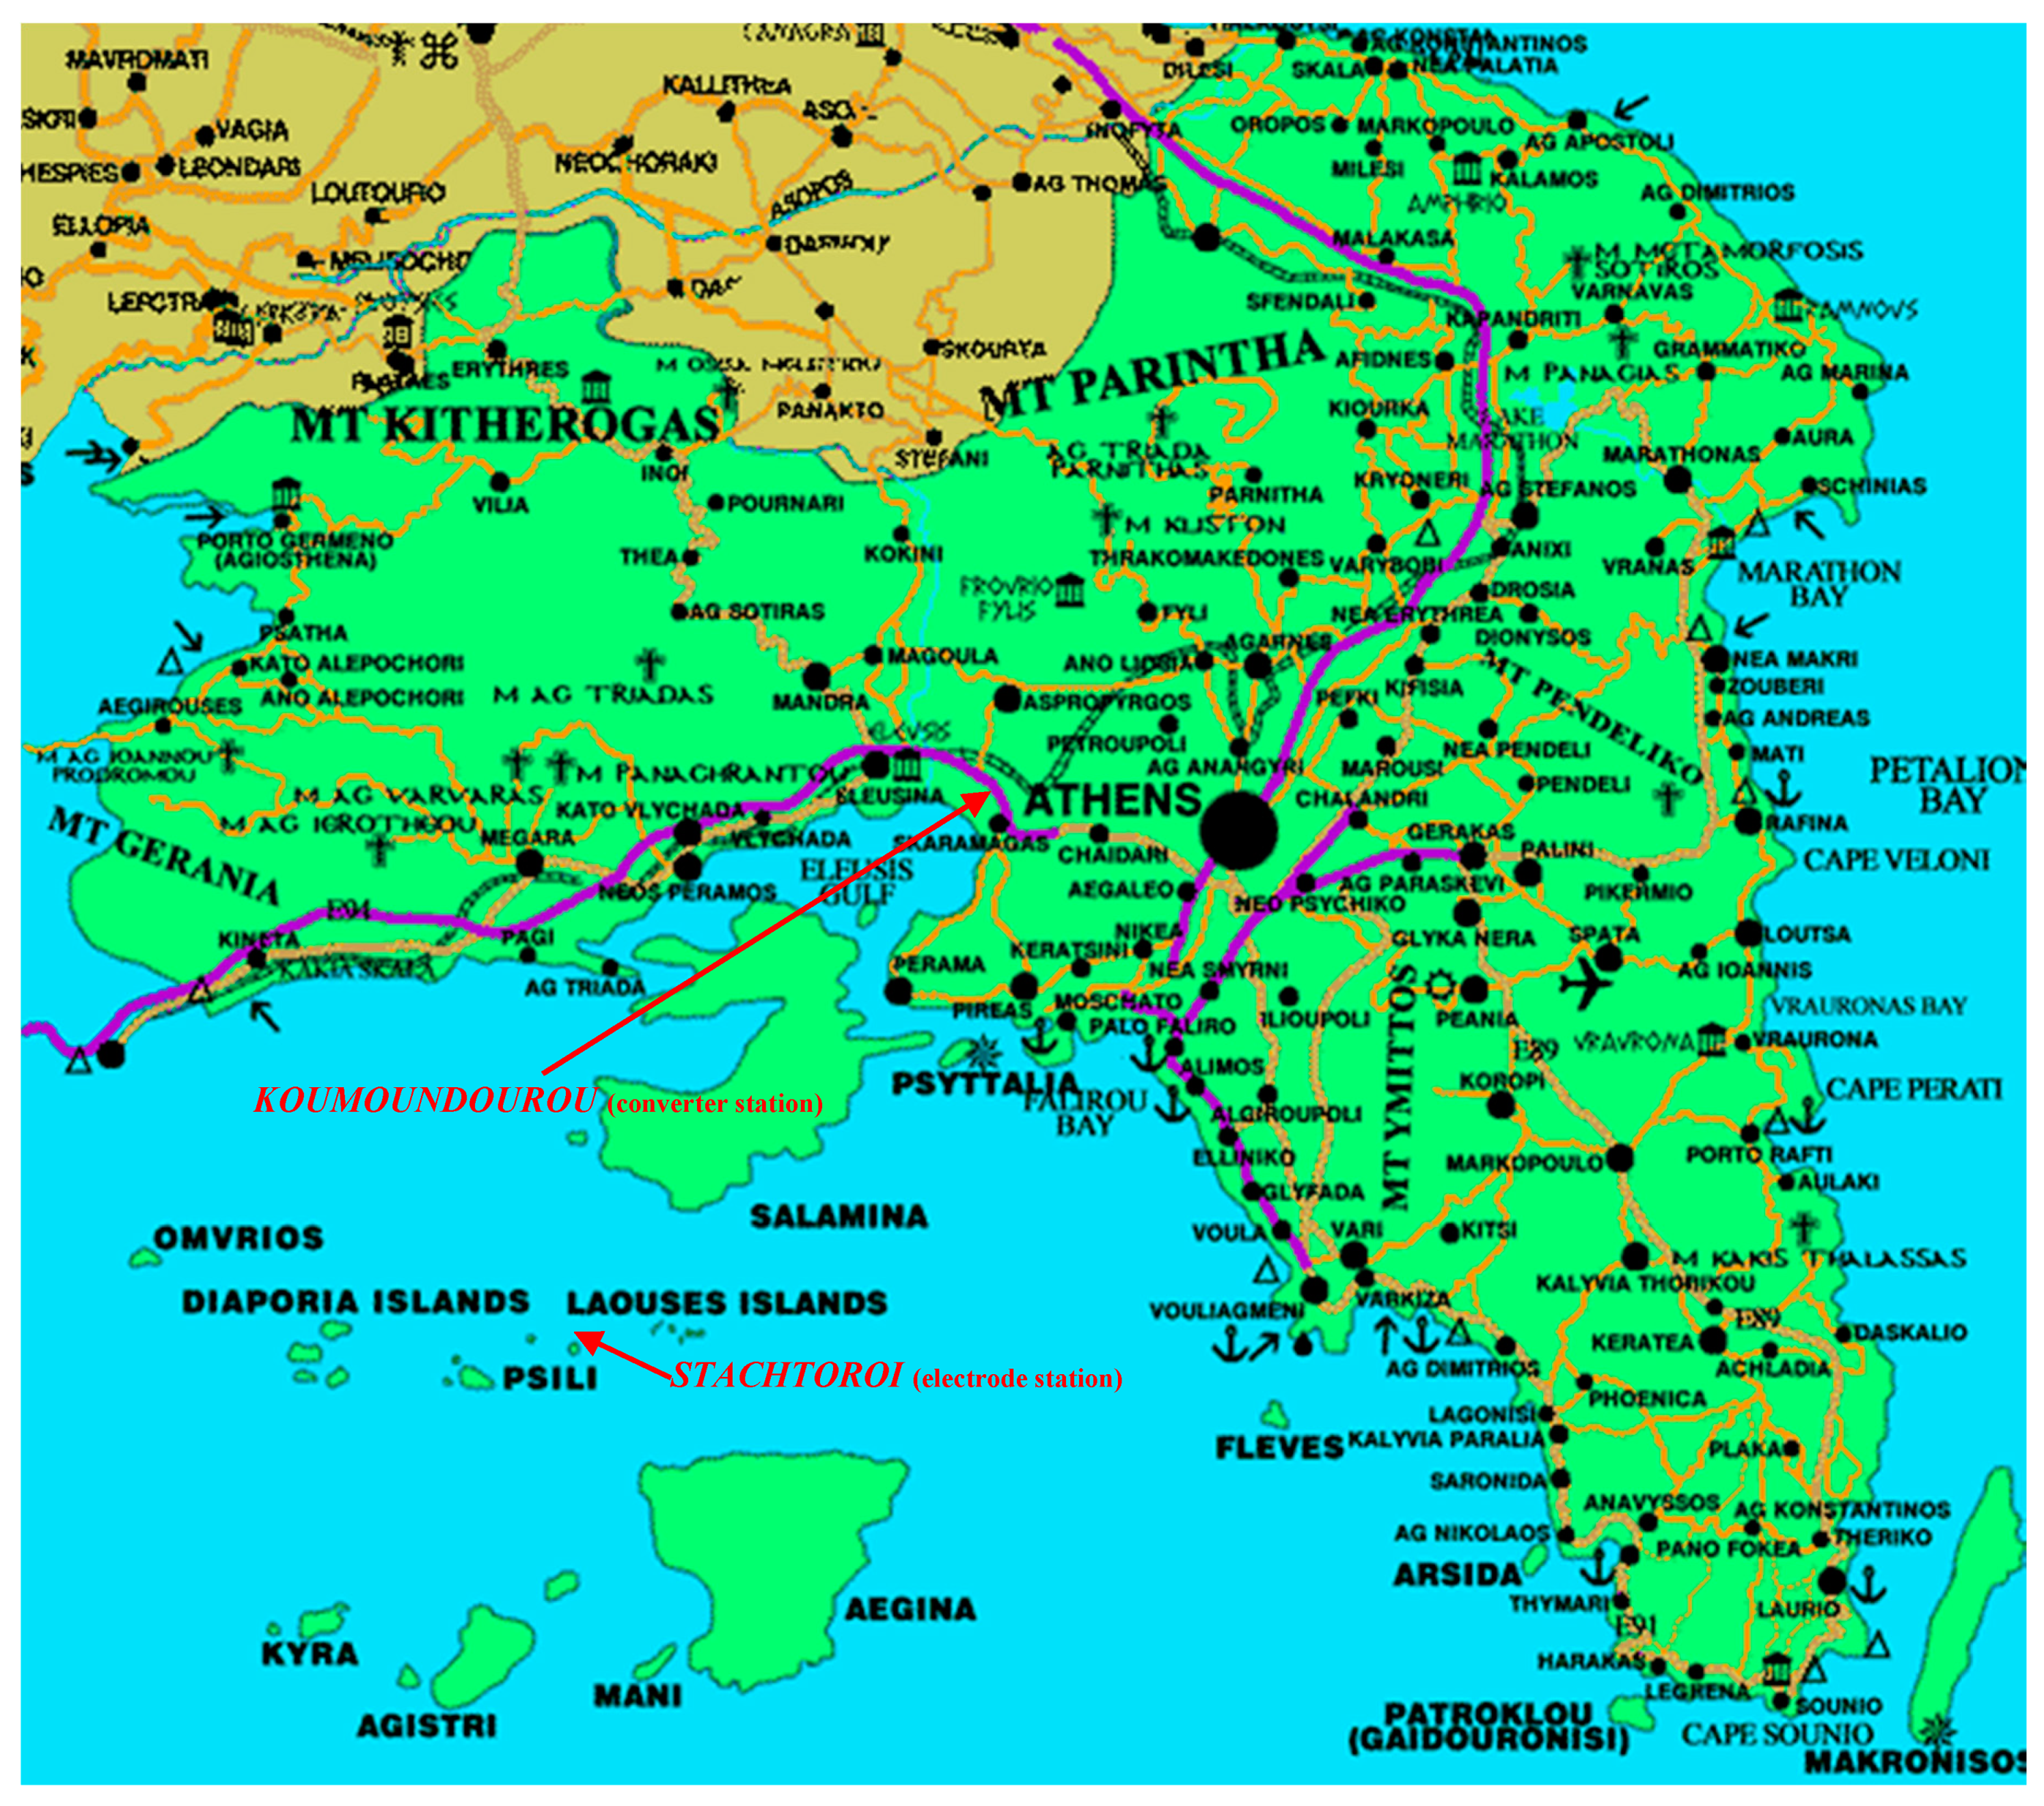
2. Design Principles for an Electrode Station of the HVDC Link: The Case of the Small Island of Stachtoroi for the Attica–Crete Interconnection
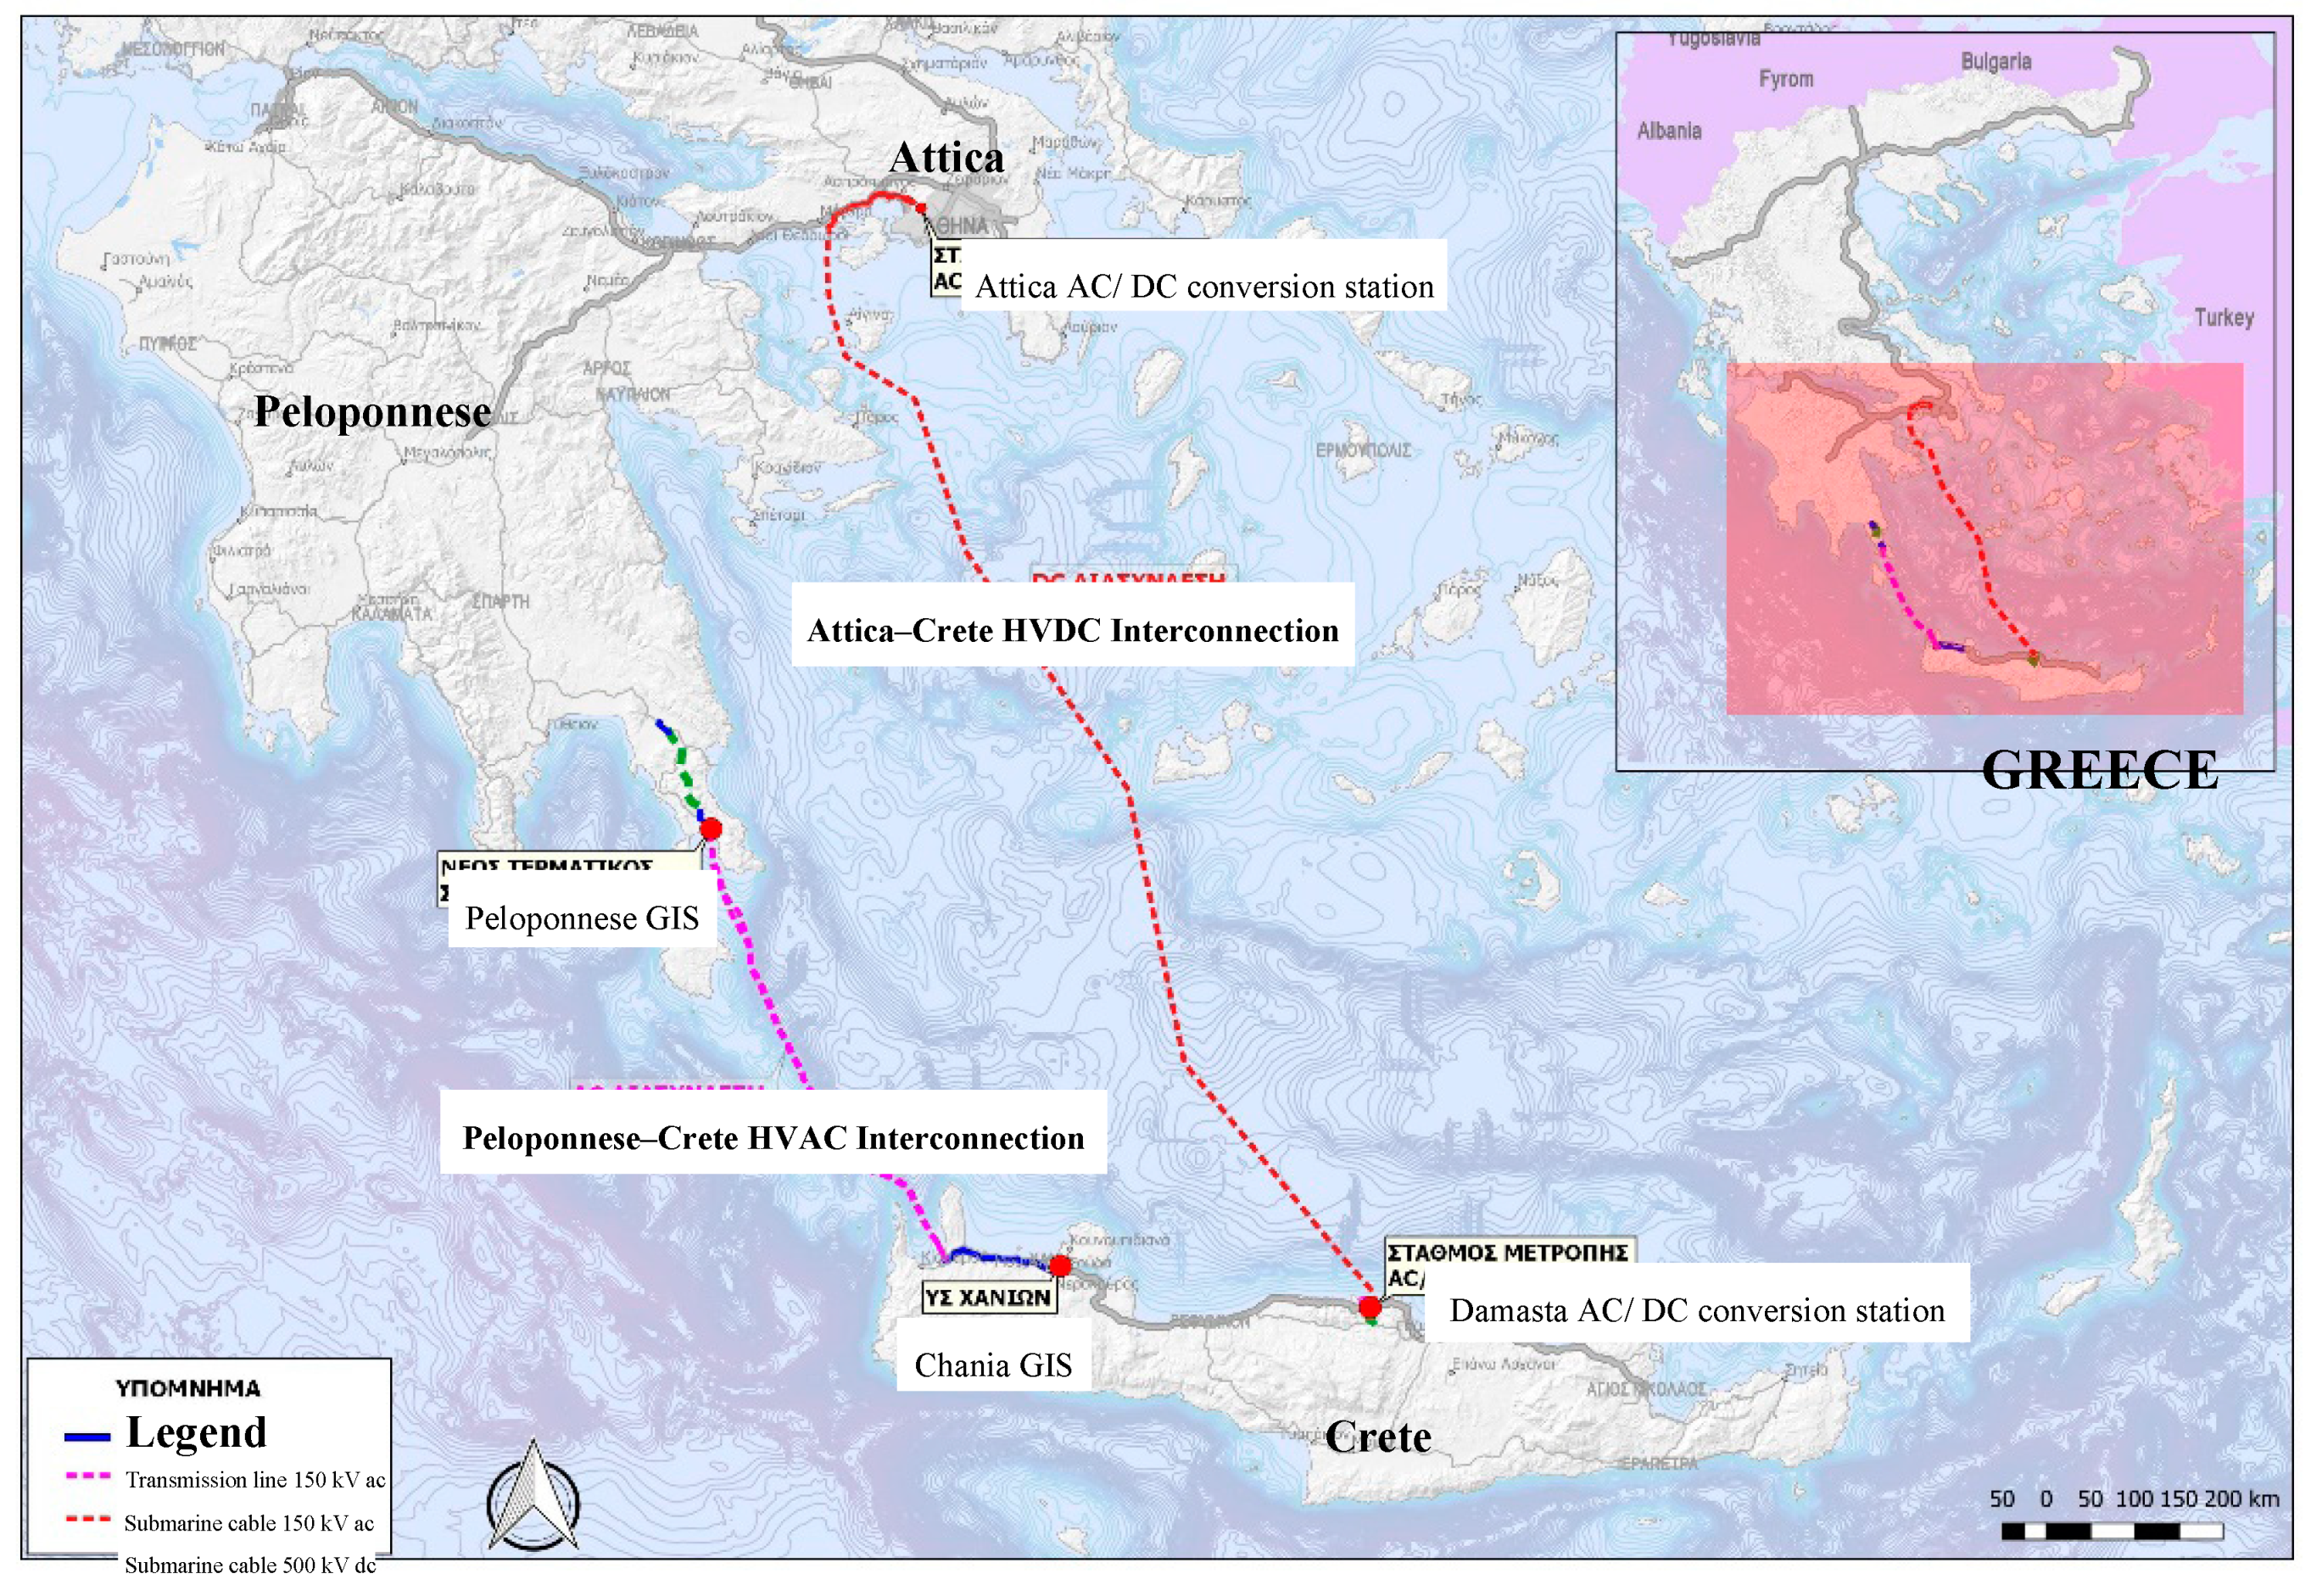
2.1. General Issues of the HVDC Attica–Crete Inteconnection, Greece
- Interconnection Peloponnese–Crete: 2 three-phase 132 km transmission lines with a cross-linked polyethylene (XLPE) cable technology at a maximum depth of 980 m with nominal apparent power 2×200 MVA, at a nominal voltage of 150 kV, with a frequency of 50 Hz and high voltage gas insulated substations (GIS).
- Interconnection Attica–Crete: a 380 km bi-directional HVDC link with a bipolar heteropolar configuration with ground return beyond the sea, with a mass impregnated non-drain (MIND) or XLPE cable technology at a maximum depth of 1250 m with a nominal power of 2×500 MW, at a nominal voltage of ±500 kV DC and voltage source converters.
2.2. General Guidelines by CIGRE and IEC for the Design of the Power Supply for the HVDC Eletrode Station
- Electrode type selection, which is influenced by the distance between the converter station and the prospective electrode site, the soil resistivity in the area of the converter station, the operational duties of electrode operation and its limitations, the operation and maintenance processes, the expected cost, the land use limitations, the safety at the electrode site, and the possible adverse affections at the infrastructure elements.
- Site selection, which is influenced by the site exclusion for environmental reasons and neighboring electromechanical infrastructures, human settlements, culturally sensitive areas, etc., the technical, economic, geophysical, geological, and hydrological aspects.
- Local and remote impacts of electrodes operation, which includes corrosion of infrastructures, saturations of electrical transformers, potential rise and surface potential gradient at the land–sea infrastructures and the safety risks for humans, plants, animal, and marine life, soil or water overheating and the respective chemical reactions, etc.
2.3. Proposed Special Guidelines for the Design of the Power Supply for the HVDC Eletrode Station
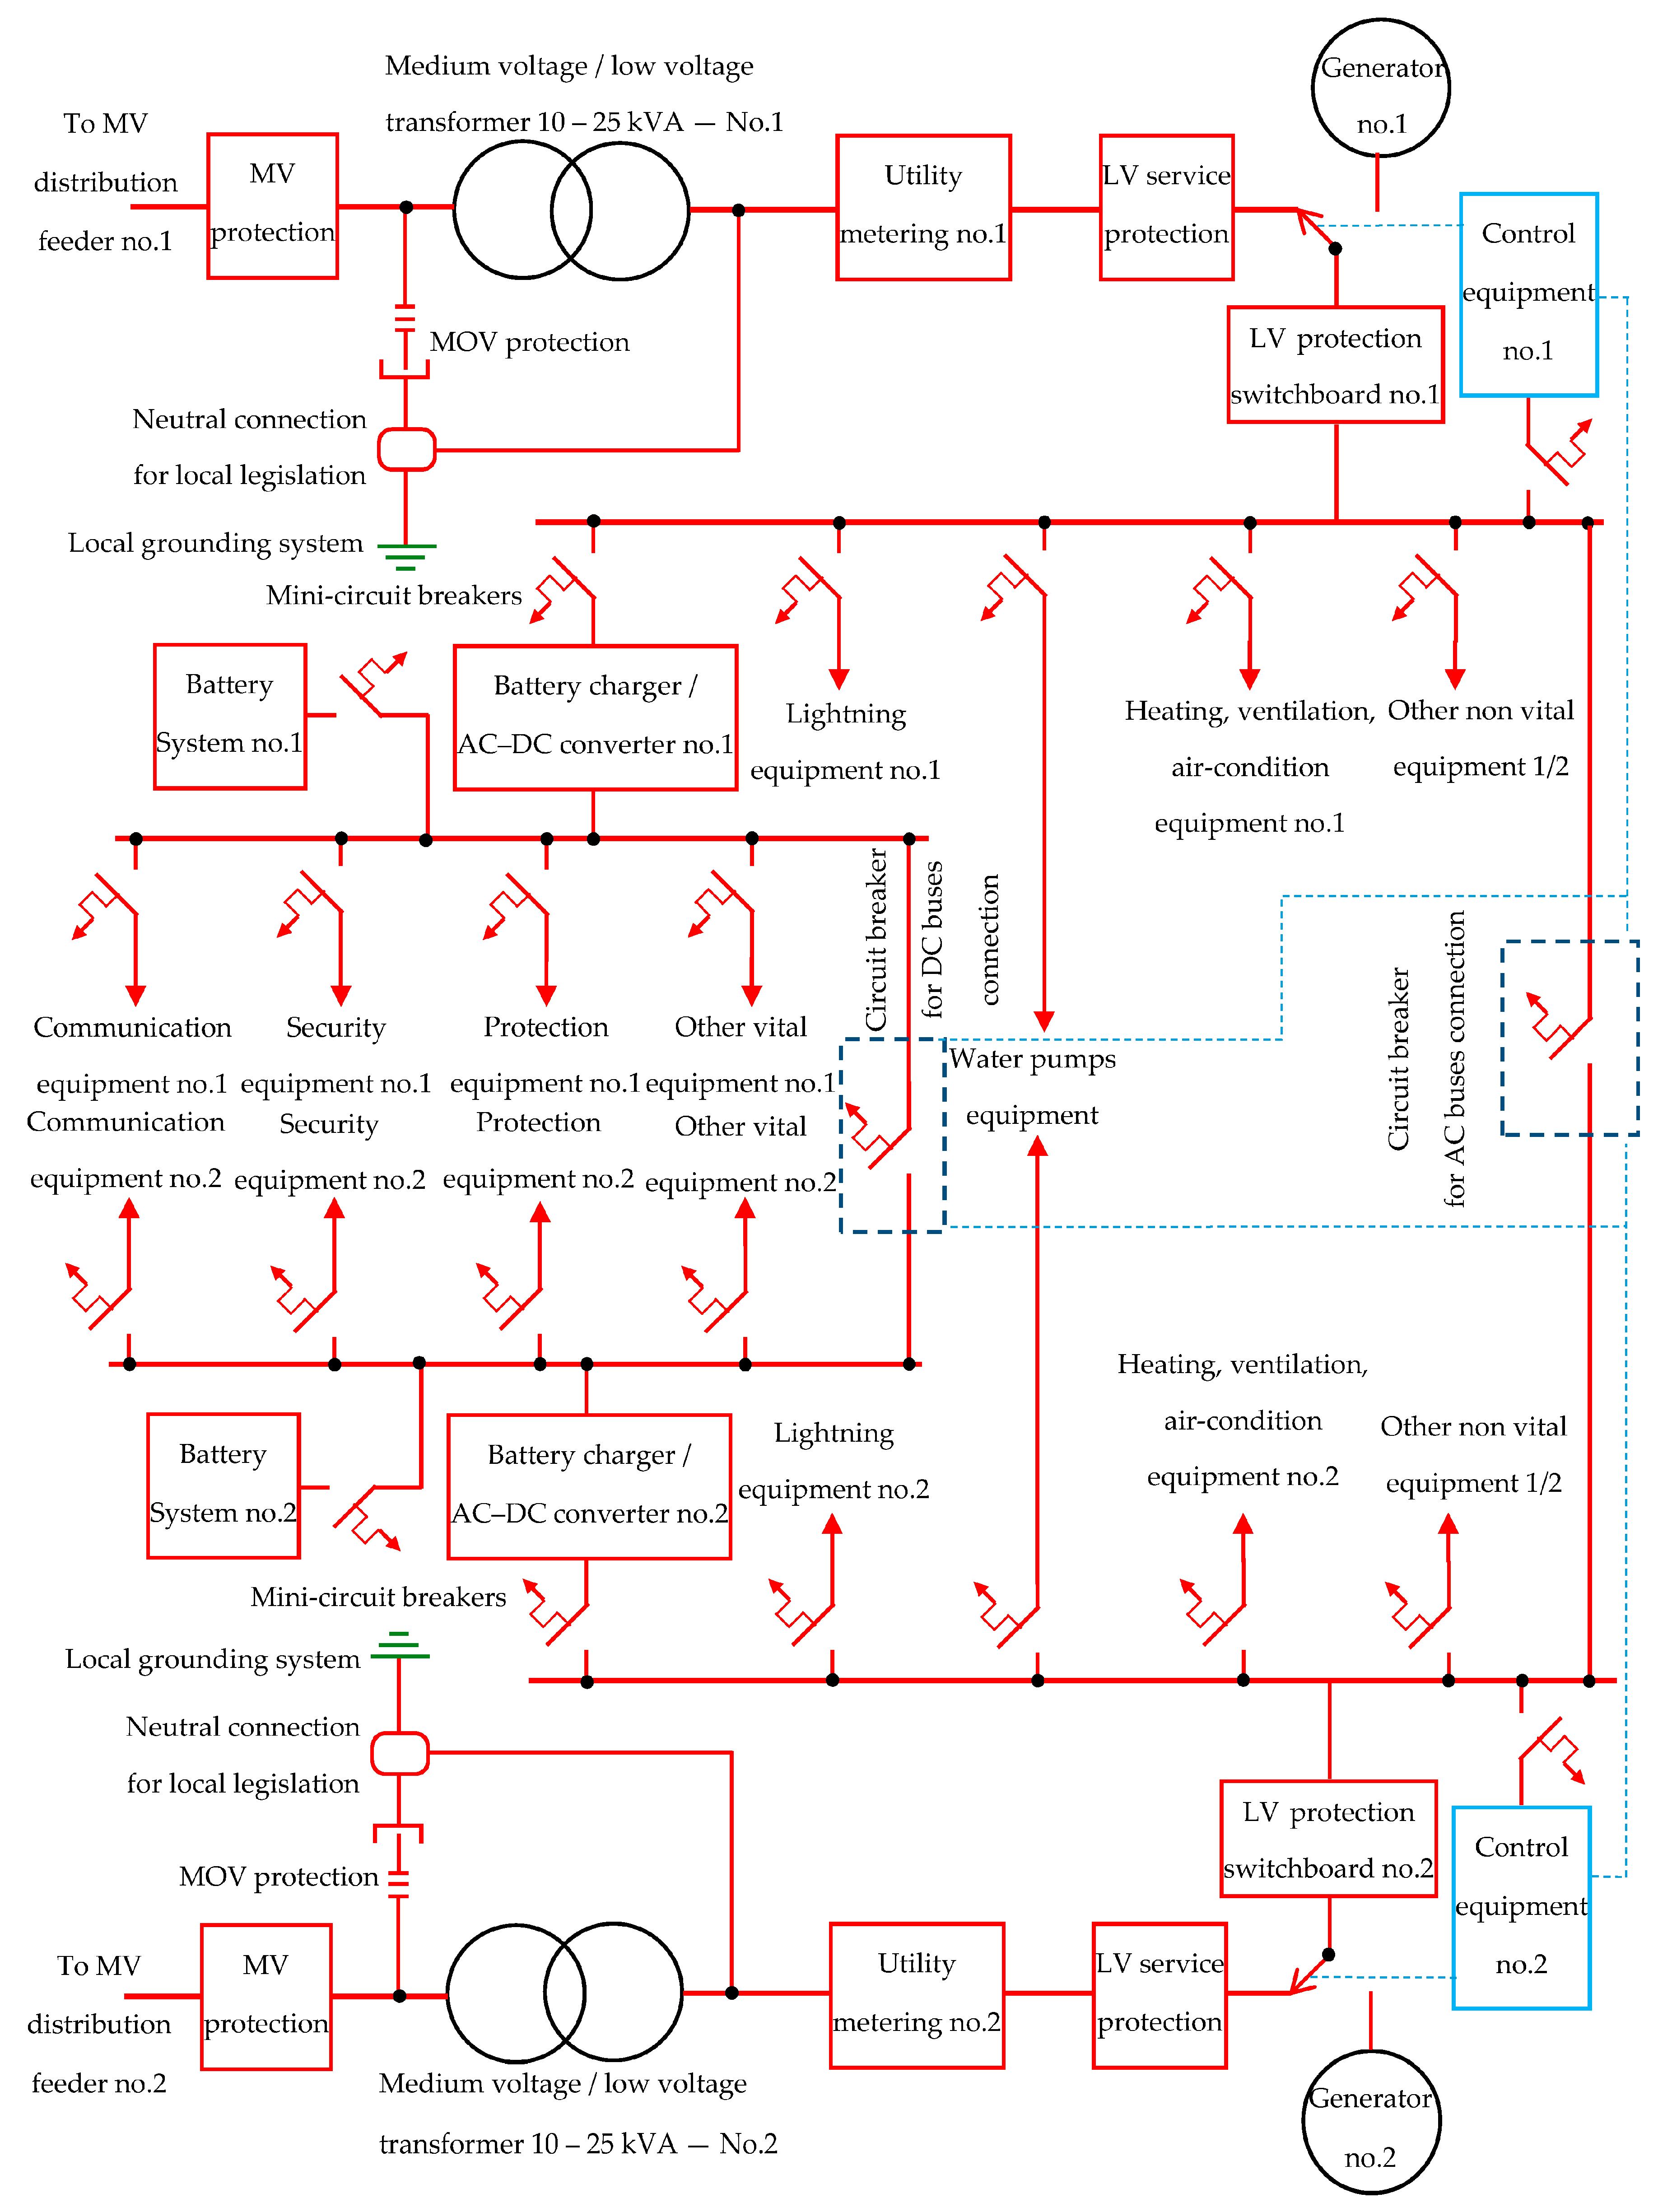
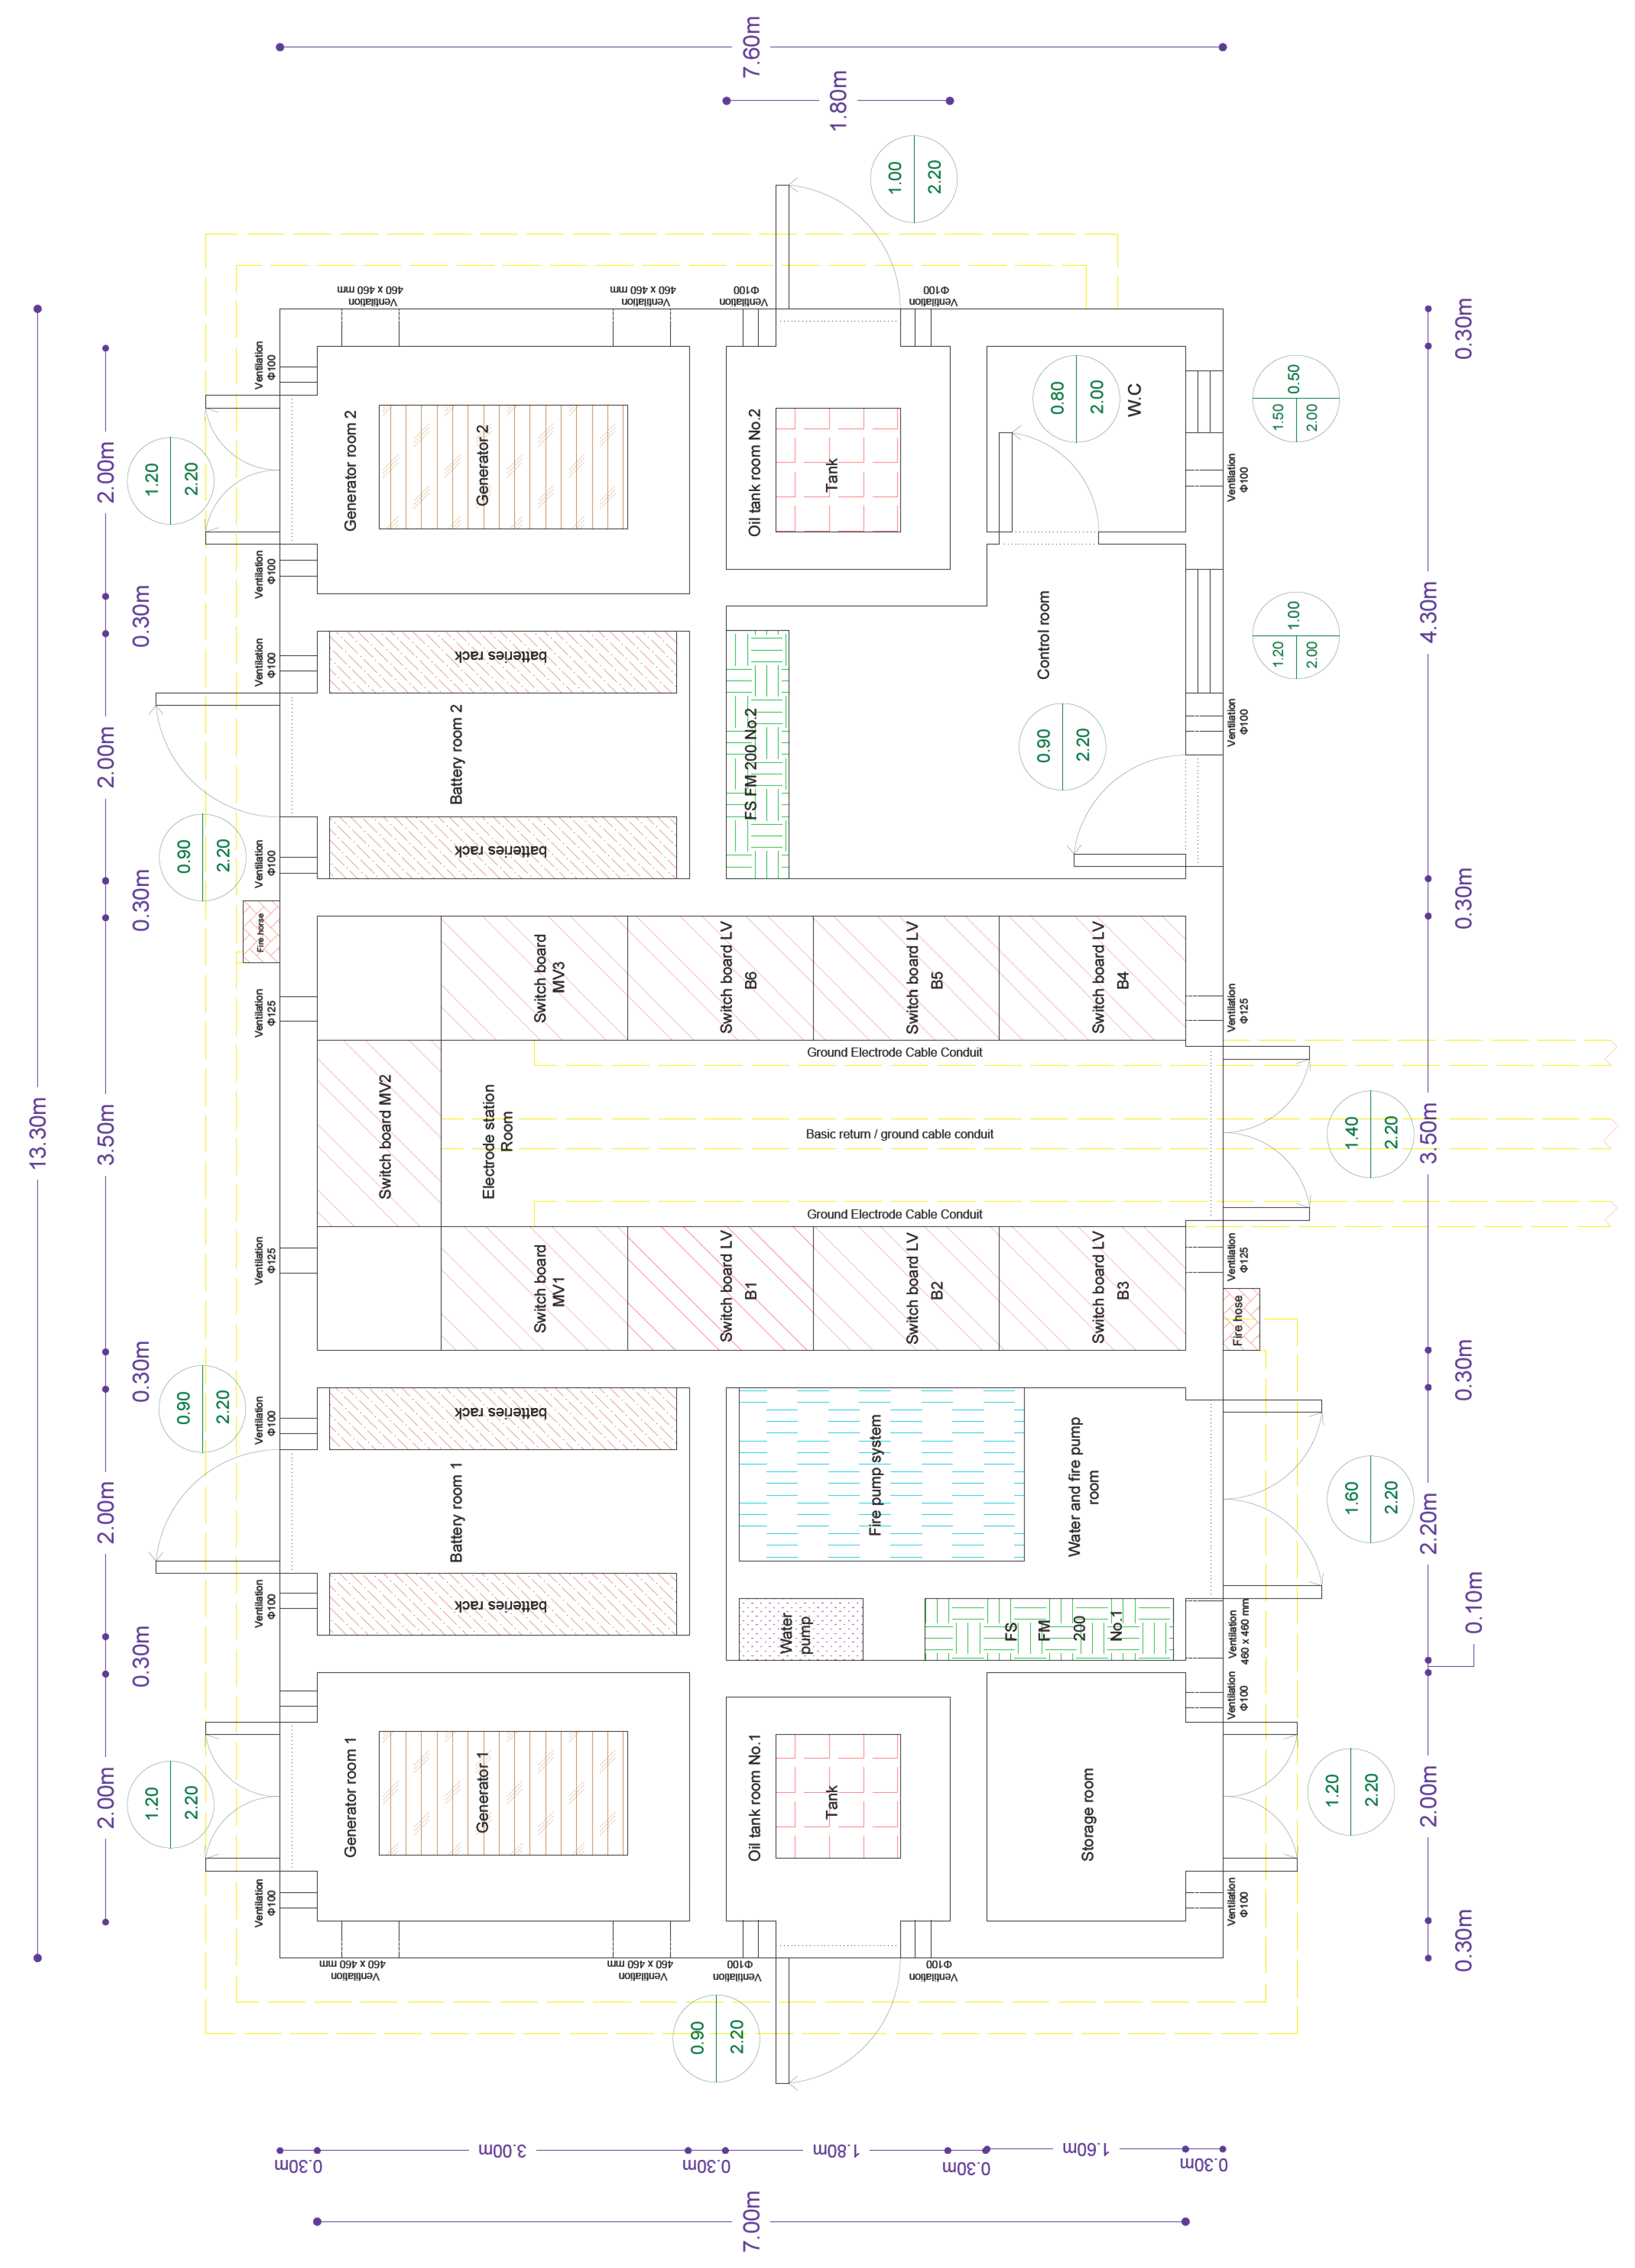
- HVDC interconnection with high reliability levels: The power supplies for normal and emergency operation are duplicated, which means that it will be two network feeders and two back-up sources, i.e., one generator and one big energy storage system or two generators. The vital loads for the HVDC interconnection, such as the control system, communication system, heating–ventilation–air condition (HVAc), etc., should be duplicated. For example, the programmable logic controller (PLC) system for the HVDC electrodes switchgear control is constructed by two similar units, which operate in the master–slave mode and their power supply is realized by two different power sources. Similarly the HVAc system for the main electrode station room consists of two units, where each one can cover the heating/cooling load completely. The essential loads, i.e., water pumps, can be supplied by two sources, while the non-essential loads, i.e., sockets for cleaning/maintenance purposes, can be divided to the two sources. Additionally, the proper circuit breaker between AC buses or DC buses must exist for alternative supply of essential and non-vital loads. The basic idea is presented in Figure 3.
- Isolated/off-grid power supply for electrode stations: The connection, with the distribution network or the formation of an autonomous power system, should be decided based on minimization of the total construction, operation and maintenance cost taking into consideration technical limitations, i.e., the loss of load probability, economic, i.e., construction capital limitation, environmental, i.e., CO2 emissions reduction, etc., optimizing the selection of the type and of the size of the REs and ESSs. It is noted that the alternative autonomous system can be formed by classic thermal units, especially diesel oil generators between 10 and 25 kVA, which is the most common power plant for this power supply, or by REs, especially wind turbines and PVs, combined with ESSs, i.e., batteries or more rarely hydrogen tanks with fuel cells and electrolyzer modules, and a hydro-pumped storage power plant.
- ➢
- A remote control for the autonomous power system,
- ➢
- A dedicated electrode station building design, which includes:
- ▪
- The limitation of the energy consumption beyond the respective regulation requirements, i.e., category A [51] reducing the autonomous power size (ideally zero energy building),
- ▪
- No use of structural steel and metallic mechanical settlements because of the danger for electrochemical corrosion of metallic structures by the direct current flow between electrode stations [45] (i.e., concrete with glass fiber reinforced polymers can be suitable).
- ▪
- Protection with the highest significance factor against environmental dangers, i.e., floods, earthquakes, etc.,
- ▪
- Proper building orientation for PV production maximization,
- ▪
- Proper foundation insulation material, i.e., asphalt, as damp proofing against humidity and electrical insulator against direct current flow between electrode stations and step voltage [45], etc.
- ➢
- Reduction of fire risk. This can be succeeded by:
- ▪
- The increment of fire-resistance because of ESSs existence and electrode station isolation,
- ▪
- The supplementary of the autonomous fire-fighting system, specialized in the presence of high voltage and active electric circuits [52], with energy storage systems [53] and crucial computer/control systems [54]. The use of dedicated fire-fighting agents, as inert gas (i.e., FM200, Novec 1230) [55,56] and special equipment, such as sprinklers [57] and impulse fire-fighting guns [58], are necessary.
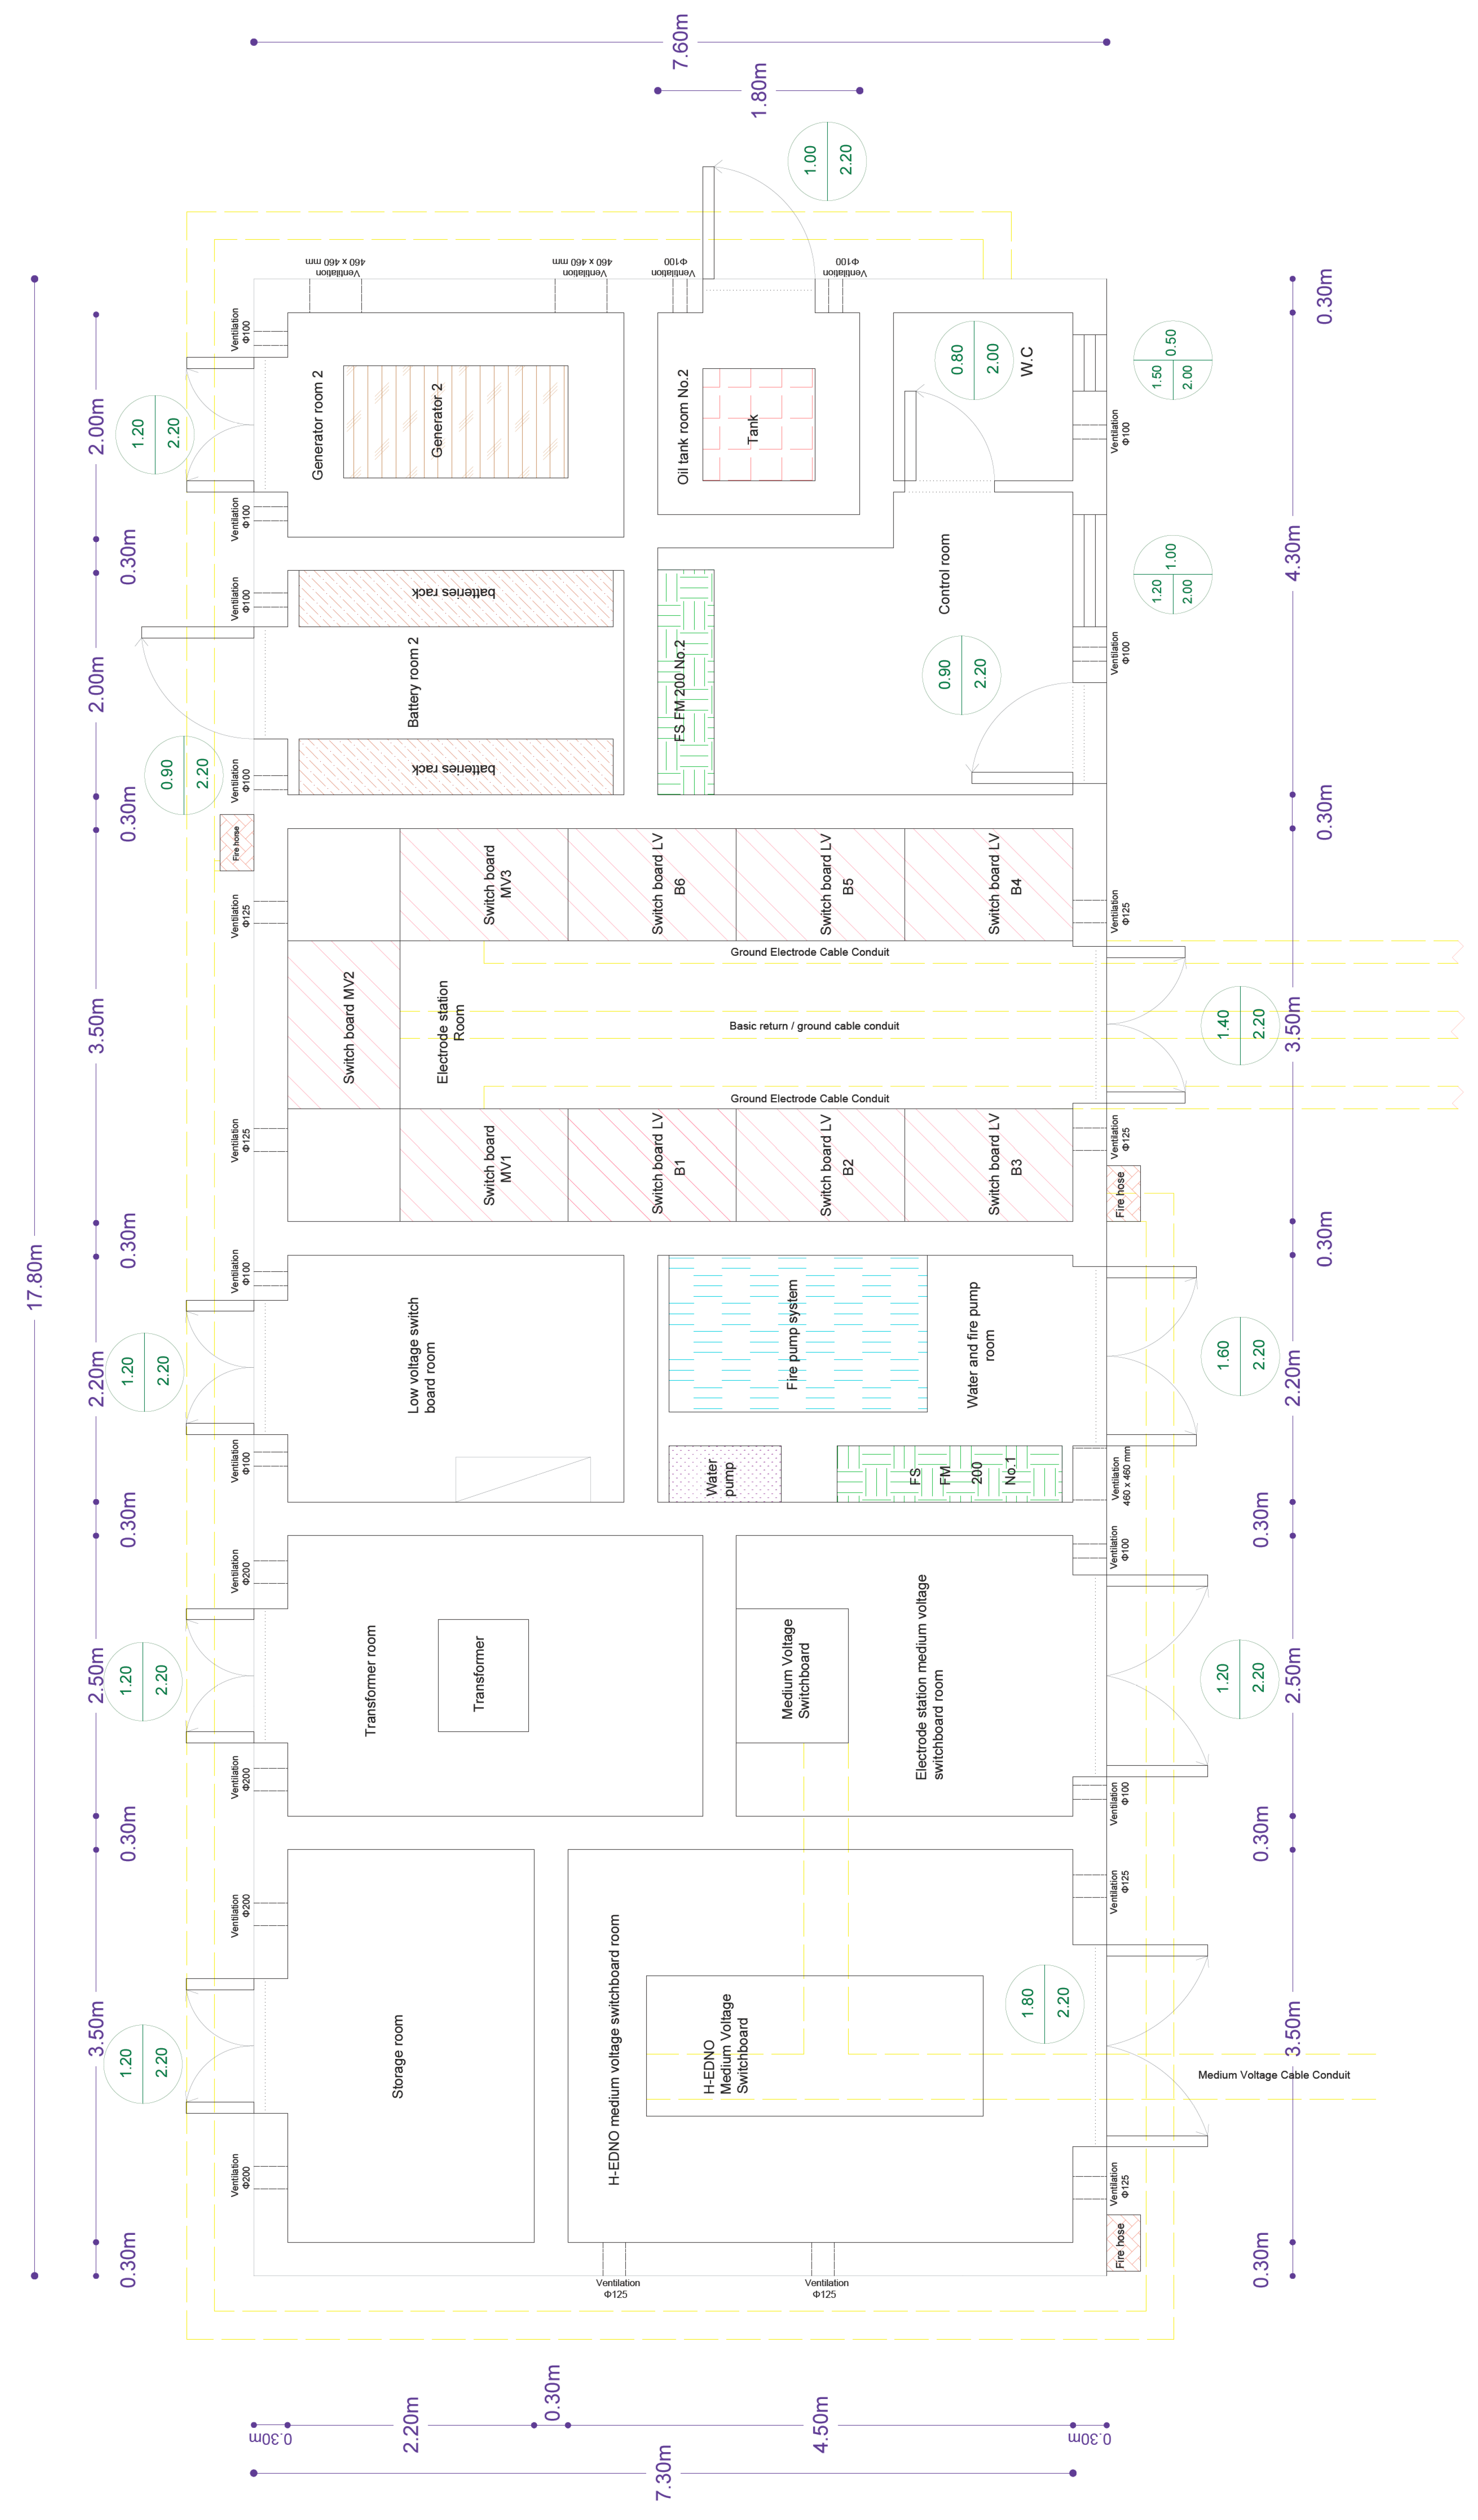
- Preliminary architecture design of the electrode station building based on engineers’ experience for similar buildings taking into account concrete, antiseismic, energy saving legislation, etc., and rules for electrical–mechanical equipment and distribution, etc.
- Optimum minimization of the total cost function with respect to technical, environmental, economic limitations, formatting the connection of distribution network, or the autonomous power system including the type and the size of their main elements.
- Examination of whether the selected power supply and supplementary settlements are satisfied by the preliminary architecture design, go to the next step, otherwise go to the first step to correct the architecture design.
- Examination of economic viability through feasibility studies, taking into account interest rate, life cycle, construction and maintenance cost, etc.
- Selection of the optimum architecture design.
2.4. Special Conditions for the Small Island of Stachtoroi for the Attica–Crete Interoconnection
- A small breakwater and port facility is formed because of building protection from sea waves and to allow for ships calling at the installation and maintenance.
- All rooms have proper ventilation and dehumidifier equipment.
- External lighting is necessary, including one aviation obstruction light buoy, according to International Aviation Organization (ICAO) guidelines because of adjacency to a Hellenic Navy practice field.
- Three 40 m3 underground tanks are constructed for firefighting and water cleanness reasons, as well as a small underground 2 m3 sewage water tank on the opposite site.
- The building has southern exposure for the better PVs operation.
- The PVs inclination is put at 3° for rain/water follow out, adapted to the roof, without any frame, obstructing seagulls constructing nests.
3. Classical Design Methodology for Stand Alone Photovoltaic Panels with Batteries
3.1. Basic Steps of the Classical Design Methodology
- Daily electric energy consumption: The power system total daily peak load PA and the daily energy Eday are calculated as:where Cinstall-i is the installed power of the ith electric consumer, Νi the consumer population, Pinstall-i the total install power of the ith consumer type, ζi the demand factor, σi the coincidence factor per consumer category, PA-i the peak load per consumer category, ri the participation factor at the power system total peak load, mi the mean load factor for time period under study T (=24 h), P′A-i the partition peak load per consumer category at the power system total peak load, and Ei the energy demand per consumer category.
- Optimized selection of the inclination angle/slope a for PVs based on the time period optimized operation and PVs azimuth angle: The slope a is connected with latitude φ and daily solar radiation with no-linear process:
- ➢
- Solar declination δ calculation for the current day of the year for the calculation of daily solar irradiation (DoY; i.e., DoY = 1 for 1 January):
- ➢
- Total mean solar irradiation Hm at the horizontal level in the Earth surface determination either by an experimental process, or by a bibliography for the specific area in kWh/m2 per month [11].
- ➢
- Time sunset ωs calculation:
- ➢
- Mean monthly extraterrestrial solar irradiation Hom at the horizontal level without the Earth atmosphere in kWh/m2 per month [11]:where Μm is the population of days of the mth month and Ιο the solar constant or otherwise the long-term average extraterrestrial total solar irradiance equal to 1367 W/m2 [10].
- ➢
- Lucidity Km calculation as the ratio between the mean monthly solar irradiation Hm at the horizontal level in the Earth surface and respective extraterrestrial solar irradiation Hom at the same level:
- ➢
- Determination of the ratio between diffused solar irradiation Hmd at the horizontal level in the Earth surface and the respective total solar irradiation Hm based on Lala’s function ([11], Equation (2.48)):
- ➢
- Calculation of correction factor RB of the total direct mean monthly solar irradiation for the south-facing PVs with slope a with respect to the total mean monthly solar irradiation for horizontal PVs:where ωs′ is the hourly sunset angle for the day DoY for the south-facing PVs with slope a:
- ➢
- Calculation of correction factor RM of the total mean monthly solar irradiation for the south-facing PVs with slope a with respect to the total mean monthly solar irradiation for horizontal PVs ([11], Equation (2.47)):where ρ is the solar radiation reflection factor with a typical value of 0.2 for land use, 0.05 for asphalt, sea, dark-colored rocks, etc., and 0.60 for light-colored rocks, etc.
- ➢
- Calculation of total mean solar irradiation Hm-panel for the south-facing PVs with slope a in the Earth surface ([11], Equation (2.51)):
- ➢
- Calculation of total mean solar irradiation Hm-panel-Tp for the time period under optimized operation Tp:
- Calculation of the daily available solar irradiation/energy Hm-panel-day for the selected slope a with the null shadow angle:
- Calculation of the population of PVs with nominal power PnomPV, nominal voltage VnomPV, and nominal InomPV at standard test conditions (STC: 1.5 AM, PSTC = 1000 W/m2, 25 °C): The essential power supply Ρα_mon by the PVs is given by:where the autonomy population of days n varies from 5 to 10 (for critical settlements), the PV daily energy increment factor σin_Eday with typical values range from 115% up to 125% depending on the accuracy of the estimation for the daily electrical energy consumption, the PV transmission electrical losses correction factor σTran_el_losses with typical values range from 75% up to 99% depending on the existence of DC or AC buses, converters–inverters batteries ([10], p. 406, Table 9), the factor of the total loss of PVs σTotLossPV is given by:where the PV pollution correction factor σpollution with typical values range from 80% up to 95%, the PV ageing correction factor σageing with a typical annual degradation 1%, the blocking diode losses correction factor σblocking_diode with a typical value of 99%, the PV lack of homogeneity factor σno_homogeneity with a typical value of 98%, the PV cables losses factor σcables with typical values range from 97% up to 99%, the PV temperature correction factor σTemp is given by the mean monthly temperature Tmonth when the temperature difference between the environment and PVs is DTen-PV, the environment temperature Tref-en, and the typical power decrease factor fd_Temp [10]:The necessary population of PVs Npanel is calculated by:
- Capacity calculation of the battery storage system based on autonomy population of days n and battery depth of discharge DoD: The essential battery capacity Cnom of the ESSs with operation nominal voltage VnomESS is given by:where the indirect PV service of the electric consumption factor ℓD with typical values range from 0% up to 100% (typical value 80% in case that PVs supply the 20% from electrical load consumption directly), the battery daily energy increment factor σin_Eday_ESS with typical values range from 115% up to 125% depending on the accuracy of the estimation for the daily electrical energy consumption, the battery transmission electrical losses correction factor σTran_el_losses_ESS with typical values range from 90% up to 97% depending on the existence of DC or AC buses, converters–inverters ([10], p. 417), the battery ageing correction factor σageing_ESS with a typical value of 80% for lead acid batteries ([10], p. 415), the battery temperature correction factor kTemp is given with respect to the annual temperature Tyear:
- Calculation of electrical installation elements: The configuration and the number of battery elements and of PVs, the dimensions of cables, converters, battery chargers, and control systems are determined taking into consideration the electroscience principles, i.e., the cable dimensions include the insulation level based on maximum operation voltage, the conductor cross section based on the maximum thermal operation current, maximum short circuit current, voltage drop, protection system design, etc. [50].
3.2. Daily Electric Energy Consumption for the Electrode Station of Stachtoroi Island
- For the normal operation mode the total daily peak load was 4.8 kW during spring–autumn without split units in operation, 8.44 kW during winter with split units in maximum heating operation and 8.5 kW during summer with split units in maximum cooling operation, whereas the maximum daily energy load consumption was 11.93, 40.16, and 47.64 kWh respectively.
- For the maintenance mode with diesel-electric generators in operation the total daily peak load was 17.3 kW during spring–autumn, 22.02 kW during winter and 22.25 kW during summer, whereas the maximum daily energy load consumption was 34.44, 79.99, and 98.47 kWh respectively, even if its practical value was limited to the fuel oil tank dimensions because of only a few hours of operation.
3.3. Preliminary Study of Stand-Alone Photovoltaic with Batteries for the Electrode Station of Stachtoroi Island
4. Proposed Design Methodology for Stand Alone Photovoltaic Panels with Batteries
4.1. Basic Goals of Proposed Design Methodology for SAPV with Batteries
- The daily operation process of the respective power system with the technical limitations of PVs, inverters, batteries, etc.,
- The seasonal and daily variation of the electrode station load demand with respect to the available temperature (here the average three hours temperature for 15 years are available from the neighboring meteorological station),
- The seasonal and daily variation of PV power production with respect to the available radiation (here the mean monthly irradiation is available in the neighboring area from [11] and its time-scale is properly adjusted through the process of Section 4.3),
- The reliability level from an energy point of view, where the SAPV operation will be failed if the load demand is supplied by the back-up diesel-engine generator sets because of energy deficiency of the PVs-batteries system (the generator sets should operate only in case of forced outages).
- The environmental limitation of CO2 emissions reduction, which is succeeded indirectly as the generator sets are going to operate only for maintenance and SAPV forced outage reasons, not for energy supply systematically, which means that CO2 emissions are nullified practically.
4.2. Mathematical Formulation of the SAPV Daily OPERATION Process
4.3. Mathematical Formulation of the PV Panels Power Production
4.4. Mathematical Formulation of the Battery Capacity Degradation
4.5. Mathematical Formulation of the Cost Function
4.6. Basic Steps of Proposed Design Methodology for SAPV with Batteries
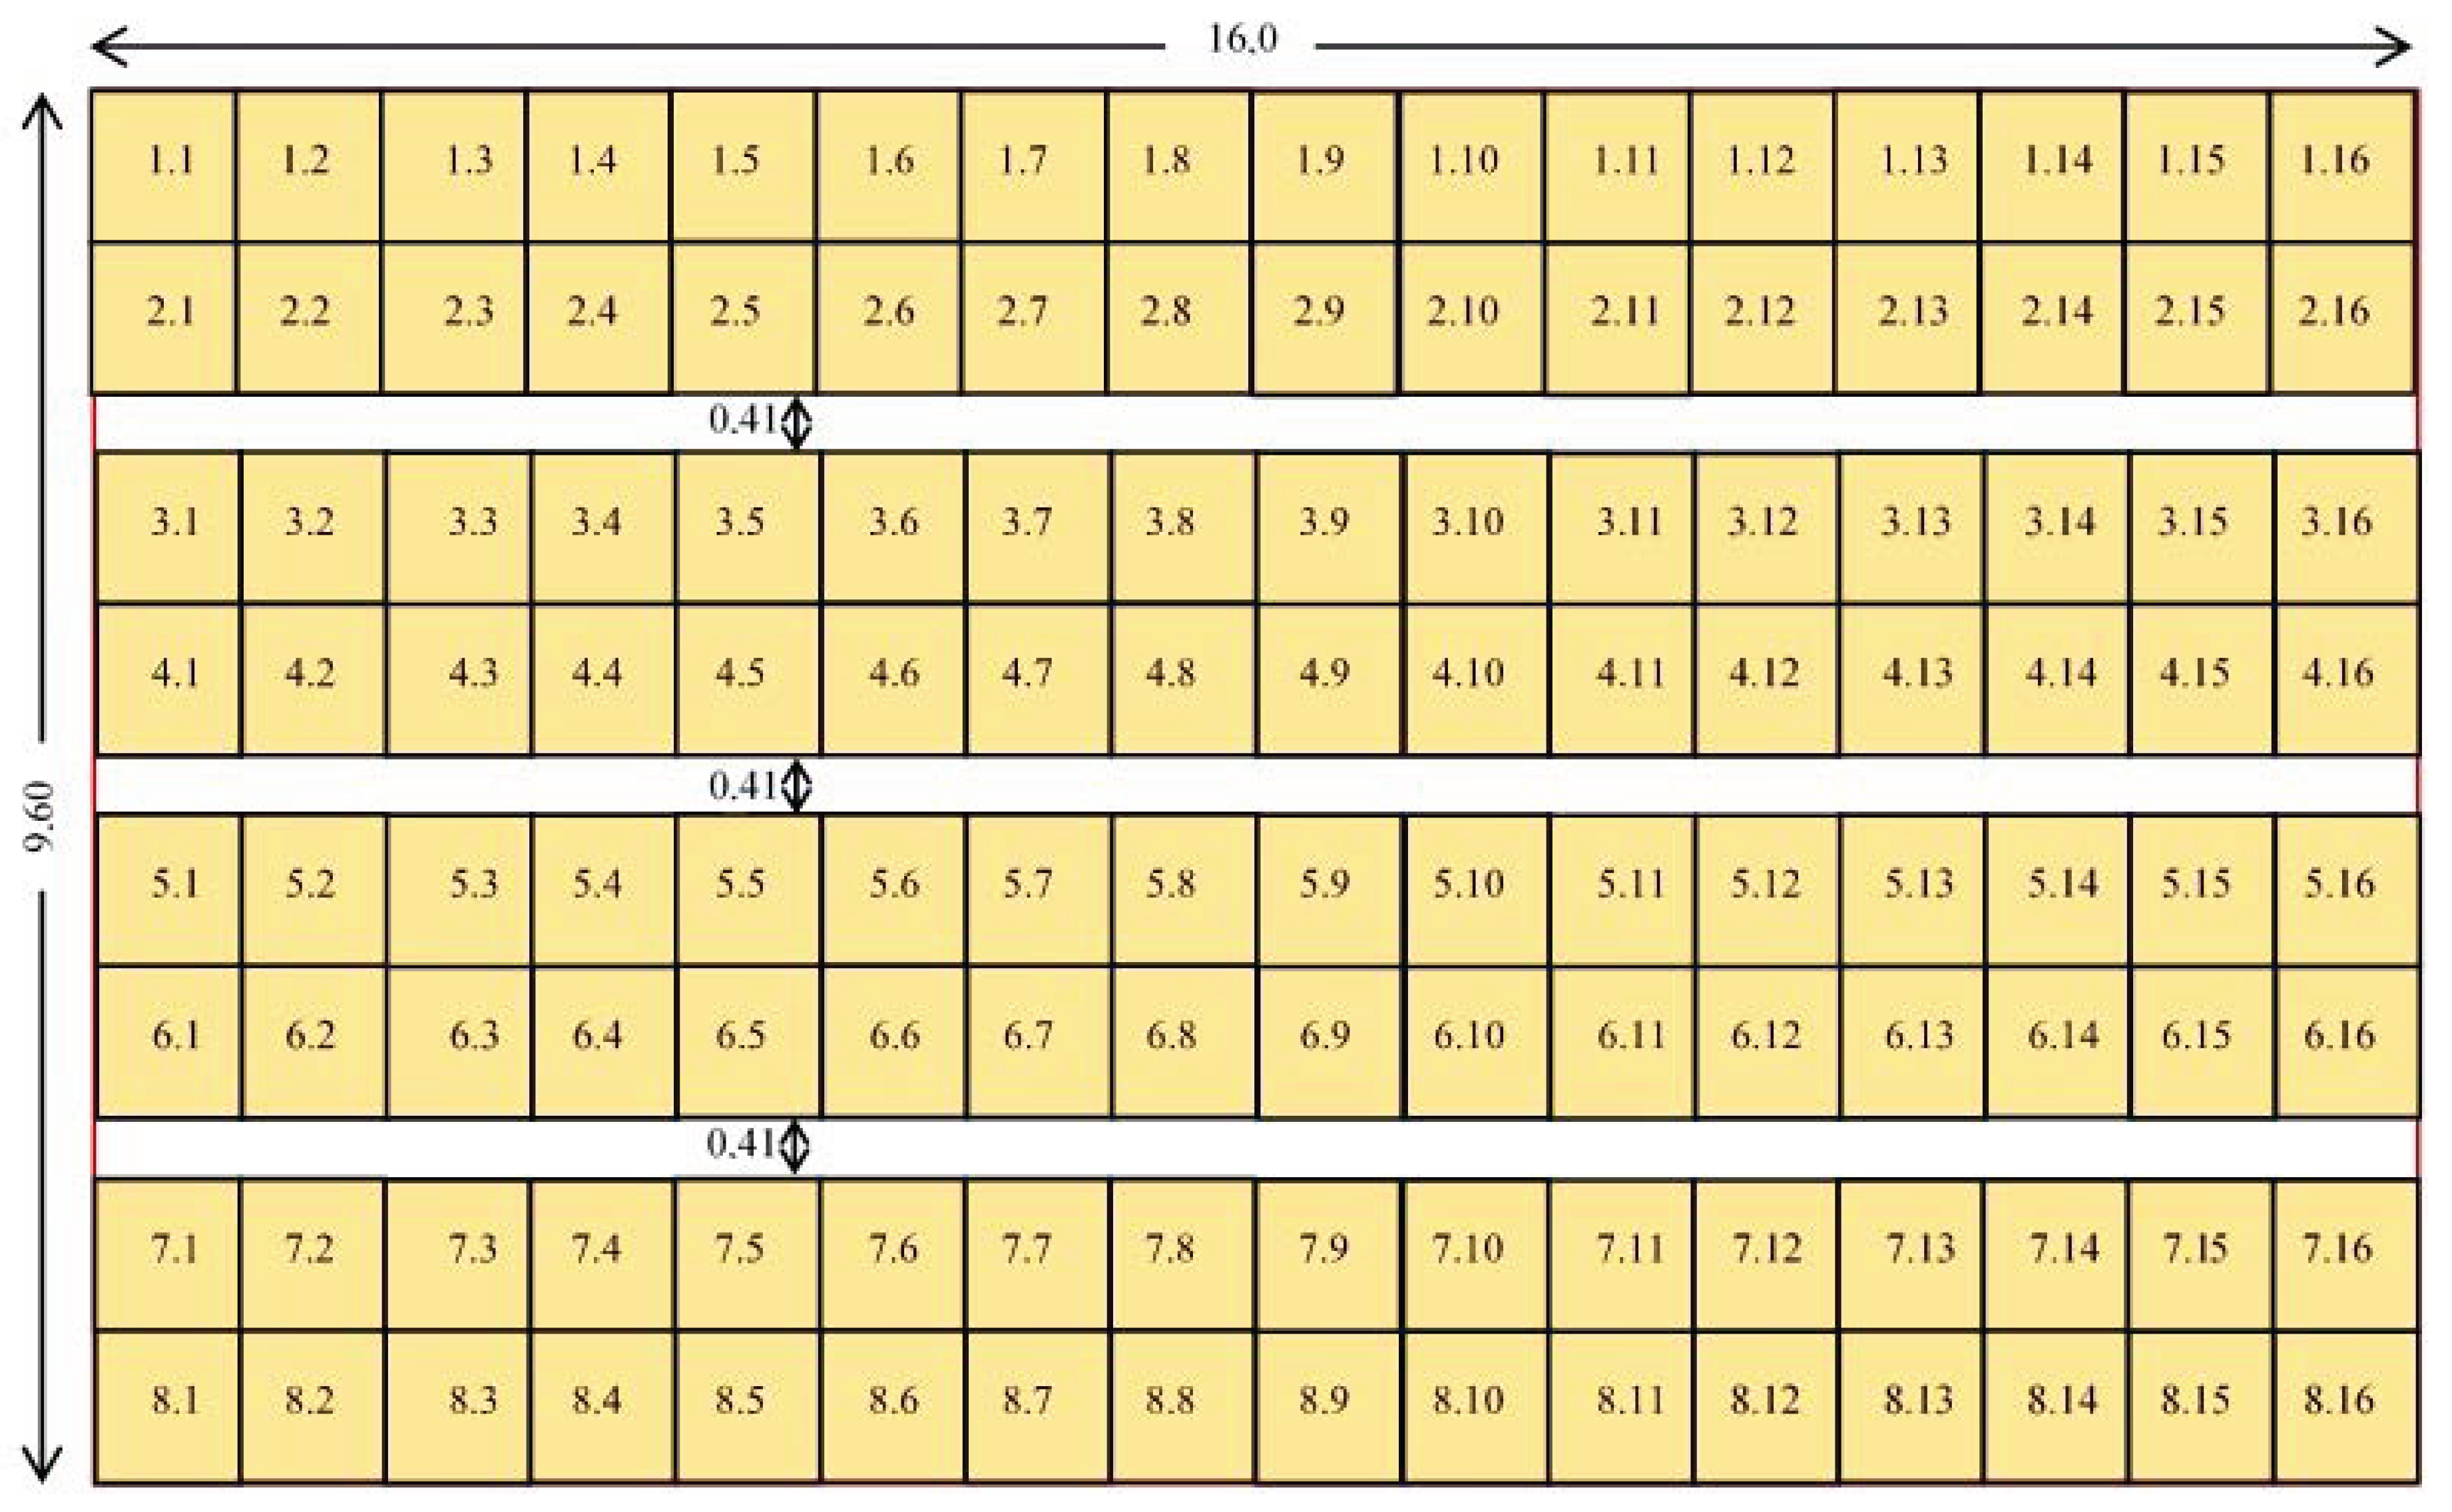
- Initialization of the range of PVs population: The population of PVs can receive specific values Npanel1, Npanel2, …, NpanelK. The type of PVs has been preselected as the Sxp154Q panel by Solbian [60] because it is a marine application and this panel is the biggest one. It can be easily modified involving further types of PVs.
- Initialization of the battery type and of the range of battery capacity for specific nominal voltage: The type of battery has been preselected as lead acid AGM and gel VRLA ones because they satisfy maintenance and safety against fire risk criterions, while the constructors choice is based on certificates, capital cost, technical criterions such as the typical life cycle, initial capital cost, etc. Next, the battery capacity can receive specific values Cnom1, Cnom2, …, CnomL, with respect to the battery data sheets [61,62].
- Initialization of the interest rate and of other parameters: The interest rate without inflation can receive specific values ir1, ir2, …, irM, while other parameters, such as the PV daily energy increment factor σin_Eday, the battery daily energy increment factor σin_Eday_ESS, etc. are predetermined.
- Determination of the solar radiation modification factor: The solar radiation modification factor fHmday(t, t + dt) is calculated by Equation (39) according to the process of Section 4.4 and it has the same value for the same current day of a month for different years and it is calculated once.
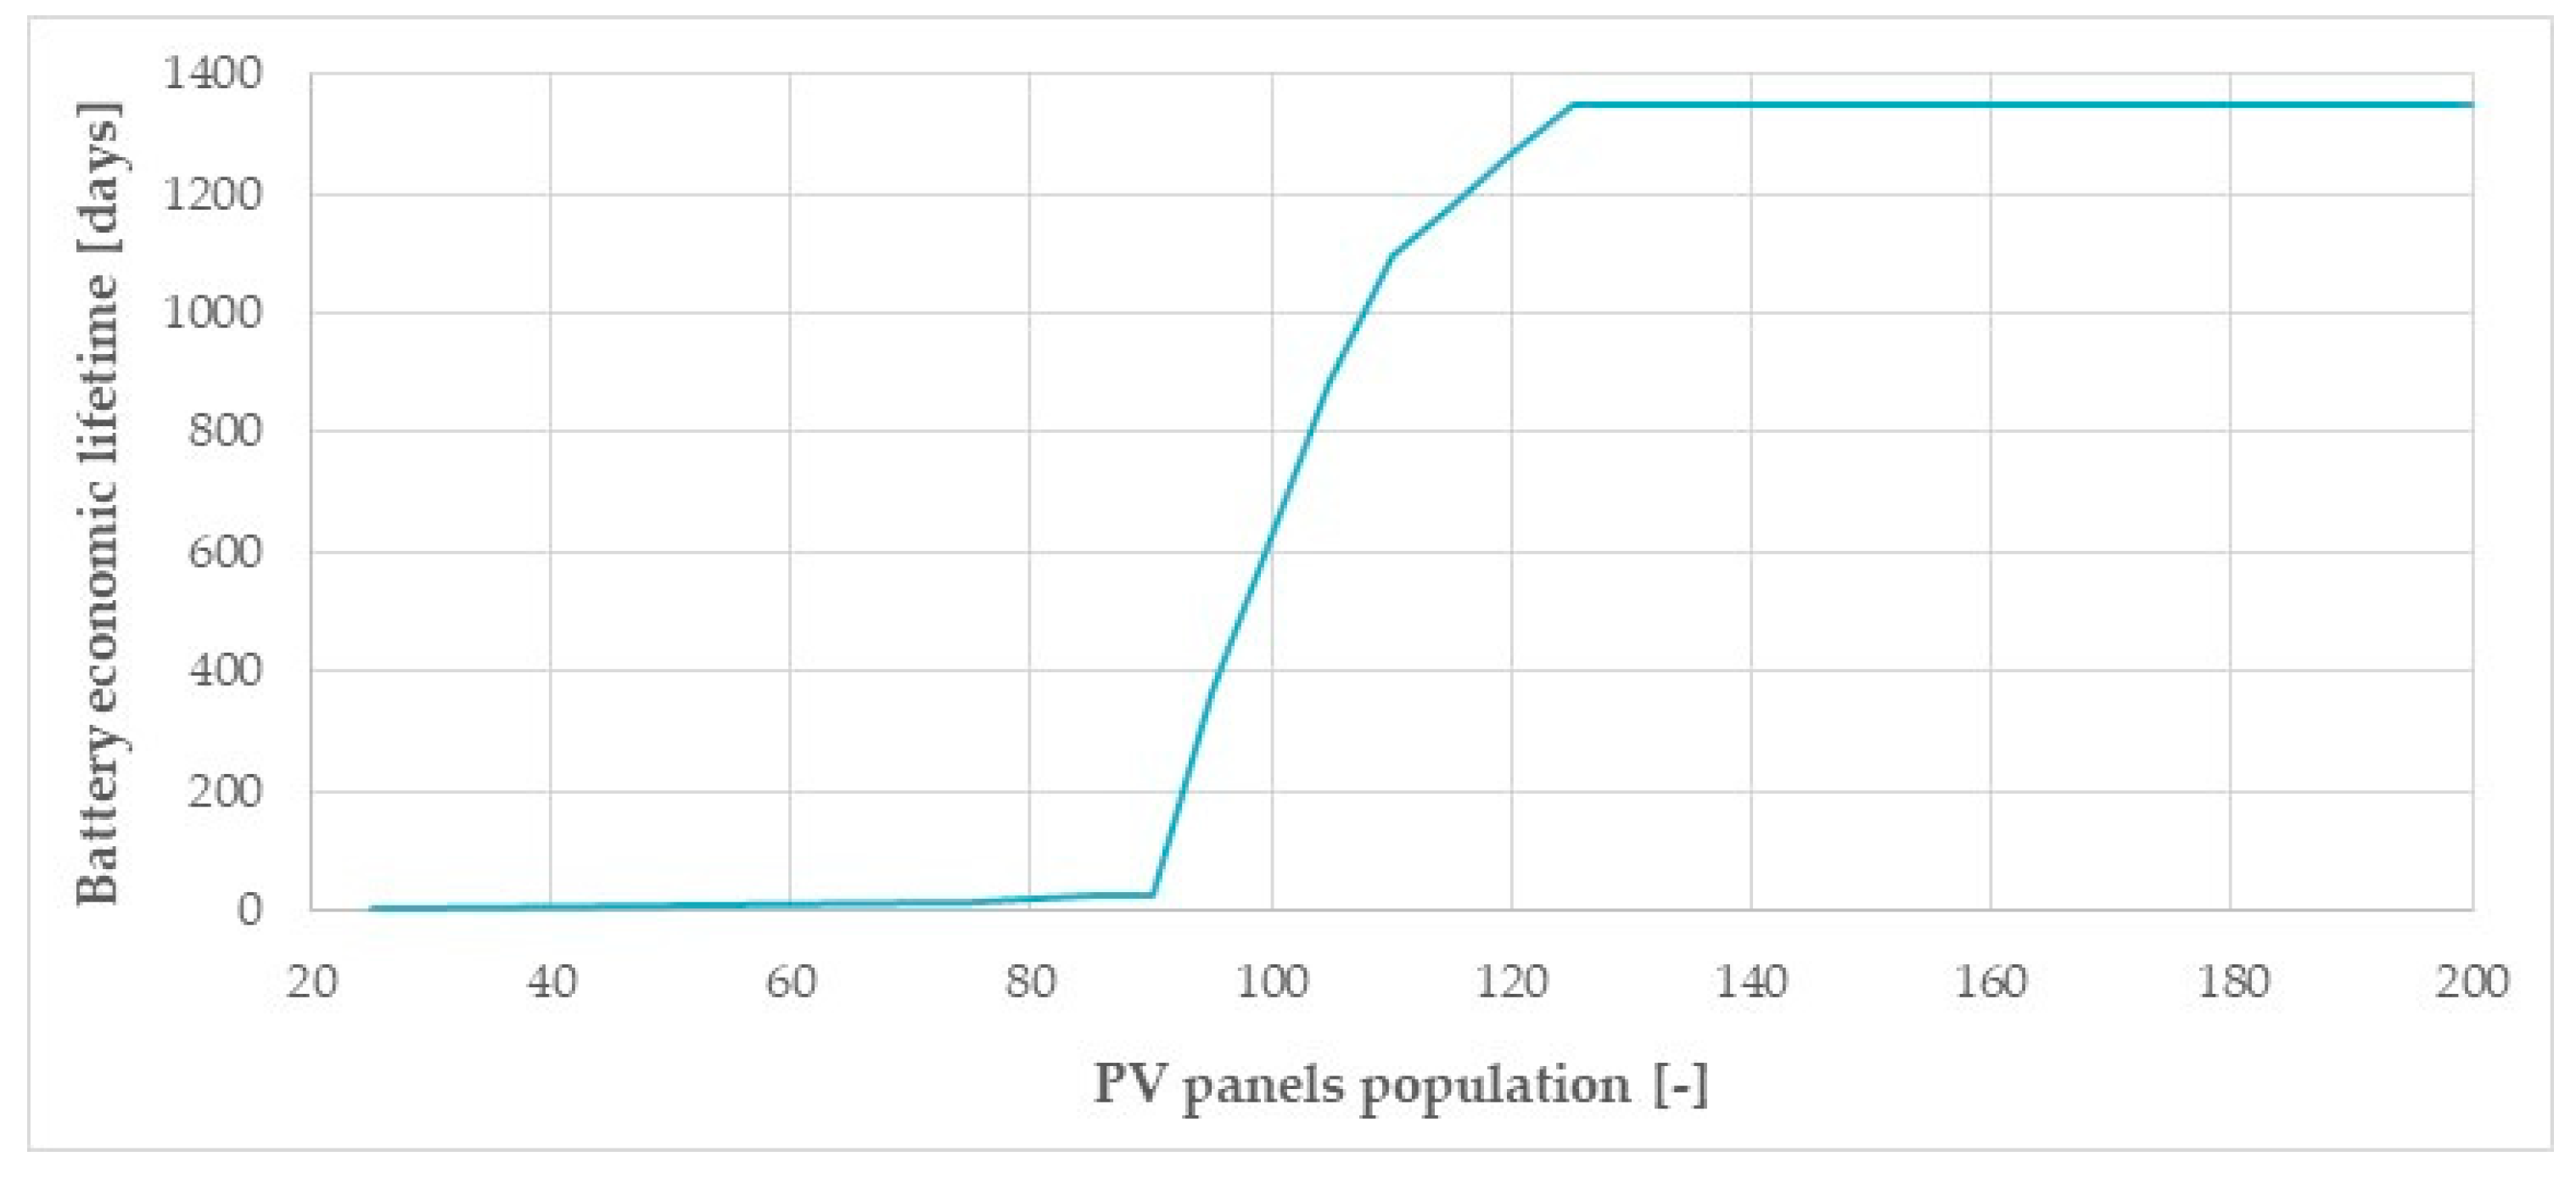
- Estimation of the economic lifetime of the battery: For each SAPV configuration (specific PVs population Npanel, battery type, and battery capacity Cnom) the respective economic lifetime of the battery is going to be determined as the other elements (PVs, electrical installations, etc.) have a constant lifetime. Next, the following subroutine is executed:
- The jinitialth day is set as 1, the available days with temperatures are ND_Temp, while the best function of Equations (55), (58), and (59) for the ND–DoD curves of the specific battery is chosen with respect to the criterions of the mean square error J and correlation index r from Equations (60) and (61).
- The jinitialth day is chosen as the initial current day from the 15 years temperature data, while the necessary initialization is realized, i.e., the initial state of the battery charge (i.e., 80%), etc.
- For the jth current day for each time step t the available solar irradiation Hm-panel-day(t, t + dt) is estimated by Equations (38) and (39) and the PVs power production PPV(t) is calculated by Equation (50) with respect to Equation (51). Similarly, the respective load demand Pload(t) is estimated taking into consideration the temperature-dependent load variation by Equation (24). Next, for each time step the investigation of the phase kind is carried out:If PPV(t) > Pload(t) → charge phase, otherwise discharge phase/no operation phase
- 4.
- At the end of the jth current day the daily degradation loss rate γa-j′ is calculated by Equations (52), (54), and (62), the remaining capacity of battery Cj′ by Equation (64) and the depth of discharge DoD by Equation (35) taking into consideration the smallest battery energy E(t) during the jth current day.
- 5.
- At the end of the jth current day the total life duration of the battery is checked by Equation (63) not to be exhausted and the load demand power loss is checked to be zero by Equation (28). If one of the criterions is not satisfied, the economic battery lifetime Tecon_bat(jinitial) is determined as j-jinitial because of ageing/reliable energy inadequacy reasons, respectively, and the subroutine goes to step 6. Otherwise the jth current day is increased by one, and the subroutine returns to step 3. It is noted that if the jth current day becomes bigger than ND_Temp days after the increment, the jth current day becomes 1, while the difference of the lifetime (j-jinitial) is modified to (j-jinitial + ND_Temp).
- 6.
- The jinitialth day is increased by one and the subroutine returns to step 2, except all available days have been examined as initial ones. If all available days have been examined as initial, the total minimum economic battery lifetime Tecon_bat_min is estimated as:Tecon_bat_min = min{Tecon_bat(jinitial)}
- Estimation of the total cost function: For each SAPV configuration (specific PVs population Npanel, battery type, and battery capacity Cnom) the respective equivalent annual total cost TCannual is calculated by Equations (65) and (66) with respect to the different components costs (i.e., capital, withdrawal, maintenance, etc.) and economic lifetime of elements, where the battery lifetime is determined by Equation (68), while the other ones are constant. From all possible configurations the minimum equivalent annual total cost can be determined easily, while a sensitivity analysis can be carried out.
5. Results and Discussion for the Proposed Design Methodology for Stand Alone Photovoltaic Panels with Batteries
5.1. Available Data for the Stand-Alone Photovoltaic with Batteries for the Electrode Station of Stachtoroi Island
5.2. Determination of the Range for the Crucial Parameters of the Proposed Design Methodology
- PVs population: The population of PVs Npanel could be 25, 50, 75, 80, 85, 90, 95, 100, 105, 110, 115, 120, 125, 130, 135, 140, 145, 150, 155, 160, 165, 175, and 200, which means 23 values.
- Capacity for the 108 V AGM VRLA battery system by Narada: The capacity could be 200, 400, 600, 800, 1000, 1200, 1400, 1600, 1800, 2000, 2200, 2400, 2600, 2800, 3000, 3200, 3400, 3600, 3800, 4000, 4200, 4400, 4700, and 6000 Ah, which means 25 values.
- Capacity for 110 V gel RES SOPzV battery system by Sunlight: The capacity could be 290, 436, 558, 838, 1116, 1396, 1676, 1954, 2232, 2342, 2676, 2931, 3348, 3513, 4014, 4464, 4684, 5352, 5855, and 6690 Ah, which means 20 values.
- Interest rate without inflation: It could be 0%, 0.5%, …, and 10% with a typical value of 3% and 21 values.
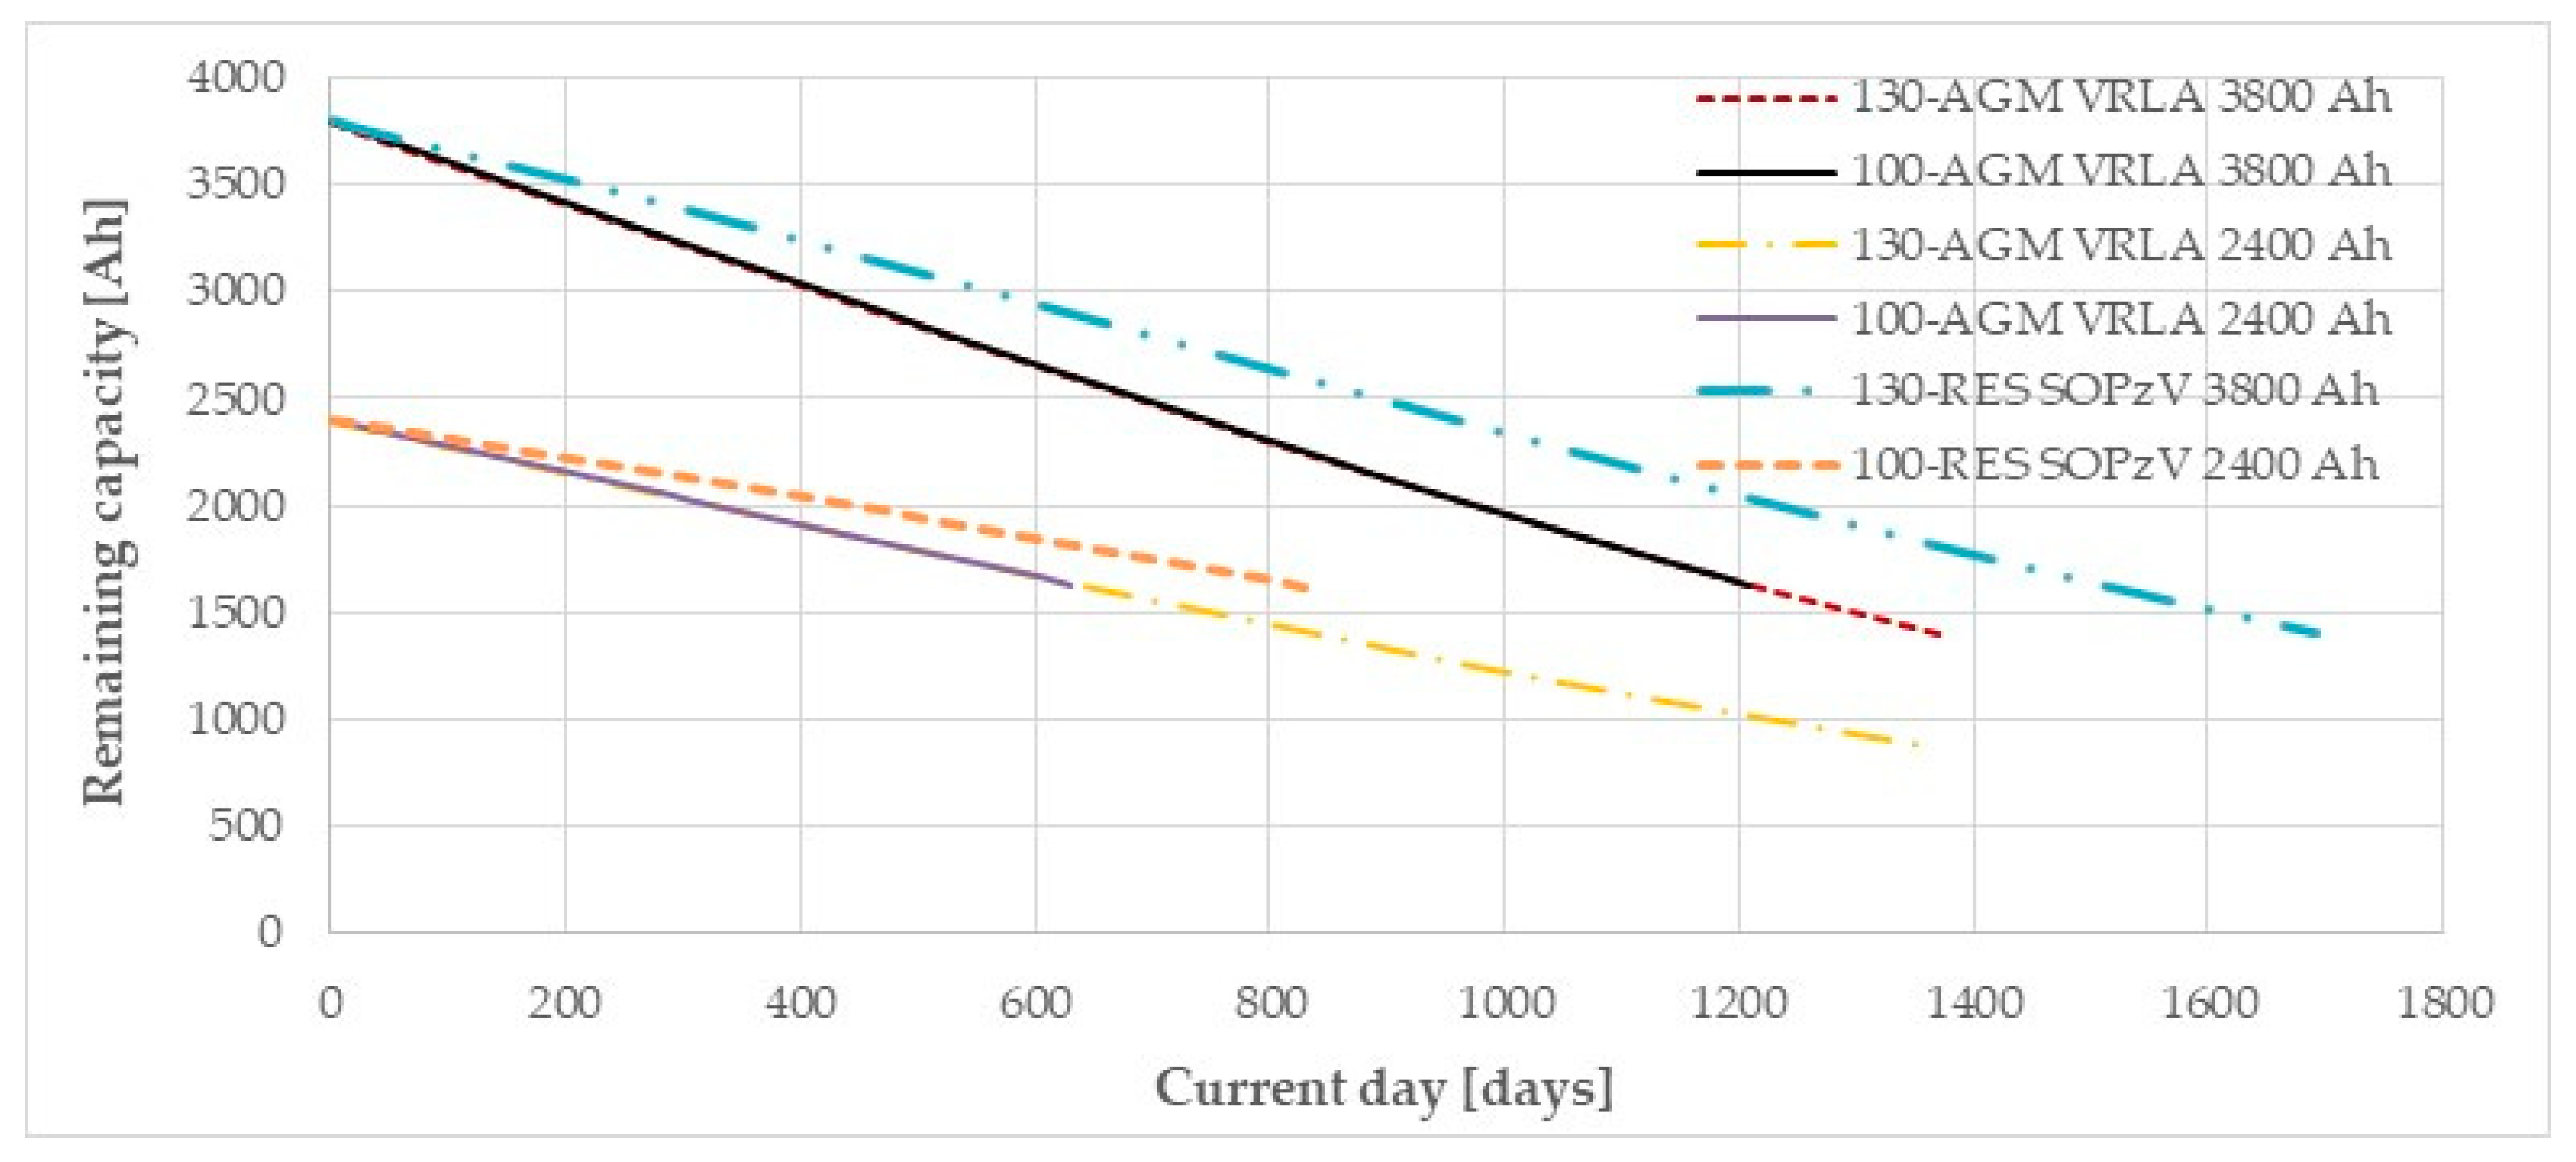
5.3. Estimation of the Economic Lifetime of the Battery
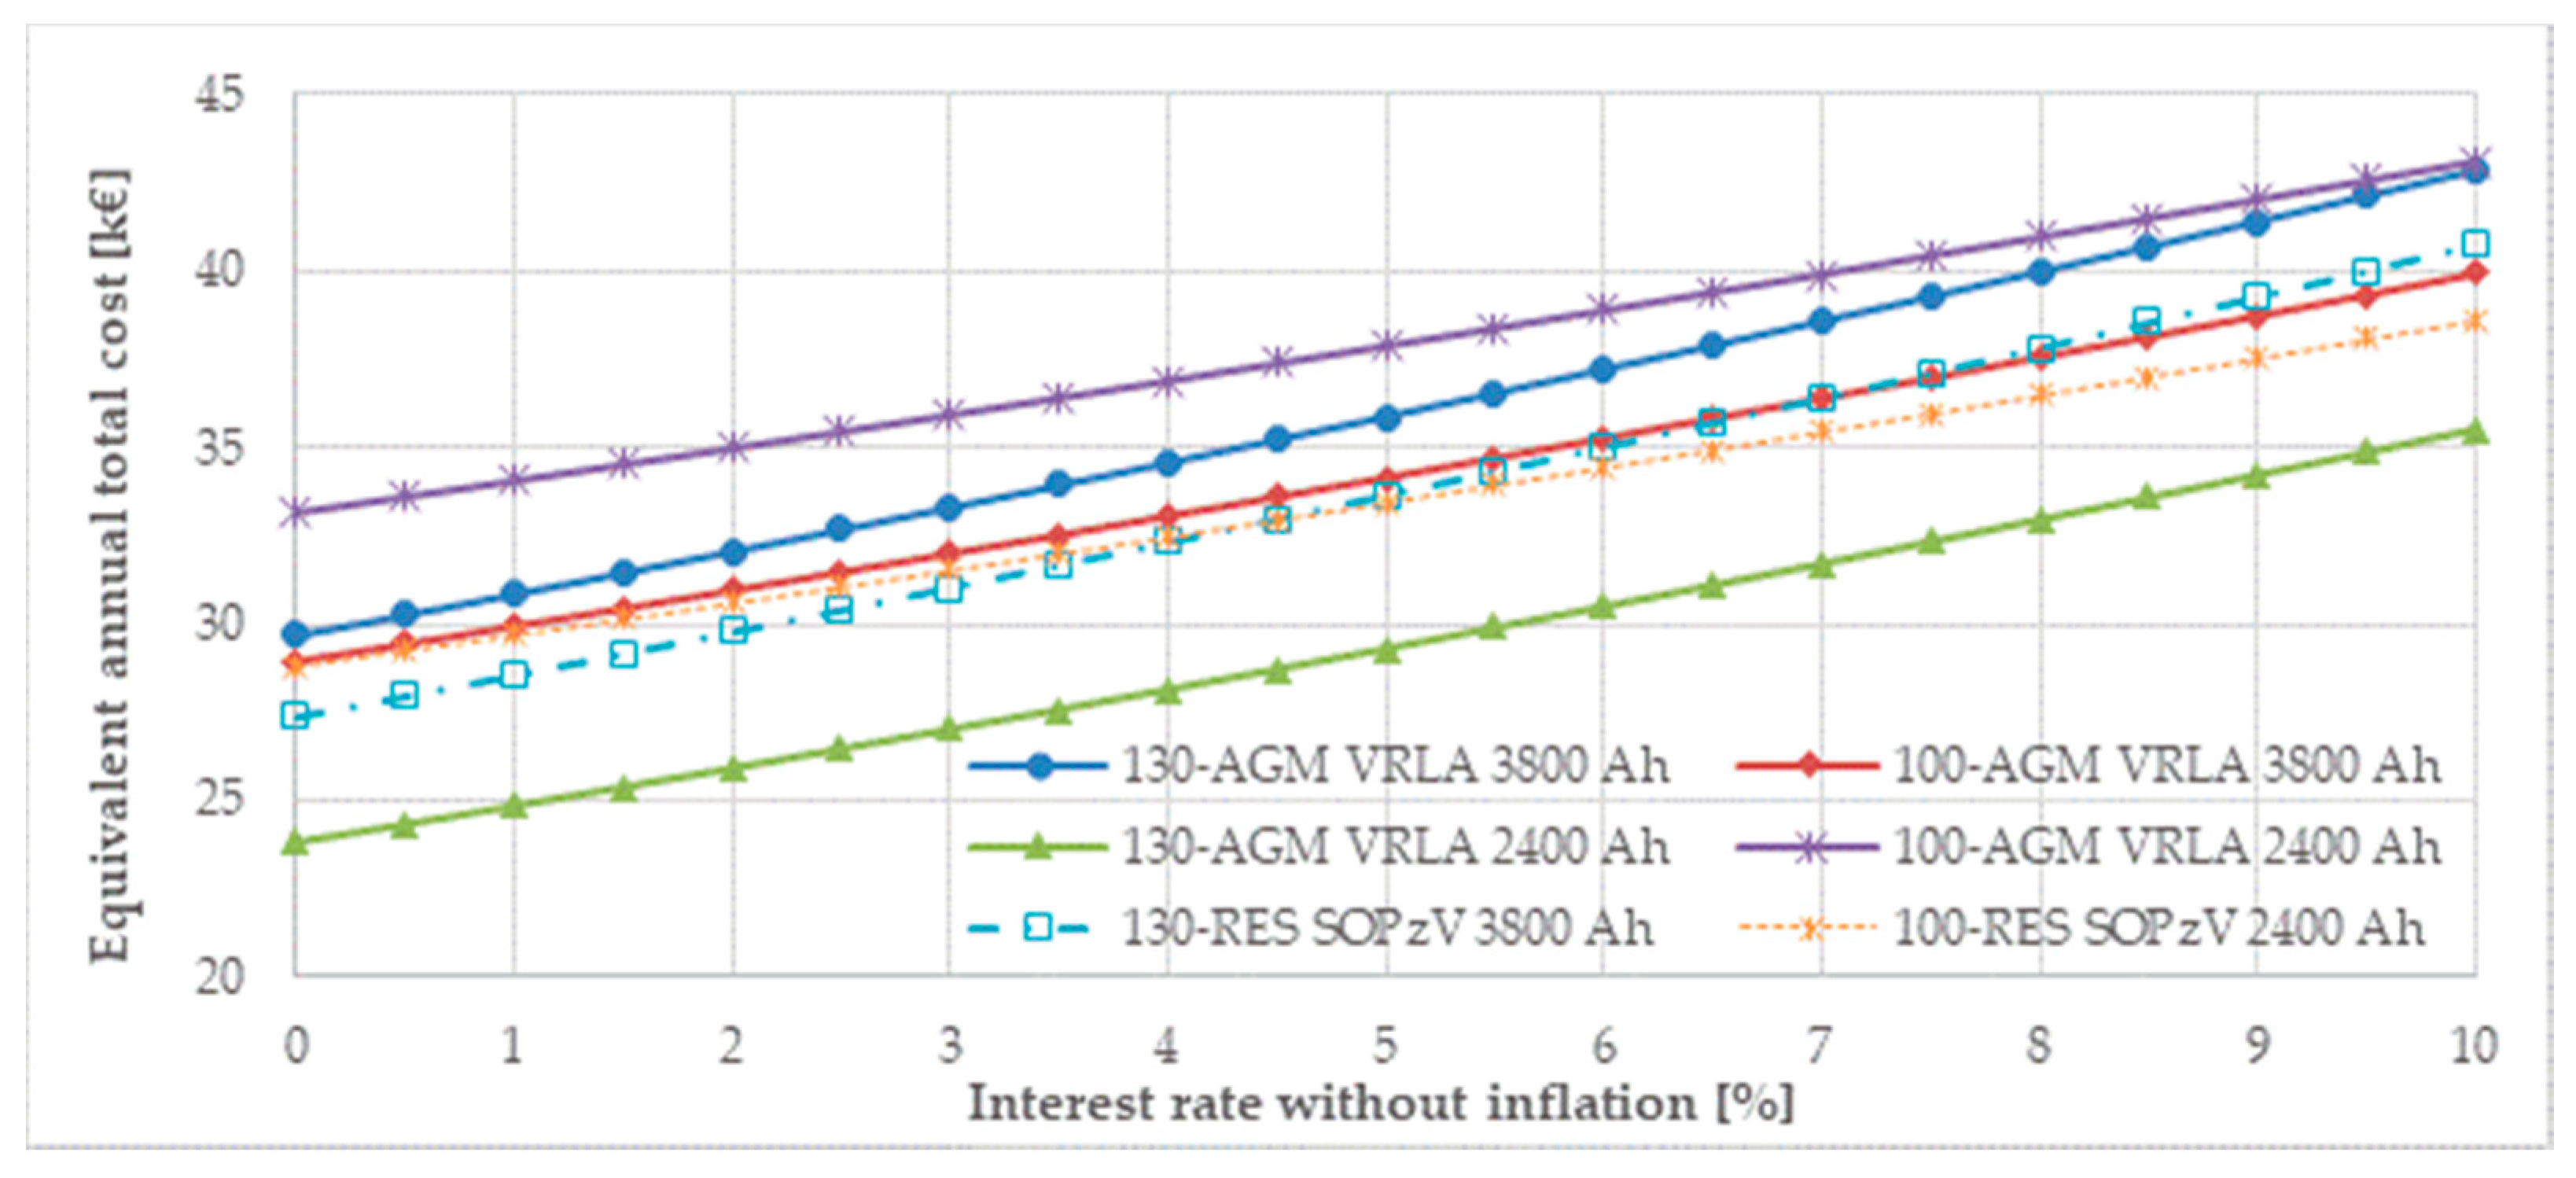
5.4. Estimation of the Equivalent Annual Total Cost and Selection of the Optimized Configuration
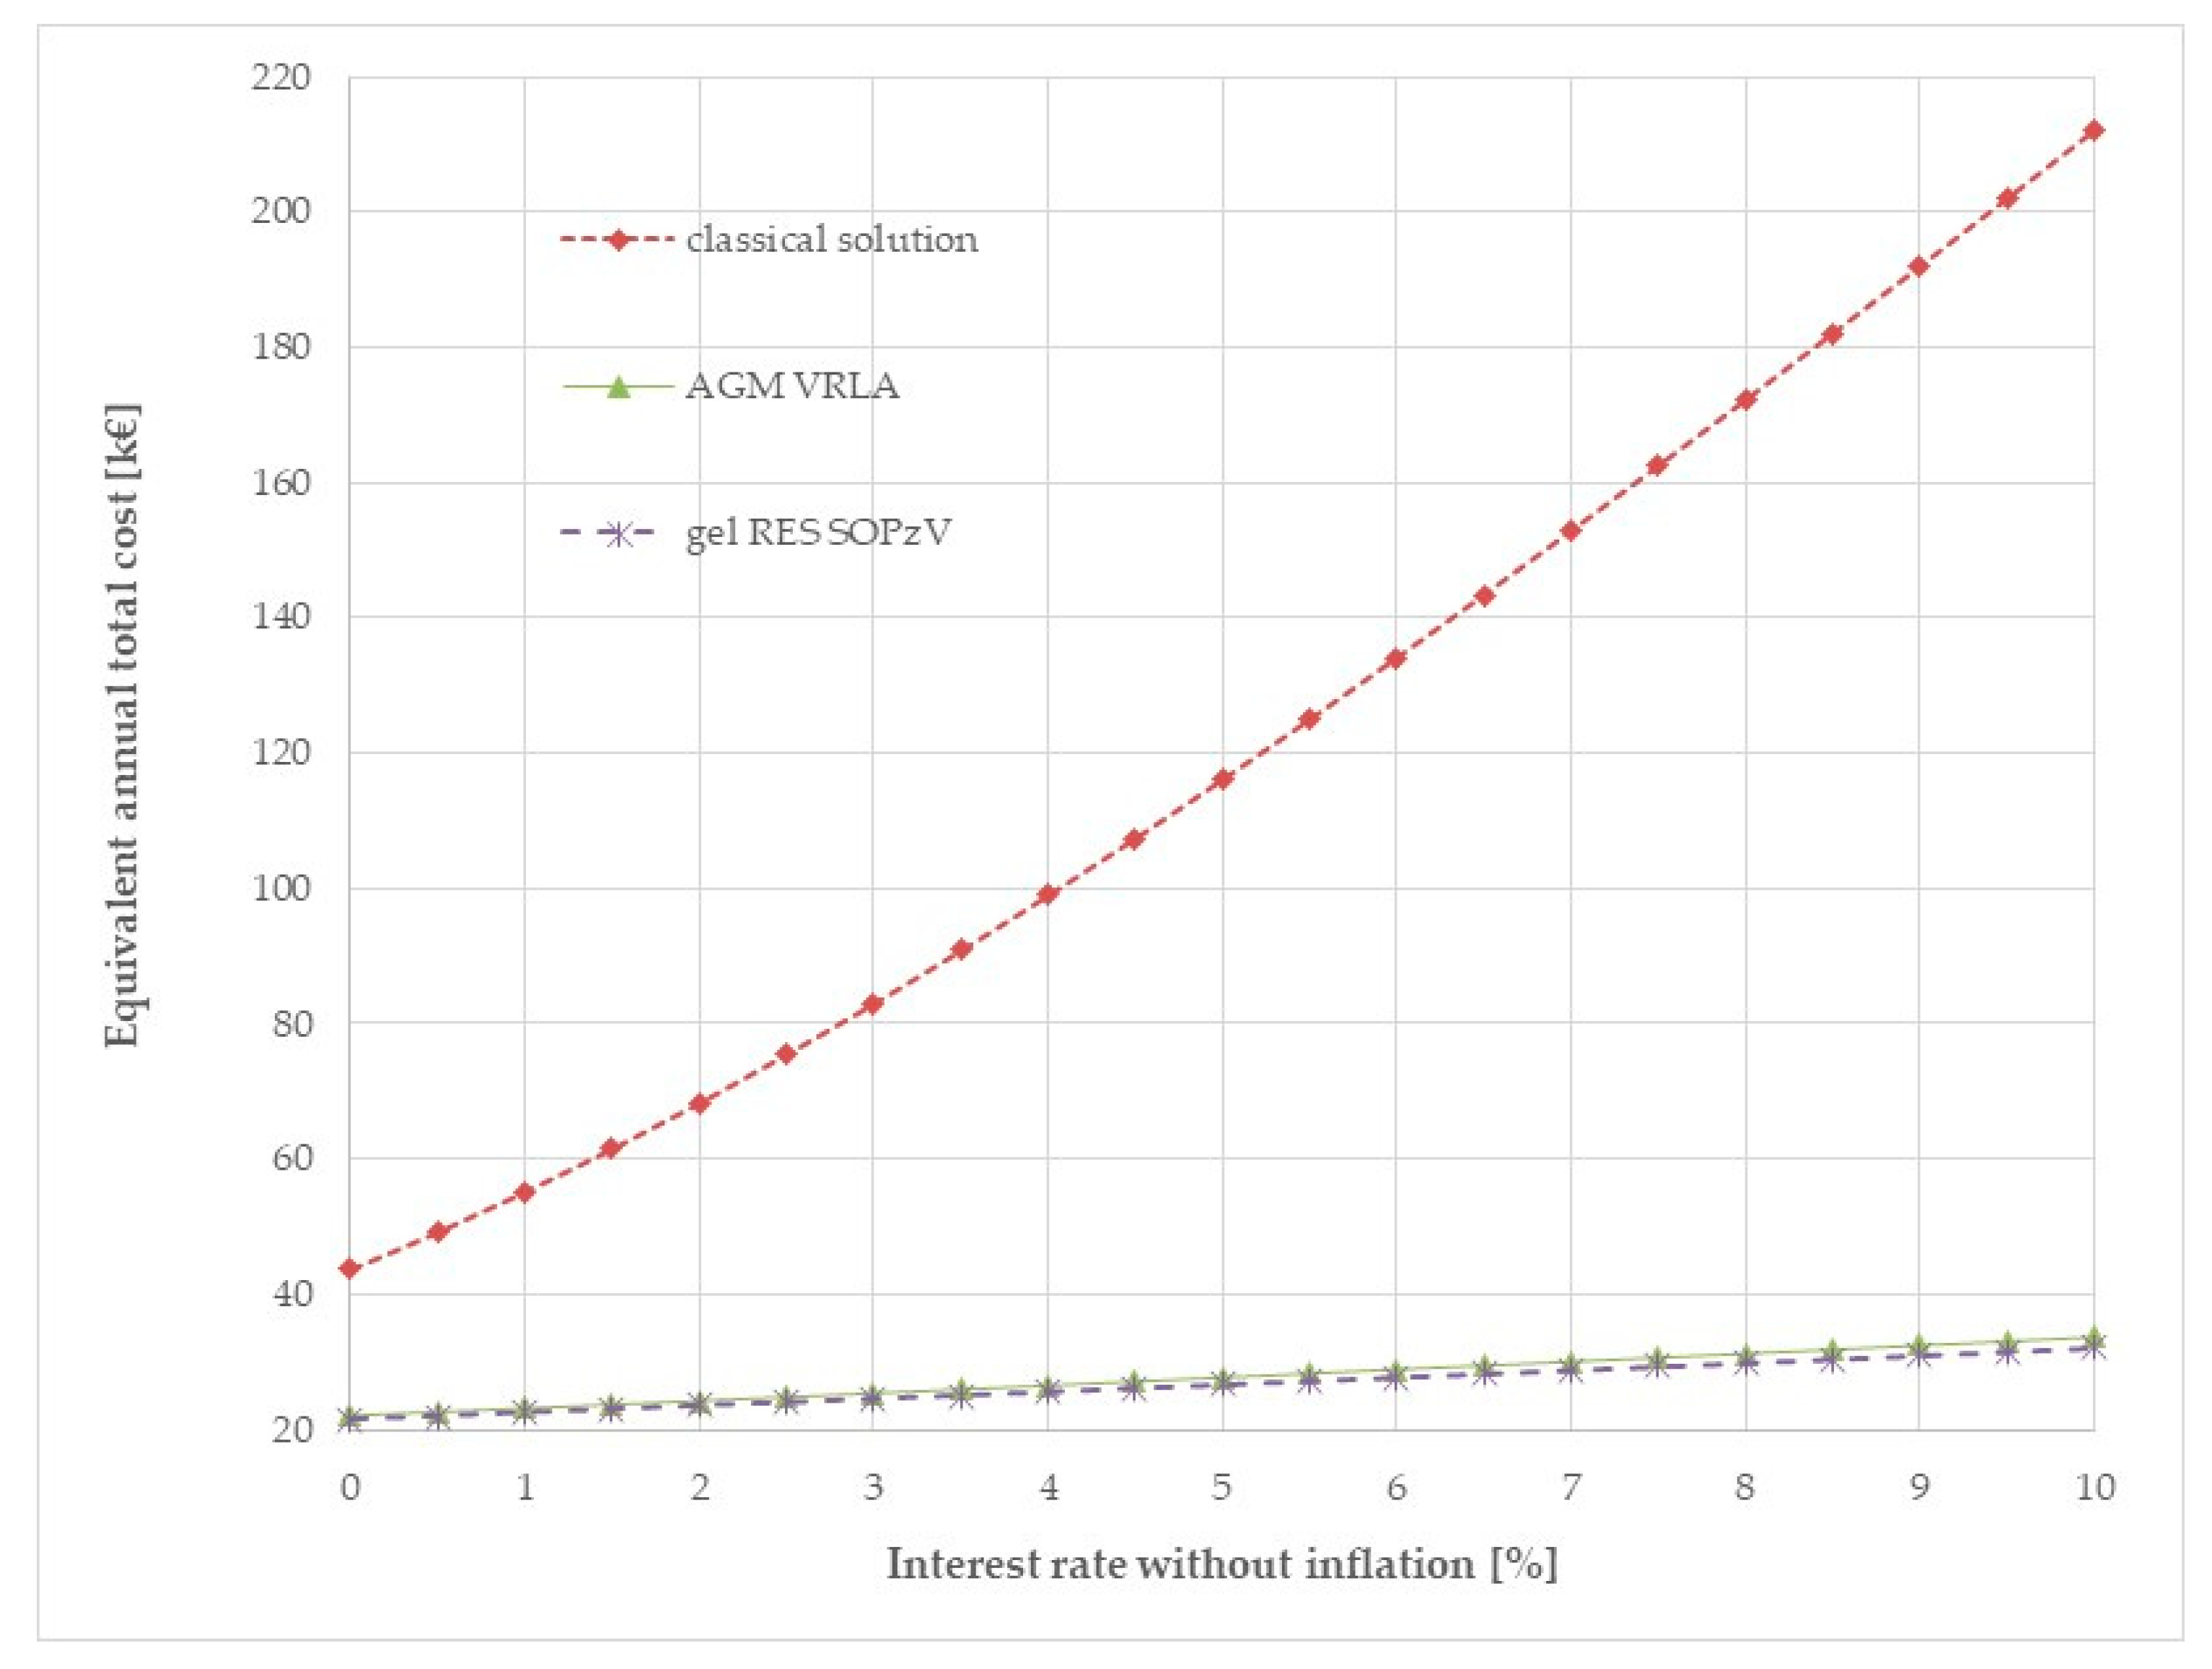
5.5. Comparison of the Proposed SAPV System with a Battery against the Medium Voltage Submarine Connection with the Aegina Island
6. Conclusions
- The optimization process of the SAPV system sizing selects elements (panels, battery modules) from a pool with real technical data at the expense of computational time.
- The optimized solution is realized through the modification of the PVs type and population and of the battery type and capacity based on a sensitivity analysis.
- Scarcely available meteorological data is used introducing the solar radiation modification factor fHmday(t, t + dt) for the calculation of the available solar irradiation Hm-panel-day(t, t + dt) for the time interval (t, t + dt), so the PV produced power is estimated during the respective time interval.
- The daily electric energy consumption for the shoreline electrode station is carried out for each season (winter, summer, and autumn–spring) and different operation modes (stand-alone one and maintenance one) taking into consideration all electrical consumers of the station analytically with high precision.
- Many significant issues are taken into consideration by the proposed methodology, which are ignored or simplified by the classical ones [10], such as:
- ➢
- The lifetime, the capital, installation, maintenance, operation, and withdrawal costs for system elements (i.e., inverters, PVs, chargers, etc.),
- ➢
- The operation of PVs-battery charging cycle,
- ➢
- The battery ageing based on the relationship between battery cycles and depth of discharge,
- ➢
- The remaining capacity because of the battery degradation,
- ➢
- The battery auto-discharge rate,
- ➢
- The adoption of hyperbolic, exponential, and power functions for the battery cycles–depth of discharge curves for each battery with respect to the criteria of the mean square error and correlation index,
- ➢
- The determination of the battery economic lifetime based on ageing/reliable energy inadequacy reasons,
- ➢
- The technical limitations of the system’s elements (i.e., maximum power of chargers/inverters), etc.
- The SAPV system operation is simulated from an energy point of view for every day during the under study period satisfying the reliability criterion directly, where the SAPV operation will be failed, if the load demand is supplied by the back-up diesel-engine generator sets because of energy deficiency of the PVs-batteries system.
- The environmental limitation of CO2 emissions reduction is succeeded indirectly, as the generator sets are going to operate only for maintenance and SAPV forced outage reasons, not for energy supply systematically, which means that CO2 emissions are nullified practically.
- The result comparison proves its superiority against the classical one with respect to the equivalent annual total cost.
- The limitation of the energy consumption,
- The prevention of the danger for electrochemical corrosion of metallic structures by the direct current flow between electrode stations with no use of structural steel and metallic mechanical settlements,
- The protection with the highest significance factor against environmental dangers,
- The reduction of fire risk by the increment of fire-resistance and by supplementation of a fire-fighting system because of ESSs existence and electrode station isolation, etc.
Author Contributions
Funding
Acknowledgments
Conflicts of Interest
Nomenclature
| Abbreviation | Explanation |
| AC | Alternating Current |
| AGM | Absorbed Glass Mat (for batteries) |
| CIGRE | International council on large electric systems |
| DC | Direct Current |
| DoD | Depth of Discharge (for battery) |
| ESS(s) | Energy Storage System(s) |
| FM200 | 1,1,1,2,3,3,3-Heptafluoropropane, also called heptafluoropropane, HFC-227ea (ISO name), HFC-227, apaflurane (INN), which is a colorless, odorless gaseous halocarbon, commonly used as a gaseous fire suppression agent. |
| GIS | Gas Insulated Substation |
| H-EDNO | Hellenic Electricity Distribution Network Operator |
| H-IPTSO | Hellenic Independent Power Transmission Operator |
| HVAC | High Voltage Alternative Current |
| HVAc | Heating–Ventilation–Air condition |
| HVDC | High Voltage Direct Current |
| ICAO | International Aviation Organization |
| IEC | International Electrotechnical Committee |
| LV | Low Voltage |
| LSE | Least Square Errors (method) |
| MIND | Mass Impregnated Non-Drain (for cables) |
| MV | Medium Voltage |
| NFPA | National Fire Protection Association (for USA) |
| SAPV | Stand-Alone Photovoltaic |
| SoC | State of Charge (for battery) |
| STC | Standard Test Conditions (1,5 AM, PSTC = 1000 W/m2, 25 °C) |
| PLC | Programmable Logic Controller |
| PV | Photovoltaic |
| PVs | Photovoltaic panel(s) |
| REs | Renewable Energy Sources |
| VRLA | Valve Regulated Lead Acid (for batteries) |
| W.C. | Water Closet |
| XLPE | Cross-Linked Polyethylene (for cables) |
| Symbol | Explanation |
| Acap-j | equivalent fixed annual capital payment of jth equipment |
| Ccap-j | initial capital value of jth equipment with the equivalent withdrawal cost after the economic lifetime |
| Cinstall-i | installed power of the ith electric consumer |
| Cfix-j | fixed annual cost of jth equipment for maintenance, personnel wages, etc. with respect to PA |
| Cj′ | remaining capacity of battery for the jth day of the time period under study |
| Cnom | essential battery capacity of the ESSs |
| CostInv | inverters total cost |
| CostRES | battery system total cost |
| DoD(t) | battery depth of discharge at time step t |
| DoY | current day of the year for the calculation of daily solar irradiation |
| DTen-PV | temperature difference between the environment and PV panel |
| ELOE | energy loss that does not supply the load demand in case of minimum state of battery charge |
| Eadd | energy loss that is produced by PV in case of maximum state of battery charge |
| Eadd_day | daily energy loss that is produced by PV in the case of the maximum state of battery charge during the time period Tecon_bat_min |
| Eday | daily energy |
| Ei | energy demand for the time period under study per ith consumer category |
| E(t) | battery stored energy at the time step t |
| Hm | total mean solar irradiation at horizontal level in the Earth surface determination |
| Hmd | diffused solar irradiation at horizontal level in the Earth surface |
| Hom | mean monthly extraterrestrial solar irradiation at the horizontal level without the Earth atmosphere |
| Hm-panel | total mean solar irradiation for the south-facing PV panel with slope a in the Earth surface |
| Hm-panel-day | daily available solar irradiation/energy for the selected slope a with the null shadow angle |
| Hm-panel-day(t, t + dt) | available solar irradiation during t and t + dt hours |
| Hm-panel-Tp | total mean solar irradiation for the time period under optimized operation Tp |
| InomPV | nominal current at nominal power for the PV panel at STC: 1.5 AM, PSTC = 1000 W/m2, 25 °C |
| Io | solar constant or long-term average extraterrestrial total solar irradiance (=1367 W/m2) |
| Io-mday | solar radiation intensity |
| J | mean square error |
| Km | lucidity of the mth month |
| Mm | population of days of the mth month |
| NB | number of days on battery operation |
| ND | maximum number of charge–discharge cycles for battery |
| NDi | estimated maximum number of charge–discharge cycles for battery by LSE method |
| NDi,real | experimental maximum number of charge–discharge cycles for battery |
| mean value of the estimated maximum number of charge–discharge cycles for the battery by the LSE method | |
| mean value of experimental maximum number of charge–discharge cycles for battery | |
| ND-j′ | maximum number of cycles allowed for the actual remaining capacity of the battery corresponding to its discharge depth remaining between the specific upper and lower limits of the nominal capacity |
| ND_Temp | available days with temperatures |
| Ni | consumer population per ith consumer category |
| Npanel | necessary population of PV panels |
| Npar | parallel branches for the battery system |
| Nser | series elements for the battery branch system |
| PA | power system total daily peak load |
| PA-i | peak load per ith consumer category |
| P′A-i | partition peak load per ith consumer category at the power system total peak load |
| PLOE(t) | load demand power loss in case of minimum state of battery charge at time step t |
| PPV(t) | PV panels power production at time step t |
| PPVmin | lowest operational limit for power production of PVs power production |
| Pα_mon | essential power supply by the PVs |
| Padd(t) | produced PV power loss in the case of the maximum state of battery charge at time step t |
| Pch-max | maximum battery charge power |
| Pch(t) | battery charge power at time step t |
| Pdis-max | maximum battery discharge power |
| Pdis(t) | battery discharge power at time step t |
| Pinstall-i | total install power of the ith consumer type |
| PnomPV | nominal power for PV panel at STC: 1.5 AM, PSTC = 1000 W/m2, 25 °C |
| Pload(t) | load demand at time step t |
| Pload_split_unit(t) | load demand from split-units at time step t |
| Pload_split_unit_summer | maximum power load demand by a split-unit at temperature Tsummer2 |
| Pload_split_unit_winter | maximum power load demand by a split-unit at temperature Twinter2 |
| RB | correction factor of the total direct mean monthly solar irradiation for the south-facing PV panel with slope a with respect to the total mean monthly solar irradiation for the horizontal PV panel |
| RM | correction factor of the total mean monthly solar irradiation for the south-facing PV panel with slope a with respect to the total mean monthly solar irradiation for the horizontal PV panel |
| SoCmax | maximum state of battery charge |
| SoCmin | minimum state of battery charge |
| SoC(t) | battery state of charge at time step t |
| T | time period |
| TCannual | equivalent annual total cost |
| Tecon_bat(jinitial) | economic battery lifetime |
| Tecon_bat_min | total minimum economic battery lifetime |
| Tj | economic lifetime of jth equipment |
| Tmonth | mean monthly temperature |
| Tp | time period under optimized operation |
| Tref-en | environment temperature for the PV panel |
| Tsummer1 | temperature, for which the split-unit starts its operation during the summer period |
| Tsummer2 | temperature, for which the split unit consumes the maximum power during the summer period |
| Ttemp(t) | environmental temperature at time step t |
| Twinter1 | temperature, for which the split-unit starts its operation during winter period |
| Twinter2 | temperature, for which the split unit consumes its maximum power during the winter period |
| Tyear | annual temperature |
| Vj′(t) | battery voltage for the jth day of the time period under study |
| VND·DoD | constant product between the maximum number of cycles ND and the depth of discharge DoD |
| VnomESS | operation nominal voltage for ESS (battery) |
| VnomPV | nominal voltage at the nominal power for the PV panel at STC: 1.5 AM, PSTC = 1000 W/m2, 25 °C |
| a, a1, a2 | mathematical parameters |
| b, b1, b2 | mathematical parameters |
| c | mathematical parameter |
| cop-j | operation cost of jth equipment, which is analog to the annual operation hours top-j and depends on the maintenance |
| d | mathematical parameter |
| dt | time duration |
| e | mathematical parameter |
| f | mathematical parameter |
| fHmday(t, t + dt) | solar radiation modification factor |
| fd_Temp | typical power decrease factor for PVs because of temperature variation |
| i | ith consumer category, index for the sum |
| ir | interest rate without inflation |
| j | jth day, index for the sum |
| jinitial | initial day of the available temperature data for the estimation of the economic lifetime of the battery |
| k | index for the product |
| kTemp | battery temperature correction factor |
| ℓD | indirect PV service of the electric consumption factor |
| m | mth month |
| mi | mean load factor for the time period under study per ith consumer category |
| n | autonomy population of days |
| nch | charge efficiency factor |
| nd | experimental values pairs (DoD, ND) |
| ndis | discharge efficiency factor |
| nj | number of battery cycles during a day |
| nr | self-discharge rate |
| r | correlation index |
| ri | participation factor at the power system total peak load per ith consumer category |
| t | time step |
| top-j | annual operation hours of jth equipment |
| u(x) | classical step function |
| a | inclination angle/slope for the PV panel |
| β | sun angle position (altitude) during the day |
| γa-j′ | daily degradation loss rate |
| γd-j′ | daily dynamic loss rate |
| γs′ | daily static loss rate |
| δ | solar declination δ |
| ζi | demand factor per ith consumer category |
| ρ | solar radiation reflection factor |
| σTemp | PV temperature correction factor |
| σTotLossPV | factor of the total loss of PVs |
| σTran_el_losses | PV transmission electrical losses correction factor |
| σTran_el_losses_ESS | battery transmission electrical losses correction factor |
| σageing | PV ageing correction factor |
| σageing_ESS | battery ageing correction factor |
| σblocking_diode | blocking diode losses correction factor |
| σcables | PV cables losses factor |
| σi | coincidence factor per ith consumer category |
| σin_Eday | PV daily energy increment factor |
| σin_Eday_ESS | battery daily energy increment factor |
| σno_homogeneity | PV lack of homogeneity factor |
| σpollution | PV pollution correction factor |
| φ | latitude |
| ωs | time sunset |
| ωs′ | hourly sunset angle for the day DoY for the south-facing PV panel with slope a |
References
- Huang, B.J.; Hou, T.F.; Hsu, P.C.; Lin, T.H.; Chen, Y.T.; Chen, C.W.; Li, K.; Lee, K.Y. Design of direct solar PV driven air conditioner. Renew. Energy 2016, 88, 95–101. [Google Scholar] [CrossRef]
- Kazem, H.A.; Khatib, T.; Sopian, K. Sizing of a standalone photovoltaic photovoltaic/battery system at minimum cost for remote housing electrification in Sohar, Oman. Energy Build. 2013, 61, 108–115. [Google Scholar] [CrossRef]
- Benavente, F.; Lundlad, A.; Campana, P.E.; Zhang, Y.; Cabrera, S.; Lindbergh, G. Photovoltaic/battery system sizing for rural electrification in Bolivia: Considering the suppressed demand effect. Appl. Energy 2019, 235, 519–528. [Google Scholar] [CrossRef]
- Tsai, C.T.; Beza, T.M.; Molla, E.M.; Kuo, C.C. Analysis and sizing of mini-grid hybrid renewable energy systems for islands. IEEE Access 2020, 8, 70013–70029. [Google Scholar] [CrossRef]
- Sato, S.; Weidlich, A. Analysis of avoided transmission through decentralized photovoltaic and battery storage systems. IEEE Trans. Sustain. Energy 2020, 11, 1922–1929. [Google Scholar] [CrossRef]
- Achiluzzi, E.; Kobikrishna, K.; Sivabalan, A.; Sabillon, C.; Venkatesh, B. Optimal asset planning for prosumers considering energy storage and photovoltaic (PV) units: A stochastic approach. Energies 2020, 13, 1813. [Google Scholar] [CrossRef] [Green Version]
- Alnaser, S.W.; Althaher, S.Z.; Long, C.; Zhou, Y.; Wu, J. Residential community with PV and batteries: Reserve provision under grid constraints. Int. J. Electr. Power Energy Syst. 2020, 119, 105856. [Google Scholar] [CrossRef]
- Ridha, H.M.; Gomes, C.; Hizam, H.; Ahmadipour, M. Sizing and implementing off-grid stand-alone photovoltaic/battery systems based on multi-objective optimization and techno-economic (MADE) analysis. Energy 2020, 207, 118163. [Google Scholar] [CrossRef]
- Rahman, M.M.; Islam, A.K.M.S.; Salehin, S.; Al-Matin, M.A. Development of a model for techno-economic assessment of a stand-alone off-grid solar photovoltaic system in Bangladesh. Int. J. Renew. Energy Res. 2016, 6, 140–149. [Google Scholar]
- Dervos, C.T. Photovoltaic Systems—From Theory to Practice, 1st ed.; University Press NTUA: Athens, Greece, 2013; pp. 1–526. (In Greek) [Google Scholar]
- Mpizionis, V.D.; Mpizionis, D.V. Alternative Power Sources, 1st ed.; Tziolas Press: Thessaloniki, Greece, 2011; pp. 1–744. (In Greek) [Google Scholar]
- Sarhan, A.; Hizam, H.; Mariun, N.; Ya’acob, M.E. An improved numerical optimization algorithm for sizing and configuration of stand-alone photo-voltaic system components in Yemen. Renew. Energy 2019, 134, 1434–1446. [Google Scholar] [CrossRef]
- Katsaprakakis, D.E. Energy Systems Synthesis, 1st ed.; Hellenic Academic Books: Athens, Greece, 2015; pp. 1–398. (In Greek) [Google Scholar]
- Rossi, F.; Heleno, M.; Basosi, R.; Sinicropi, A. Environmental and economic optima of solar home systems design: A combined LCA and LCC approach. Sci. Total Environ. 2020, 744, 140569. [Google Scholar] [CrossRef] [PubMed]
- Cabral, C.V.T.; Filho, D.O.; Diniz, A.S.A.C.; Martins, J.H.; Toledo, O.M.; Neto, L.V.B.M. A stochastic method for stand-alone photovoltaic sizing. Sol. Energy 2010, 84, 1628–1636. [Google Scholar] [CrossRef]
- Khatib, T.; Elmenreich, W. An improved method for sizing stand-alone photovoltaic systems using reneralized regression neural network. Int. J. Photoenergy 2014, 2014. [Google Scholar] [CrossRef]
- Ridha, H.M.; Gomes, C.; Hizam, H.; Ahmadipour, M.; Muhsen, D.H.; Ethaib, S. Optimum design of a stand-alone solar photovoltaic system based on novel integration of iterative-PESA-II and AHP-VIKOR methods. Processes 2020, 8, 367. [Google Scholar] [CrossRef] [Green Version]
- Mandelli, S.; Barbieri, J.; Mereu, R.; Colombo, E. Off-grid systems for rural electrification in developing countries: Definitions, classification and a comprehensive literature review. Renew. Sustain. Energy Rev. 2016, 58, 1621–1646. [Google Scholar] [CrossRef]
- Goel, S.; Sharma, R. Performance evaluation of stand-alone, grid connected and hybrid renewable energy systems for rural population: A comparative review. Renew. Sustain. Energy Rev. 2017, 78, 1378–1389. [Google Scholar] [CrossRef]
- Luna-Rubio, R.; Trejo-Perea, M.; Vargas-Vazquez, D.; Rios-Moreno, G.J. Optimal sizing of renewable hybrids energy systems: A review of methodologies. Sol. Energy 2012, 86, 1077–1088. [Google Scholar] [CrossRef]
- Al-falahi, M.D.A.; Jayasinghe, S.D.G.; Enshaei, H. A review on recent size optimization methodologies for standalone solar and wind hybrid renewable energy system. Energy Convers. Manag. 2017, 143, 252–274. [Google Scholar] [CrossRef]
- Fadaee, M.; Radzi, M.A.M. Multi-objective optimization of a stand-alone hybrid renewable energy system by using evolutionary algorithms: A review. Renew. Sustain. Energy Rev. 2012, 16, 3364–3369. [Google Scholar] [CrossRef]
- Ridha, H.M.; Gomes, C.; Hizam, H.; Ahmadipour, M.; Heidari, A.A.; Chen, H. Multi-objective optimization and multi-criteria decision-making methods for optimal design of standalone photovoltaic system: A comprehensive review. Renew. Sustain. Energy Rev. 2021, 135, 110202. [Google Scholar] [CrossRef]
- Khan, F.A.; Pal, N.; Saeed, S.H. Review of solar photovoltaic and wind hybrid energy systems for sizing strategies optimization and cost analysis methodologies. Renew. Sustain. Energy Rev. 2018, 52, 937–947. [Google Scholar] [CrossRef]
- Khatib, T.; Ibrahim, I.A.; Mohamed, A. A review on sizing methodologies of photovoltaic array and storage battery in a standalone photovoltaic system. Energy Convers. Manag. 2016, 120, 430–448. [Google Scholar] [CrossRef]
- Singh, G.K. Solar power generation by PV (photovoltaic) technology: A review. Energy 2013, 53, 1–13. [Google Scholar] [CrossRef]
- Lian, J.; Zhang, Y.; Ma, C.; Yanga, Y.; Chaima, E. A review on recent sizing methodologies of hybrid renewable energy systems. Energy Convers. Manag. 2019, 199, 112027. [Google Scholar] [CrossRef]
- Banik, R.; Das, P. A Review on Architecture, Performance and Reliability of Hybrid Power System. J. Inst. Eng. Series B 2020, 101, 527–539. [Google Scholar] [CrossRef]
- Siddaiah, R.; Saini, R.P. A review on planning, configurations, modeling and optimization techniques of hybrid renewable energy systems for off grid applications. Renew. Sustain. Energy Rev. 2016, 58, 376–396. [Google Scholar] [CrossRef]
- Mahesh, A.; Sandhu, K.S. Hybrid wind/photovoltaic energy system developments: Critical review and findings. Renew. Sustain. Energy Rev. 2015, 52, 1135–1147. [Google Scholar] [CrossRef]
- Bullich-Massagué, E.; Cifuentes-García, F.J.; Glenny-Crende, I.; Cheah-Mañé, M.; Aragüés-Peñalba, M.; Díaz-González, F.; Gomis-Bellmunt, O. A review of energy storage technologies for large scale photovoltaic power plants. Appl. Energy 2020, 274, 115213. [Google Scholar] [CrossRef]
- Katsaprakakis, D.A.; Dakanali, I.; Condaxakis, C.; Christakis, D.G. Comparing electricity storage technologies for small insular grids. Appl. Energy 2019, 251, 113332. [Google Scholar] [CrossRef]
- Gutierrez-Martin, F.; Calcerrada, A.B.; de Lucas-Consuerga, A.; Dorado, F. Hydrogen storage for off-grid power supply based on solar PV and electrochemical reforming of ethanol-water solutions. Renew. Energy 2020, 147, 639–649. [Google Scholar] [CrossRef]
- Leon, D.R.F.; Cavaliero, C.K.N.; da Silva, E.P. Technical and economical design of PV system and hydrogen storage including a sodium hypochlorite plant in a small community: Case of study of Paraguay. Int. J. Hydrog. Energy 2020, 45, 5474–5480. [Google Scholar] [CrossRef]
- Hassani, H.; Zaouche, F.; Rekioua, D.; Belaid, S.; Rekioua, T.; Bacha, S. Feasibility of a standalone photovoltaic/battery system with hydrogen production. J. Energy Storage 2020, 31, 101644. [Google Scholar] [CrossRef]
- Dawood, F.; Shafiullah, G.M.; Anda, M. Stand-alone microgrid with 100% renewable energy: A case study with hybrid solar PV-battery-hydrogen. Sustainability 2020, 12, 2047. [Google Scholar] [CrossRef] [Green Version]
- Ma, T.; Yang, H.; Lu, L.; Peng, J. Pumped storage-based standalone photovoltaic power generation system: Modeling and techno-economic optimization. Appl. Energy 2015, 137, 649–659. [Google Scholar] [CrossRef]
- Zhao, P.; Xu, W.; Zhang, S.; Wang, J.; Dai, Y. Technical feasibility assessment of a standalone photovoltaic/wind/adiabatic compressed air energy storage based hybrid energy supply system for rural mobile base station. Energy Convers. Manag. 2020, 206, 112486. [Google Scholar] [CrossRef]
- Bhayo, B.A.; Al-Kayiem, H.H.; Gilani, S.I.U.; Ismail, F.B. Power management optimization of hybrid solar photovoltaic-battery integrated with pumped-hydro-storage system for standalone electricity generation. Energy Convers. Manag. 2020, 215, 112942. [Google Scholar] [CrossRef]
- Loubna, A.; Riad, T.; Salima, M. Standalone photovoltaic array fed induction motor driven water pumping system. Int. J. Electr. Comput. Eng. 2020, 10, 4534–4542. [Google Scholar] [CrossRef]
- Sidney, S.; Thomas, J.; Dhasan, M.L. A standalone PV operated DC milk chiller for Indian climate zones. Sadhana 2020, 45, 110. [Google Scholar] [CrossRef]
- Baaqeel, H.; Abdelhady, F.; Alghamdi, A.; El-Halwagi, M.M. Optimal design and scheduling of a solar-assisted domestic desalination systems. Comput. Chem. Eng. 2020, 132, 106605. [Google Scholar] [CrossRef]
- Shan, C.; Lv, M.; Sun, K.; Gao, J. Analysis of energy system configuration and energy balance for stratospheric airship based on position energy storage strategy. Aerosp. Sci. Technol. 2020, 101, 105844. [Google Scholar] [CrossRef]
- Ariadni Interconnection. Technical Description of Shoreline Electrodes for HVDC Link Attica-Crete, 1st ed.; Ariadni Interconnection: Athens, Greece, 2019; pp. 1–30. [Google Scholar]
- CIGRE Working Group B4.61. General Guidelines for HVDC Electrode Design, 1st ed.; CIGRE: Paris, France, 2017; Volume 675, pp. 1–150. [Google Scholar]
- International Electrotechnical Commission. IEC/TS 62344—Design of Earth Electrode Stations for High Voltage Direct Current (HVDC) Links—General Guidelines, 1st ed.; IEC: Geneva, Switzerland, 2013; pp. 1–91. [Google Scholar]
- Lupangu, C.; Bansal, R.C. A review of technical issues on the development of solar photovoltaic systems. Renew. Sustain. Energy Rev. 2017, 73, 950–965. [Google Scholar] [CrossRef]
- Kabouris, J.; Karystianos, M.; Nomikos, B.; Tsourakis, G.; Mantzaris, J.; Sakellaridis, N.; Voumvoulakis, E. Power system static and dynamic security studies for the 1st phase of Crete Island Interconnection. J. Energy 2018, 67, 33–43. [Google Scholar]
- Woud, H.K.; Stapersma, D. Design of Propulsion and Electric Power Generation Systems, 1st ed.; IMarEST Publications: London, UK, 2002; pp. 1–494. [Google Scholar]
- ABB. Switchgear Manual, 11th ed.; ABB AG: Berlin, Germany, 2008; pp. 1–896. [Google Scholar]
- Official Gazette. Building Energy Saving Regulations, 2nd ed.; Ministerial Decree; B.2367/12.7.2017; Official Gazette: Elláda, Greece, 2017.
- National Fire Protection Association. NFPA 72, National Fire Alarm Code; NFPA: Quincy, MA, USA, 2007; p. 272. [Google Scholar]
- National Fire Protection Association. NFPA 855, Standard for the Installation of Stationary Energy Storage Systems; NFPA: Quincy, MA, USA, 2020. [Google Scholar]
- National Fire Protection Association. NFPA 75, Standard for the Protection of Electronic Computer/Data Processing Equipment; NFPA: Quincy, MA, USA, 1999; p. 18. [Google Scholar]
- Rajput, S.; Saikia, P.P. Fire Extinguishing Agents: Sort and Comparison. Int. J. Res. Appl. Sci. Eng. Technol. 2018, 6, 557–567. [Google Scholar] [CrossRef]
- National Fire Protection Association. NFPA 2001, Standard on Clean Agent Fire Extinguishing Systems; NFPA: Quincy, MA, USA, 2000; p. 106. [Google Scholar]
- National Fire Protection Association. NFPA 13, Standard for the Installation of Sprinkler Systems; NFPA: Quincy, MA, USA, 2000; p. 746. [Google Scholar]
- The Impulse Firefighting Gun and Its Supply Units. Available online: https://www.ifex3000.com/en/impulse-firefighting-gun/ (accessed on 2 August 2020).
- Map of Attica Greece. Available online: https://www.in2greece.com/mappages/stereaellada/attica.htm (accessed on 2 August 2020).
- SOLBIAN SXp154L Panel. Available online: https://solbian.gr/index.php?route=product/product&path=20_62&product_id=74 (accessed on 1 May 2020).
- Technologies. Available online: http://en.naradapower.com/index.php/technologies?ctype=75 (accessed on 1 May 2020).
- Reserve Power Batteries. Available online: https://www.systems-sunlight.com/product/applications/ups/spb-agm-batteries/# (accessed on 1 May 2020).
- Yang, Y.; Lian, C.; Ma, C.; Zhang, Y. Research on Energy Storage Optimization for Large-Scale PV Power Stations under Given Long-Distance Delivery Mode. Energies 2019, 13, 27. [Google Scholar] [CrossRef] [Green Version]
- Wang, S.; Liu, S.; Yang, F.; Bai, X.; Yue, C. Novel Power Allocation Approach in a Battery Storage Power Station for Aging Minimization. Front. Energy Res. 2020, 7, 166. [Google Scholar] [CrossRef]
- Hein, K.; Yan, X.; Wilson, G. Optimal multi-objective scheduling of hybrid ferry with shore to shore power supply considering energy storage degradation. Electronics 2020, 9, 849. [Google Scholar] [CrossRef]
- SMA Sunny Tripower 8000 TL. Available online: http://www.europe-solarshop.com/inverters/sma/sma-sunny-tripower-8000tl.html (accessed on 1 May 2020).
- GSA 110 VDC Battery Charger. Available online: https://www.indiamart.com/proddetail/110-vdc-battery-charger-10100011155.html (accessed on 1 May 2020).


| Normal Mode with PVs and Batteries | Maintenance Mode with Diesel-Electric Units in Operation | ||||||||||||
|---|---|---|---|---|---|---|---|---|---|---|---|---|---|
| Room/A | Electric Consumption | Cinstall-i | Νi… | nstall-i | ζi | σi | mi | PA-i | Εi | σi | mi | PA-i | Εi |
| (m2) | (–) | (W) | (–) | (W) | (–) | (–) | (–) | (W) | (Wh) | (–) | (–) | (W) | (Wh) |
| Generator 1 or 2/6.00 | Lighting | 16 | 2 | 32 | 1.0 | 0.0 | 0.0 | 0.0 | 0.0 | 1.0 | 0.5 | 32 | 384 |
| Ventilation 1 | 13 | 1 | 13 | 1.0 | 1.0 | 1.0 | 13 | 312 | 1.0 | 0.49 | 13 | 153 | |
| Ventilation 2 | 110 | 2 | 220 | 1.0 | 0.0 | 0.0 | 0.0 | 0.0 | 1.0 | 0.51 | 220 | 2693 | |
| Sockets | 3500 | 1 | 3500 | 1.0 | 0.0 | 0.0 | 0.0 | 0.0 | 0.3 | 0.01 | 1050 | 252 | |
| Dehumidifier | 22.5 | 1 | 22.5 | 1.0 | 1.0 | 0.6 | 22.5 | 324 | 1.0 | 0.5 | 22.5 | 270 | |
| Tank 1 or 2/3.24 | Lighting | 16 | 1 | 16 | 1.0 | 0.0 | 0.0 | 0.0 | 0.0 | 1.0 | 0.05 | 16 | 19.2 |
| Ventilation | 13 | 1 | 13 | 1.0 | 1.0 | 0.4 | 13 | 124.8 | 1.0 | 0.4 | 13 | 124.8 | |
| Motors | 9 | 1 | 9 | 1.0 | 0.0 | 0.0 | 0.0 | 0.0 | 1.0 | 0.06 | 9.0 | 12.96 | |
| Sockets | 3500 | 1 | 3500 | 1.0 | 0.0 | 0.0 | 0.0 | 0.0 | 0.3 | 0.005 | 1050 | 126 | |
| Dehumidifier | 22.5 | 1 | 22.5 | 1.0 | 1.0 | 0.33 | 22.5 | 178.2 | 1.0 | 0.33 | 22.5 | 178.2 | |
| Storage/3.20 | Lighting | 16 | 1 | 16 | 1.0 | 0.0 | 0.0 | 0.0 | 0.0 | 1.0 | 0.05 | 16 | 19.2 |
| Ventilation | 13 | 1 | 13 | 1.0 | 1.0 | 0.4 | 13 | 124.8 | 1.0 | 0.4 | 13 | 124.8 | |
| Motors | 1900 | 1 | 1900 | 1.0 | 0.0 | 0.0 | 0.0 | 0.0 | 1.0 | 0.005 | 1900 | 228 | |
| Sockets | 3500 | 1 | 3500 | 1.0 | 0.0 | 0.0 | 0.0 | 0.0 | 0.3 | 0.005 | 1050 | 126 | |
| Dehumidifier | 22.5 | 1 | 22.5 | 1.0 | 1.0 | 0.32 | 22.5 | 172.8 | 1.0 | 0.32 | 22.5 | 172.8 | |
| Water and fire pump/8.14 | Lighting | 16 | 4 | 64 | 1.0 | 0.0 | 0.0 | 0.0 | 0.0 | 1.0 | 0.05 | 64 | 76.8 |
| Ventilation 1 | 13 | 1 | 13 | 1.0 | 1.0 | 1.0 | 13 | 312 | 1.0 | 0.99 | 13 | 309 | |
| Ventilation 2 | 245 | 2 | 220 | 1.0 | 0.0 | 0.0 | 0.0 | 0.0 | 1.0 | 0.01 | 490 | 117.6 | |
| Water pump | 1000 | 2 | 2000 | 0.5 | 1.0 | 0.01 | 1000 | 240 | 1.0 | 0.02 | 1000 | 480 | |
| Jockey fire pump | 1000 | 1 | 1000 | 1.0 | 1.0 | 0.001 | 1000 | 24 | 1.0 | 0.001 | 1000 | 24 | |
| Air-compressor | 2000 | 1 | 2000 | 1.0 | 1.0 | 0.001 | 2000 | 48 | 1.0 | 0.001 | 2000 | 48 | |
| FM200 fire station 1 | 100 | 1 | 100 | 1.0 | 1.0 | 0.10 | 100 | 240 | 1.0 | 0.10 | 100 | 240 | |
| Sockets | 3500 | 1 | 3500 | 1.0 | 0.0 | 0.0 | 0.0 | 0.0 | 0.3 | 0.005 | 1050 | 126 | |
| Normal Mode with PVs and Batteries | Maintenance Mode with Diesel-Electric Units in Operation | ||||||||||||
|---|---|---|---|---|---|---|---|---|---|---|---|---|---|
| Room/A | Electric Consumption | Cinstall-i | Νi… | nstall-i | ζi | σi | mi | PA-i | Εi | σi | mi | PA-i | Εi |
| (m2) | (–) | (W) | (–) | (W) | (–) | (–) | (–) | (W) | (Wh) | (–) | (–) | (W) | (Wh) |
| Battery 1 or 2/6.00 | Lighting | 16 | 2 | 32 | 1.0 | 0.0 | 0.0 | 0.0 | 0.0 | 1.0 | 0.5 | 32 | 384 |
| Ventilation | 13 | 1 | 13 | 1.0 | 1.0 | 1.0 | 13 | 312 | 1.0 | 1.0 | 13 | 312 | |
| Sockets | 3500 | 1 | 3500 | 1.0 | 0.0 | 0.0 | 0.0 | 0.0 | 0.3 | 0.005 | 1050 | 126 | |
| Dehumidifier | 22.5 | 1 | 22.5 | 1.0 | 1.0 | 0.6 | 22.5 | 324 | 1.0 | 0.6 | 22.5 | 324 | |
| Split unitSummer | 1240 | 1 | 1240 | 1.0 | 1.0 | 0.22 | 1240 | 6547 | 1.0 | 0.22 | 1240 | 6547 | |
| Split unitWinter | 1200 | 1 | 1200 | 1.0 | 1.0 | 0.20 | 1200 | 5760 | 1.0 | 0.20 | 1200 | 5760 | |
| Electrode station/24.5 | Lighting | 16 | 8 | 128 | 1.0 | 0.0 | 0.0 | 0.0 | 0.0 | 1.0 | 0.3 | 128 | 921.6 |
| Ventilation | 30 | 1 | 30 | 1.0 | 1.0 | 1.0 | 30 | 720 | 1.0 | 1.0 | 30 | 720 | |
| PLC System | 100 | 2 | 100 | 1.0 | 1.0 | 0.5 | 200 | 2400 | 1.0 | 0.5 | 100 | 2400 | |
| Control system | 100 | 1 | 100 | 1.0 | 1.0 | 0.8 | 100 | 1920 | 1.0 | 0.5 | 100 | 1920 | |
| Sockets | 3500 | 1 | 3500 | 1.0 | 0.0 | 0.0 | 0.0 | 0.0 | 0.3 | 0.1 | 1050 | 2520 | |
| Dehumidifier | 22.5 | 2 | 45 | 1.0 | 1.0 | 1.0 | 45 | 1080 | 1.0 | 1.0 | 45 | 1080 | |
| Split unitSummer | 1240 | 1 | 1240 | 1.0 | 1.0 | 0.76 | 1240 | 22,618 | 1.0 | 0.76 | 1240 | 22,618 | |
| Split unitWinter | 1200 | 1 | 1200 | 1.0 | 1.0 | 0.58 | 1200 | 16,704 | 1.0 | 0.58 | 1200 | 16,704 | |
| Control-accommodation/11.5 | Lighting | 16 | 4 | 64 | 1.0 | 0.0 | 0.0 | 0.0 | 0.0 | 1.0 | 0.3 | 64 | 460.8 |
| Ventilation | 25 | 1 | 25 | 1.0 | 1.0 | 1.0 | 25 | 600 | 1.0 | 1.0 | 25 | 600 | |
| FM200 fire station 2 | 50 | 1 | 50 | 1.0 | 1.0 | 0.10 | 50 | 120 | 1.0 | 0.10 | 50 | 120 | |
| Small cooker | 3000 | 1 | 3000 | 1.0 | 0.0 | 0.0 | 0.0 | 0.0 | 1.0 | 0.04 | 3000 | 2880 | |
| Heater | 4000 | 1 | 4000 | 1.0 | 0.0 | 0.0 | 0.0 | 0.0 | 1.0 | 0.04 | 4000 | 3840 | |
| Sockets | 3500 | 1 | 3500 | 1.0 | 0.0 | 0.0 | 0.0 | 0.0 | 0.3 | 0.1 | 1050 | 2520 | |
| Dehumidifier | 22.5 | 1 | 22.5 | 1.0 | 1.0 | 1.0 | 22.5 | 540 | 1.0 | 1.0 | 22.5 | 540 | |
| Split unitSummer | 1240 | 1 | 1240 | 1.0 | 0.0 | 0.0 | 0.0 | 0.0 | 1.0 | 0.95 | 1240 | 28,272 | |
| Split unitWinter | 1200 | 1 | 1200 | 1.0 | 0.0 | 0.0 | 0.0 | 0.0 | 1.0 | 0.60 | 1200 | 17,280 | |
| Normal Mode with PVs and Batteries | Maintenance Mode with Diesel-Electric Units in Operation | ||||||||||||
|---|---|---|---|---|---|---|---|---|---|---|---|---|---|
| Room/A | Electric Consumption | Cinstall-i | Νi… | nstall-i | ζi | σi | mi | PA-i | Εi | σi | mi | PA-i | Εi |
| (m2) | (–) | (W) | (–) | (W) | (–) | (–) | (–) | (W) | (Wh) | (–) | (–) | (W) | (Wh) |
| Surrounding | Aviation obstruction light buoy | 10 | 10 | 10 | 1.0 | 1.0 | 1.0 | 10 | 240 | 1.0 | 1.0 | 10 | 240 |
| Lighting | 13 | 10 | 130 | 1.0 | 0.0 | 0.0 | 0.0 | 0.0 | 1.0 | 0.5 | 130 | 1560 | |
| Sockets | 3500 | 1 | 3500 | 1.0 | 0.0 | 0.0 | 0.0 | 0.0 | 0.3 | 0.005 | 1050 | 126 | |
| Season | Autumn/spring | Total | 4844 | 11,932 | Total | 17,290 | 34,490 | ||||||
| Summer maximum | 8564 | 47,644 | 22,250 | 98,474 | |||||||||
| Winter maximum | 8444 | 40,156 | 22,090 | 79,994 | |||||||||
| Mm | Eday | Hm-panel | H′m-panel-day | Tmonth | σTemp | σTotLossPV | Ρα_mon | Npanel | Cnom | |
|---|---|---|---|---|---|---|---|---|---|---|
| Month | (–) | (kWh/d) | (kWh/(m2∙month)) | (kWh/(m2∙d)) | (°C) | (–) | (–) | (W) | (–) | (A∙h) |
| January | 31 | 16.079 | 67.88 | 2.190 | 10.03 | 0.9429 | 0.8068 | 18,177 | 119 | 3724 |
| February | 28 | 15.911 | 75.89 | 2.710 | 10.24 | 0.9421 | 0.8062 | 15,326 | 100 | 3685 |
| March | 31 | 14.438 | 123.28 | 3.977 | 11.61 | 0.9369 | 0.8017 | 9044 | 59 | 3344 |
| April | 30 | 12.178 | 160.02 | 5.334 | 15.54 | 0.9219 | 0.7889 | 5873 | 39 | 2821 |
| May | 31 | 11.968 | 196.43 | 6.336 | 19.66 | 0.9063 | 0.7755 | 4864 | 32 | 2772 |
| June | 30 | 12.470 | 214.36 | 7.145 | 24.90 | 0.8864 | 0.7585 | 4669 | 31 | 2888 |
| July | 31 | 14.224 | 218.81 | 7.058 | 27.83 | 0.8753 | 0.7490 | 5374 | 35 | 3294 |
| August | 31 | 14.165 | 198.69 | 6.409 | 27.80 | 0.8754 | 0.7491 | 5893 | 39 | 3281 |
| September | 30 | 12.174 | 159.83 | 5.328 | 24.13 | 0.8893 | 0.7610 | 6094 | 40 | 2820 |
| October | 31 | 11.965 | 110.3 | 3.558 | 19.07 | 0.9085 | 0.7774 | 8639 | 57 | 2771 |
| November | 30 | 12.512 | 68.45 | 2.282 | 14.49 | 0.9259 | 0.7923 | 14,046 | 92 | 2898 |
| December | 31 | 14.751 | 58.42 | 1.885 | 11.39 | 0.9377 | 0.8024 | 19,483 | 127 | 3417 |
| Annual | 365 | 4951 | 1652.37 | 4.527 | 18.06 | Maximum | 19,483 | 127 | 3724 | |
| Solar Time | |||||||
|---|---|---|---|---|---|---|---|
| 12:00–15:00 or 9:00–12:00 | 15:00–18:00 or 6:00–9:00 | 18:00–21:00 or 3:00–6:00 | 21:00–24:00 or 0:00–3:00 | ||||
| DoY | a1/Io-mday | a2/Io-mday | fHmday(t, t+dt) | ||||
| Month | (–) | (–) | (–) | ||||
| January | 15 | −0.264348 | 0.874992 | 0.411095 | 0.088905 | 0.000000 | 0.000000 |
| February | 46 | −0.125742 | 0.685957 | 0.386288 | 0.113712 | 0.000000 | 0.000000 |
| March | 74 | −0.020311 | 0.531517 | 0.359887 | 0.140113 | 0.000000 | 0.000000 |
| April | 105 | 0.053163 | 0.413104 | 0.333863 | 0.162749 | 0.003388 | 0.000000 |
| May | 135 | 0.091095 | 0.344943 | 0.315457 | 0.172577 | 0.011966 | 0.000000 |
| June | 166 | 0.105764 | 0.316209 | 0.306660 | 0.175682 | 0.017657 | 0.000000 |
| July | 196 | 0.100172 | 0.327374 | 0.310163 | 0.174561 | 0.015276 | 0.000000 |
| August | 227 | 0.072280 | 0.379636 | 0.325212 | 0.167962 | 0.006826 | 0.000000 |
| September | 258 | 0.014339 | 0.477263 | 0.348738 | 0.151049 | 0.000213 | 0.000000 |
| October | 288 | −0.081787 | 0.623096 | 0.376360 | 0.123640 | 0.000000 | 0.000000 |
| November | 319 | −0.219714 | 0.815339 | 0.403969 | 0.096031 | 0.000000 | 0.000000 |
| December | 349 | −0.315457 | 0.942198 | 0.418476 | 0.081524 | 0.000000 | 0.000000 |
| Npanel | 25 | 50 | 75 | 80 | 85 | 90 | 95 | 100 | 105 | 110 | 115 | 120 | 125 | 130 | 140 | 150 | 175 | 200 |
|---|---|---|---|---|---|---|---|---|---|---|---|---|---|---|---|---|---|---|
| CostInv [€] | 2458 | 2458 | 2817 | 4916 | 4916 | 4916 | 4916 | 4916 | 5634 | 5634 | 5634 | 5634 | 5634 | 5634 | 7374 | 8451 | 8451 | 9832 |
| Cnom (Ah) | Type | Npar | Nser | CostRES (€) | Cnom (Ah) | Type | Npar | Nser | CostRES (€) |
|---|---|---|---|---|---|---|---|---|---|
| 290 | Res 2 SOPZV150 | 2 | 55 | 9350 | 2676 | Res8 SOPZV1360 | 2 | 55 | 43,670 |
| 436 | Res 3 SOPZV225 | 2 | 55 | 12,320 | 2931 | Res 7 SOPZV990 | 3 | 55 | 52,800 |
| 558 | Res 2 SOPZV180 | 2 | 55 | 13,970 | 3348 | Res8 SOPZV1135 | 3 | 55 | 58,575 |
| 838 | Res 3 SOPZV425 | 2 | 55 | 19,250 | 3513 | Res 7 SOPZV1190 | 3 | 55 | 61,050 |
| 1116 | Res 4 SOPZV565 | 2 | 55 | 22,550 | 4014 | Res8 SOPZV1360 | 3 | 55 | 65,505 |
| 1396 | Res 5 SOPZV710 | 2 | 55 | 26,950 | 4464 | Res8 SOPZV1135 | 4 | 55 | 78,100 |
| 1676 | Res 6 SOPZV850 | 2 | 55 | 30,030 | 4684 | Res 7 SOPZV1190 | 4 | 55 | 81,400 |
| 1954 | Res 7 SOPZV990 | 2 | 55 | 35,200 | 5352 | Res8 SOPZV1360 | 4 | 55 | 87,340 |
| 2232 | Res8 SOPZV1135 | 2 | 55 | 39,050 | 5855 | Res 7 SOPZV1190 | 5 | 55 | 101,750 |
| ND (–) | 18000 | 8100 | 5200 | 3750 | 2800 | 2200 | 1800 | 1500 |
|---|---|---|---|---|---|---|---|---|
| DoD (%) | 10 | 20 | 30 | 40 | 50 | 60 | 70 | 80 |
| Function | ||||||||
| J (–) | 4,500,224 | 48,500 | 49,540 | |||||
| r (–) | 0.94905 | 0.99960 | 0.99972 | |||||
| Npanel | Battery Type | Cnom (Ah) | Battery Lifetime (Years) | Initial and Last Day for the Worst Scenario | Remaining Capacity (Ah-% with Respect to Cnom) | Εadd (kWh) | Εadd-day (kWh) |
|---|---|---|---|---|---|---|---|
| 130 | VRLA | 3800 | 3.75 | 2167–3536 | 1396.97—36.76% | 66,701 | 48.72 |
| 100 | VRLA | 3800 | 3.30 | 986–2193 | 1622.00—42.68% | 39,549 | 32.77 |
| 130 | VRLA | 2400 | 3.69 | 1280–2626 | 882.54—36.77% | 61,717 | 45.78 |
| 100 | VRLA | 2400 | 1.71 | 1565–2193 | 1625.88—67.74% | 234,94 | 37.59 |
| 128 | RES SOPzV | 3800 | 4.63 | 2167–3857 | 1396.45—36.75% | 81,128 | 48.00 |
| 100 | RES SOPzV | 2400 | 2.26 | 1367–2193 | 1608.74—67.03% | 26,388 | 31.95 |
| 108 V Narada AGM VRLA Battery System | 110 V Sunlight Gel Res SOPzV Battery System | |||||
|---|---|---|---|---|---|---|
| ir (–) | Npanel (–) | Cnom (Ah) | TCannual (€) | Npanel (–) | Cnom (Ah) | TCannual (€) |
| 0.00% | 145 | 1600 | 22,089 | 140 | 1676 | 21,387 |
| 0.50% | 145 | 1600 | 22,619 | 140 | 1676 | 21,908 |
| 1.00% | 145 | 1600 | 23,157 | 140 | 1676 | 22,438 |
| 1.50% | 145 | 1600 | 23,705 | 140 | 1676 | 22,978 |
| 2.00% | 145 | 1600 | 24,263 | 115 | 2676 | 23,499 |
| 2.50% | 140 | 1600 | 24,821 | 115 | 2676 | 24,000 |
| 3.00% | 140 | 1600 | 25,378 | 115 | 2676 | 24,509 |
| 3.50% | 140 | 1600 | 25,943 | 115 | 2676 | 25,025 |
| 4.00% | 140 | 1600 | 26,517 | 115 | 2676 | 25,547 |
| 4.50% | 140 | 1600 | 27,099 | 115 | 2676 | 26,077 |
| 5.00% | 140 | 1600 | 27,689 | 115 | 2676 | 26,613 |
| 5.50% | 140 | 1600 | 28,287 | 115 | 2676 | 27,156 |
| 6.00% | 130 | 1600 | 28,890 | 110 | 2676 | 27,695 |
| 6.50% | 130 | 1600 | 29,463 | 110 | 2676 | 28,234 |
| 7.00% | 130 | 1600 | 30,042 | 110 | 2676 | 28,778 |
| 7.50% | 130 | 1600 | 30,629 | 110 | 2676 | 29,328 |
| 8.00% | 130 | 1600 | 31,222 | 110 | 2676 | 29,883 |
| 8.50% | 130 | 1600 | 31,821 | 110 | 2676 | 30,445 |
| 9.00% | 130 | 1600 | 32,426 | 110 | 2676 | 31,011 |
| 9.50% | 130 | 1600 | 33,038 | 110 | 2676 | 31,583 |
| 10% | 130 | 1600 | 33,655 | 110 | 2676 | 32,161 |
Publisher’s Note: MDPI stays neutral with regard to jurisdictional claims in published maps and institutional affiliations. |
© 2020 by the authors. Licensee MDPI, Basel, Switzerland. This article is an open access article distributed under the terms and conditions of the Creative Commons Attribution (CC BY) license (http://creativecommons.org/licenses/by/4.0/).
Share and Cite
Deligianni, P.M.; Tsekouras, G.J.; Tsirekis, C.D.; Kontargyri, V.T.; Kanellos, F.D.; Kontaxis, P.A. Techno-Economic Optimization Analysis of an Autonomous Photovoltaic Power System for a Shoreline Electrode Station of HVDC Link: Case Study of an Electrode Station on the Small Island of Stachtoroi for the Attica–Crete Interconnection. Energies 2020, 13, 5550. https://doi.org/10.3390/en13215550
Deligianni PM, Tsekouras GJ, Tsirekis CD, Kontargyri VT, Kanellos FD, Kontaxis PA. Techno-Economic Optimization Analysis of an Autonomous Photovoltaic Power System for a Shoreline Electrode Station of HVDC Link: Case Study of an Electrode Station on the Small Island of Stachtoroi for the Attica–Crete Interconnection. Energies. 2020; 13(21):5550. https://doi.org/10.3390/en13215550
Chicago/Turabian StyleDeligianni, Panagiota M., George J. Tsekouras, Costas D. Tsirekis, Vassiliki T. Kontargyri, Fotis D. Kanellos, and Panagiotis A. Kontaxis. 2020. "Techno-Economic Optimization Analysis of an Autonomous Photovoltaic Power System for a Shoreline Electrode Station of HVDC Link: Case Study of an Electrode Station on the Small Island of Stachtoroi for the Attica–Crete Interconnection" Energies 13, no. 21: 5550. https://doi.org/10.3390/en13215550