Faulty Synchronization of Salient Pole Synchronous Hydro Generator

Faculty of Electrical Engineering, Wroclaw University of Science and Technology, 50-370 Wroclaw, Poland
Energies 2020, 13(20), 5491; https://doi.org/10.3390/en13205491
Submission received: 10 July 2020
/
Revised: 24 September 2020
/
Accepted: 16 October 2020
/
Published: 20 October 2020
(This article belongs to the Special Issue Design and Application of Electrical Machines)
Abstract
:This article presents the simulation results of hydro generator faulty synchronization during connection to the grid for various voltage phase shift changes in a full range (−180°; 180°). A field-circuit model of salient pole synchronous hydro generator was used to perform the calculation results. It was verified using the measured no-load and three-phase short-circuit characteristics. This model allowed observing the physical phenomena existing in the investigated machine, especially in the rotor which was hardly accessible for measurement. The presented analysis shows the influence of faulty synchronization on the power system stability and the construction components which are the most vulnerable to damage. From a mechanical point of view, the most dangerous case was for the voltage phase shift equal to −120°, and this case was analyzed in detail. Great emphasis was placed on the following physical quantities: electromagnetic torque, stator current, stator voltage, rotor current, current in rotor bars, and active and reactive power. The physical quantities existing during faulty synchronization were compared with a three-phase sudden short-circuit state. From this comparison, we selected the values of physical quantities that should be taken into account during design of new hydro generators to withstand the greatest possible threats during long-term work.
1. Introduction
Synchronization of a generator with a power system must be carried out carefully. It is a dynamic process that requires the coordinated operation of many components such as mechanical, electrical, and human. The voltage and frequency of the disconnected generator must be closely matched to the voltage and frequency existing in the network bus. The instantaneous value of the voltage induced in the armature winding must be close to the instantaneous value of the network bus voltage. The interconnection of large numbers of synchronous generators operating in parallel constitutes the power system. These generators are hydro generators (possessing a salient-pole rotor) and turbogenerators (with a cylindrical rotor). These machines are connected by transmission lines supplying the network loads. A disconnected generator can be paralleled with the network by driving it at synchronous speed and adjusting its excitation current so that its terminal voltage is equal to the network bus voltage.
Failure of the synchronizing procedure results in out-of-phase synchronization, mainly caused by the following [1,2,3,4]:
- Failure in wiring during commissioningWiring errors lead to particular out-of-phase angles. Polarity errors at a voltage transformer can cause synchronizing at 180°.
- Delay during breaker closureThis can occur if the breaker physically closes slower than anticipated and the systems go beyond the designed safe conditions before the breaker closes. The closing process cannot be stopped when the breaker coil is energized, and out-of-phase synchronization can happen. During this abnormal condition, transformers, generators, and associated equipment can be damaged.
- Flash-over in breaker’s contactsA breaker is designed to sustain the voltage that occurs before synchronizing and in the case of inequality of the generator and the network voltage phase. Several factors can reduce the electrical strength of the breaker’s insulation. This results in arcing between contacts before galvanic closing. The following phenomena favor the flash-over in a breaker: pollution, low pressure, humidity, and decomposition of insulation.
- Wrong setting of synchronous systemThis emerges from a human mistake.
- Problem in manual synchronizationIn addition to automatic synchronization, the vast majority of generators have the possibility of manual synchronization. An operator may not predict how fast the phase angle difference converges and energizes the breaker close coil in advance or with delay. Sometimes, the operator does not take into account the closing mechanism delay of the generator breaker and, therefore, the main contacts do not make a close to 0° angle difference.
A hydro generator is a synchronous generator. Synchronous speed comes from interaction between two poles coming from a stator and rotor that create a rotating magnetic field. Interaction between these two poles occurs when direct current flows in the excitation (rotor) winding and three-phase voltages are applied to the armature (stator) winding. Rotor speed is determined by the number poles and the grid frequency. The rotor is coupled to a water turbine by a mechanical shaft which supplies the mechanical energy for transformation to electrical energy.
During synchronizing, before closing the breaker between the power system and generator terminals, the frequency of the voltage induced in the armature is adjusted by the angular velocity of the rotating magnetic field (the rotor speed), whereas, after synchronizing, when the breaker is closed, the frequency of the power system regulates the speed of the rotating magnetic field. The position and speed of the rotor must be closely matched at the instant the hydro generator is connected to the power system in order to eliminate the transient torque required to bring the rotor into synchronism. If the frequency of voltage induced on the stator (coming from angular velocity) is significantly different from the frequency in the power system, then large transient torque will appear. Stability can be achieved by accelerating or decelerating the rotating masses (rotor and turbine) until the rotor speed matches the power system frequency. If the voltage phase angle difference is significant (rotor position is off), then transient torque required to set the rotor position into phase with the power system can be even higher.
Transient torques appearing during faulty synchronization can cause instantaneous and cumulative fatigue damage to the hydro generator and water turbine over their lifetime. Instantaneous stator current associated with this abnormal state can exceed the three-phase short circuit. Huge current windings cause the appearance of large forces in end-winding.
The consequences of faulty synchronization are the following:
- Damage to the hydro generator rotor and water turbine because of mechanical stresses caused by rapid acceleration or deceleration of rotating masses.
- Damage to step-up transformer and stator windings caused by high currents.
- Disturbances such as power and voltage deviations.
- Catastrophic failure and reduced lifetime of generator construction elements.
IEEE Standards C50.12 and C50.13 [5,6] define the following limits which guarantee that a generator is for service without inspection or repair after synchronizing:
- Phase shift angle difference between generator-side voltage and the power system: ±10°.
- Generator-side voltage relative to the power system: 1.0–1.05 UN.
- Frequency difference: ±0.067 Hz.
The synchronizing can be done by an operator using manual means or automated control systems. The synchronizing system is dedicated to the following:
- Closing the breaker as close to 0° angle difference as possible.The operator must predict how fast the phase angle difference is coming and energize the breaker close coil in advance to account for the closing mechanism delay.
- Controlling the governor to match speed.
- Controlling the excitation current value to match voltage at the stator terminals.
Faulty synchronization is an abnormal operating condition and it can be detected by protection devices which give a signal to a device able to disconnect the generator from the power system. Protection devices such as reverse power and loss-of-field protections have time delays to avoid unwanted trips during transient operation of the generator. In this case, these times are around several seconds, whereas the generator breakers have a certain operating time which does not exceed 100 ms [7].
The faulty synchronization of synchronous generators has been the subject of many research works in the latest years. In particular, these studies referred to turbo generators. All of them were based on models with d–q axes considering two damper winding on both axes [8,9]. The parameters taken into account to create these models were extracted using Canay’s approach. Simplified d–q models do not reflect the saturation effect of magnetizing steel. The effect of saturation on the rotor shaft torques during faulty synchronization is significant. Reflecting the saturation effect shows that the torsional moment on the shaft is higher [10]. Neglecting this effect affects erroneous conclusions. Currently, the most accurate calculation method for electrical machines is the finite element method. This method reflects the real distribution of generator construction elements and allows observing the physical phenomena existing inside the generator [11]. Additionally, it can be helpful in the choice of the best material for conductive parts and to optimize the magnetic path for the flux. The above statement applies only to large cylindrical-rotor generators. The studies on faulty synchronization for hydro generators with power of 1–10 MVA were omitted.
The literature lacks information on the effect of the damping cage on faulty synchronization for hydro generators, whereas, in the case of turbogenerators, there is a significant influence of the location of rotor wedges on the damping of excitation current oscillation during out-of-phase synchronization [11]. So far, the distribution of the current induced in the rotor bars of hydro generators has not been discussed, and it has not been compared to the most dangerous state, which is sudden short-circuit fault. Most often, articles [8,10,12] focused on showing the maximum values of stator current and electromagnetic torque, i.e., in such physical quantities that can lead to irreversible damage. The influence of induced current in the rotor bars on the possibility of damaging damping bars was ignored.
In this work, the impact of voltage phase shift (synchronizing angles) on hydro generator stability was investigated. A two-dimensional field-circuit model was used in calculation. This model was previously verified by comparisons of the calculated and measured no-load and three-phase short-circuit characteristics during running tests. The simulations were carried out for different synchronizing angles to evaluate the instantaneous and peak shaft torques. In addition, the following quantities were also determined: stator current, stator voltage, field current, induced current on rotor bars, and active and reactive power. In this article, the waveforms of physical quantities of the most dangerous case are shown from the mechanical point of view. Finally, a typical comparative study between faulty synchronization and three-phase short circuit faults of a hydro generator is presented.
2. Description of Field-Circuit Model and Main Rated Data of Hydro Generator
A field-circuit model of a hydro generator was utilized in computation. The circuit equations (based on Kirchhoff’s laws) for rotor and stator windings were coupled with field equations used to describe the temporal–spatial distribution of the electromagnetic field [13].
The vector magnetic potential A was used to describe the temporal–spatial distribution of the time-varying electromagnetic field. In this way, the partial differential equations were solved. The mathematical description is expressed in Equation (1) for the low-frequency range. The time-varying electric and magnetic fields are calculated using Equation (2) for the fully coupled dynamic physics solution implemented in Ansys Maxwell software. The current density vector is expressed by yjr vector magnetic potential A and scalar electrical potential V.
where J is the current density vector, μ is the magnetic permeability, σ is the electric conductivity, and ν is the velocity vector of the environment moving relative to the electromagnetic field.
In a two-dimensional model, the vector magnetic potential has only one component. When knowing the mean values of the potential in the cross-section of the winding conductors (si) and the effective machine length le, the mean value of the flux associated with k-th winding can be expressed by Equation (3). The electromagnetic state of the k-th winding is described by the Kirchoff equation (Equation (4)).
where uk, ik, Ψk are the instantaneous values of voltage, current, and flux coupled to the k-th winding.
The two-dimensional model of the hydro generator was created in Ansys Maxwell software dedicated to finite element analysis of electromagnetic field distribution. The investigated hydro generator (type: GCV-1610M, produced in December 2019) was a vertical salient pole machine with static excitation (the slip rings were on the shaft). The ratings of the generator are presented in Table 1. The stator core and rotor poles were laminated. The rotor winding was wound around the poles. The rotor possessed a damper cage located in the pole shoes. These bars were short-circuited by ring-shaped segments in all poles. The bars and ring-shaped segments were made of copper.
The field-circuit model of the hydro generator reflected nonlinear magnetizing curves of rotor and stator cores, possibilities of inducing current in damper bars, rotor movement, and external electrical circuit with voltage sources. However, the skin effects in stator coils and eddy currents in the stator and rotor laminations were neglected. The two-dimensional model was reduced to half of the cross-section because of geometrical symmetry and electromagnetic periodicity. The investigated region, together with the finite element mesh, is shown in Figure 1. The analyzed area contained 15,712 finite elements and 31,372 nodes. This model had two boundary conditions to solve the electromagnetic field equations. The first Dirichlet boundary condition was located at the outer stator diameter (edge Γ2), where the vector magnetic potential was equal to 0. The periodic condition of the magnetic potential was set at edge Γ1. The numbering of rotor poles and damper bars refer to calculation results, where the waveform of current in each bar is shown. The main dimensions of the geometry are presented in Table 2.
Figure 2 presents the scheme of the electrical circuit which contained stator and rotor windings, as well as the distribution of rotor damper bars. The armature winding circuit was extended by resistance (RS) and inductance (LSew), representing the end-winding part. Additionally, there were added resistances and inductances representing the transformer (RTR, LTR) and the power system (RPR, LPR). The stator winding was supplied with three-phase voltage sources shifted with respect to each other by 120° (U1, U2, U3). The field part of the excitation winding circuit was extended by resistance (RF) and inductance (LFew), representing the end-winding part. The excitation winding was supplied by direct current (DC) voltage source UF. The excitation voltage was modeled as a constant voltage source; therefore, no actuation of the automatic voltage regulator was taken into account. RBew and LBew contained fragments of segments of the short-circuiting rotor cage between bars in one pole, whereas RB2ew and LB2ew were part of the ring-shaped segments between rotor poles. Switching the circuit breaker (S1, S2, and S3) on or off enabled the hydro generator to be analyzed in various scenarios of faulty synchronization.
During the simulation, it was assumed that the generator was connected to the power system, which possessed a short-circuit power equal to 15,000 MVA (i.e., a strong system) [14,15]. Computed inductances and resistances used in the simulations are shown in Table 3. The names of parameters refer to the circuit model shown in Figure 2.
The created field-circuit model of the hydro generator allowed calculating waveforms of electromagnetic quantities in steady and transient states. This model was verified experimentally on the basis of no-load and three-phase short-circuit curves calculated and compared with the measurements obtained during running tests. These curves are presented in Figure 3. The computed reactances and time constants of the generator are presented in Table 4.
On the basis of the no-load and three-phase short-circuit characteristics, it could be concluded that the measurements did not differ significantly from the calculation results obtained from the field-circuit model of the hydro generator. Therefore, this model was utilized to calculate the faulty synchronization for different values of voltage phase shift.
3. Analysis of Faulty Synchronization
The calculations of faulty synchronization were prepared for different voltage phase shift angles in the range of [−180°; 180°] with a 5° step. This was a case when the generator and power system voltages were in sequence, amplitude, and frequency, but not in phase. When the voltage phase shift was in the range of [−180°; 0°], the power system voltage lagged with respect to generator voltage (Figure 4a); however, in the range of [0°; 180°], the power system voltage led with respect to generator voltage (Figure 4b). The study was extended to include the effect of increased generator voltage up to 1.05 UN according to IEEE Standard C50.12 [5].
The investigated hydro generator was modeled in a single-machine system, as shown in Figure 5. In the simulation, the generator was connected to the power system at instant t = 0.02 s. During the simulation, the following physical quantities were obtained: electromagnetic torque, stator current, stator voltage, field current, currents in rotor bars, and active and reactive power in the power system bus. The frequency during the simulations was 50 Hz. The rotor speed was equal to 600 rpm before synchronization.
The simulations were carried out for different voltage phase shift angles to determine the instantaneous and peak shaft torques. Figure 6a shows the maximum amplitude of electromagnetic torque. The maximum value was for −120° of voltage phase shift, when the power system lagged with respect to generator voltage. If we took into account the absolute sum of two maximum electromagnetic torques with opposite directions (Figure 6b), then the maximum value (peak-to-peak) was obtained for 180° of voltage phase shift. The significant differences between cases of U = 1.00UN and U = 1.05UN were visible when the voltage phase shift was higher than 60° and below −60°. The statement of computed extreme values is shown in Table 2.
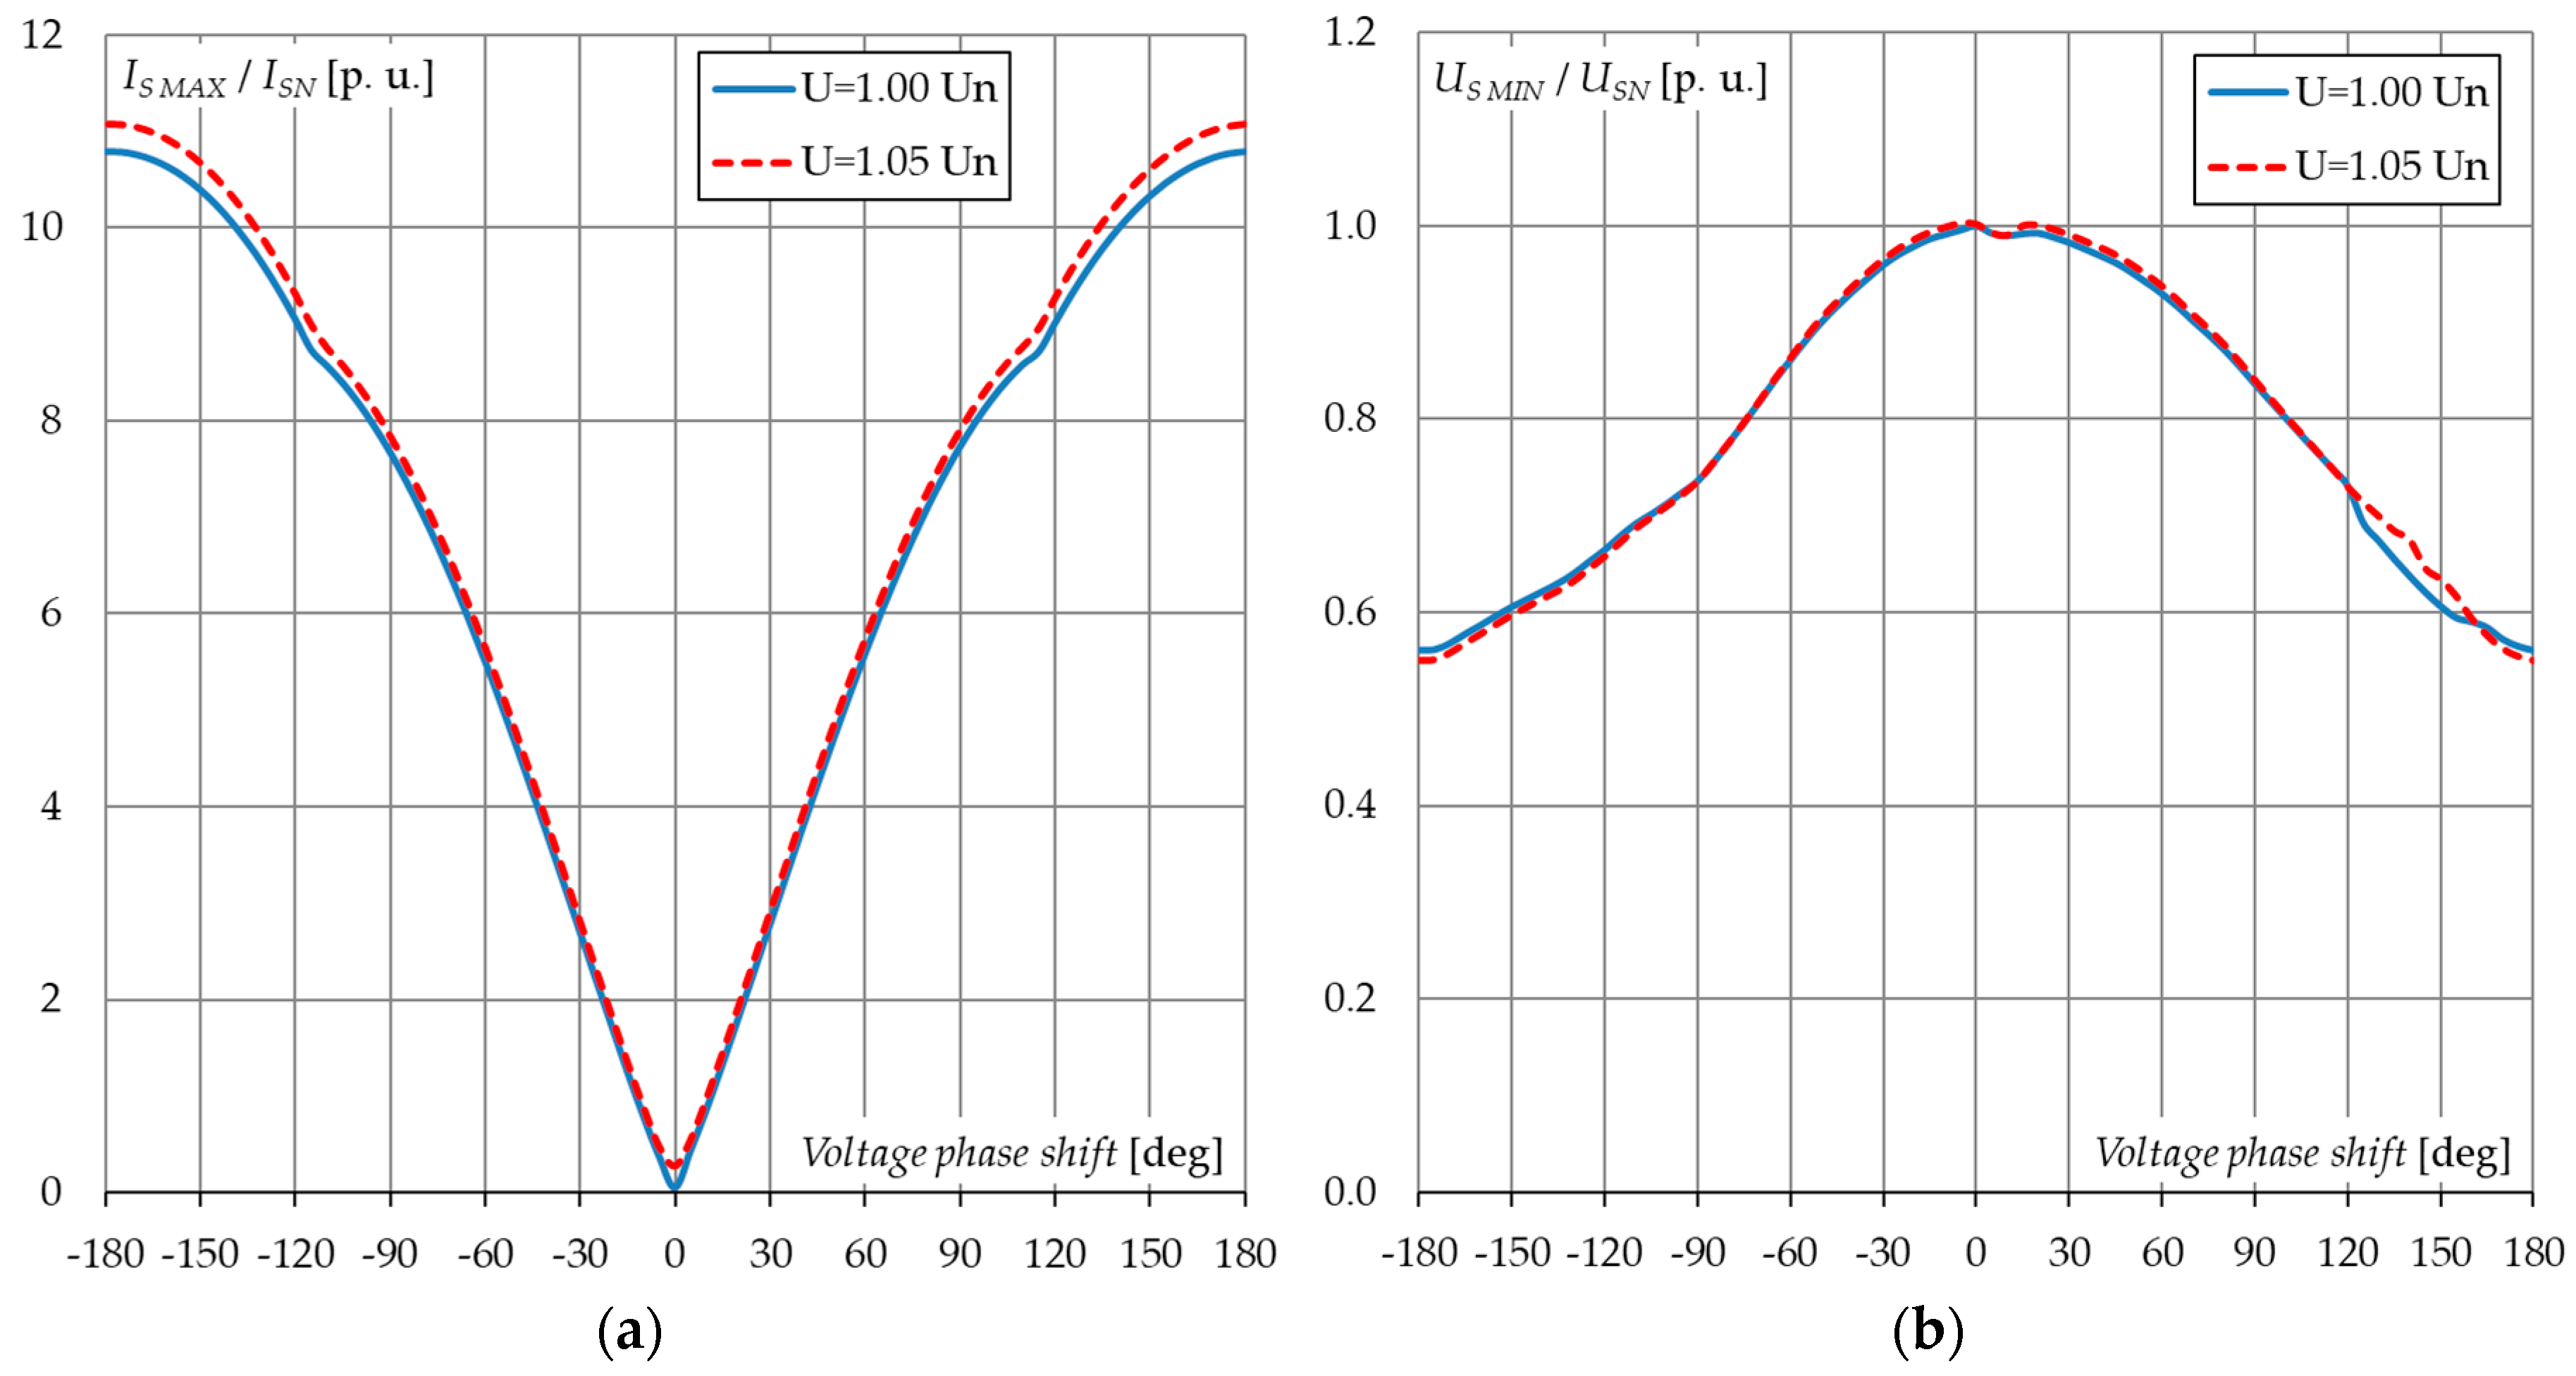
Figure 7a,b present the maximum amplitudes of stator current and the minimum amplitude of stator voltage, respectively. When the voltage phase shift was equal to 180°, the maximum value of stator current and the minimum value of stator voltage were observed. For the stator current, significant differences between cases of U = 1.00UN and U = 1.05UN were visible when the angle was higher than 90° and below −90°, whereas, for stator voltage, there were no visible differences in the whole range.
The maximum amplitude of induced current in the excitation winding is presented in Figure 8a. The maximum value was for the angle of 180°. Differences between cases of U = 1.00UN and U = 1.05UN were visible in the whole range. Figure 8b shows the maximum amplitude of the induced current in rotor bars in the active part and end-winding part (shorted ring segment between bars). The induced current in the end-winding part was almost twofold higher than the induced current in the active part. The maximum value of induced current in the active part was observed for 130°, whereas that in the end-winding part was observed for −130°. According to basic knowledge of hydro generator design, the selected diameter of rotor bars was equal to 16 mm (cross-section = 201 mm2), whereas the cross-section of the segments of the short-circuiting rotor cage between rotor bars was equal to 500 mm2. It follows from this that the end-winding part of rotor bars was able to withstand currents 2.5-fold higher than those existing in the rotor bar active part.
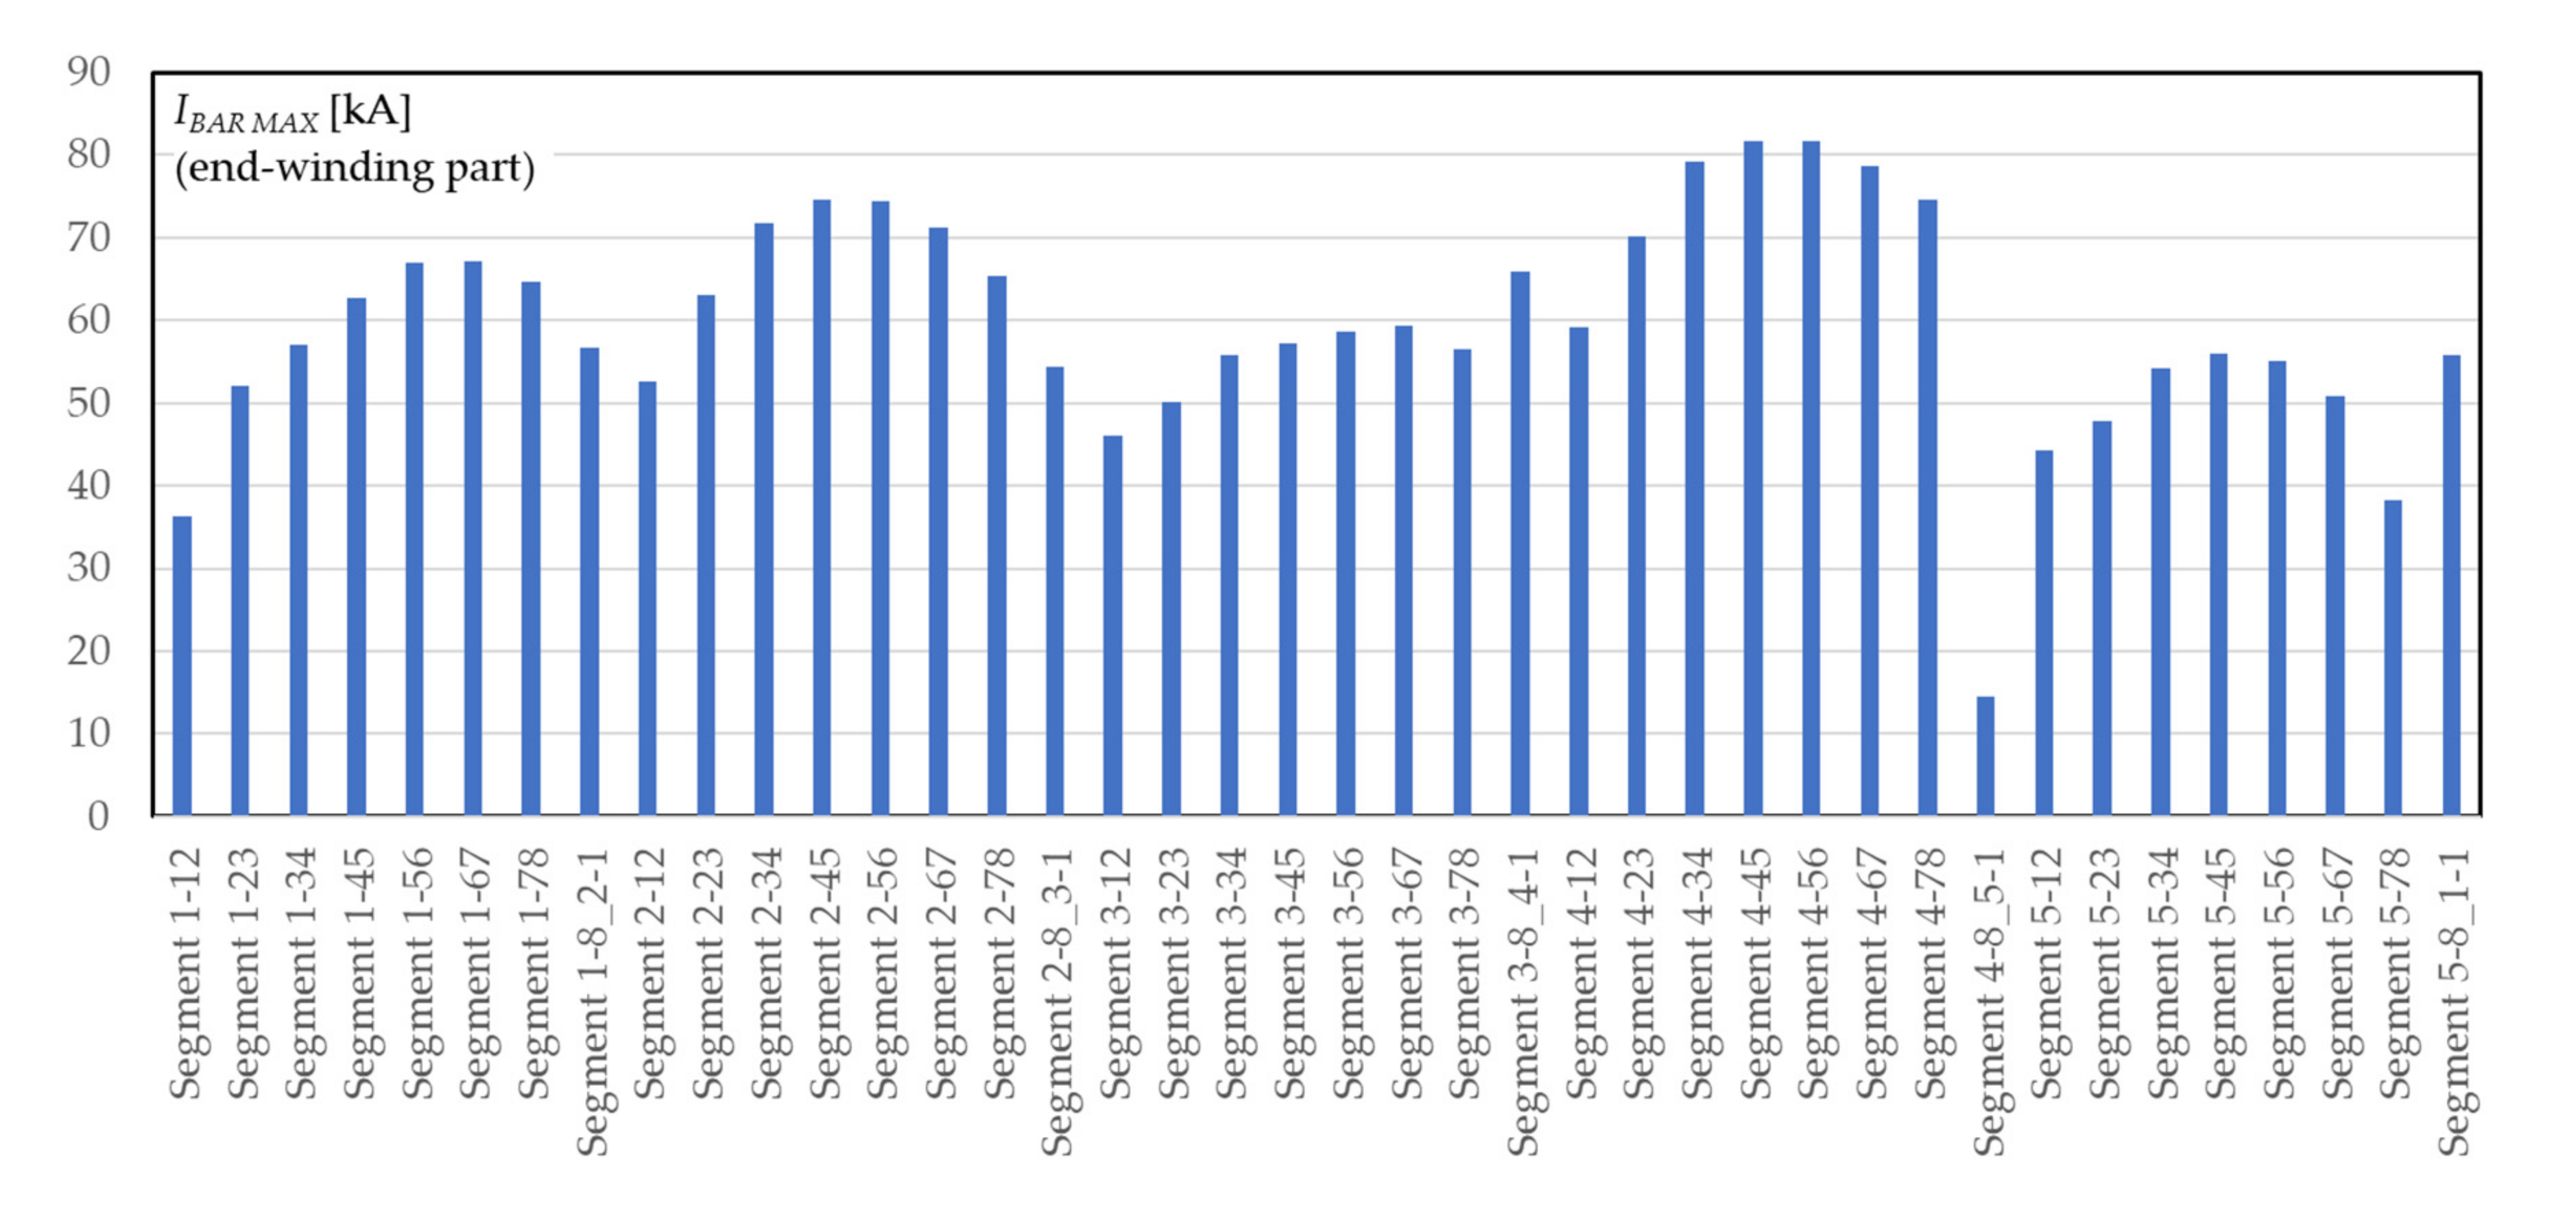
Figure 9 and Figure 10 show the distribution of maximum values of induced current in each rotor bar and each end-winding part, respectively. These distributions were determined for a voltage phase shift of 180°. The bar numeration was as follows: the first number denotes the number of rotor poles (according to numeration in Figure 1), followed by the number of bars in the pole (direction: counterclockwise), and the double number (after the number of poles) denotes the segment between two rotor bars (e.g., Segment 1-12). In the case of a segment between two poles, the numeration was as follows: the first number denotes the number of poles, followed by the number of bars, the second number of poles, and the number of bars in the second pole (e.g., Segment 1-8-2-1).
The maximum amplitudes existing in the active part of rotor bars were close to the extremes of the rotor poles, whereas the lower values were in bars located in the center of poles. The opposite situation existed in the case of induced current in the end-winding part of rotor bars.
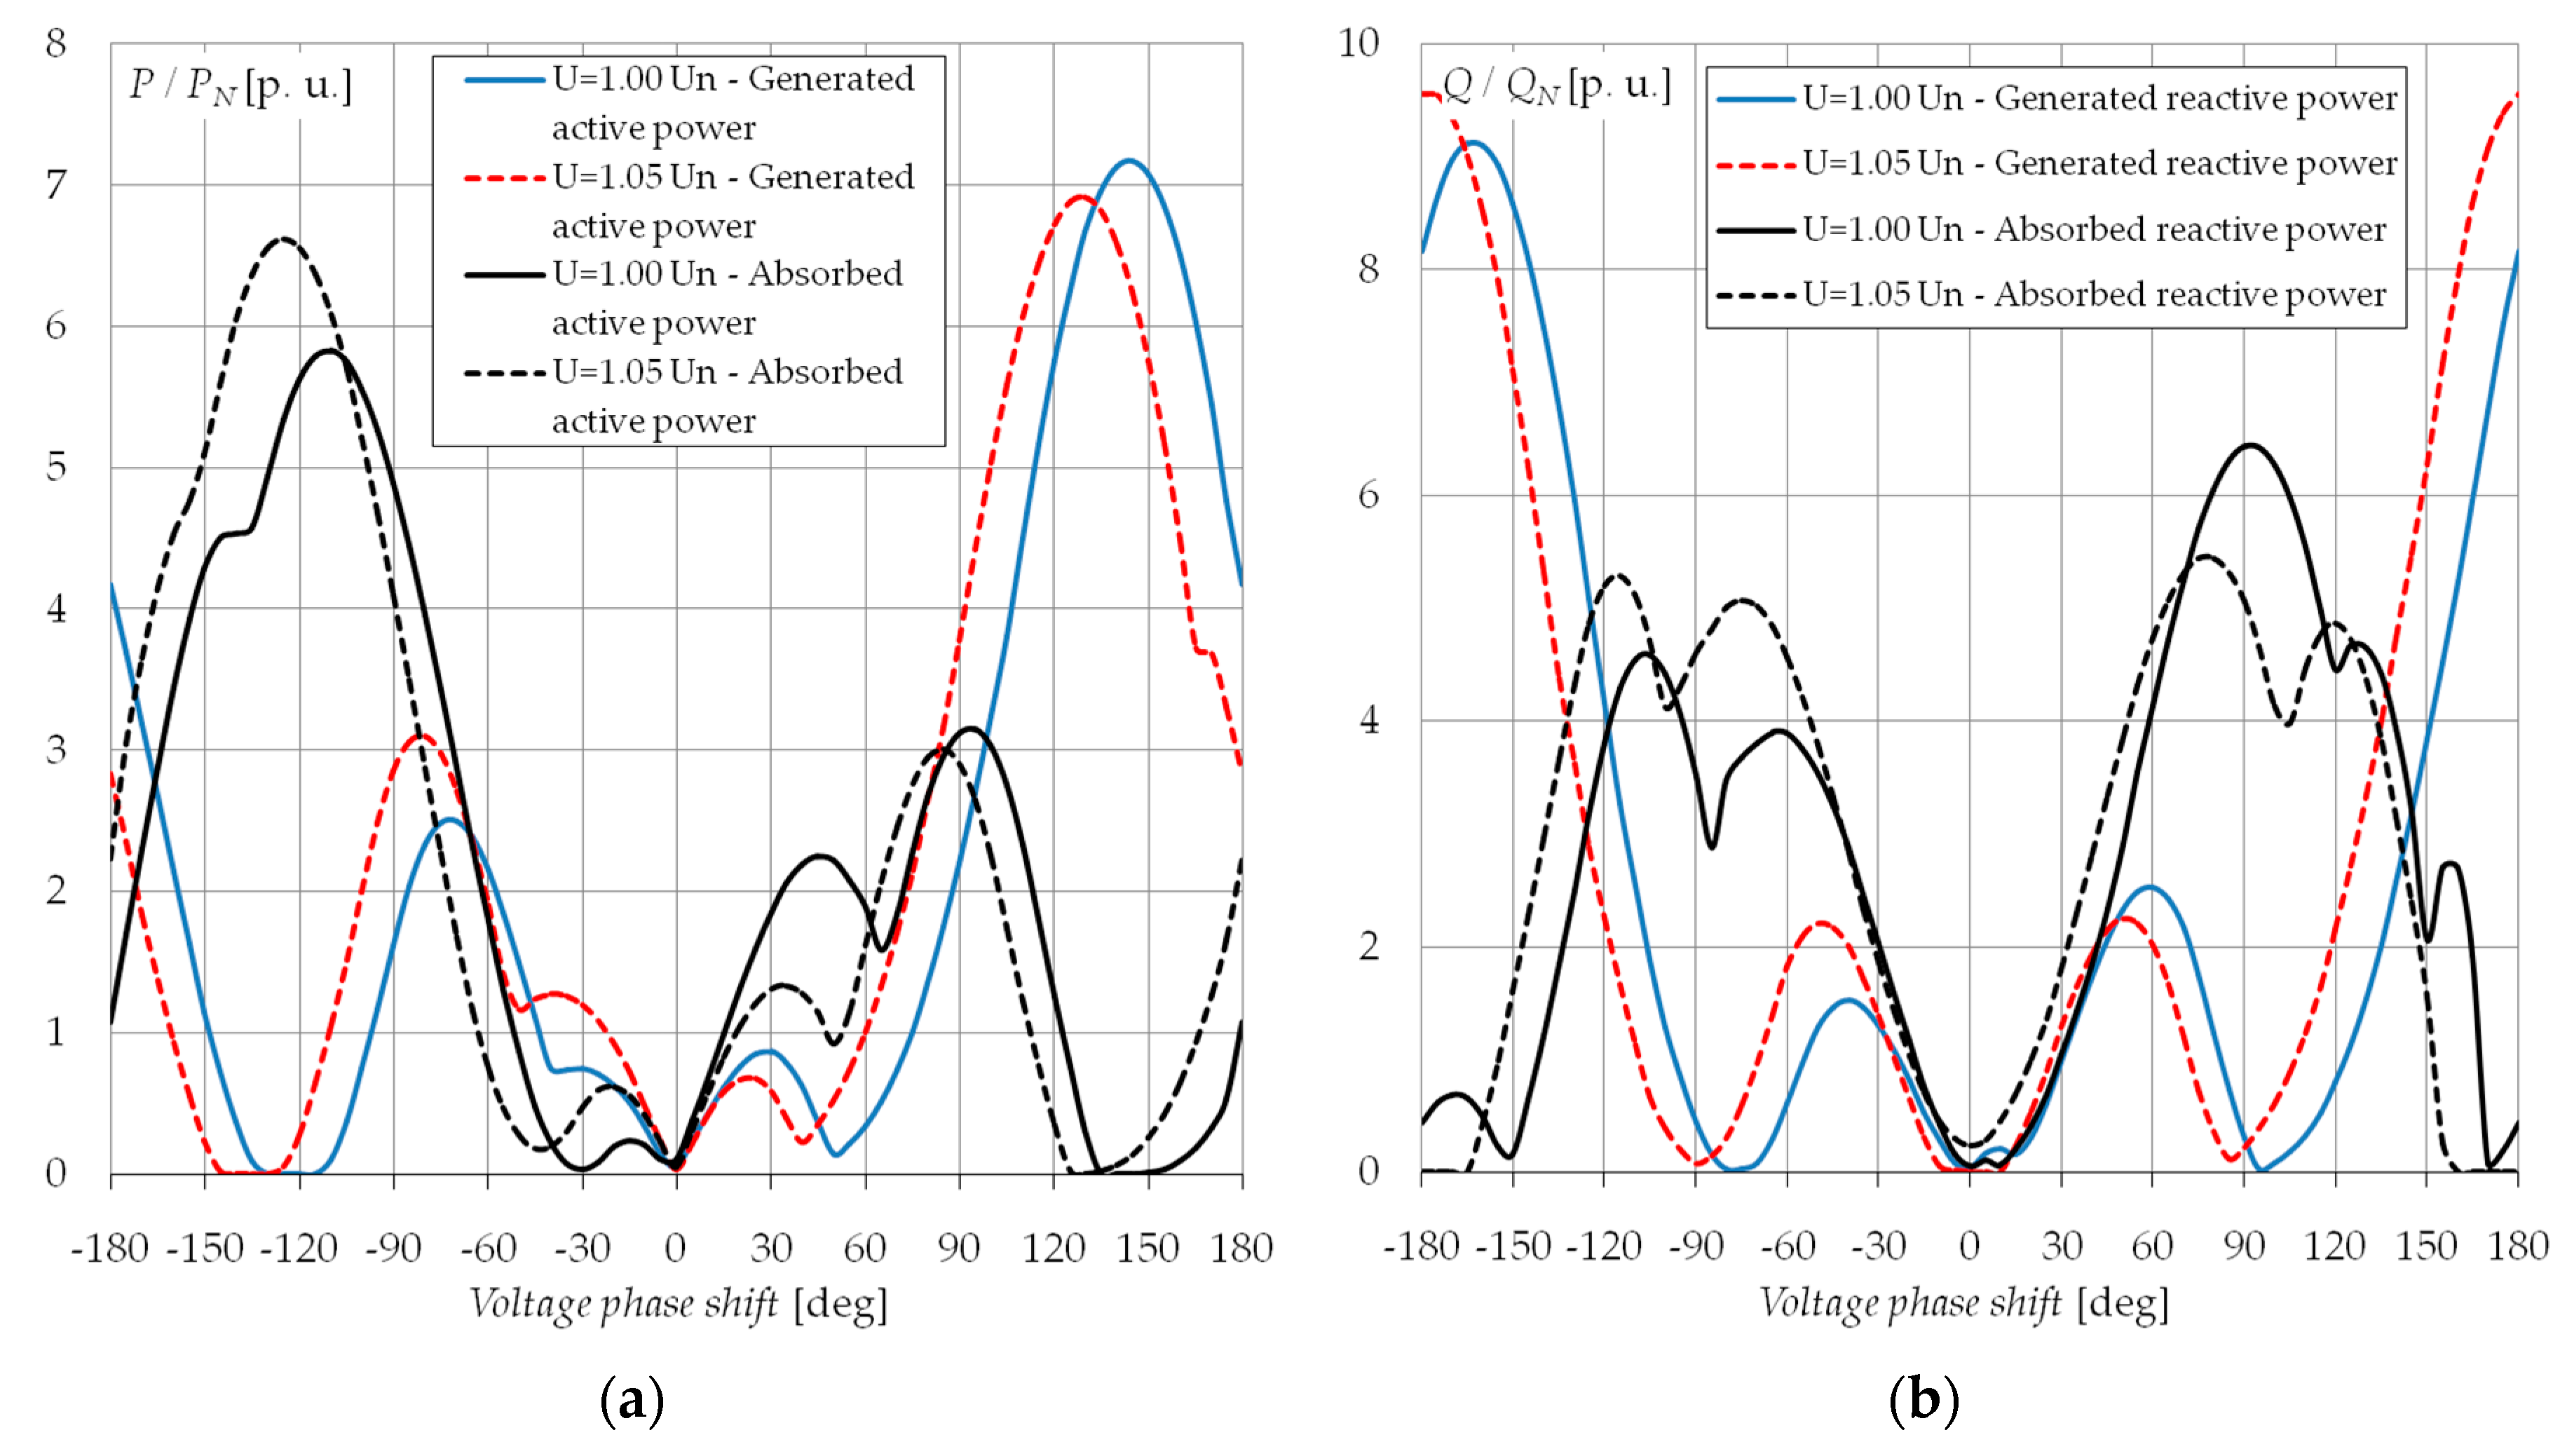
Figure 11a presents the generated and absorbed active power by the investigated hydro generator. Due to the changing nature of the electric circuit, along with the change in voltage phase shift, there were local extremes in the graph. The maximum value of absorbed active power was equal to 5.8–6.6 PN, where a higher value refers to a higher value of stator voltage at the terminals during synchronization. A higher active power was absorbed when the voltage phase shift during faulty synchronization was in the range of [−180°; 0°], i.e., when the power system voltage lagged with respect to generator voltage, whereas the maximum generated active power occurred in the opposite situation, i.e., when the power system voltage led with respect to generator voltage. The maximum value of generated active power did not exceed 7.2 PN.
Figure 11b presents the generated and absorbed reactive power by the investigated hydro generator. Due to the changing nature of the electric circuit, along with the change in voltage phase shift, there were local extremes in the graph, as in the case with active power. The maximum value of absorbed reactive power was equal to 5.4–6.4 QN. A higher reactive power was absorbed when the voltage phase shift during faulty synchronization was in the range of [−120°; 120°], whereas the maximum generated reactive power did not exceed 9.5 QN. The highest values of generated reactive power were in the ranges of [−120°; −120°] and [120°; 180°].
4. Analysis of Out-of-Phase Synchronization of −120°
Simulations were carried out for out-of-phase synchronization of −120°. A negative sign denotes that the power system voltage lagged with respect to generator voltage (as shown in Figure 4a). This was the worst case of examined faulty synchronization, because the highest electromagnetic torque appeared. The value of voltage at the terminal before synchronization was equal to 1.05 UN (maximum acceptable value according to [5,6]). The connection of the hydro generator to the power system took place at t = 0.02 s. The simulation step was equal to 0.2 ms.
Figure 12 presents the waveform of speed. At the beginning, there were fluctuations which disappeared after 3.5 s, and the investigated hydro generator returned to a steady state. The speed fluctuations depended on electromagnetic torque and the moment of inertia for all rotating components. In this study, it was assumed that the moment of inertia of the water turbine as twofold higher than the moment of inertia of the hydro generator.
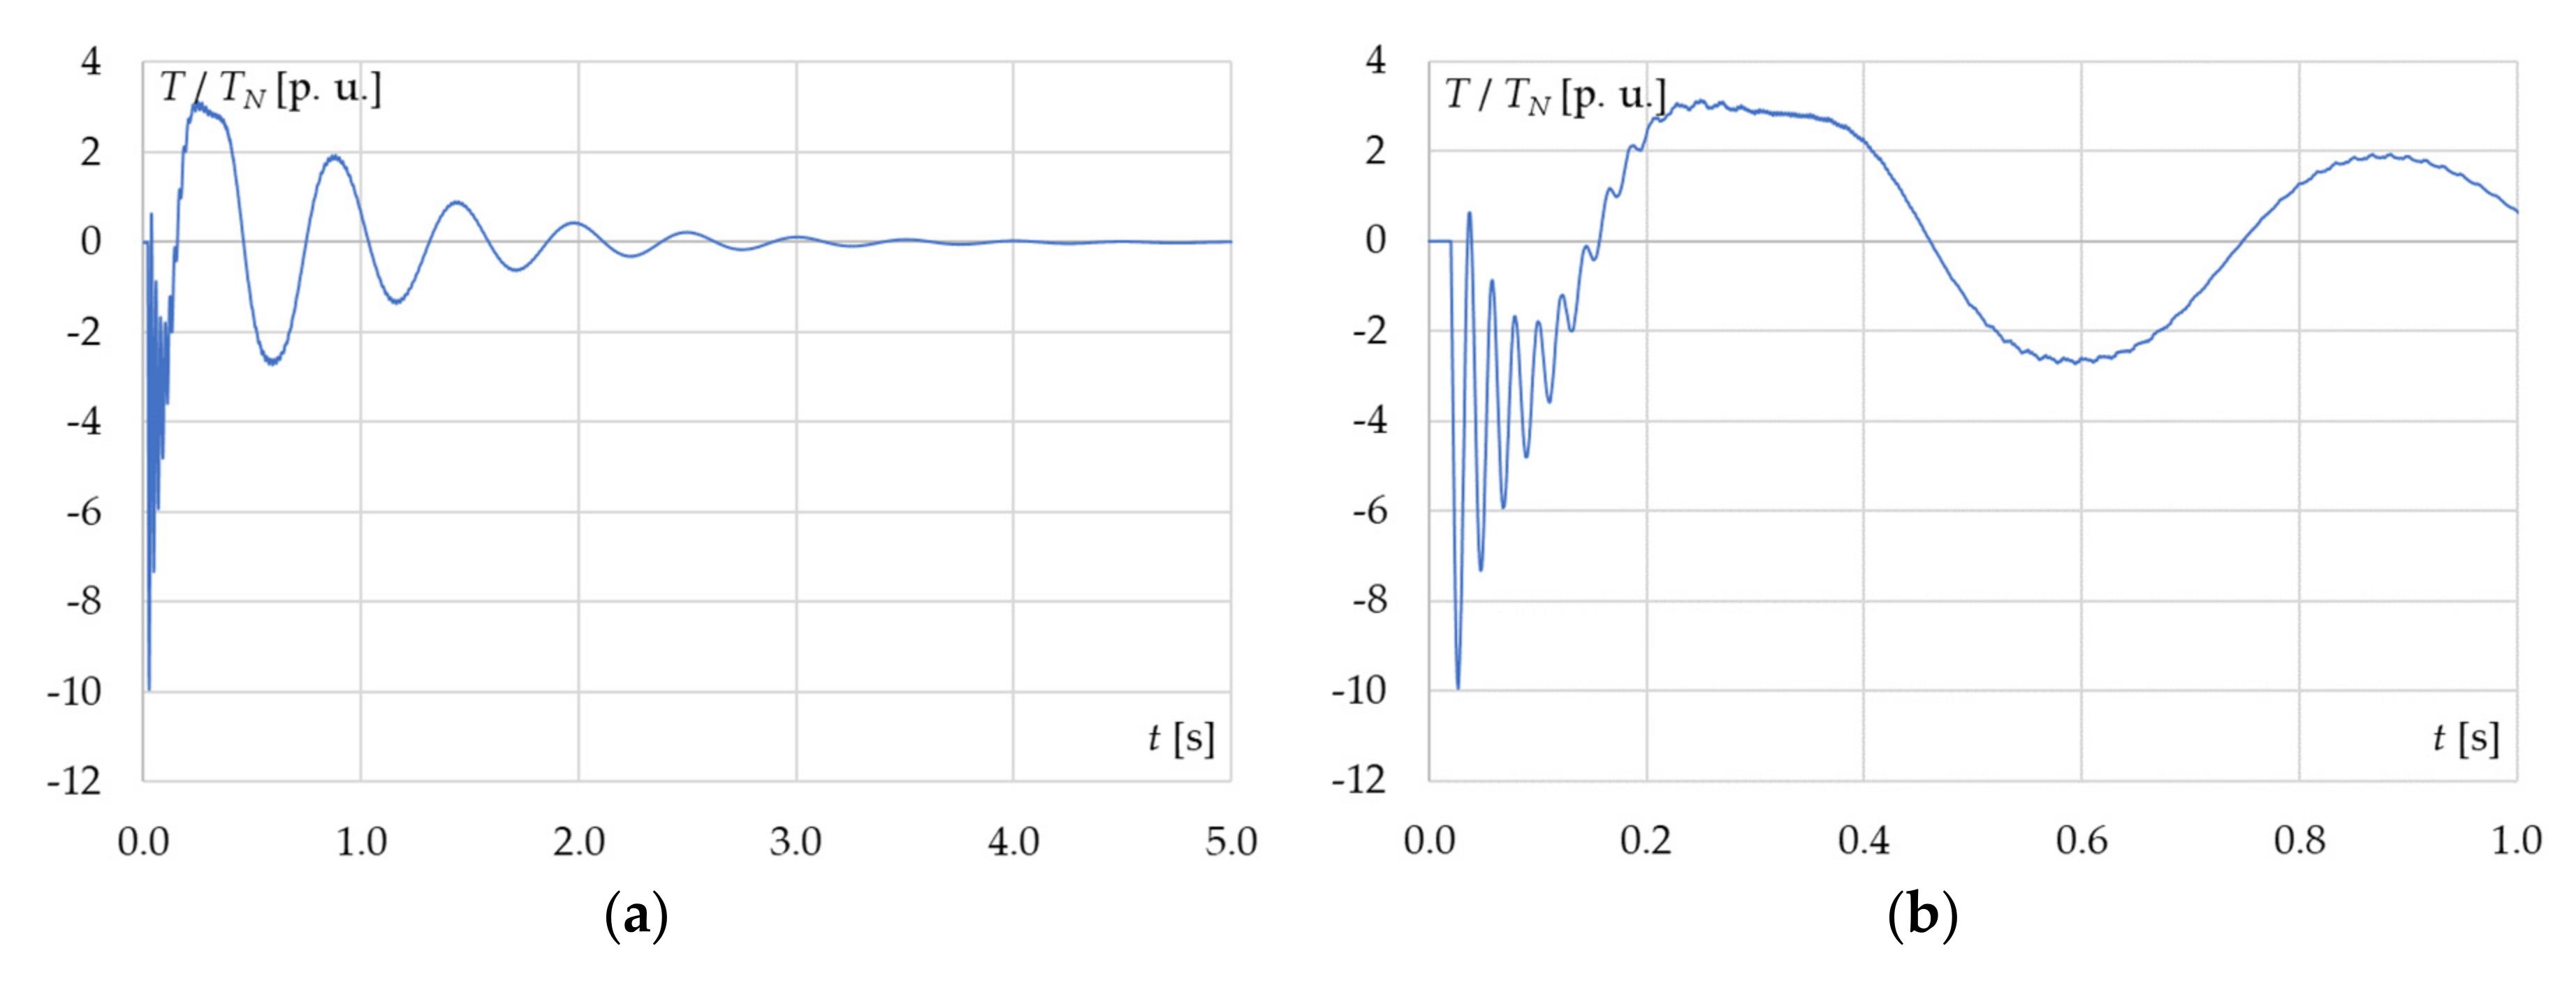
The calculated maximum value of electromagnetic torque was 9.94 TN (Figure 13), and the largest values were turned in one direction. Significantly lower values were observed in the opposite direction.
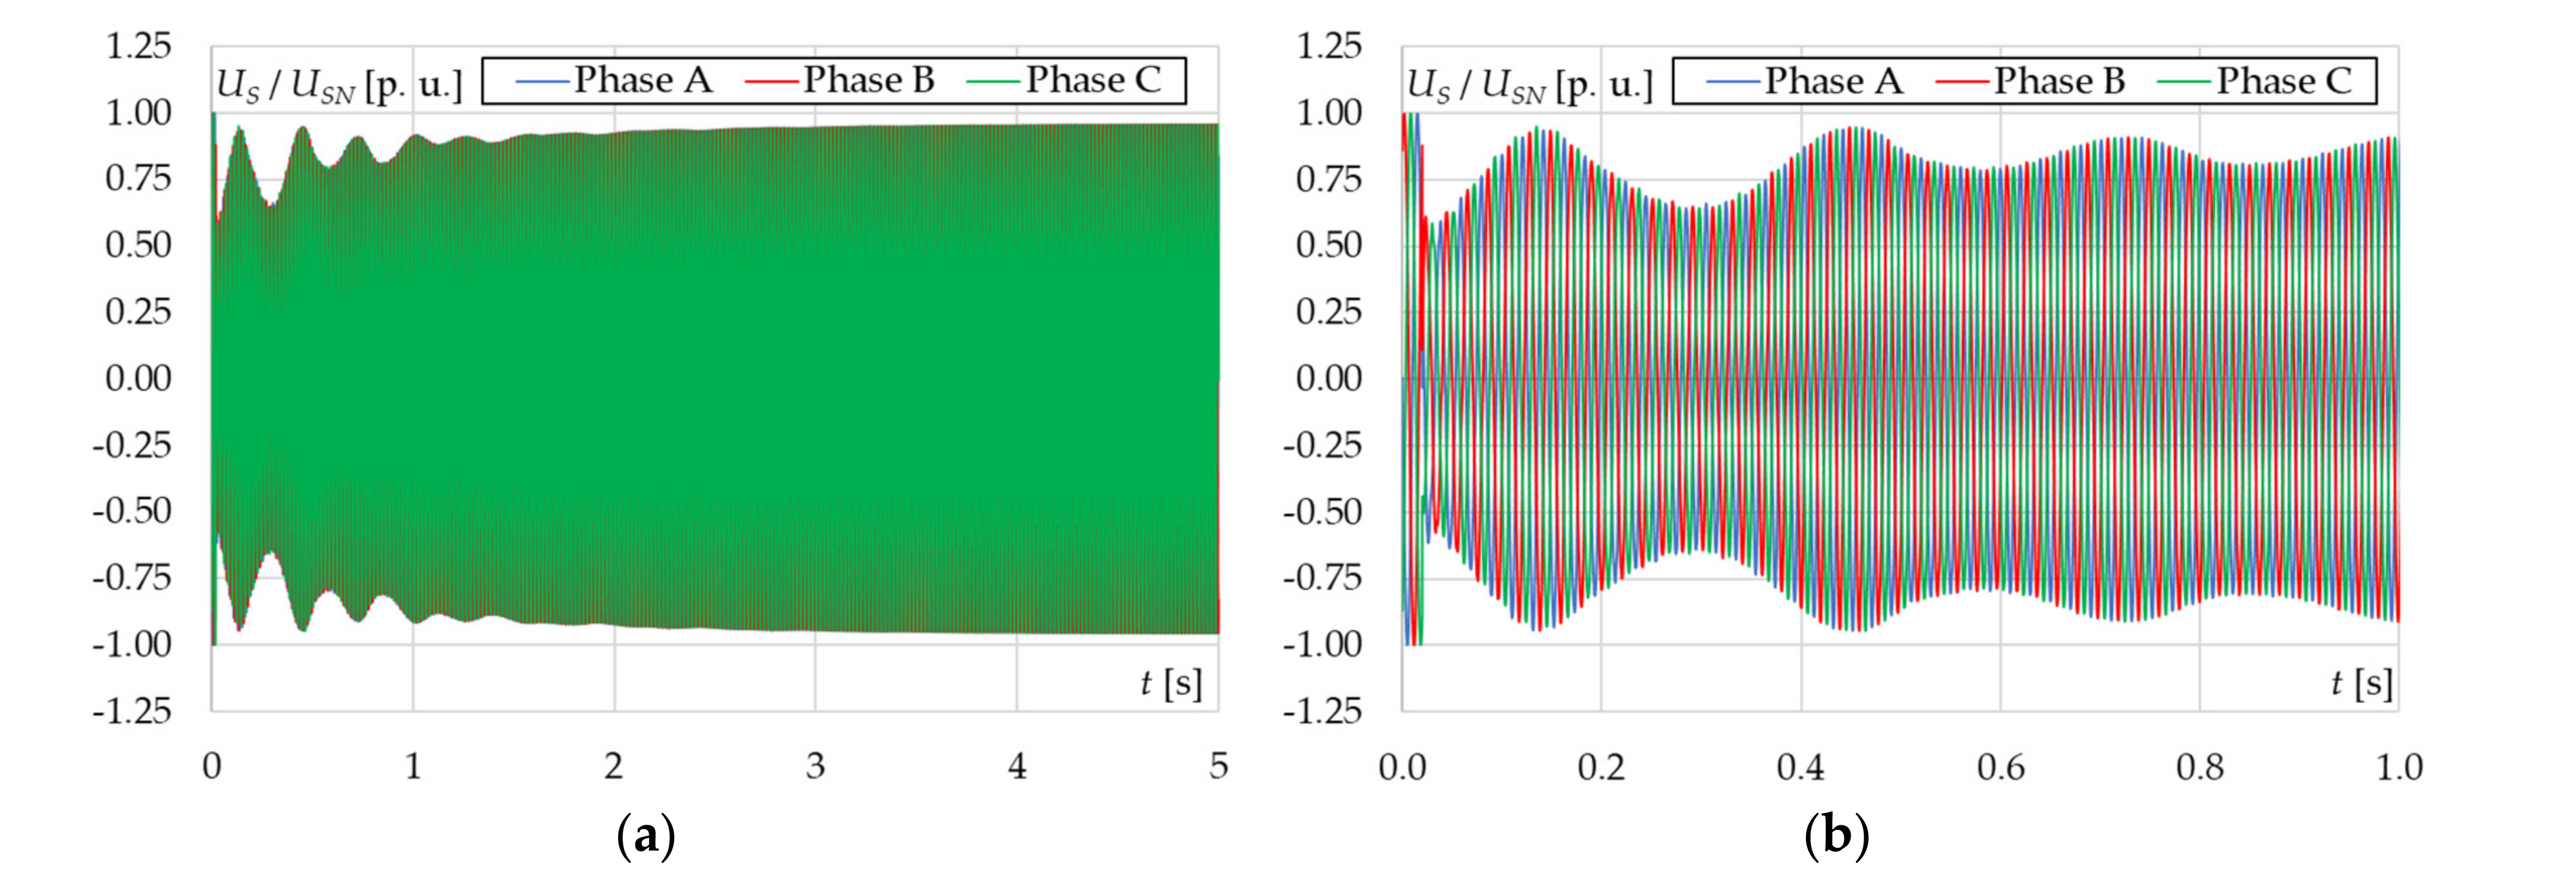
Figure 14 presents the stator current. The calculated maximum value was equal to 8.90 ISN. Stator currents reduced to zero after seven periods and then increased and oscillated with a period of ca. 0.3 s. A significant increase in stator current caused a drop in terminal voltage to a value of 0.66 USN (seen in Figure 15). After one period, the stator voltage was rebuilt and returned to its value before synchronization within 3.5 s.
During the simulations, these was a lack of excitation regulation in order to show how the field current changed during faulty synchronization. The maximum computed value of field current was equal to 2.81 IFN (Figure 16). When the maximum value was reached, the field current returned to the value before synchronization, which allowed inducing a value of 1.05 USN on the stator terminals during the no-load state.
Figure 17 shows the distribution of maximum values of currents induced in each rotor bar. The maximum amplitudes of currents were close to extreme of rotor poles. The maximum current appeared in the rotor bar No. 2-1. The waveform of this current is presented in Figure 18.
Figure 19 shows the distribution of maximum values of each current induced in the rotor’s circuited segments. The maximum values of currents were in segments located in the center of the pole (poles No. 1 and 2) and close to the extremes of rotor poles (poles No. 3, 4, and 5). The maximum current appeared in a segment between rotor bars No. 3-8 and No. 4-1 (Segment 3-8_4-1). The waveform of this current is presented in Figure 20.
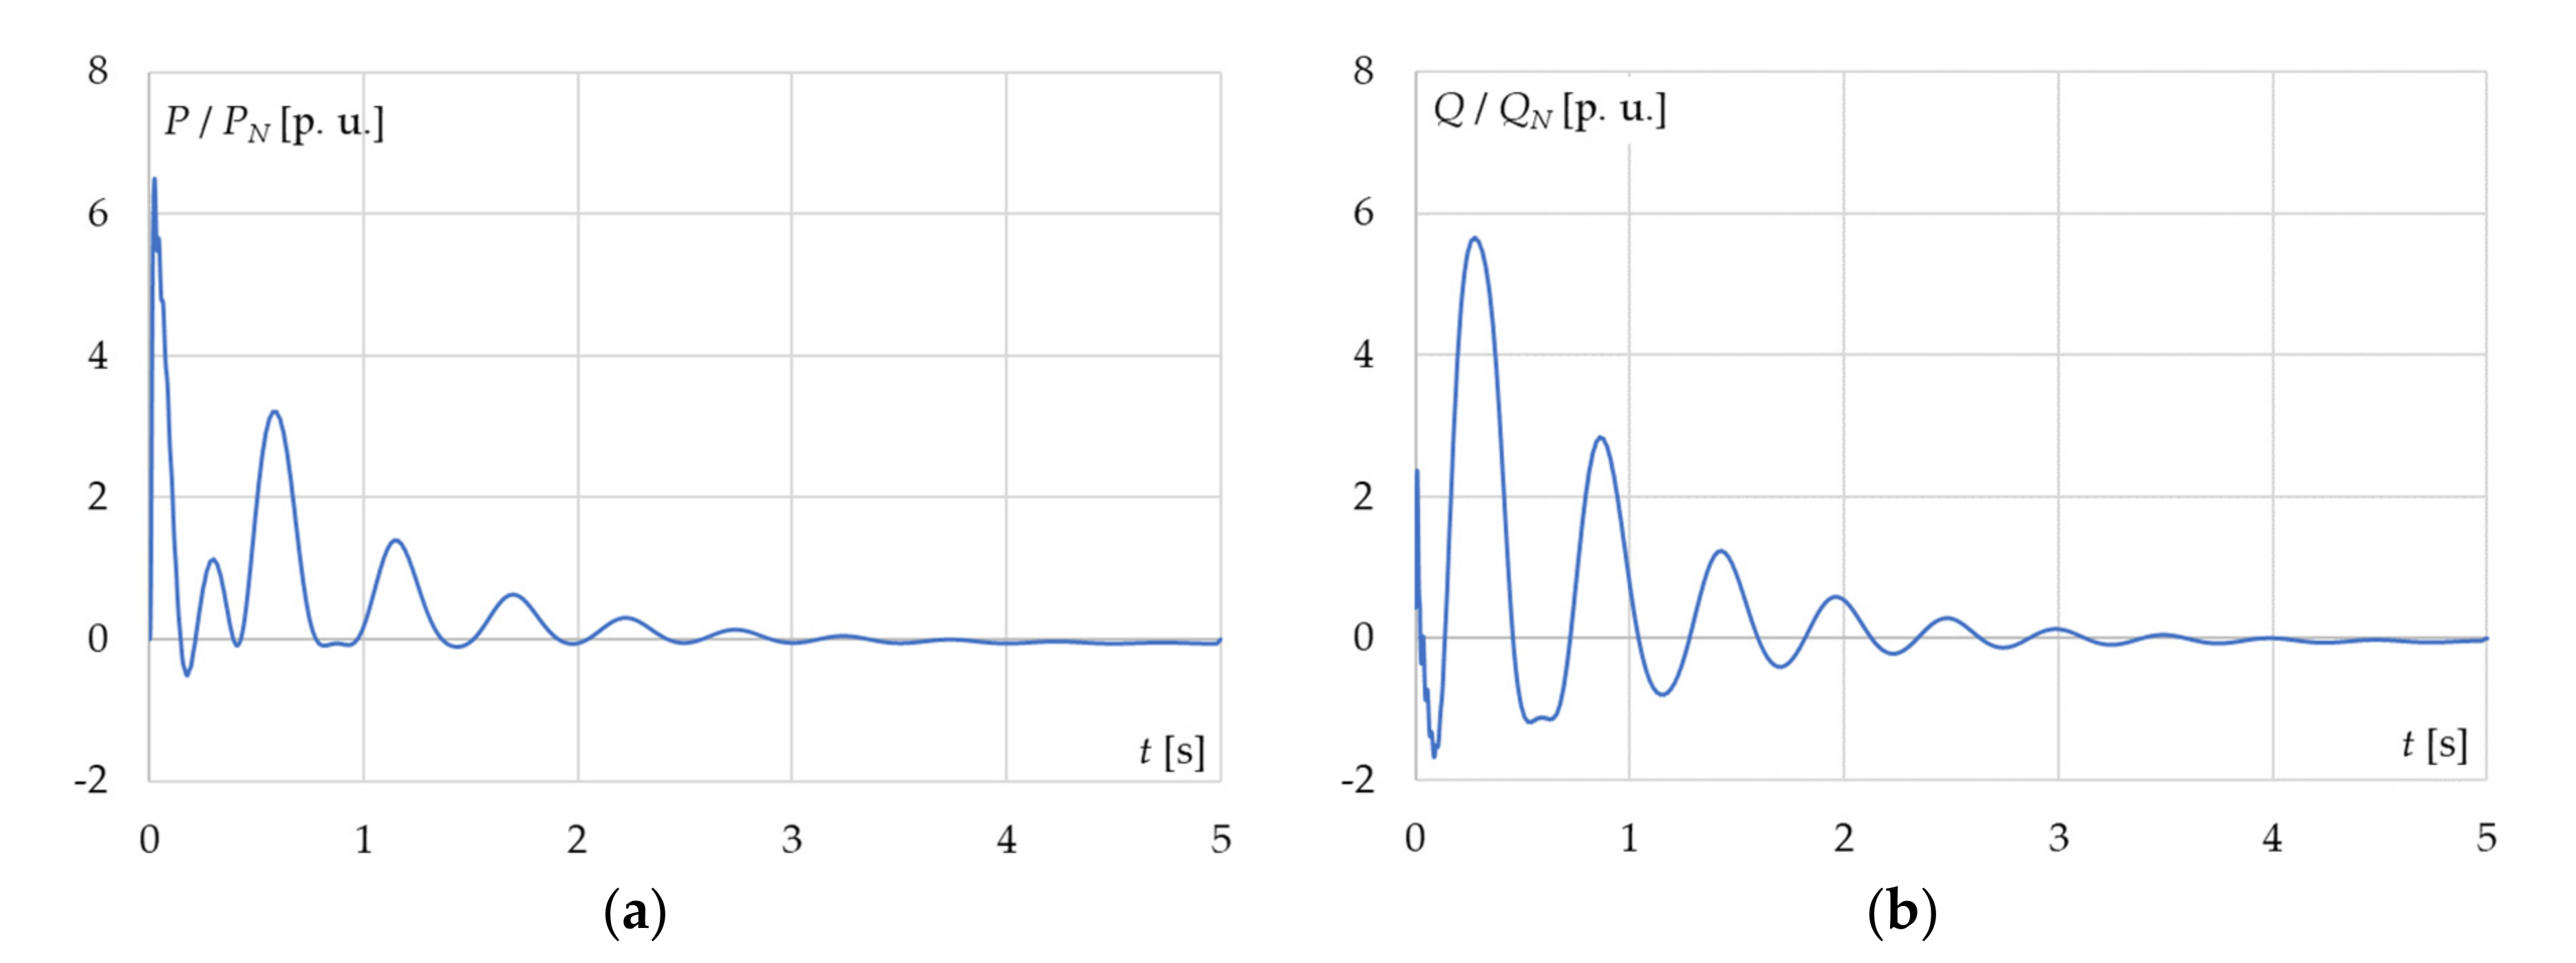
Waveforms of active and reactive power are presented in Figure 21a,b, respectively. An active power above zero denotes that power was absorbed from the power system. The same situation applied to reactive power, whereby a reactive power above zero denotes that power was absorbed from the power system, and a value below zero means that active or reactive power was generated to the grid. The computed active power was huge due to the fact that, at the first moment of analyzed faulty synchronization (voltage phase shift equal to −120°), the generator speed decreased and there was a need to absorb active power from the power system to keep the machine in synchronism. The huge stator currents forced a drop in stator voltage and there was a need to absorb reactive power in order to magnetize the rotor and stator cores.
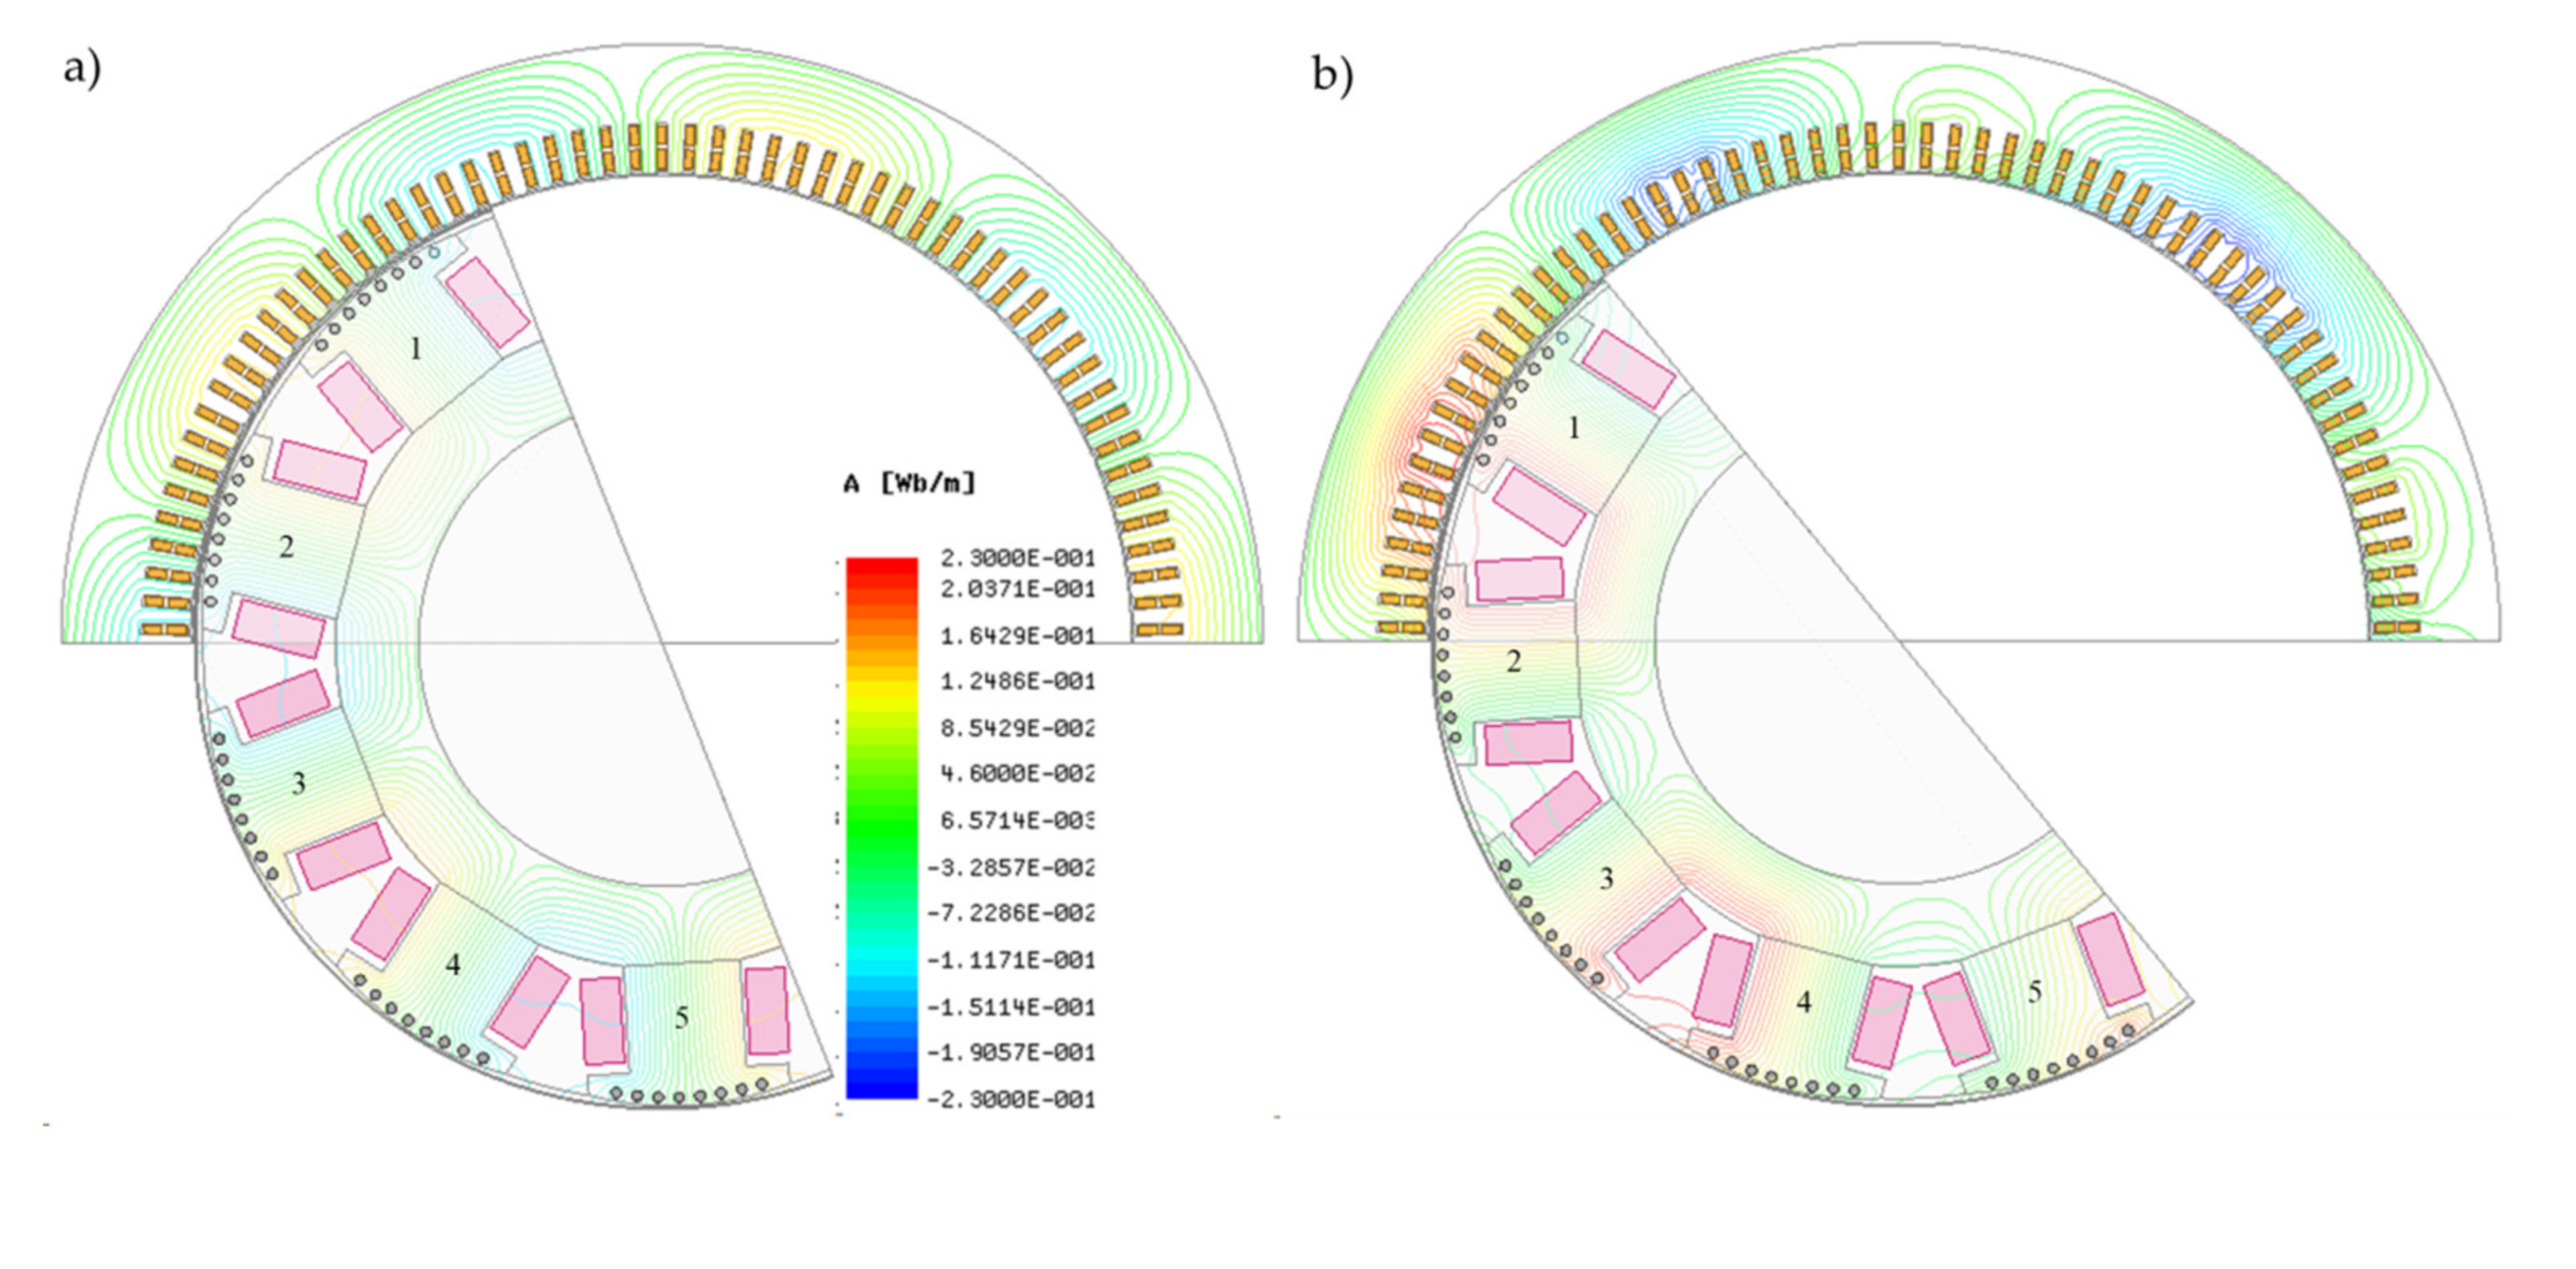
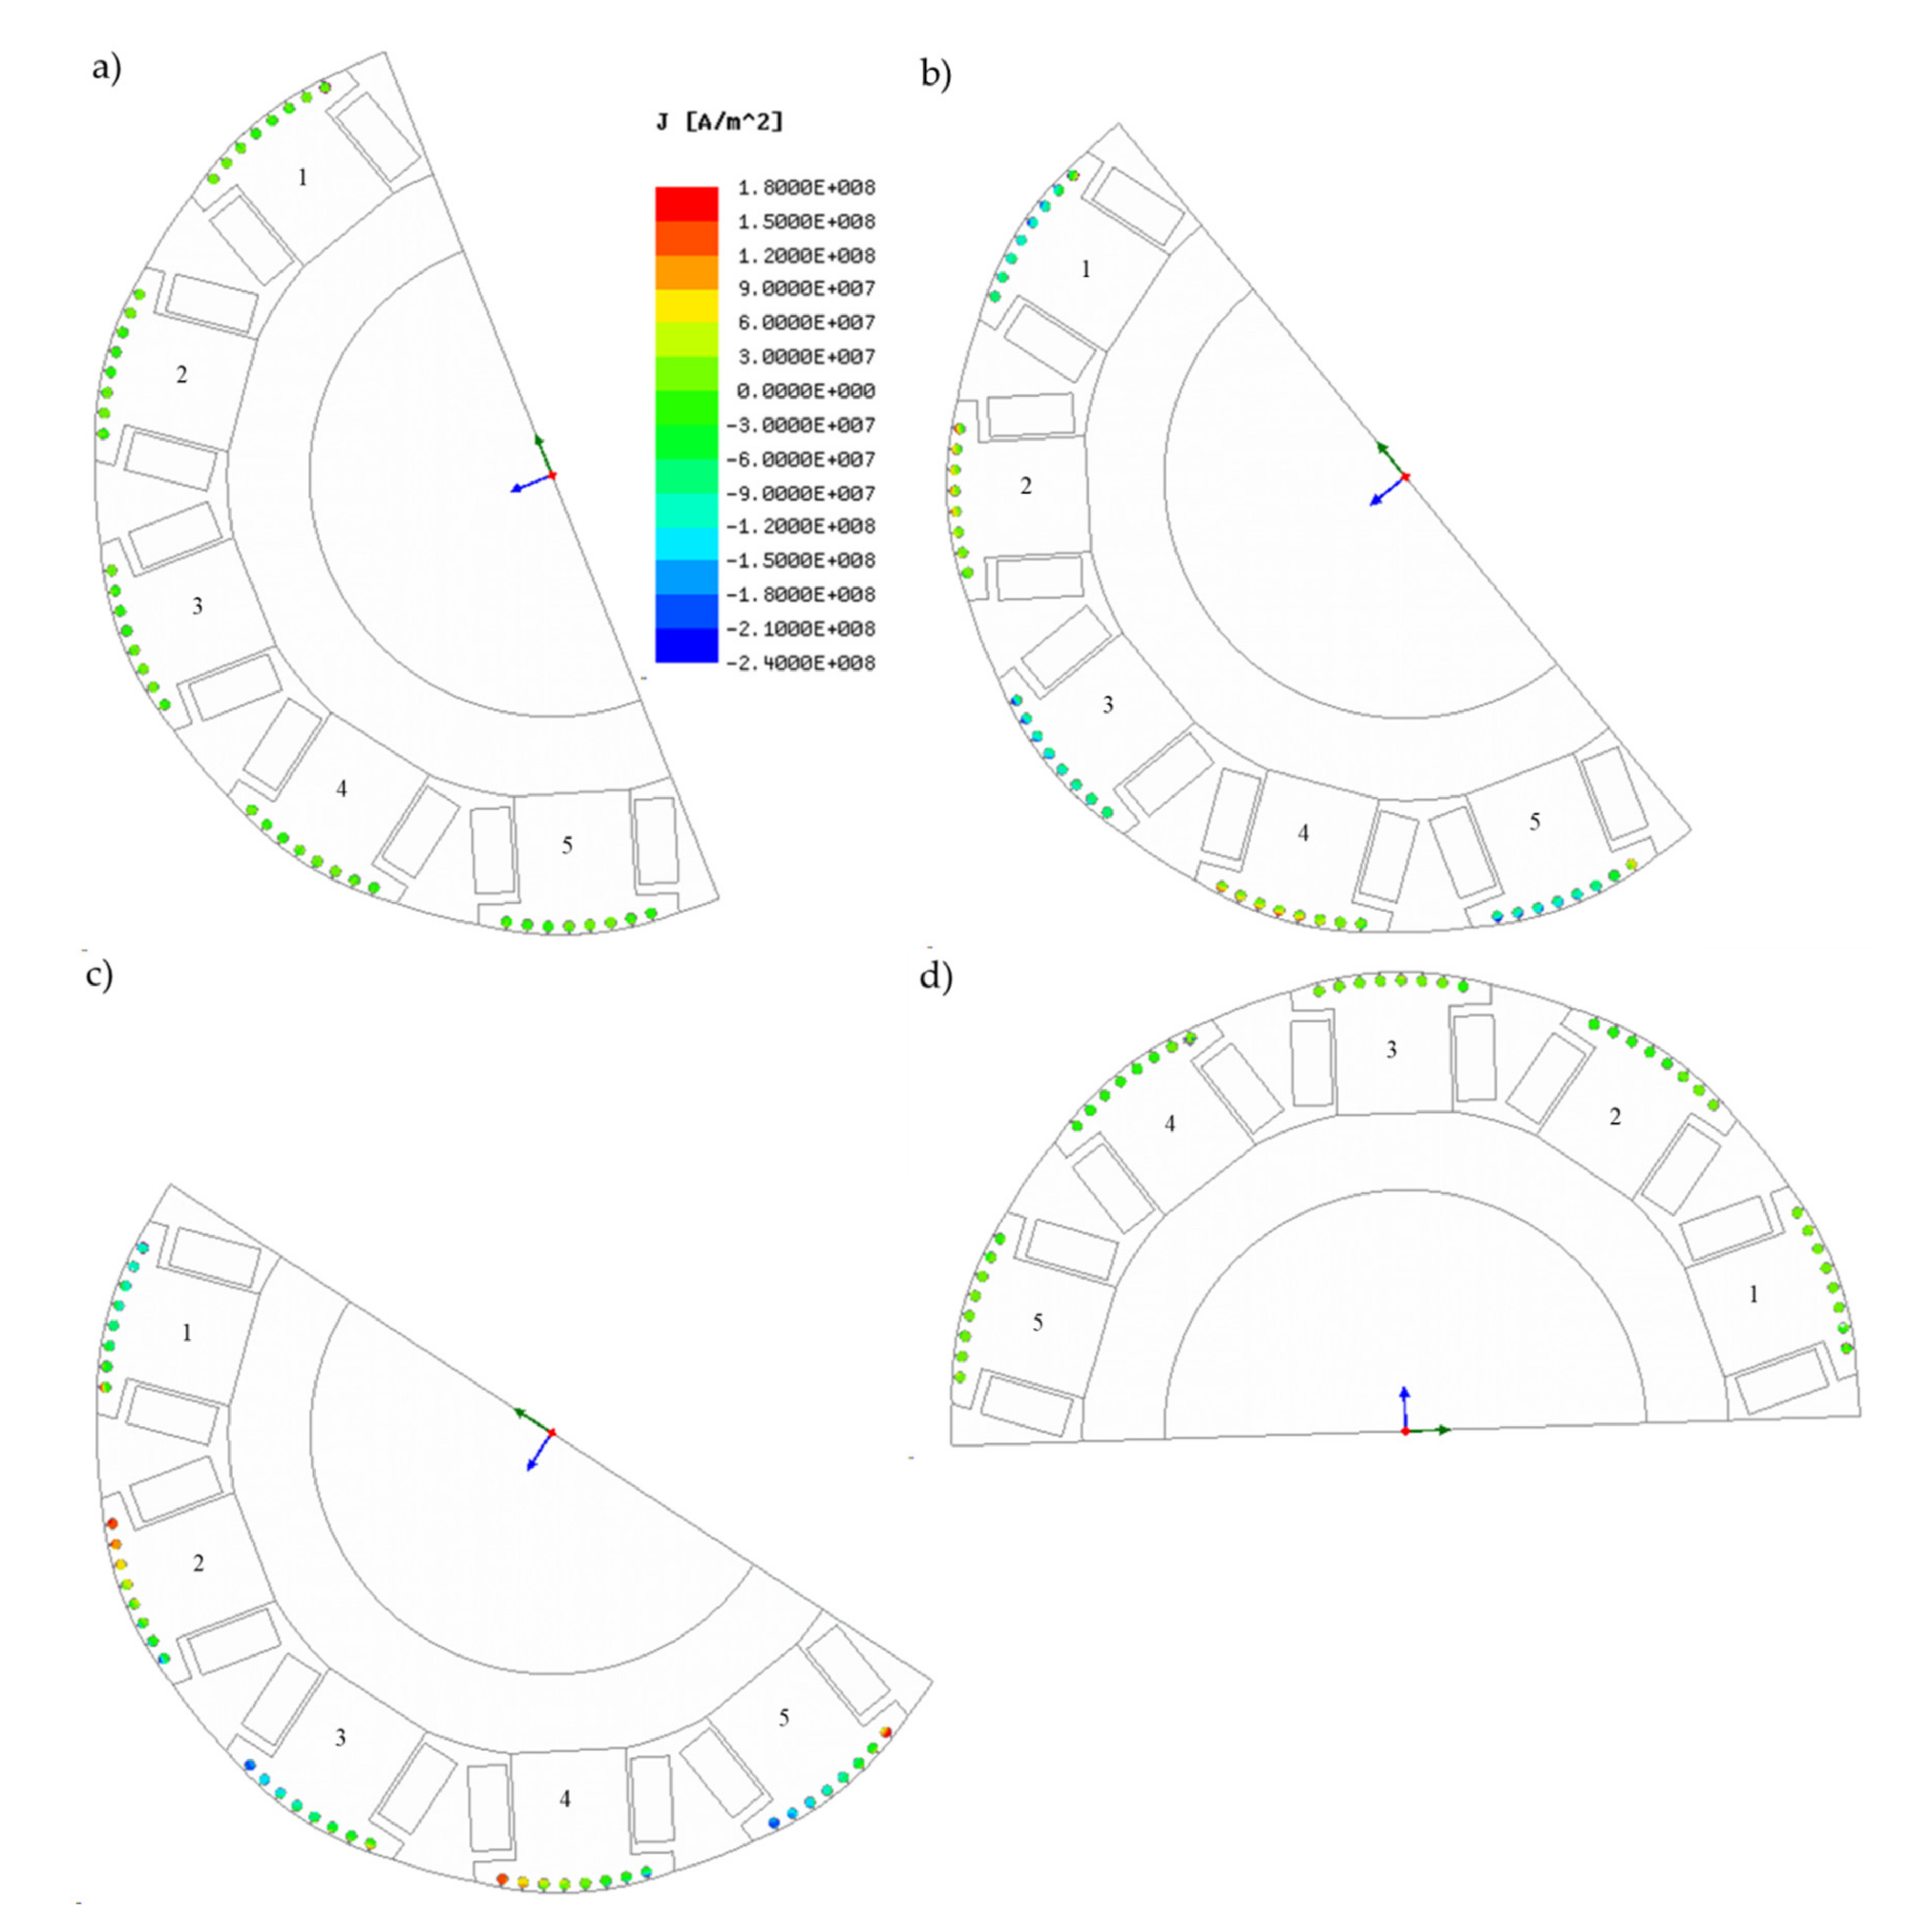
Figure 22, Figure 23 and Figure 24 present the flux lines, current densities in rotor bars, and flux densities in cores, respectively, for selected time steps. For a time instant of 0.02 s, physical phenomena were shown just before the simulated faulty synchronization. The flux lines presented the symmetrical poles, where the saturation in cores were within the limits (in the stator core below 1.9 T; in the rotor core below 1.5 T) and currents flowing through the rotor bars were very small and did not exceed 65 × 104 A/m2 (the maximum value of current in the bar was below 130 A).
After a 1/4 period of faulty synchronization, the highest saturation of cores appeared, especially in the rotor pole and yoke, which significantly exceeded the acceptable value (1.5 T). The saturation in the stator yoke was exceeded as well. The maximum computed value was equal to 1.9 T, which is above the acceptable value for a salient pole synchronous machine (1.4 T). The current densities in rotor bars did not exceed 120 × 106 A/m2.
At a time of 0.03 s, the maximum value of current densities in the rotor appeared and was equal to 180 × 106 A/m2. Huge saturation existed only in the rotor pole and yoke. Saturation in the stator teeth and yoke was within the limits. The magnetic field inside the machine was significantly distorted.
At a time of 0.302 s, the most visible field distortion was observed. There was a lack of pole symmetries. Saturation in the stator core was the same as before the faulty synchronization, whereas that in the rotor pole slightly exceeded 1.5 T. The current densities in rotor bars were no higher than 50 × 106 A/m2.
5. Comparison of Faulty Synchronization with Sudden Short-Circuit State
Hydro generators are designed to withstand the thermal and stress effects in severe emergencies. One such state is sudden three-phase short circuit. Emerging electrodynamic forces on the end-winding part of the stator winding during sudden short circuit were taken into account in the calculation in order to predict the lifetime of this construction element. The computed value of electromagnetic torque was used to estimate the stresses on the shaft. The thermal resistance of the conductive rotor parts was assessed on the basis of verified analytical equations. The temperature increase as a function of the inducted current in the rotor bar and circuited segments did not cause overheating of these construction parts before the expiry of the protection operation.
Simulations were carried out for the three-phase short-circuit fault which occurred suddenly. Before the analyzed state, the investigated hydro generator worked with no load. The three-phase stator winding was short-circuited at 0.1 s. The terminal voltage before the shorted circuit was equal to UN.
The calculated maximum value of electromagnetic torque (Figure 25a) was equal to 8.39 TN and was less than the maximum value obtained from the faulty synchronization (9.35 TN), whereas the absolute sum of the two maximum electromagnetic torques with opposite directions was equal to 14.16 TN and was significantly higher than the value obtained from faulty synchronization (10.6 TN).
Figure 25b,c present the waveforms of stator current and field current, respectively. The amplitudes of stator and field current were less than those obtained during faulty synchronization.
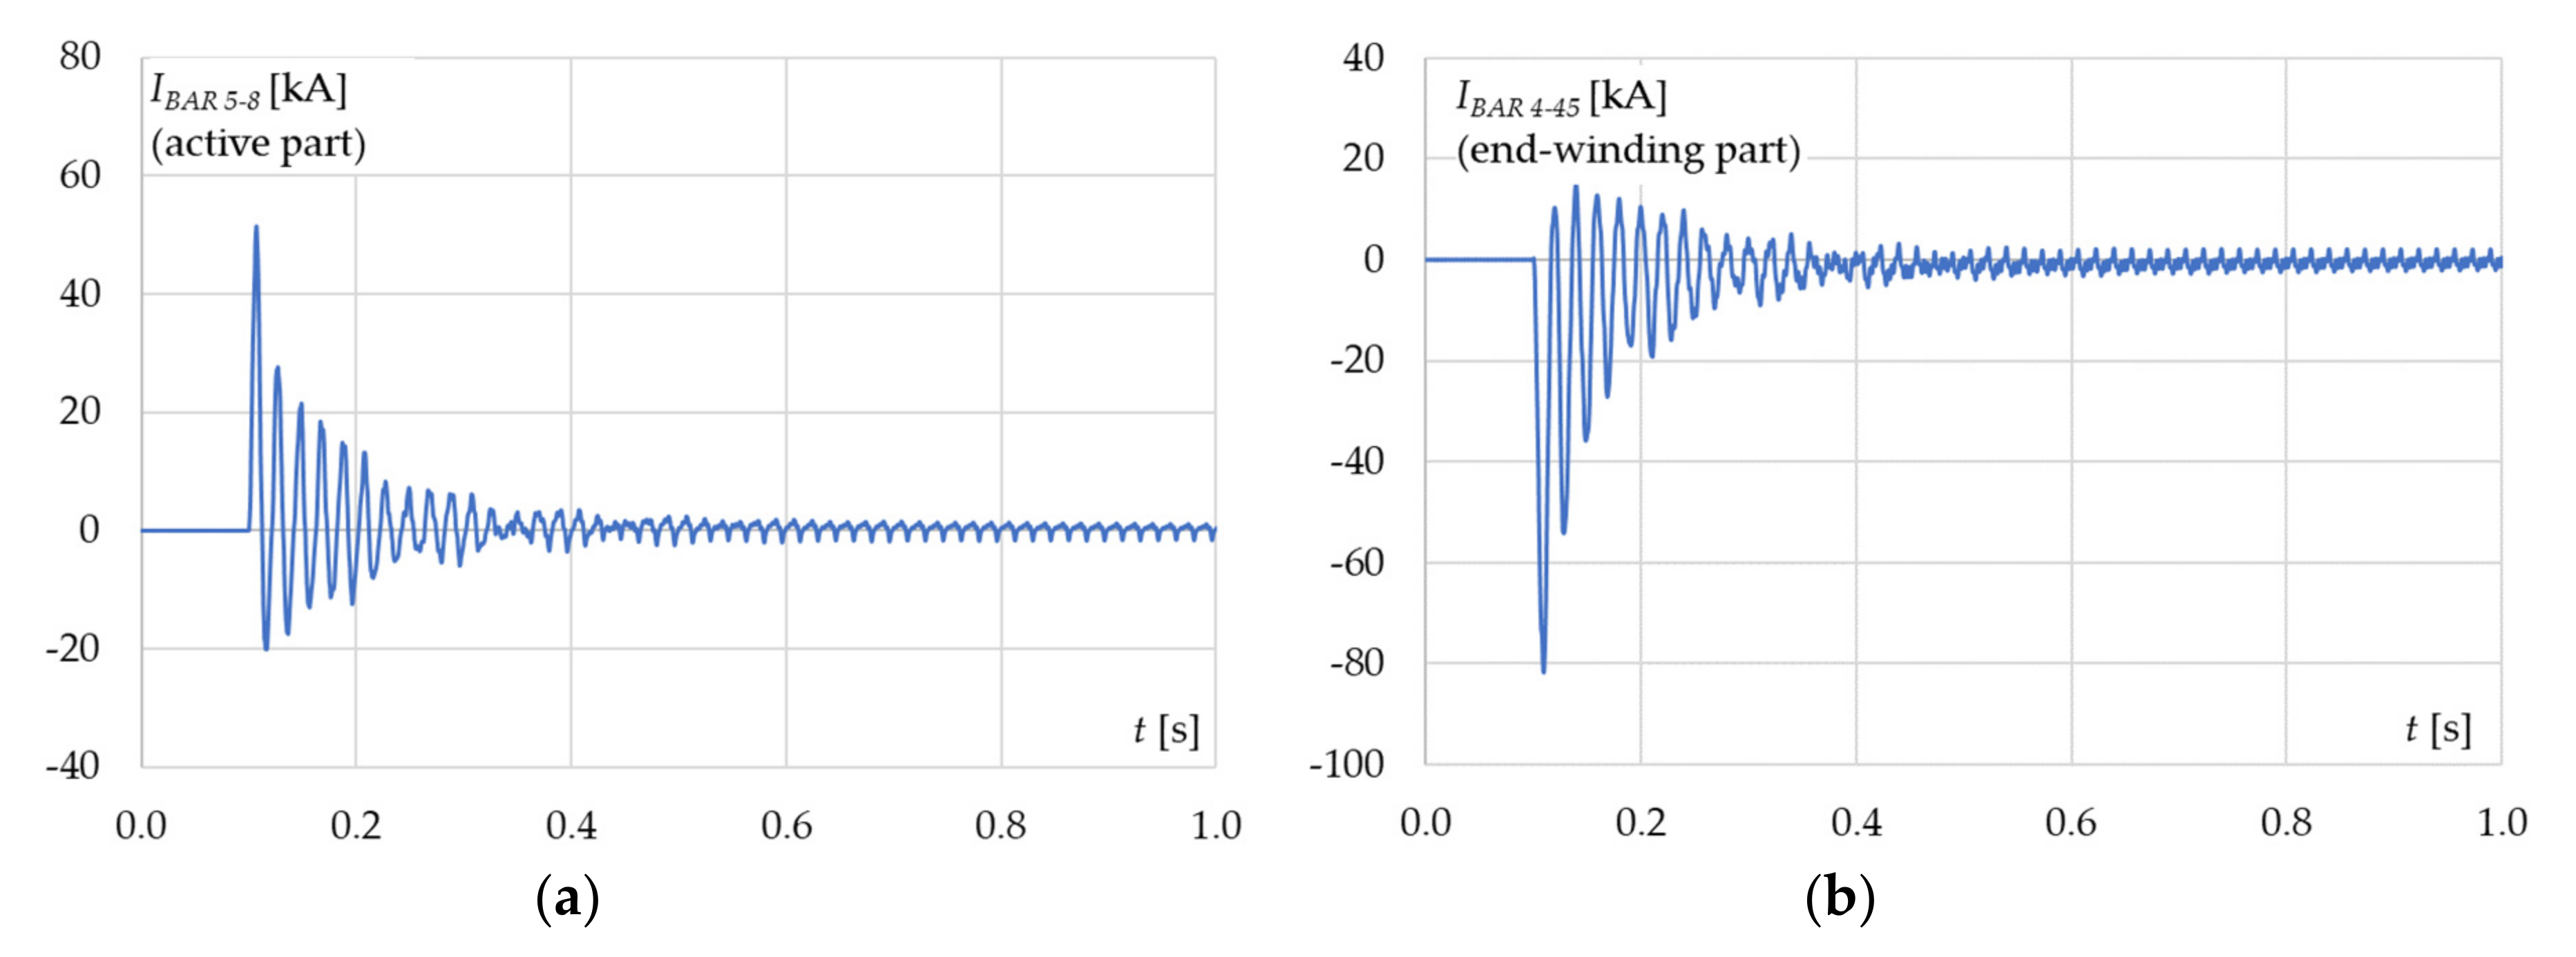
The same situation was observed in the case of induced current in rotor bars and circuited segments, which produced values lower than those for faulty synchronization. The distributions of maximum values of these currents are shown in Figure 26 and Figure 27. The maximum values of induced current in the rotor bar were close to the extremes of rotor poles, while smaller values were noted in the bars located in the center of the rotor pole. A different situation was observed in the case of current in the rotor’s circuited segment. The maximum values were located in the center of rotor pole, whereas smaller values were found in the extremes of rotor poles. The waveforms of the maximum current in the rotor bar (bar No. 5-8) and in the circuited segment (segment No. 4-45) are presented in Figure 28a,b, respectively.
A comparison of faulty synchronization (for UN) with the three-phase sudden short circuit is shown in Table 5. Only the amplitude of electromagnetic torque (TMAX 0–PEAK) obtained from the analyzed faulty synchronization was higher (by ca. 11%) than the value coming from the sudden short circuit state. A different situation occurred in the case of the absolute sum of the two maximum electromagnetic torques with opposite directions, where a higher value was obtained for the three-phase sudden short circuit.
6. Conclusions
In this article, we analyzed the impact of voltage phase shift during faulty synchronization on physical quantities such as electromagnetic torque, stator current, terminal voltage, field current, induced current in the rotor conductive part, and active and reactive power.
The utilization of the finite element method allowed observing electromagnetic phenomena inside the investigated generator, which until now were unknown. Most published studies used simplified computational models which commutate only the maximum instantaneous values of the stator current and electromagnetic torque. The influence of local core saturations and the uneven distribution of induced current in the rotor bars were ignored.
The greatest thermal hazards existed for a voltage phase shift of 180°. For this angle, the stator current, field current, and induced current in the rotor bars and circuited segments were the highest. The greatest electrodynamics forces on the stator end-winding part existed for this angle as well.
The greatest mechanical hazards existed for the voltage phase shift of −120° (when the power system voltage lagged with respect to generator voltage). In this state, the greatest electromagnetic torque appeared and caused a severe torsional moment on the shaft. The amplitude of electromagnetic torque was higher than that obtained from the three-phase sudden short circuit, whereas, in the case of the absolute sum of the two maximum electromagnetic torques with opposite directions, the maximum value was noted for a phase shift angle equal to 180° during the sudden short circuit.
Larger values of induced current in the rotor conductive parts were observed for the three-phase sudden short circuit but they disappeared relatively quickly (ca. 0.3 s, Figure 26). The induced current decay in the rotor bars was significantly slower and lasted ca. 2 s (Figure 18 and Figure 20). This potentially caused strong heating of the rotor during faulty synchronization.
The stator current and electromagnetic torque did not exceed the rated values during faulty synchronization when the voltage phase shift was less than 10°.
Funding
Computations were carried out using resources provided by the Wroclaw Center for Networking and Supercomputing (http://wcss.pl), grant No. 400.
Conflicts of Interest
The author declares no conflict of interest the results.
References
- Strang, W.M.; Mozina, C.J.; Beckwith, B.; Beckwith, T.R.; Chhak, S.; Fennell, E.C.; Kalkstein, E.W.; Kozminski, K.C.; Pierce, A.C.; Powell, P.W.; et al. Generator synchronizing industry survey results IEEE power system relaying committee report. IEEE Trans. Power Deliv. 1996, 11, 174–183. [Google Scholar] [CrossRef]
- Thompson, M.J. Fundamentals and advancement in generator synchronizing systems. In Proceedings of the 65th Annual Conference for Protective Relay Engineers, College Station, TX, USA, 2–5 April 2012; pp. 203–214. [Google Scholar]
- Ranjbar, A.H.; Gharehpetian, G.B. Transient stability of synchronous generator in out-of-phase synchronization. In Proceedings of the 5th International Conference on Electrical and Electronics Engineering, Bursa, Turkey, 5–9 December 2007; pp. 1–4. [Google Scholar]
- Belyaev, N.A.; Khrushchev, Y.; Svechkarev, S.; Prokhorov, A.V.; Wang, L. Generator to grid adaptive synchronization technique based on reference model. In Proceedings of the IEEE Eindhoven PowerTech, Eindhoven, The Netherlands, 29 June–2 July 2015; pp. 1–5. [Google Scholar]
- IEEE Standard C50.12-2005. IEEE Standard for Salient-Pole 50 Hz and 60 Hz Synchronous Generators and Generator/Motors for Hydraulic Turbine Applications Rated 5 MVA and Above; IEEE: Piscataway, NJ, USA, 2005. [Google Scholar]
- IEEE Standard C50.13-2005. IEEE Standard for Cylindrical-Rotor 50 Hz and 60 Hz Synchronous Generators Rated 10 MVA and Above; IEEE: Piscataway, NJ, USA, 2006. [Google Scholar]
- IEEE Standard C37.102-2006. IEEE Guide for AC Generator Protection; IEEE: Piscataway, NJ, USA, 2006. [Google Scholar]
- Krause, P.C.; Hollopeter, W.C.; Triezenberg, D.M.; Rusche, P.A. Shaft torque during out of phase synchronization. IEEE Trans. Power Appar. Syst. 1977, 96, 1318–1323. [Google Scholar] [CrossRef]
- Faried, S.O.; Billinton, R.; Aboreshaid, S.; Fotuhi-Firuzabad, M. Stochastic evaluation of turbine-generator shaft torsional torques during faulty synchronization. IEE Proc. Gener. Transm. Distrib. 1996, 143, 487–491. [Google Scholar] [CrossRef]
- Kabir, J.H.; Karim, I.; Chowdhury, A.H. Effect of generator saturation on shaft torques during faulty synchronization. Electr. Power Syst. Res. 1998, 44, 85–91. [Google Scholar] [CrossRef]
- Weili, L.; Purui, W.; Yong, L.; Yi, X.; Dong, L.; Xiaochen, Z.; Jianjun, Z. Influence of rotor structure on field current and rotor electromagnetic field of turbine generator under out-of-synchronization. IEEE Trans. Magn. 2017, 53, 1–4. [Google Scholar] [CrossRef]
- Aboreshaid, S.; Al-Dhalaan, S. Stochastic evaluation of turbine-generator shaft fatigue due to system faults and faulty synchronization. In Proceedings of the 2000 IEEE Power Engineering Society Winter Meeting, Singapore, 23–27 January 2000; pp. 186–191. [Google Scholar]
- Salon, S.J. Finite Element Analysis of Electrical Machines; Springer: Berlin/Heidelberg, Germany, 1995. [Google Scholar]
- Klempner, G.; Kerszenbaum, I. Handbook of Large Turbo-Generator Operation and Maintenance, 3rd ed.; Wiley: Hoboken, NJ, USA, 2018. [Google Scholar]
- IEEE 492–1999. IEEE Guide for Operation and Maintenance of Hydro-Generators; IEEE: Piscataway, NJ, USA, 1999. [Google Scholar]
Figure 1.
The field-circuit model of the investigated hydro generator with a visible finite element mesh.
Figure 1.
The field-circuit model of the investigated hydro generator with a visible finite element mesh.

Figure 2.
Schemes of stator winding (a), rotor winding (b), and distribution of damper bars (c) associated with the field model of the hydro generator.
Figure 2.
Schemes of stator winding (a), rotor winding (b), and distribution of damper bars (c) associated with the field model of the hydro generator.

Figure 3.
Comparison of measured curves with those calculated for no-load (a) and three-phase short circuit (b).
Figure 3.
Comparison of measured curves with those calculated for no-load (a) and three-phase short circuit (b).

Figure 4.
Two cases of voltage waveforms during faulty synchronization: (a) power system voltage (UPS) lagging with respect to generator voltage (UGEN); (b) power system voltage leading with respect to generator voltage.
Figure 4.
Two cases of voltage waveforms during faulty synchronization: (a) power system voltage (UPS) lagging with respect to generator voltage (UGEN); (b) power system voltage leading with respect to generator voltage.

Figure 5.
Single-line diagram of simulated case.

Figure 6.
Maximum amplitude of electromagnetic torque (a) and absolute sum of two maximum electromagnetic torques with opposite directions (b).
Figure 6.
Maximum amplitude of electromagnetic torque (a) and absolute sum of two maximum electromagnetic torques with opposite directions (b).

Figure 7.
Maximum amplitude of stator current (a) and minimum amplitude of stator voltage (b) during the first period of faulty synchronization.
Figure 7.
Maximum amplitude of stator current (a) and minimum amplitude of stator voltage (b) during the first period of faulty synchronization.

Figure 8.
Maximum amplitude of field current (a) and rotor bar current (b).

Figure 9.
Distribution of maximum values of currents induced in the active part of the rotor bar at 180° of voltage phase shift.
Figure 9.
Distribution of maximum values of currents induced in the active part of the rotor bar at 180° of voltage phase shift.

Figure 10.
Distribution of maximum values of currents induced in the rotor’s circuited segments at 180° of voltage phase shift.
Figure 10.
Distribution of maximum values of currents induced in the rotor’s circuited segments at 180° of voltage phase shift.

Figure 11.
Generated and absorbed active (a) and reactive power (b).

Figure 12.
Waveform of speed during out-of-phase synchronization of −120°.

Figure 13.
Waveform of electromagnetic torque during out-of-phase synchronization of −120° in (a) the scope of the considered calculation time and (b) the first second.
Figure 13.
Waveform of electromagnetic torque during out-of-phase synchronization of −120° in (a) the scope of the considered calculation time and (b) the first second.

Figure 14.
Waveforms of stator current during out-of-phase synchronization of −120° in (a) the scope of the considered calculation time and (b) the first second.
Figure 14.
Waveforms of stator current during out-of-phase synchronization of −120° in (a) the scope of the considered calculation time and (b) the first second.

Figure 15.
Waveforms of stator voltage during out-of-phase synchronization of −120° in (a) the scope of the considered calculation time and (b) the first second.
Figure 15.
Waveforms of stator voltage during out-of-phase synchronization of −120° in (a) the scope of the considered calculation time and (b) the first second.

Figure 16.
Waveform of field current during out-of-phase synchronization of −120° in (a) the scope of the considered calculation time and (b) the first second.
Figure 16.
Waveform of field current during out-of-phase synchronization of −120° in (a) the scope of the considered calculation time and (b) the first second.

Figure 17.
Distribution of maximum values of currents induced in the active part of the rotor bar during out-of-phase synchronization of −120°.
Figure 17.
Distribution of maximum values of currents induced in the active part of the rotor bar during out-of-phase synchronization of −120°.

Figure 18.
Waveform of induced current in bar No. 2-1 during out-of-phase synchronization of −120° in (a) the scope of the considered calculation time and (b) the first second.
Figure 18.
Waveform of induced current in bar No. 2-1 during out-of-phase synchronization of −120° in (a) the scope of the considered calculation time and (b) the first second.

Figure 19.
Distribution of maximum values of currents induced in rotor’s circuited segments during out-of-phase synchronization of −120°.
Figure 19.
Distribution of maximum values of currents induced in rotor’s circuited segments during out-of-phase synchronization of −120°.

Figure 20.
Waveforms of induced current in rotor’s circuited segment 3-8_4-1 during out-of-phase synchronization of −120° in (a) the scope of the considered calculation time and (b) the first second.
Figure 20.
Waveforms of induced current in rotor’s circuited segment 3-8_4-1 during out-of-phase synchronization of −120° in (a) the scope of the considered calculation time and (b) the first second.

Figure 21.
Waveforms of active (a) and reactive power (b) during out-of-phase synchronization of −120°.
Figure 21.
Waveforms of active (a) and reactive power (b) during out-of-phase synchronization of −120°.

Figure 22.
Magnetic field lines during out-of-phase synchronization of −120° at (a) 0.02 s, (b) 0.025 s, (c) 0.03 s, and (d) 0.302 s.
Figure 22.
Magnetic field lines during out-of-phase synchronization of −120° at (a) 0.02 s, (b) 0.025 s, (c) 0.03 s, and (d) 0.302 s.


Figure 23.
Current densities in rotor bars during out-of-phase synchronization of −120° at (a) 0.02 s, (b) 0.025 s, (c) 0.03 s, and (d) 0.302 s.
Figure 23.
Current densities in rotor bars during out-of-phase synchronization of −120° at (a) 0.02 s, (b) 0.025 s, (c) 0.03 s, and (d) 0.302 s.

Figure 24.
Flux densities during out-of-phase synchronization of −120° at (a) 0.02 s, (b) 0.025 s, (c) 0.03 s, and (d) 0.302 s.
Figure 24.
Flux densities during out-of-phase synchronization of −120° at (a) 0.02 s, (b) 0.025 s, (c) 0.03 s, and (d) 0.302 s.

Figure 25.
Waveforms of electromagnetic torque (a), stator current (b), and field current (c) during the first second of sudden short circuit.
Figure 25.
Waveforms of electromagnetic torque (a), stator current (b), and field current (c) during the first second of sudden short circuit.

Figure 26.
Distribution of maximum values of currents induced in the active part of the rotor bar during the sudden short circuit.
Figure 26.
Distribution of maximum values of currents induced in the active part of the rotor bar during the sudden short circuit.

Figure 27.
Distribution of maximum values of currents induced in the rotor’s circuited segments during the sudden short circuit.
Figure 27.
Distribution of maximum values of currents induced in the rotor’s circuited segments during the sudden short circuit.

Figure 28.
Waveforms of induced current in bar No. 5-8 (a) and circuited segment No. 4-45 (b) during the first second of sudden short circuit.
Figure 28.
Waveforms of induced current in bar No. 5-8 (a) and circuited segment No. 4-45 (b) during the first second of sudden short circuit.


Table 1.
Main rated data of investigated hydro generator.
| Data Name | Symbol | Unit | Value |
|---|---|---|---|
| Apparent power | SN | kVA | 4500 |
| Stator voltage | USN | V | 6000 |
| Stator current | ISN | A | 433 |
| Speed | nN | rpm | 600 |
| Torque | TN | kNm | 71.6 |
| Power factor | cosφN | - | 0.80 |
| Frequency | fN | Hz | 50 |
| Excitation current | IFN | A | 295 |
| Efficiency at TN and cosφN | ηN | % | 97.1 1 |
| Generator moment of inertia | JG | kgm2 | 2548 |
1 Total losses were not included in the loss margin (the losses were measured).
Table 2.
Main geometry dimensions of the investigated hydrogenerator.
| Data Name | Unit | Value |
|---|---|---|
| Stator outer diameter | mm | 1850 |
| Stator inner diameter | mm | 1450 |
| Airgap | mm | 11 |
| Stator core length (with ventilation ducts) | mm | 770 |
| Ventilation ducts width | mm | 10 |
| Number of ventilation ducts | - | 12 |
| Stator slots | - | 114 |
| Number of turns per phase in stator | - | 95 |
| Rotor shoe width | mm | 310 |
| Rotor shoe height | mm | 55 |
| Rotor body width | mm | 180 |
| Rotor body height | mm | 165 |
| Number of rotor turns per pole | - | 60 |
| Number of rotor bars per pole | - | 8 |
| Rotor bar diameter | mm | 16 |
| Height of shorted segment of rotor bars | mm | 25 |
| Width of shorted segment of rotor bars | mm | 35 |
| Distance between two rotor bars in pole | mm | 34 |
Table 3.
Computed resistances and reactances of the power system and unit transformer.
| Symbol | Unit | Value |
|---|---|---|
| RPS | mΩ | 0.24 |
| LPS | μH | 7.60 |
| RTR | Ω | 0.12 |
| LTR1 | mH | 1.53 |
1 Main data of unit transformer: STR = 4.5 MVA, UTR = 6 kV/21 kV, uk% = 6%, and ΔPO = 1.5%.
Table 4.
Computed reactances and time constants of the investigated hydrogenerator.
| Symbol | Unit | Value |
|---|---|---|
| Xd | p.u. | 1.22 |
| Xq | p.u. | 0.70 |
| X’d | p.u. | 0.27 |
| X”d | p.u. | 0.19 |
| X”q | p.u. | 0.17 |
| X2 | p.u. | 0.18 |
| X0 | p.u. | 0.09 |
| T’d | s | 0.710 |
| T”d | s | 0.045 |
| T”q | s | 0.056 |
| Ta | s | 0.080 |
Table 5.
Comparison of maximum values of physical quantities existing during faulty synchronization and sudden short circuit.
Table 5.
Comparison of maximum values of physical quantities existing during faulty synchronization and sudden short circuit.
| Physical Quantities | Unit | Faulty Synchronization | Sudden Short Circuit |
|---|---|---|---|
| IS MAX/ISN | p.u. | 10.79 | 12.09 |
| TMAX0–PEAK/TN | p.u. | 9.35 | 8.39 |
| TMAX PEAK-TO-PEAK/TN | p.u. | 10.60 | 14.16 |
| IF MAX/IFN | p.u. | 3.42 | 3.80 |
| IROTOR BAR IN ACTIVE PART | kA | 41.79 | 51.41 |
| IROTOR BAR IN ACTIVE PART | kA | 72.15 | 81.71 |
Publisher’s Note: MDPI stays neutral with regard to jurisdictional claims in published maps and institutional affiliations. |
© 2020 by the author. Licensee MDPI, Basel, Switzerland. This article is an open access article distributed under the terms and conditions of the Creative Commons Attribution (CC BY) license (http://creativecommons.org/licenses/by/4.0/).
Share and Cite
MDPI and ACS Style
Gozdowiak, A. Faulty Synchronization of Salient Pole Synchronous Hydro Generator. Energies 2020, 13, 5491. https://doi.org/10.3390/en13205491
AMA Style
Gozdowiak A. Faulty Synchronization of Salient Pole Synchronous Hydro Generator. Energies. 2020; 13(20):5491. https://doi.org/10.3390/en13205491
Chicago/Turabian StyleGozdowiak, Adam. 2020. "Faulty Synchronization of Salient Pole Synchronous Hydro Generator" Energies 13, no. 20: 5491. https://doi.org/10.3390/en13205491
Note that from the first issue of 2016, this journal uses article numbers instead of page numbers. See further details here.