Organic Rankine Cycle Waste Heat Recovery for Passenger Hybrid Electric Vehicles


1
Department of Mechanical and Aerospace Engineering, Brunel University, London UB8 3PH, UK
2
Metapower Limited, Northwood, London HA6 2NP, UK
3
Department of Mechanical Engineering, University of Hail, Hail 81481, Saudi Arabia
*
Author to whom correspondence should be addressed.
Energies 2020, 13(17), 4532; https://doi.org/10.3390/en13174532
Submission received: 9 July 2020
/
Revised: 25 August 2020
/
Accepted: 25 August 2020
/
Published: 1 September 2020
(This article belongs to the Special Issue Waste Energy Recovery and Valorization in Internal Combustion Engines)
Abstract
:Electrification of road transport is a major step to solve the air quality problem and general environmental impact caused by the still widespread use of fossil fuels. At the same time, energy efficiency in the transport sector must be improved as a steppingstone towards a more sustainable future. Multiple waste heat recovery technologies are being investigated for low-temperature waste heat recovery. One of the technologies that is being considered for vehicle application is the Organic Rankine Cycle (ORC). In this paper, the potential of ORC is discussed in detail for hybrid vehicle application. The modelling and testing of multiple systems such as the hybrid vehicle, engine, and ORC waste heat recovery are performed using the computational approach in GT-SUITE software environment correlated against available engine data. It was found that the maximum cycle efficiency achieved from the ORC system was 5.4% with 2.02 kW of delivered power recovered from the waste heat available. This led to 1.0% and 1.2% of fuel economy improvement in the New European Driving Cycle (NEDC) and Worldwide Harmonised Light Vehicle Test Procedure (WLTP) driving cycle test, respectively. From the driving cycle analysis, Hybrid Electric Vehicles (HEV) and ORC are operative in a different part of the driving cycle. This is because the entire propulsion power is provided by the HEV system, resulting in less engine operation in some part of the cycle for the ORC system to function. Apart from that, a brief economic analysis of ORC Waste Heat Recovery (WHR) is also performed in this paper and a comparative analysis is carried out for different waste heat recovery technologies for hybrid vehicle application.
1. Introduction
For decades, a continuous increase in the consumption of fossil fuel by human activities and industrial production has damaged the environment and posed a threat to the environment and health. The latest studies show that major cities such as London, Milan, and Paris suffer from a public health burden due to emissions from on-road vehicles. In London, the major cause of this problem is the emissions from vehicles, where 46% of the transportation health burden is contributed by diesel vehicles, while 6% is from the non-diesel vehicles [1].
Wang and Lin [2] outlined the major influencing factors of fuel consumption in China and concluded that urbanization, investment, and government spending-driven economic development are the core influential factors. Ruhnau et al. [3] reviewed the energy scenario in Germany for climate change mitigation and suggested that a plan must be made for increasing demand of renewable electricity in transportation and the stakeholders should be aware of technological uncertainties in the transport sector. Apart from that, it was informed that more system-friendly direct heat electrification is needed to reach climate policy targets.
In addition, improvement of the current technologies and a more strategic approach should be aligned together to overcome this energy-related problem. Some studies have discussed the approach to tackle the air quality problem and energy consumption in which they mostly agreed that the electrification of road transport is one of the most important steps. Li and Chang [4] studied the progression of electrification of road transport in ASEAN (Association of Southeast Asian Nations) countries and the potential of reduction in fossil fuel consumption in those countries. The study revealed that the power sectors require a higher integration of renewable energy for higher fuel economy standards because the domination of fossil fuels in electricity generation will increase the primary energy consumption.
Hybrid Electric Vehicles (HEVs) and Electric Vehicles (EVs) were introduced in the passenger car market to improve the fuel efficiency of motor vehicles and reduce pollutant emissions. Trends in the market shares of electric vehicles in Figure 1 shows that both HEVs and BEVs (Battery Electric Vehicles) population will continue to increase over time, where HEVs will have a greater market share than BEVs. Improvement in ICEs (Internal Combustion Engines) through hybridization or partial electrification is crucial at current market conditions in terms of affordability and energy security [5]. HEVs, which are built to reduce the consumption of fuel by the combination of an internal combustion engine and electric power source, are more affordable and widely available to a normal user. Furthermore, HEVs are the cheapest for lifecycle cost compared to EVs and FCEVs (Fuel Cell Electric Vehicles) even though EVs and FCEVs are better for emission reduction [6].
According to [8], HEV can save more fuel in the range of 23–49% under a novel convoy mode compared to conventional gasoline vehicles. CO2 reduction target can be achieved through hybridization of vehicle powertrain due to a reduction in fuel consumption. At the same time, the reconfiguration of the electricity system architecture for low-carbon progress must be acceptable for technological changes [9].
Electric hybrids with gasoline internal combustion engines are currently commercially available. In the last generation of the fully hybrid vehicles, such as the Toyota Yaris and Prius, the fuel consumption has reduced a lot compared to the conventional Toyota Yaris due to higher efficiency when operating at low and medium speed. In addition, the high efficiency of the braking energy recovery system in Prius results in a lower fuel consumption [10]. According to a report from [11], Japan, United States, and China have benefitted the most from fuel consumption reduction from the electrification of passenger car road transport due to an improvement in the fuel economy of hybrid and electric vehicles (Figure 2).
Due to depleting resources of fossil fuel, various strategies have been discovered to conserve the use of fuel. For instance, low-medium grade heat sources have been considered a possible source for waste heat recovery [12]. The motivation of this work is to support the development of reducing the waste heat source in terms of fossil fuel consumption in an automotive application. This is because wasted heat accounts for more than 50% of the overall energy used in the world [13]. Meanwhile, it was reported that almost a third of the energy for thermal processes in the industrial sector in the EU is lost through waste heat [14]. Interestingly, it was projected that 43% of the global waste heat will come from the transport sector in 2030 [15].
Another important work that is involved in this study is the analysis of the efficiency of heat conversion in the waste heat recovery (WHR) system. There are several energy regeneration technologies that have been applied on vehicles such as regenerative braking, exhaust waste heat recovery, and suspension vibration energy recovery. According to [16], the performance of exhaust WHR is more stable than regenerative braking and suspension energy recovery as the operation changes mildly in different driving conditions. However, the combination of all three systems can produce the best result for fuel consumption in a hybrid vehicle.
The most common application of the WHR system is the Rankine cycle which utilizes the thermodynamic cycle to generate power from a waste heat source. ORC is already implemented on the commercial vehicle or heavy-duty vehicle. The latest studies of ORC application on the heavy-duty vehicle also include the electric powertrain integration in the system. Reference [17] used a 12.6-L turbocharged diesel engine model in GT-Power to optimize the heavy-duty driving cycle and obtain maximum power output by controlling the pump and turbine of the ORC unit. In the system, ORC is used to recover the heat energy from the engine exhaust which is later restored to a battery pack. Although the ORC system is applied to a different type of vehicle, the approach can also be used in HEVs since electric powertrain is involved.
In the case of a passenger car, there is a limited study of ORC on HEV. The most notable works are from [18,19], where the ORC system was applied to HEV and was tested under different driving conditions. In the meantime, there is more research on the ORC system that is applicable to a diesel vehicle. This is most probably because more waste heat energy is produced in diesel engines and conventional diesel has multiple waste heat sources. References [20,21,22] developed the integrated solution of an ORC system in their simulation of diesel engine models with different operating conditions in GT-SUITE software. Reference [23] discovered that 14.23% of thermal efficiency can be achieved by using their proposed modification of basic ORC systems in a diesel engine.
The aim of this paper was to study the hybrid vehicle powertrain and ORC waste heat recovery system with the aim to improve the hybrid vehicle performance. Thus, the focus was on HEV modelling and simulation with an integrated ORC system to investigate the improvement of system performance and efficiency. The objectives for the project were defined to examine the operational principle of HEV and HEV powertrain architecture, implementation of ORC waste heat recovery system in HEV, to develop an engine system model in GT-Suite software with an ORC waste heat recovery system for the engine testing simulation, to evaluate the performance and efficiency of an integrated ORC waste heat recovery in HEV powertrain, and to identify the potential advantages of the ORC system over other competing technologies. Additionally, an evaluation was made by comparing the experimental and theoretical results for potential improvements of the ORC waste heat recovery system in the future.
2. Literature
2.1. Waste Heat Recovery
WHR processes are categorized by their temperature level, which is graded as high temperature, medium temperature, and low temperature. Therefore, research and application of WHR are usually classified according to these three levels of the heat source. Passenger car exhaust waste heat is regarded as low-temperature waste heat, in the temperature range of 120–650 °C [24]. The benefits of using WHR technologies are listed in a study by [14]:
- Fuel consumption reduction
- Saving on electricity and mechanical work generation
- Reduce cooling requirement
- Capital investment cost cutbacks
- Production enhancement
- Reduction in Greenhouse gas emissions
- Transforming the heat to useful forms of energy
Exhaust gas and engine coolant are the two most wasted heat sources in a vehicle where two-thirds of the energy contained in the fuel is converted into heat. The flow of energy from the fuel in a vehicle operation is illustrated in Figure 3 [25].
Jouhara et.al. [26] provided an insight on how waste heat can be recovered through numerous heat recovery technologies where the method usually varies in terms of suitability and effectiveness. To date, only several waste heat recovery technologies are available for ICE improvement. Most notable examples are turbocompound, thermoelectric generator, and the Organic Rankine Cycle (ORC). Although a few solutions are already in the market, these technologies are still under development [27]. The Exhaust Waste Heat Recovery System (EWHR) in Figure 4 has been developed by [28], which is applicable for HEVs and PHEVs. The EWHR, which is built together with Exhaust Gas Recirculation (EGR), offers up to 8.5% improvement in fuel economy.
Under motorway driving conditions, [29] described the typical energy balance of a 2.0-L gasoline engine as illustrated in Figure 5. The engine was tested close to its maximum brake-power efficiency, at an average velocity of 110 km/h where it was found that exhaust waste heat energy represents 33% of the total fuel energy. In a later review, in the case of diesel engines, it was reported in [30] that more than 60% energy is released as waste heat. In terms of exergy, higher temperature output from exhaust gas makes a better deal for heat recovery potential. However, according to [31], heat recovery in engine coolant is lighter, cheaper, and safer than in exhaust gas, although the fuel consumption could only be reduced by up to 3%. The temperature of the exhaust gas in a diesel engine was found to be lower than a gasoline engine but contained more energy due to the relative difference between the air/fuel ratio of diesel and gasoline engine [19].
Essentially, most of the fuel energy is distributed into effective work, coolant energy, and exhaust energy; [32] described the typical energy and exergy distribution of turbocharged, direct injection gasoline (GDI) engine under the part-load condition as shown in the Figure 6. In Figure 6, it is clearly described that the quantity of energy from the exhaust gas is almost the same as effective work produced. However, the exergy percentage is lower because the exhaust gas is classified as low-grade energy.
2.2. Rankine Cycle
Rankine cycle (RC) is a thermodynamic cycle which converts heat into mechanical power. The mechanical power can be used to drive a machine directly or to produce electricity. More different configurations of RC are presented and discussed by [13]. Few examples of the common type of RC in a waste heat recovery system are RC with superheating, reheat cycle, and regenerative cycle. The cycle efficiency will depend on multiple parameters such as heat source type, temperature, and operating conditions. The major components of RC include the compressor (pump), boiler (evaporator), expander, and condenser. A schematic diagram of the cycle is presented in Figure 7.
The ideal Rankine cycle presented in the T-S diagram in Figure 7 consists of the following processes [34]:
- 1–2 isentropic compression in the pump
- 2–3 working fluid heating and evaporation in the boiler
- 3–4 isentropic expansion in the turbine
- 4–1 working fluid cooling in the condenser
The processes in the cycle are explained by using Figure 7:
- In process 1–2, the pressure of the working fluid is raised due to the work from the pump, W12, resulting in an increase in specific fluid enthalpy.
- In process 2–3, the pressurized working fluid passes through the evaporator and the temperature of the fluid is raised due to the exchange of heat, Q23, in the heat exchanger. The heat transfer from the heat source to the working fluid causes the fluid to evaporate at the boiler outlet.
- Then, the evaporated working fluid expands isentropically in an expansion device in process 3–4, from high pressure to low pressure, where the specific fluid enthalpy changes from h3 to h4. The expansion process leads to the generation of the mechanical power, W34,is, of the expansion machine output shaft. This process is given as:
- After that, the working fluid passes through the condenser, where the working fluid returns to its initial state (process 4–1). The condensation heat, Q41, is rejected in the condenser and eventually released to the surroundings.
- The processes described before are based on a reversible process which is not possible in real life. These irreversible changes of state occurred in the pump and expander; hence, both are given as isentropic compression work and isentropic expansion work, respectively. The isentropic efficiency ƞ for pump and expander is given by:
- Rankine cycle thermal efficiency, ηth, is the ratio of work output, Wnet, and the heat input, Q23. The net output work is calculated by subtracting the mechanical output of the expansion device, W34, with the work in the pump, W12.
S. I. Garcia, R. F. Garcia, J. C. Carril and D. I. Garcia [35] reviewed the recent types of ORC for low-grade waste heat to compare their thermodynamic efficiency. It was reported that closed process thermal cycles were the most effective, where most of the efficiency was between 5% to 10%. In terms of the architecture, a minimal and well-optimized design of a Rankine cycle heat recovery system that can fit into the underbody of a car would be a great addition to the line of WHR technologies [36]. For passenger car applications, the system should be the simplest possible because the additional components in the system can increase the total vehicle weight and at the same time reduce the overall efficiency of the vehicle.
There are different existing structures of the ORC waste heat recovery system [37]. Figure 8 and Figure 9 show the two simplest structures of the ORC system.
In general, both types of ORC configurations are applied to engine exhaust waste heat recovery. In Figure 9, an extra liquid-gas heat exchanger is used which is called a recuperator. The additional recuperator gives slightly higher power output and reduces the condenser heat rejection but is not necessary for compactness of the design unit [38]. In an economic analysis by [39], the basic ORC and ORC with an internal heat exchanger (IORC) were compared. The result shows that both systems can produce zero net power difference between them, although the same dry working fluid and exhaust temperature was used. Furthermore, IORC was better in performance if higher exhaust temperature was used, but less economical because the increase in power output was small. Meanwhile [40], compared the basic ORC with regenerative ORC by utilizing R123 as the working fluid. The thermal efficiency was lower than basic ORC, although the regenerator in ORC reduces the heat transfer rate in the evaporator.
There are several other structures available which introduce more complexity in the design and require modification of the engine block and significant redesign of the engine system. For diesel engines, the regenerative dual loop is mostly used, whereas the regenerative single loop is more common for ICE and gas turbines [13]. Newer or more advanced configuration is also proposed for the ORC system, for example, a cascaded closed loop cycle which introduces an additional expander in the system. Reference [41] revealed a significant increase of power output in a theoretical assessment of the cascaded closed loop cycle. Compared to the basic cycle, the thermal efficiency was 8% higher with optimization of stream mass flow ratio. The cycle utilizes propane as a working fluid and was suggested for temperatures higher than 200 °C.
A new double pressure ORC system proposed by [42] which utilizes high- and low-pressure evaporators also offered better performance than a single pressure ORC. The research on ORC is not limited to only the configuration itself but also includes the energy storage system. For instance [43], managed to integrate a double latent thermal energy storage into the ORC system for engine WHR. Moreover, the planned solution was also able to reduce the fluctuation of the engine exhaust heat.
3. Methodology
3.1. Engine Model Calibration
The engine model calibration and optimization process requires a lot of understanding of multiple variables involved in an engine’s parameter. To limit the set of variables involved in the optimization process, more focus was given to important points in the engine operation, which are shown in Figure 10 (red dots). As can be seen from the graph of the engine’s actual Brake Specific Fuel Consumption (BSFC) for Toyota Prius, the optimum BSFC is at 220 g/kWh in the middle-speed area, at an engine speed between 1200 to 3000 rpm and 80 to 110 Nm torque. Meanwhile, the high BSFC area is either at low speed/idling, where significant fuel consumption occurs at a lower load or when the engine is at the highest speed. However, since the engine of a hybrid car can work efficiently in hybrid mode, the point at low speed is less attractive for waste heat recovery due to the low temperature produced.
Engine model case setup: Operating conditions for the WHR system optimization and simulation is a critical part of the engine model calibration because the engine should be simulated under real-life operating circumstances so that the results acquired can be validated with real data produced from the car manufacturer or available reports. Moreover, the operational points where the engine is working most of the time in the driving cycle are the points of interest, to maximize the fuel consumption benefit at such points. For the analysis, WHR systems were assessed and compared for six engine functioning points which were included in the calibration process. The operating points chosen are at low speed, lowest BSFC, part load, maximum torque, and maximum brake power, as indicated in Table 1 below.
Figure 10 shows the BSFC improvement and performance of Toyota Prius from the 1NZ-FXE Toyota engine (red line) to the 2ZR-FXE Toyota engine (blue line), in which the latter will be used in this study [44]. Meanwhile, in Figure 11, a different performance map of the engine for the rated power is presented. For the 1.8 L engine, 20 kW is generated at optimum BSFC and the highest power output is when the engine is running at 5200 rpm which is the rated power of the engine, as given in Table 2.
Figure 12 shows the BSFC plot generated from the engine calibration. As can be seen in the plot, the BSFC does not increase linearly with engine speed and torque. The middle part of the plot, which is between 2000 to 3000 and around 100 Nm torque, represents the lowest calibrated BSFC value (224 g/kWh). On the other hand, the brake power is increasing with engine speed and torque, as can be seen in the calibrated engine brake power in Figure 13.
Performance of the engine was calibrated against either BSFC or brake power since limited information was available in the performance map for validation. However, the theoretical value given by the performance map from Toyota is not exactly accurate because the range value was only given as shown in Figure 10 and Figure 11. Table 3 shows the engine operating points chosen for analysis, denoted with P1 to P6. From the Table, the percentage error is below 3% for BSFC and 6% for power. The maximum error is less than 10%. Hence, the performance of the engine can be predicted using the simulation model.
Engine Model in GT-SUITE: The model of the four-cylinder SI (Spark Ignition) engine with a catalytic converter and throttle controller is illustrated in Figure 14. This model is available in GT-SUITE for gasoline engines, which demonstrates how to simulate the engine running at different loads by using a “Throttle Controller.” In this model, the “Throttle Controller” is set up to target an average engine torque at different engine speeds. This simulation will run until it reaches steady-state conditions at different operating conditions of the engine model, and RLT (reformulation-linearization technique) convergence is set for the engine torque to reach the target value.
Modifications of the Engine Model:
- The value of cylinder geometry such as bore, stroke, connecting rod length, TDC (Top Dead Centre) clearance height and compression ratio is adjusted according to engine specification.
- The stroke of the engine is increased to 97.6 mm, with a total engine displacement of 1987cc.
- The compression ratio is increased to 14:1.
3.2. Organic Rankine Cycle System Optimization
The ORC system model in GT-SUITE is built and modified for EWHR configurations in vehicles. This system is based on the Rankine cycle with R245fa as a working fluid. It was decided that R245fa is the most common choice of fluid for this type of application and suitable for the temperature range of the exhaust gas, as reported in the literature review made earlier in the study. The simulation is performed at a steady-state operating point. Figure 15 shows the schematic diagram of components used in the ORC system. The heat loss in the pipes connecting the heat exchanger is neglected. The recuperator is not included in the system to keep the minimal design of the ORC system. Furthermore, as discussed earlier, the difference in the power generated by the ORC system with the recuperator is very small.
3.3. Driving Cycles Testing
For fuel economy validation and comparison of the hybrid vehicle with and without the ORC system, the NEDC (New European Driving Cycle, EU) and Worldwide Harmonised Light Vehicle Test Procedure (WLTP) drive cycle was selected. The New European Driving Cycle (NEDC) represents the typical usage of a car in Europe, which is performed based on a chassis dynamometer for emission testing and fuel consumption. Meanwhile, WLTP is the latest test developed by the EU for more realistic testing conditions that provide a better on-road driving profile to calculate the fuel economy and emissions of a vehicle.
Initially, the power split HEV model (Figure 16) was run by using the calibrated BSFC data without the ORC system. For the simulation, the engine details were also adjusted to the 2ZR-FXE engine specifications. The vehicle specifications are given in the appendix section for Toyota Prius. The vehicle mass used was 1500 kg and the drag coefficient was 0.25. By using the selected driving cycles, the required outputs were plotted for comparative analysis. Once the BSFC reduction was obtained from the ORC system, a new map of BSFC was generated and applied to the vehicle model. Using the same HEV powertrain models and component specifications, the same selected driving cycles were run again to obtain a new output for comparison.
4. Results
The simulation was carried out at a steady-state condition at various engine operating speeds, starting from 1000 rpm to 5000 rpm and targeted torque of 50 to 150 Nm. The targeted operating points will be discussed based on the operating points presented earlier which were denoted as P1, P2, P3, P4, P5, and P6. In this simulation, the backpressure caused by the ORC’s evaporator was neglected. Besides, the mass of all components involved in the ORC were not considered. In comparison to vehicle mass, the ORC mass is assumed to be very small to influence vehicle performance and fuel consumption. The system built is non-isentropic, but it was reported that there is a linear relationship between practical cycle and ideal cycle in terms of total irreversibility, thermal efficiency, and net power output [45].
4.1. Engine Waste Heat
The simulation of the engine model was completed initially to have the results of the exhaust temperature and mass flow rate before they were exported to the model of the ORC system. The data of the exhaust mass flow rate and exhaust gas temperature from the calibrated engine are crucial because they characterize the available waste heat energy to be recovered in the ORC system. As shown in the plot in Figure 17 and Figure 18, the reading of the exhaust temperature and mass flow rate fluctuate and are reliant on the operating points of the engine. This can be explained by the air/fuel ratio of the engine. Basically, at higher engine speeds the amount of fuel injected in the cylinders increases at a higher rate than the inducted air, resulting in a lower air/fuel ratio. Hence, the energy produced in the exhaust is greater due to the rise in the exhaust gas mass flow rate. The maximum temperature and mass flow rate are achieved at maximum engine speed (5200 rpm), which is 655.2 °C and 0.06301 kg/s, respectively.
4.2. ORC System Efficiency
The efficiency for the pump and expander is plotted against the engine speed and load to identify the optimum operating points for the pump and expander. The performance of the pump and expander is shown in Figure 19 and Figure 20, respectively. From the plot, the efficiencies of both devices vary with engine speed and the load, where the turbine shows a completely different pattern in its efficiency than the pump. Notice that the turbine is the most efficient in the lowest BSFC region at part load operation in which the maximum value achieved is around 75%. In comparison, the maximum efficiency of the pump is 71% which occurs at both maximum torque and maximum speed operating conditions. Pump efficiency increases at higher speed and torque due to the pressure rise in the pump to make sure that the working fluid-specific enthalpy is raised and flow can be achieved for heat transfer in the evaporator.
The net power output of the recovered exhaust heat energy from the ORC (Organic Rankine Cycle) is shown in Figure 21. The net power generated by the ORC system is measured by deducting the power generated by the turbine with power used by the pump:
The plot shows that the net power output of the ORC system increases when temperature and mass flow rate increase. At maximum engine power (P6) and maximum torque (P5) operating points, the maximum net power produced by ORC is 2.0174 kW and 1.36 kW, respectively. However, as can be seen in the plot, there is negative net power below 3000 rpm. This region is not suitable for ORC operation because power is being used by the ORC system, as indicated by the negative net power.
For a low-speed condition as denoted by P1 and P2 earlier, the value is negative because the pump power consumption is greater than the expander power output, even though the expander still generates an insignificant 5–15 W of power at these points. Practically, the pump power also influences the BSFC improvement because the net power is calculated from the difference between the pump and the turbine.
On the other hand, the turbine power output is negative at P3 which represents the lowest BSFC area in the map. Although the turbine is the most efficient at that point, evaporation of the working fluid from a liquid to vapor is incomplete due to the deficient energy in the exhaust gas of the engine. Adding a recuperator does not have much impact either, as very small power output difference is observed. The recuperator reduces the cooling load in the condenser and slightly increases the net power output of the system. This is shown in Figure 22.
As it can be seen in the plot, negative net power still occurs in Case 3, although a recuperator is added to the system. Consequently, the overall performance of the engine will be reduced if the ORC system is allowed to run in all engine operating conditions. To avoid this problem, smart control of the ORC WHR system should be built to assist with the control of the suitable engine operating condition for the ORC system so that power consumption from the ORC system is kept at a minimum.
The input heat in the heat exchanger is the product of the number of exhaust gas flow rates and the temperature of waste heat. Heat input is defined by the equation below, where Qin = Heat transfer rate into the system, ṁe = Exhaust Mass Flowrate, Cp = Specific Heat Capacity, and ∆T = Temperature difference between the heat source and working fluid at the evaporator inlet.
The thermal efficiency of the ORC cycle is calculated by using the equation:
From the equations of ORC thermal efficiency given, it is obvious that the ORC system efficiency also depends on mass flow rate and temperature since they define the amount of heat energy in exhaust gas to be transferred to R245fa in the evaporator. Therefore, the thermal efficiency of the ORC system is reliant on the supplied energy in the evaporator. As can be seen in Figure 23, the evaporator energy rate is greater at higher speeds and loads. The lowest BSFC point (P3), which is around 2000 RPM and 90 Nm, is the most unfavourable condition for ORC to be applied as the efficiency (Figure 24) is in the negative as a result of negative net power generated. At 2000 rpm with lower torque, the efficiency increases and is positive (0.5–1%) due to a slightly higher temperature range, although the mass flow rate is similar. Meanwhile, the ORC efficiency only changes to positive starting from 3000 rpm and above, with the maximum efficiency achieved at 5200 rpm, which is around 5.4%.
4.3. BSFC Reduction and Engine Thermal Efficiency
The engine power output, thermal efficiency improvement, and the BSFC reduction of the engine with the ORC system are analysed by the following formulas.
The engine power output with ORC can be explained with the equation below:
The BSFC reduction after ORC is applied to the engine is calculated by:
At very high speed operating points where the ORC efficiency is the highest, approximately 5–7 g/kWh decrease in BSFC is acquired, which is almost 3% reduction. Similar to ORC efficiency plot, BSFC reduction is also in the negative, below 3000 rpm. As plotted in Figure 25, the percentage reduction is in the negative at P3 where the BSFC is already in the lowest region. In contrast, only 1% of the BSFC percentage reduction is achieved at P4. These points represent the optimum working condition for the engine, so the work output produced is optimum, resulting in lower heat transferred into the ORC system.
The additional power that is recovered from the ORC system is now added to the engine model, resulting in a lower BSFC for the engine. However, if negative net power is obtained, the new BSFC will increase, therefore it was decided that the new BSFC is not to be applied to the engine model. Another approach that can be used is by using the percentage reduction of BSFC at various torque and speed, then superimposing it to the BSFC map available in GT-SUITE model. Since only important operating points are needed for vehicle simulation, some points are interpolated and averaged.
The objective of the ORC system as a WHR technology is the enhancement of the energy generated from the initial engine fuel consumption, which will define the fuel economy of the upgraded system. Thermal efficiency improvement of the engine is shown in Figure 26, defined as:
In Figure 27 at maximum engine speed (P6), the power is increased by 2.02 kW, with the initial power at 70.9kW. The increment of engine power output is approximately 1% of the initial model, as can be observed in Figure 26. At maximum torque of the engine operating point, which is denoted as P5, the engine thermal efficiency shows improvement with the ORC system, which is a 0.8% increase compared to the engine without ORC.
However, one main drawback of the ORC system built is the limitations of energy that could be recovered at low speed and optimum engine working conditions. Therefore, the practicability of the system should be a question if it is to be implemented on HEVs. Moreover, several energy losses have been neglected in the study, which is a further concern in terms of the feasibility of the system built.
4.4. Driving Cycle Fuel Consumption
The operation of the ORC system was tested based on the driving cycles chosen. The driving cycle profiles for NEDC and WLTC are shown in Figure 28 and Figure 29, respectively.
Compared to conventional gasoline engine vehicles, HEVs consist of different hybrid modes and an electric powertrain that can assist in more reduction of vehicle fuel consumption. The drive cycle profile in the vehicle simulation provided an insight on how and when the ORC system should be improved to further optimize the system for HEVs. Figure 30 and Figure 31 show the state of charge (SOC) of the battery in the NEDC and WLTC test, correspondingly.
In the NEDC case, the vehicle speed stays within 0–50 km/h for almost 800 s, which is the most time used in the testing duration. Since the NEDC test is more towards slow speed and low load, the effect of the ORC system applied is less obvious. Moreover, the ORC system built is also not efficient in the optimum region of engine operation, thus the fuel economy is not improved much.
On the other hand, the duration of WLTC is longer and the test on high vehicle speed is extended. Furthermore, a more dynamic speed profile is observed in the WLTC test. As a result, the battery SOC is also fluctuating further to assist the vehicle operation in hybrid mode, as shown in Figure 31. With the length duration of higher engine speed in the WLTC test, the ORC system benefits are maximized due to the 5–7 g/kWh of BSFC reduction achieved in those regions.
Practically, the engine cannot always work in its most effective region because the speed and produced torque by ICE in a driving cycle is influenced by the road load and this is determined by the operating points concentration on the torque-speed map. Nevertheless, HEV is more efficient compared to ICEV because its engine manages to run close to its maximum efficiency in a driving cycle, which makes the ORC system less attractive for WHR in the engine’s optimum region unless the efficiency of ORC system is improved to a higher level. Moreover, HEVs are effective in city driving due to lots of braking needed, plus idling conditions where the engine is turned off.
Comparison of fuel consumption with and without the ORC in NEDC and WLTP is shown in Figure 32. As can be observed from the figure, the NEDC test shows higher miles per gallon of fuel consumption compared to the WLTC test. In both driving cycles, the fuel consumption is reduced, resulting in higher miles per gallon when the ORC system is implemented and a reduced BSFC value is applied to the engine. For NEDC, the initial fuel consumption is 51.6 mpg, whereas for WLTC the initial consumption is 48.2 mpg. With the ORC, the miles per gallon increased to 52.1 mpg and 48.8 mpg, which is reflected by 1% and 1.2% fuel economy improvement for NEDC and WLTP, respectively. That is around 0.5 mpg savings in fuel consumption for both drive cycles.
The fact that mostly slow speed and low load conditions were tested in the NEDC cycle does constrain the ORC benefit. Consequently, the performance of the ORC system is very limited in city driving as the low-speed condition is dominant. The result should be more obvious if the exhaust temperature and mass flow rate is high at the high load and speed condition where the ORC is the most efficient. Further control optimisation including recently promoted machine-learning techniques may also be successfully implemented to extract further waste heat [46].
5. Conclusions
In this study, a MATLAB/Simulink model for vehicle simulation control and vehicle dynamics was created alongside an ORC model that was implemented into the powertrain of the hybrid vehicle in the GT SUITE environment. The model shows some improvement in terms of engine power and fuel consumption.
It was revealed that an optimized design of ORC that is finely controlled for HEV operation is necessary in order to operate in a wide range of engine operations. This is because in real driving conditions, as tested in the driving cycle simulations, the engine rarely works in the high-speed region, where the ORC produces high work output. In a real test, the engine of a HEVs normally works at its optimum operation, which reduces the net benefit of usage of the ORC. If both criteria are measured for HEVs, the ORC benefits are relatively limited.
It was found that the maximum cycle achieved from the ORC system was 5.4% with 2.02 kW of delivered power recovered from the waste heat available. This led to 1.0% and 1.2% of fuel economy improvement in NEDC and WLTP driving cycle tests, respectively.
From the study, there is more room for improvement of ORC that can be targeted regarding its efficiency and design selections in terms of an unconstrained parametric study being applied and improvements in the corresponding calibration in the combined hybrid-ORC powertrain environment.
Author Contributions
Conceptualization, A.P. and W.R.B.W.R.; methodology, A.P., F.A. and W.R.B.W.R.; software, A.P.; validation, D.G.; formal analysis and investigation, D.G.; resources, A.P.; data curation, W.R.B.W.R.; writing—original draft preparation, D.G.; writing—review and editing, W.R.B.W.R. and F.A.; supervision, A.P.; project administration, A.P. All authors have read and agreed to the published version of the manuscript.
Funding
This research received no external funding.
Conflicts of Interest
The authors declare no conflict of interest.
Nomenclature
| ∆T | Temperature difference |
| BSFC | Brake Specific Fuel Consumption |
| CO2 | Carbon Dioxide |
| Cp | Specific Heat Capacity |
| EGR | Exhaust Gas Recirculation |
| EV | Electric Vehicle |
| EWHR | Exhaust Waste Heat Recovery |
| FCEV | Fuel Cell Electric Vehicle |
| FCRP | Fuel Consumption Reduction Potential |
| FTP72 | Federal Test Procedure |
| GDI | Gasoline Direct Injection |
| GWP | Global Warming Potential |
| h | Enthalpy |
| HEV | Hybrid Electric Vehicle |
| HWFET | The Highway Fuel Economy Test |
| ICE | Internal Combustion Engine |
| IORC | Internal Heat Exchanger Organic Rankine Cycle |
| Is | Isentropic |
| ṁ | Mass Flow Rate |
| mpg | Miles Per Gallon |
| NEDC | New European Driving Cycle |
| ORC | Organic Rankine Cycle |
| Q | Heat |
| RC | Rankine Cycle |
| RPM | Revolution Per Minute |
| SI | Spark Ignition |
| SOC | State of Charge |
| T/C | Turbocompounding |
| T-S | Temperature-Entropy |
| W | Work |
| WHR | Waste Heat Recovery |
| WLTC | Worldwide Harmonized Light Vehicle Test Cycles |
| WLTP | Worldwide Harmonised Light Vehicle Test Procedure |
References
- Anenberg, S.; Miller, J.; Henze, D.; Minjares, R. Health Impacts of Air Pollution from Transportation Sources in London; The International Council on Clean Transportation: Beijing, China, 2019. [Google Scholar]
- Wang, T.; Lin, B. Fuel consumption in road transport: A comparative study of China and OECD countries. J. Clean. Prod. 2019, 206, 156–170. [Google Scholar] [CrossRef]
- Ruhnau, O.; Bannik, S.; Otten, S.; Praktiknjo, A.; Robinius, M. Direct or indirect electrification? A review of heat generation and road transport decarbonisation scenarios for Germany 2050. Energy 2019, 166, 989–999. [Google Scholar] [CrossRef] [Green Version]
- Li, Y.; Chang, Y. Road transport electrification and energy security in the Association of Southeast Asian Nations: Quantitative analysis and policy implications. Energy Policy 2019, 129, 805–815. [Google Scholar] [CrossRef]
- Kalghatgi, G. Development of Fuel/Engine Systems—The Way Forward to Sustainable Transport. Engineering 2019, 5, 510–518. [Google Scholar] [CrossRef]
- Ahmadi, P. Environmental impacts and behavioral drivers of deep decarbonization for transportation through electric vehicles. J. Clean. Prod. 2019, 225, 1209–1219. [Google Scholar] [CrossRef]
- E.E.A. Electric Vehicles from Life Cycle and Circular Economy Perspectives; Publications Office of the European Union: Luxembourg, 2018. [Google Scholar]
- Huang, Y.; Surawski, N.C.; Organ, B.; Zhou, J.L.; Tang, O.H.; Chan, E.F. Fuel consumption and emissions performance under real driving: Comparison between hybrid and conventional vehicles. Sci. Total Environ. 2019, 659, 275–282. [Google Scholar] [CrossRef]
- McMeekin, A.; Geels, F.W.; Hodson, M. Mapping the winds of whole system reconfiguration: Analysing low-carbon transformations across production, distribution and consumption in the UK electricity system (1990–2016). Res. Policy 2019, 48, 1216–1231. [Google Scholar] [CrossRef]
- Orecchini, F.; Santiangeli, A.; Zuccari, F.; Ortenzi, F.; Genovese, A.; Spazzafumo, G.; Nardone, L. Energy consumption of a last generation full hybrid vehicle compared with a conventional vehicle in real drive conditions. Energy Procedia 2018, 148, 289–296. [Google Scholar] [CrossRef]
- IEA. Fuel Economy in Major Car Markets: Technology and Policy Drivers 2005–2017; International Energy Agency: London, UK, 2019. [Google Scholar]
- Xu, Z.Y.; Wang, R.Z.; Yang, C. Perspectives for low-temperature waste heat recovery. Energy 2019, 176, 1037–1043. [Google Scholar] [CrossRef]
- Mahmoudi, A.; Fazli, M.; Morad, M.R. A recent review of waste heat recovery by Organic Rankine Cycle. Appl. Therm. Eng. 2018, 143, 660–675. [Google Scholar] [CrossRef]
- Agathokleous, R.; Bianchi, G.; Panayiotou, G.; Aresti, L.; Argyrou, M.C.; Georgiou, G.S.; Tassou, S.A.; Jouhara, H.; Kalogirou, S.A.; Florides, G.A.; et al. Waste Heat Recovery in the EU industry and proposed new technologies. Energy Procedia 2019, 161, 489–496. [Google Scholar] [CrossRef]
- Firth, A.; Zhang, B.; Yang, A. Quantification of global waste heat and its environmental effects. Appl. Energy 2019, 235, 1314–1334. [Google Scholar] [CrossRef]
- Yu, W.; Wang, R.; Zhou, R. A Comparative Research on the Energy Recovery Potential of Different Vehicle Energy Regeneration Technologies. Energy Procedia 2019, 158, 2543–2548. [Google Scholar] [CrossRef]
- Villani, M.; Tribioli, L. Comparison of different layouts for the integration of an organic Rankine cycle unit in electrified powertrains of heavy duty Diesel trucks. Energy Convers. Manag. 2019, 187, 248–261. [Google Scholar] [CrossRef]
- Andwari, A.M.; Pesiridis, A.; Karvountzis-Kontakiotis, A.; Esfahanian, V. Hybrid Electric Vehicle Performance with Organic Rankine Cycle Waste Heat Recovery System. Appl. Sci. 2017, 7, 437. [Google Scholar] [CrossRef] [Green Version]
- Upendra, K.; Grauers, A. Synergy and Conflicts between Waste Heat Recovery System and Hybrid Electric Vehicle; Chalmers University of Technology: Gothenburg, Sweden, 2015. [Google Scholar]
- Tong, L.; Enhua, W.; Fanxiao, M.; Xu, Z. Dynamic Simulation of an ICE-ORC Combined System Under Various Working Conditions. IFAC-PapersOnLine 2018, 51, 29–34. [Google Scholar] [CrossRef]
- Zhao, R.; Zhang, H.; Song, S.; Tian, Y.; Yang, Y.; Liu, Y. Integrated simulation and control strategy of the diesel engine–organic Rankine cycle (ORC) combined system. Energy Convers. Manag. 2018, 156, 639–654. [Google Scholar] [CrossRef]
- Alshammari, F.; Pesyridis, A. Experimental Study of Organic Rankine Cycle System and Expander Performance for Heavy-Duty Diesel Engine. Energy Convers. Manag. 2019, 199, 1–12. [Google Scholar] [CrossRef]
- Liu, P.; Shu, G.; Tian, H. How to approach optimal practical Organic Rankine cycle (OP-ORC) by configuration modification for diesel engine waste heat recovery. Energy 2019, 174, 543–552. [Google Scholar] [CrossRef]
- Pethurajan, V.; Sivan, S.; Joy, G.C. Issues, comparisons, turbine selections and applications–An overview in organic Rankine cycle. Energy Convers. Manag. 2018, 166, 474–488. [Google Scholar] [CrossRef]
- Obieglo, A.; Ringler, J.; Seifert, M.; Hall, W. Future Efficient Dynamicswith Heat Recovery; U.S. Department of Energy: Washington, DC, USA, 2009. [Google Scholar]
- Jouhara, H.; Khordehgah, N.; Almahmoud, S.; Delpech, B.; Chauhan, A.; Tassou, S.A. Waste heat recovery technologies and applications. Therm. Sci. Eng. Prog. 2018, 6, 268–289. [Google Scholar] [CrossRef]
- Rajoo, S.; Romagnoli, A.; Martinez-Botas, R.; Pesyridis, A.; Copeland, C.; Mamat, A.M.I. Automotive Exhaust Power and Waste Heat Recovery Technologies. In Automotive Exhaust Emissions and Energy Recovery; NOVA Science Publishers, Hauppage: New York, NY, USA, 2014; ISBN 978-1-63321-493-4. [Google Scholar]
- BorgWarner, Exhaust Gas Management. Available online: https://www.borgwarner.com/technologies/exhaust-gas-management (accessed on 16 January 2019).
- Latz, G. Waste Heat Recovery from Combustion Engines based on the Rankine Cycle; Chalmers University of Technology Göteborg: Gothenburg, Sweden, 2016. [Google Scholar]
- Karvountzis-Kontakiotis, A.; Pesiridis, A.; Zhao, H.; Alshammari, F.; Franchetti, B.; Pesmazoglou, I.; Tocci, L. Effect of an ORC Waste Heat Recovery System on Diesel Engine Fuel Economy for Off-Highway Vehicles; SAE Technical Papers: Warrendale, PA, USA, 2017; p. 0136. [Google Scholar] [CrossRef]
- Leveque, G.; Holaind, N.; Mintsa, A.C.; Smague, P.; Pagnier, P.; Henry, G.; Leduc, P.; Leroux, A. ORC Turbo-Pump for Waste Heat Recovery in the Coolant of Automotive Engines, Design and Performance Evaluation; EORCC: Lyon, France, 2018. [Google Scholar]
- Karvountzis-Kontakiotis, A.; Alshammari, F.; Pesiridis, A.; Franchetti, B.; Pesmazoglou, I.; Tocci, L. Variable Geometry Turbine Design for Off-Highway Vehicle Organic Rankine Cycle Waste Heat Recovery. In Proceedings of the THIESEL, Valencia, Spain, 16 September 2016. [Google Scholar]
- Alshammari, F.; Karvountzis-Kontakiotis, A.; Pesiridis, A. Radial Turbine Expander Design for Organic Rankine Cycle, Waste Heat Recovery in High Efficiency, Off-Highway Vehicles. In Proceedings of the SAGE Publications, 3rd Biennial International Conference on Powertrain Modelling and Control, Loughborough, UK, 7–9 September 2016. [Google Scholar]
- Eastop, T.D.; McConkey, A. Applied Thermodynamics for Engineering Technologists, 5th ed.; Pearson Education: London, UK, 1993. [Google Scholar]
- Garcia, S.I.; Garcia, R.F.; Carril, J.C.; Garcia, D.I. A review of thermodynamic cycles used in low temperature recovery systems over the last two years. Renew. Sustain. Energy Rev. 2018, 81, 760–767. [Google Scholar] [CrossRef]
- Xu, B.; Rathod, D.; Yebi, A.; Filipi, Z.; Onori, S.; Hoffman, M. A comprehensive review of organic rankine cycle waste heat recovery systems in heavy-duty diesel engine applications. Renew. Sustain. Energy Rev. 2018, 107, 145–170. [Google Scholar] [CrossRef]
- Capano, G. Waste Heat Recovery Systems for Fuel Economy. Master’s Thesis, University of Windsor, Windsor, ON, Canada, 2014; p. 5015. [Google Scholar]
- Holik, M.; Živić, M.; Virag, Z.; Barac, A. Optimization of an organic Rankine cycle constrained by the application of compact heat exchangers. Energy Convers. Manag. 2019, 188, 333–345. [Google Scholar] [CrossRef]
- Wei, F.; Senchuang, G.; Zhonghe, H. Economic analysis of Organic Rankine Cycle (ORC) and Organic Rankine Cycle with internal heat exchanger (IORC) based on industrial waste heat source constraint. Energy Procedia 2019, 158, 2403–2408. [Google Scholar] [CrossRef]
- Xi, H.; Li, M.J.; Zhang, H.H.; He, Y.L. Experimental studies of organic Rankine cycle systems using scroll expanders with different suction volumes. J. Clean. Prod. 2019, 218, 241–249. [Google Scholar] [CrossRef]
- SRashwan, S.S.; Dincer, I.; Mohany, A. Analysis and assessment of cascaded closed loop type organic Rankine cycle. Energy Convers. Manag. 2019, 184, 416–426. [Google Scholar] [CrossRef]
- Sun, Q.; Wang, Y.; Cheng, Z.; Wang, J.; Zhao, P.; Dai, Y. Thermodynamic and economic optimization of a double-pressure organic Rankine cycle driven by low-temperature heat source. Renew. Energy 2020, 147, 2822–2832. [Google Scholar] [CrossRef]
- Yu, X.; Li, Z.; Lu, Y.; Huang, R.; Roskilly, A.P. Investigation of organic Rankine cycle integrated with double latent thermal energy storage for engine waste heat recovery. Energy 2019, 170, 1098–1112. [Google Scholar] [CrossRef] [Green Version]
- Kawamoto, H.; Naiki, K.; Kawai, T.; Shikida, T.; Tomatsuri, M. Development of New 1.8-Liter Engine for Hybrid Vehicles; SAE Technical Paper 2009-01-1061; SAE World Congress Exhibition: Beijing, China, 2009. [Google Scholar]
- Sun, H.; Qin, J.; Hung, T.C.; Huang, H.; Yan, P.; Lin, C.H. Effect of flow losses in heat exchangers on the performance of organic Rankine cycle. Energy 2019, 172, 391–400. [Google Scholar] [CrossRef]
- Palagi, L.; Pesyridis, A.; Sciubba, E.; Tocci, L. Machine Learning for the prediction of the dynamic behavior of a small scale ORC system. Energy 2018, 166, 72–82. [Google Scholar] [CrossRef]
Figure 1.
Market Share of New Electric Vehicles in Europe [7].
Figure 1.
Market Share of New Electric Vehicles in Europe [7].
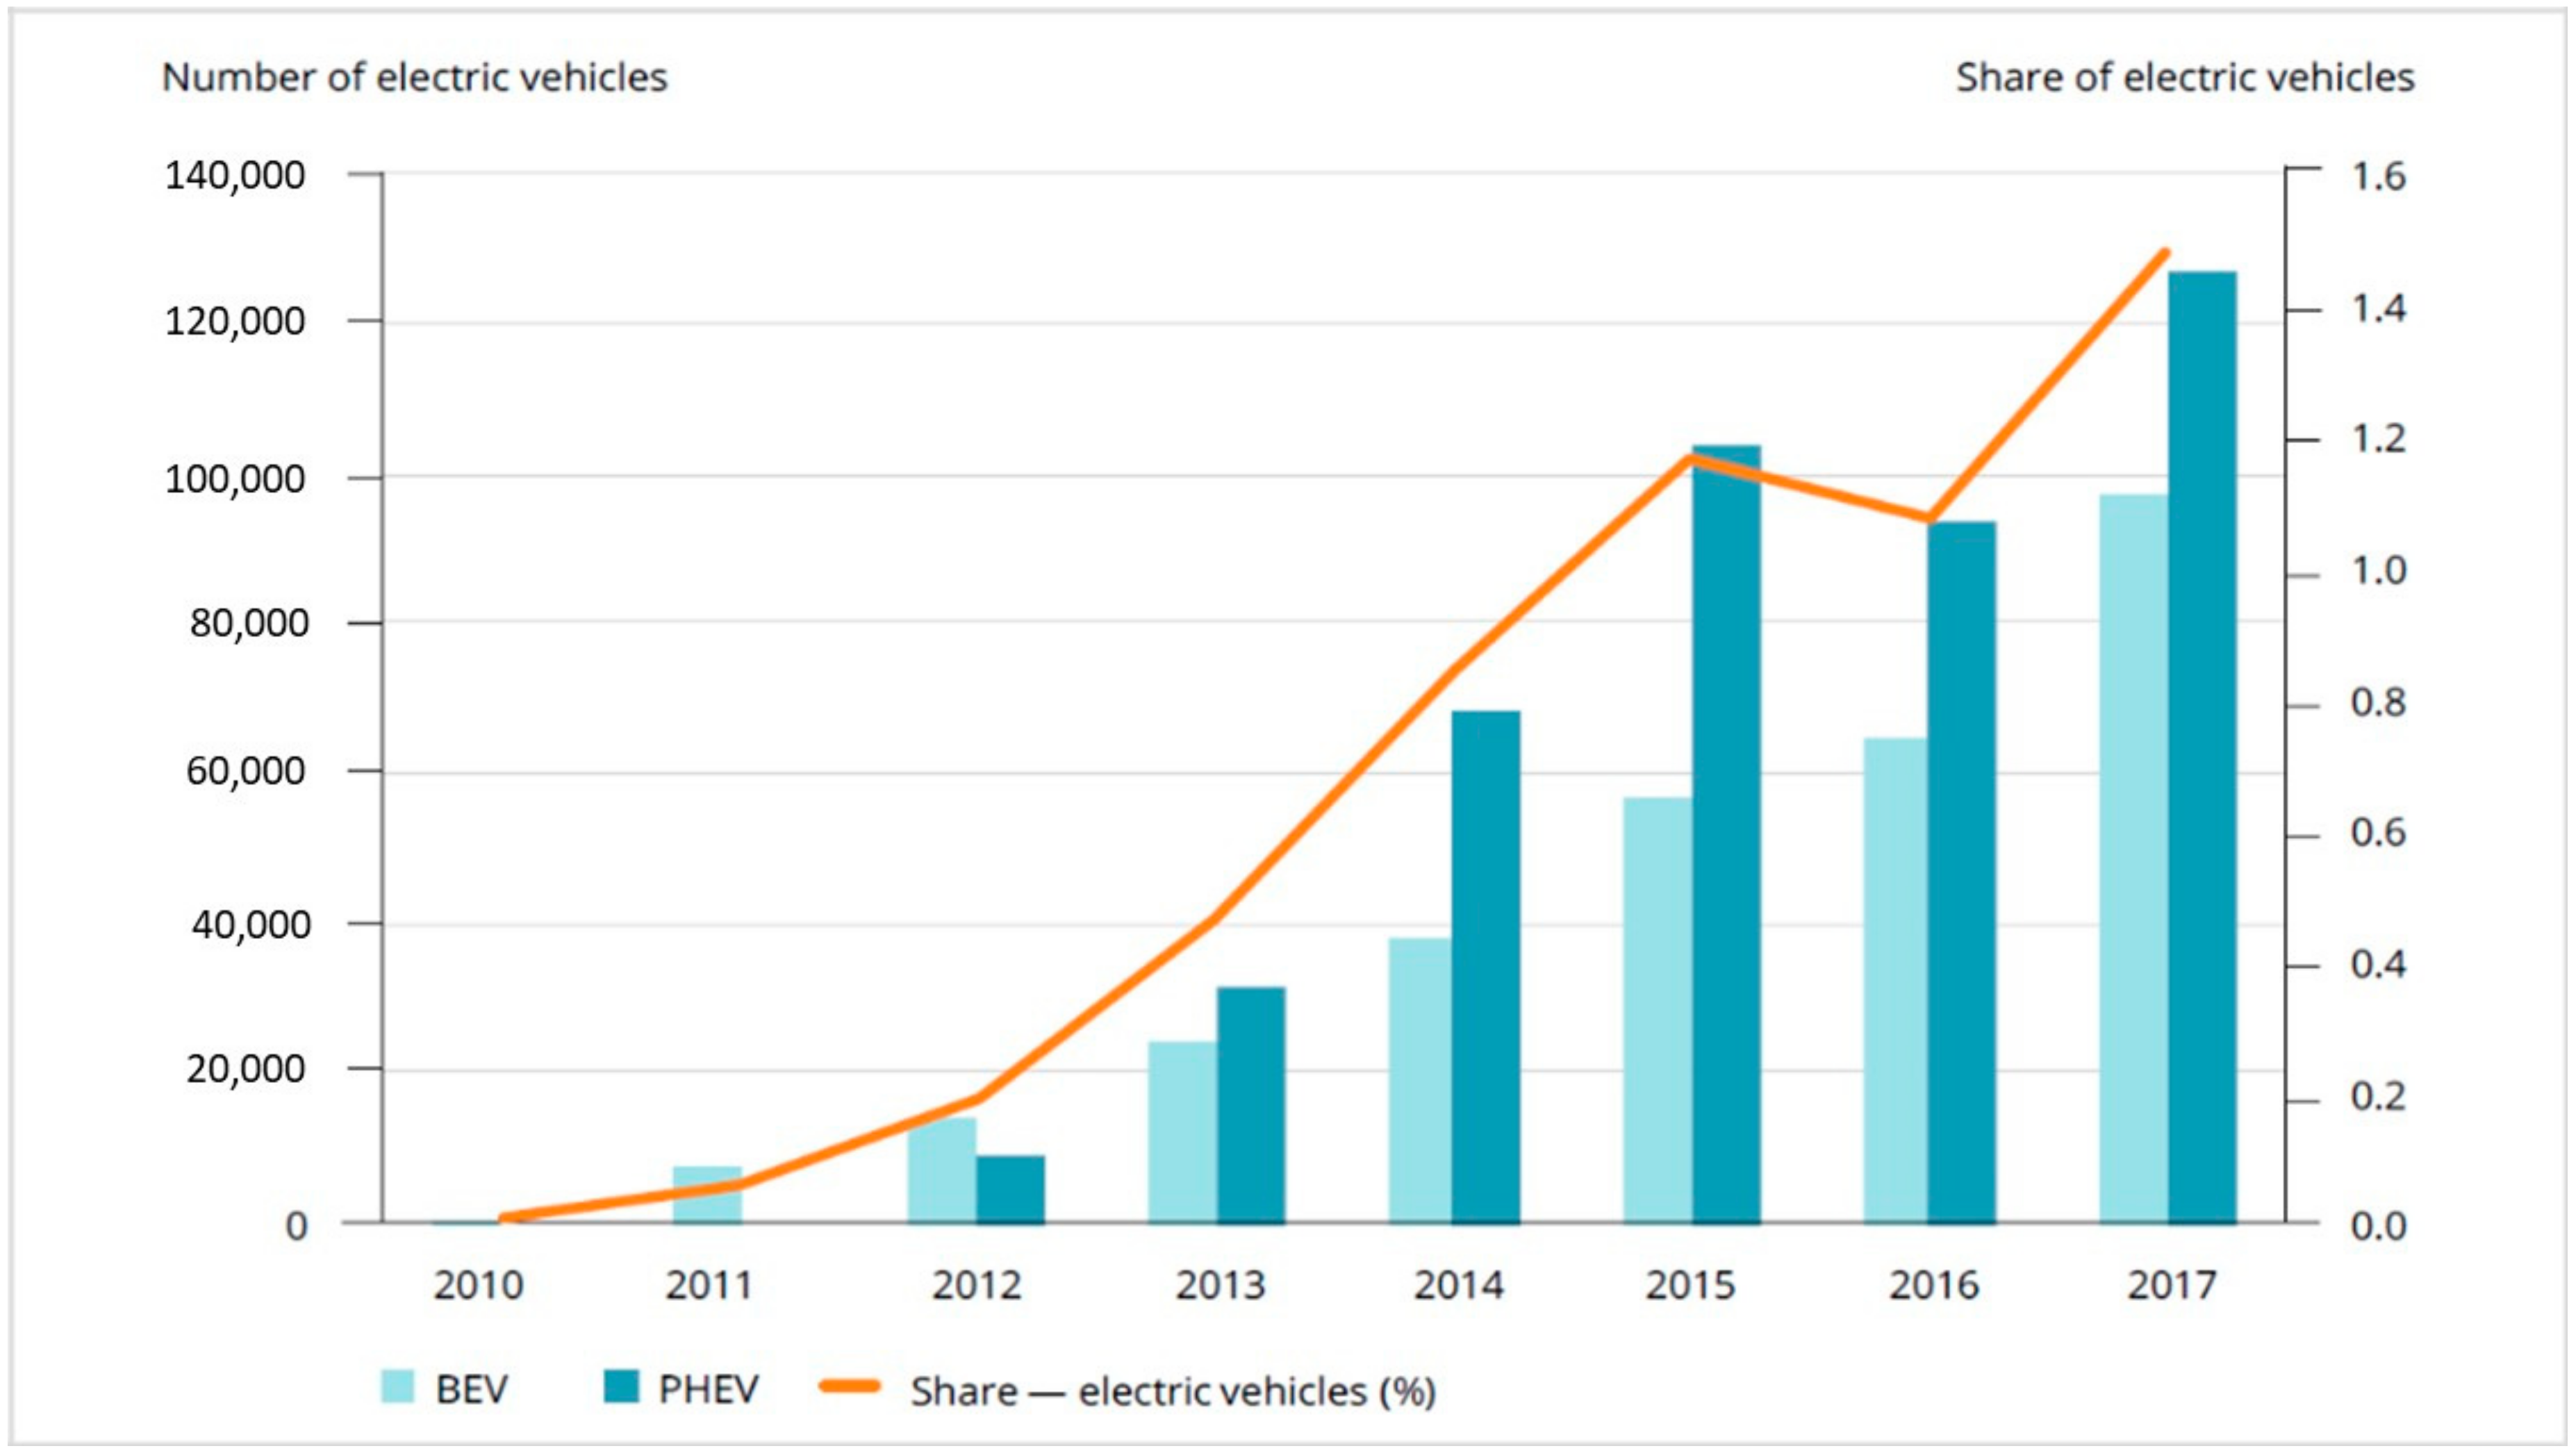
Figure 2.
Contribution to the Fuel Consumption Savings from Electrified Vehicles in 2017 [11].
Figure 2.
Contribution to the Fuel Consumption Savings from Electrified Vehicles in 2017 [11].
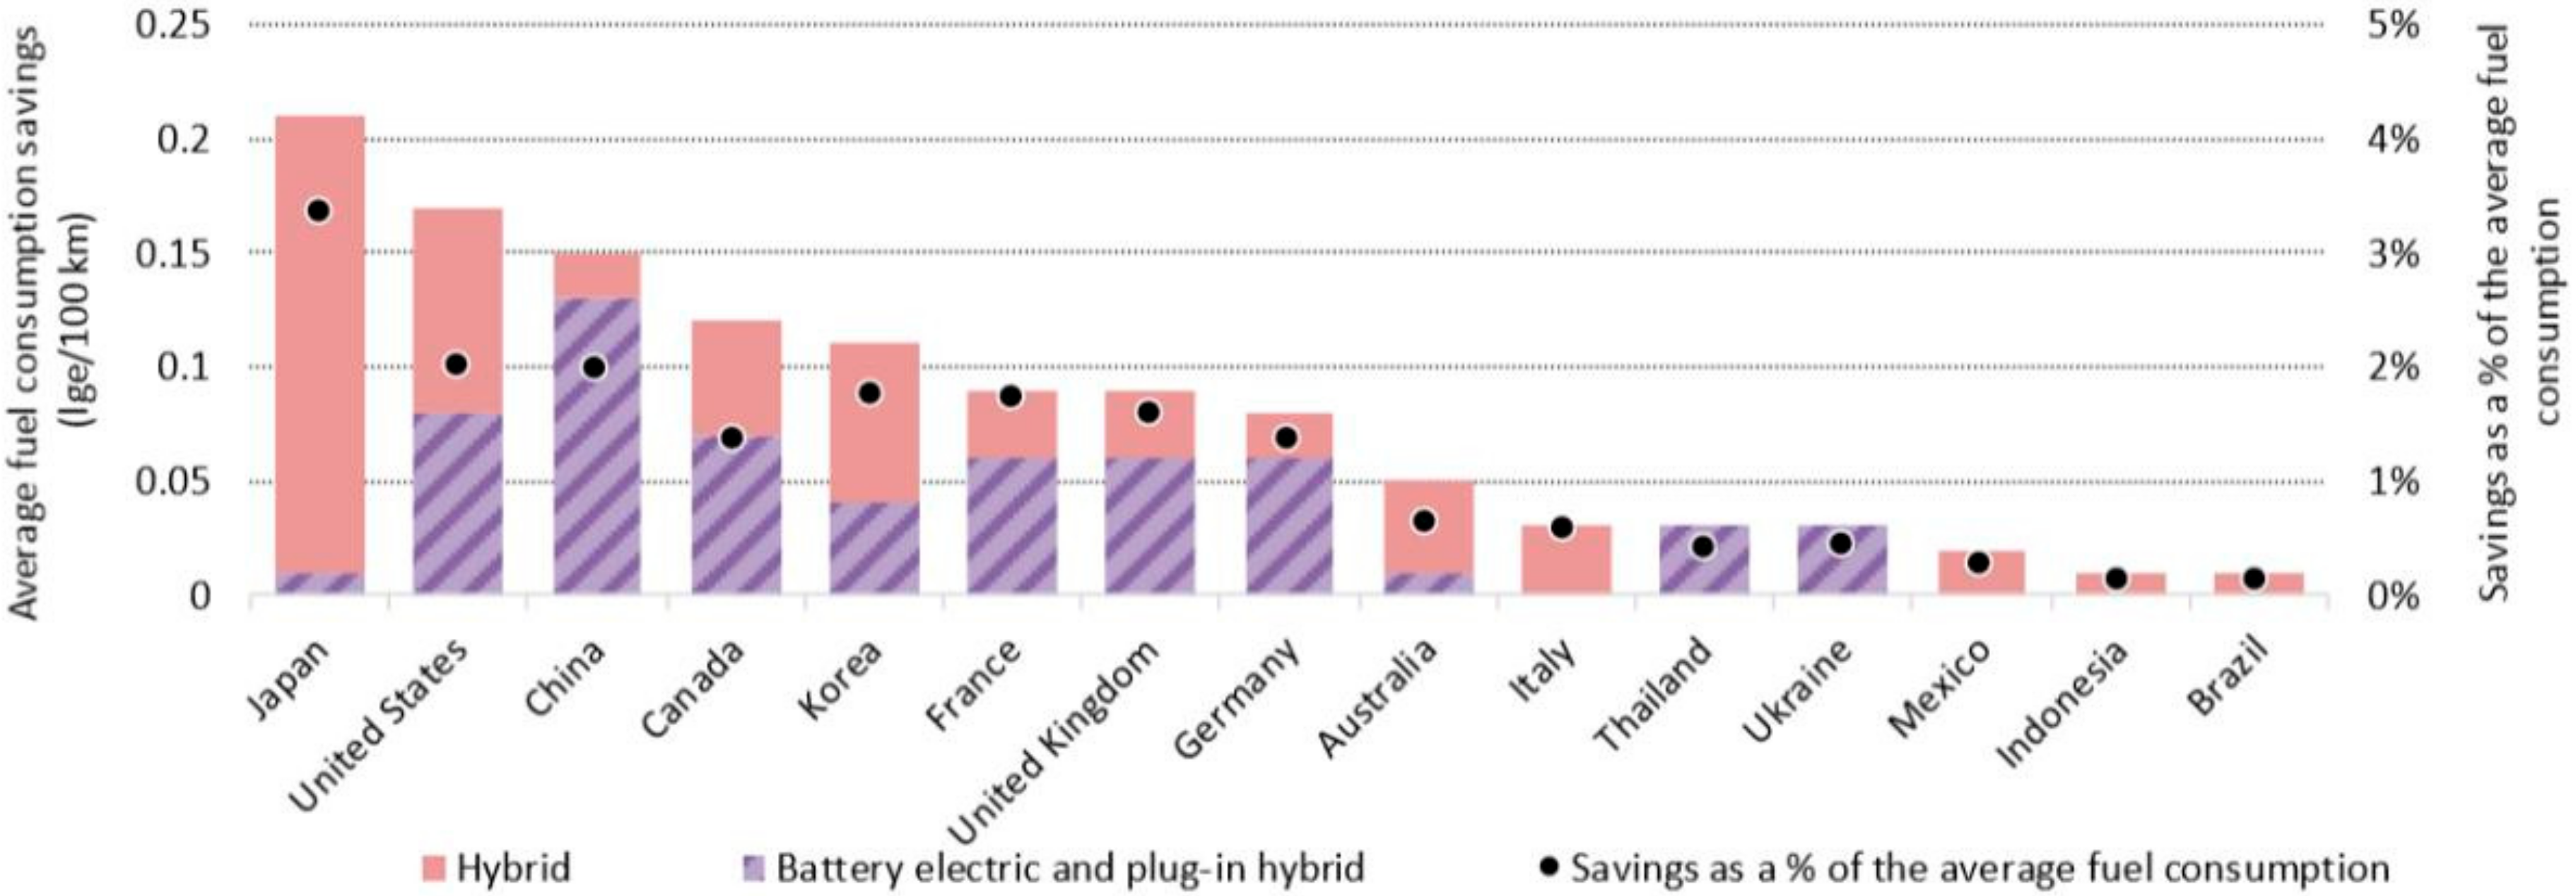
Figure 3.
Energy Efficiency in Vehicles [25].
Figure 3.
Energy Efficiency in Vehicles [25].
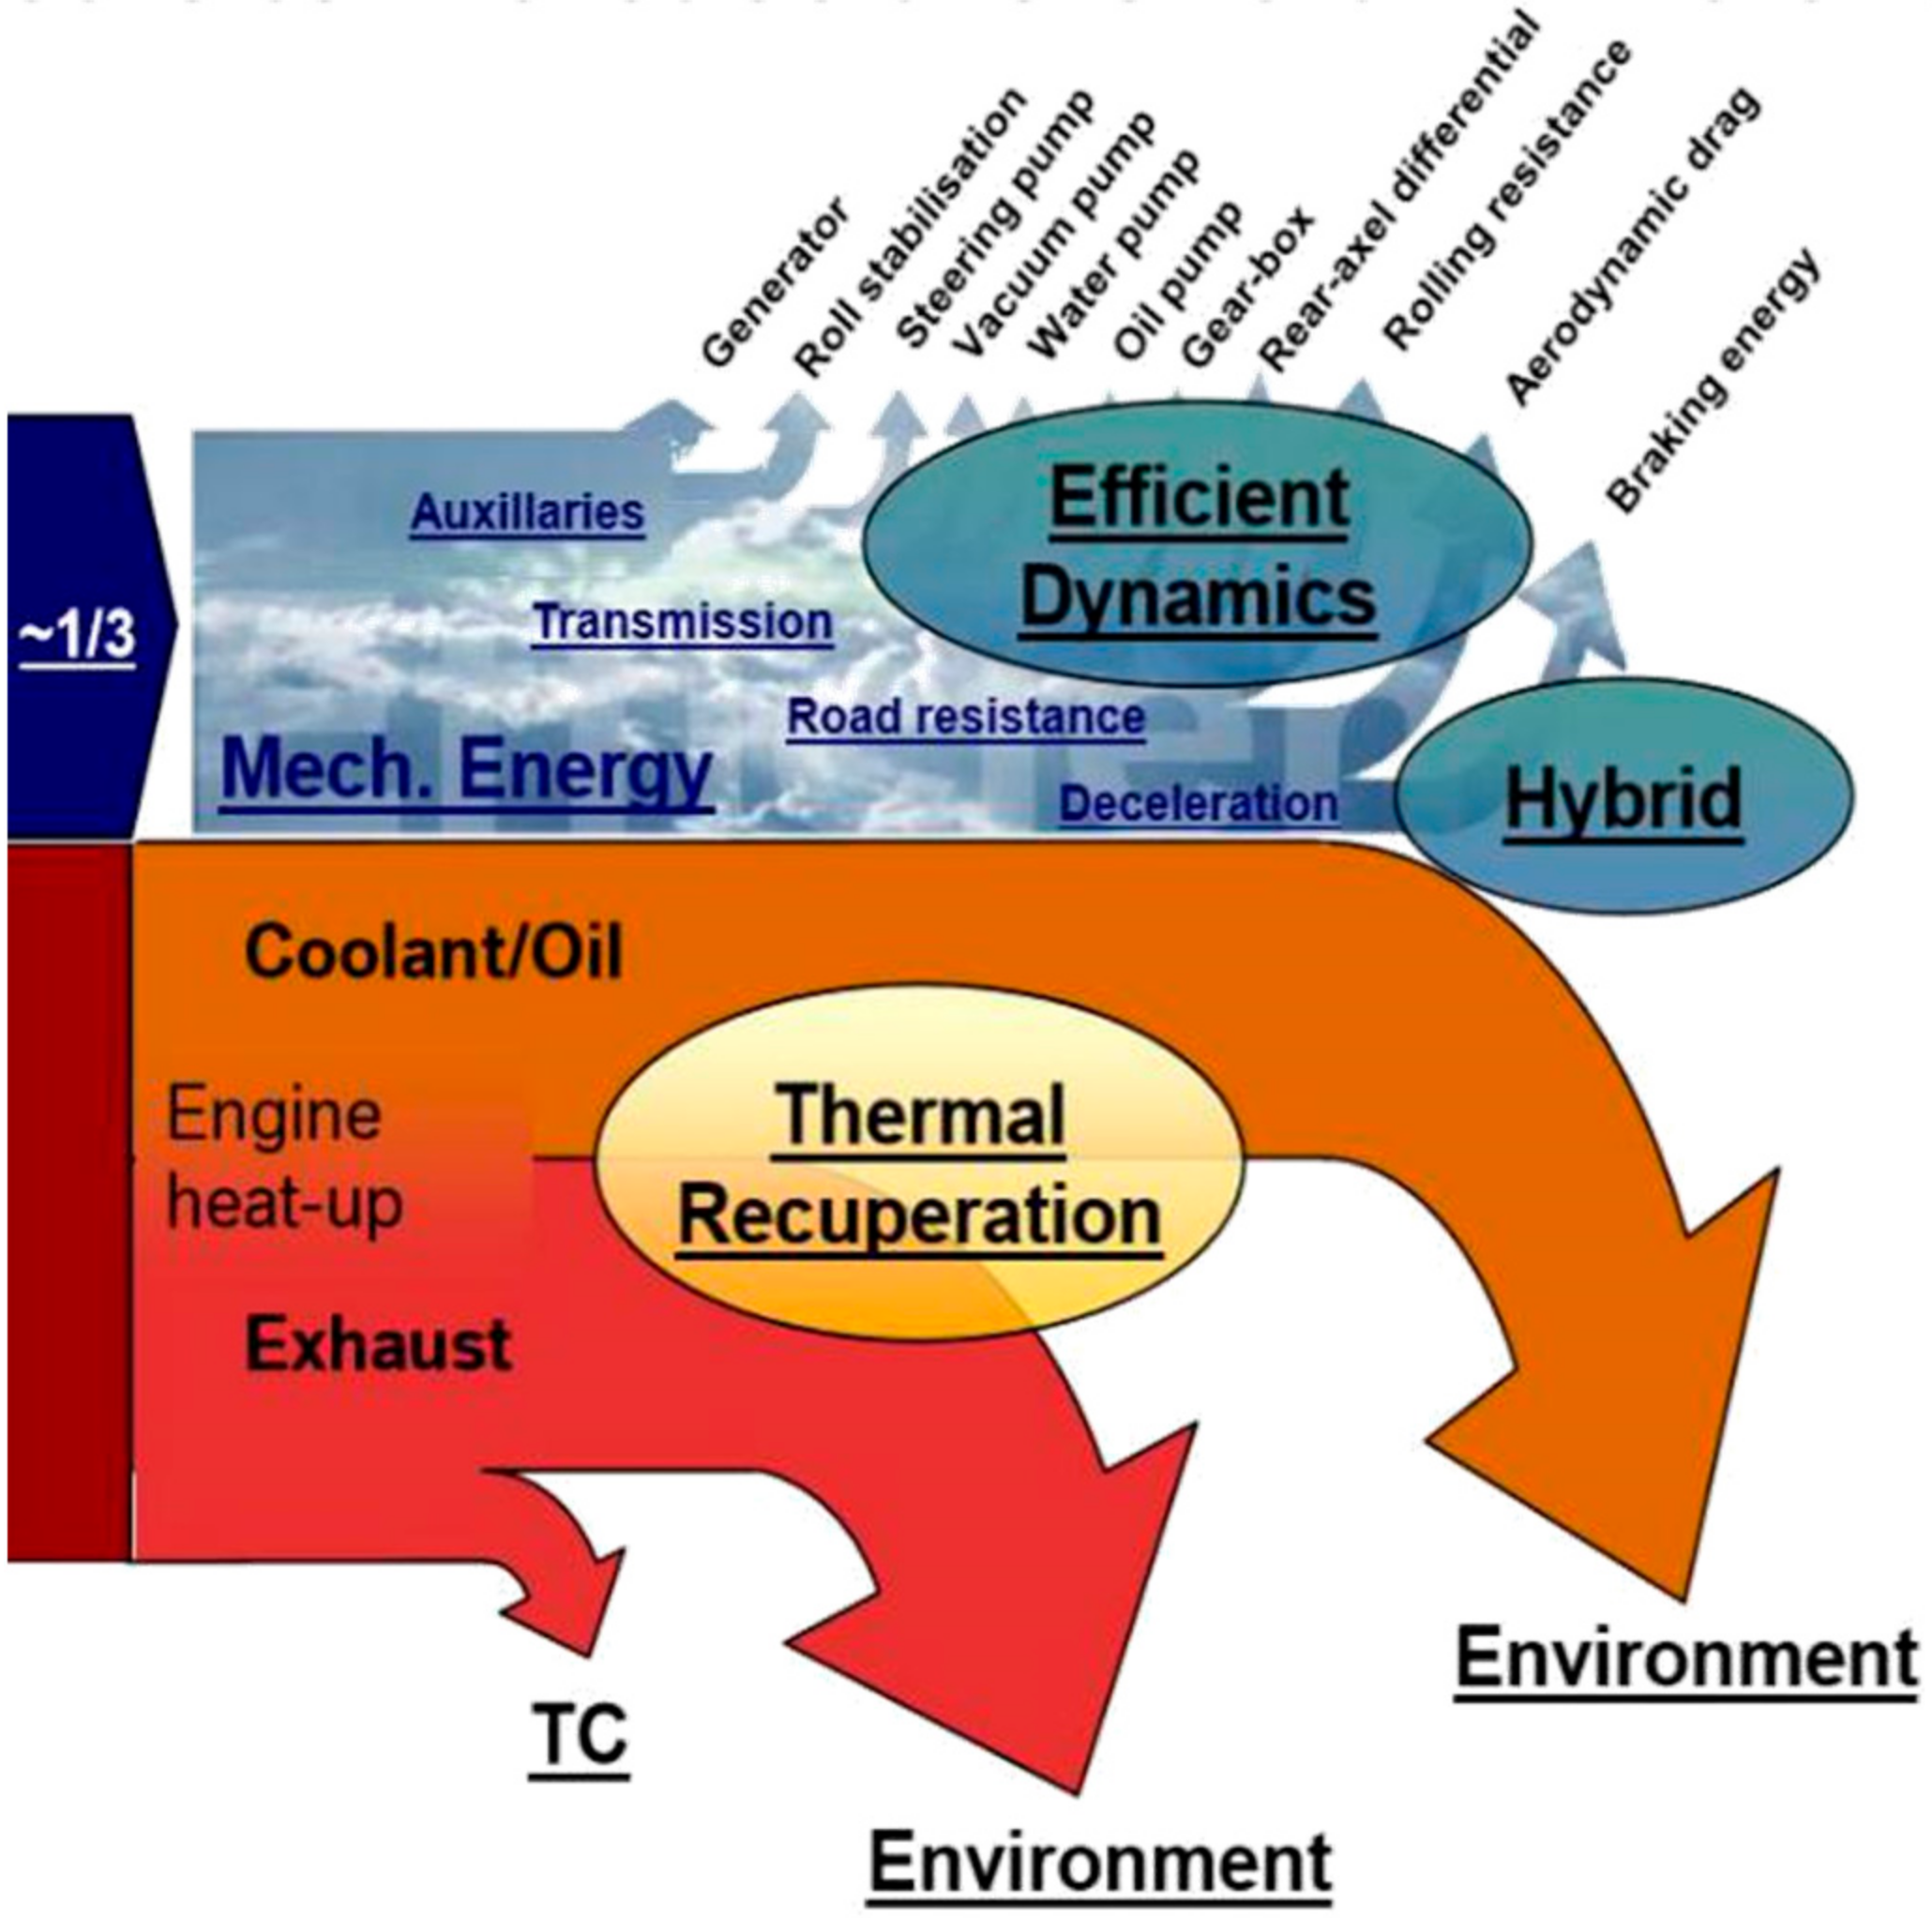
Figure 4.
Exhaust Waste Heat Recovery (EWHR) Unit.

Figure 5.
Energy Balance for the 2.0-L Turbocharged Gasoline Engine.

Figure 6.
Energy (a) and Exergy (b) Distributions of a Turbocharged direct injection gasoline (GDI) Engine.
Figure 6.
Energy (a) and Exergy (b) Distributions of a Turbocharged direct injection gasoline (GDI) Engine.
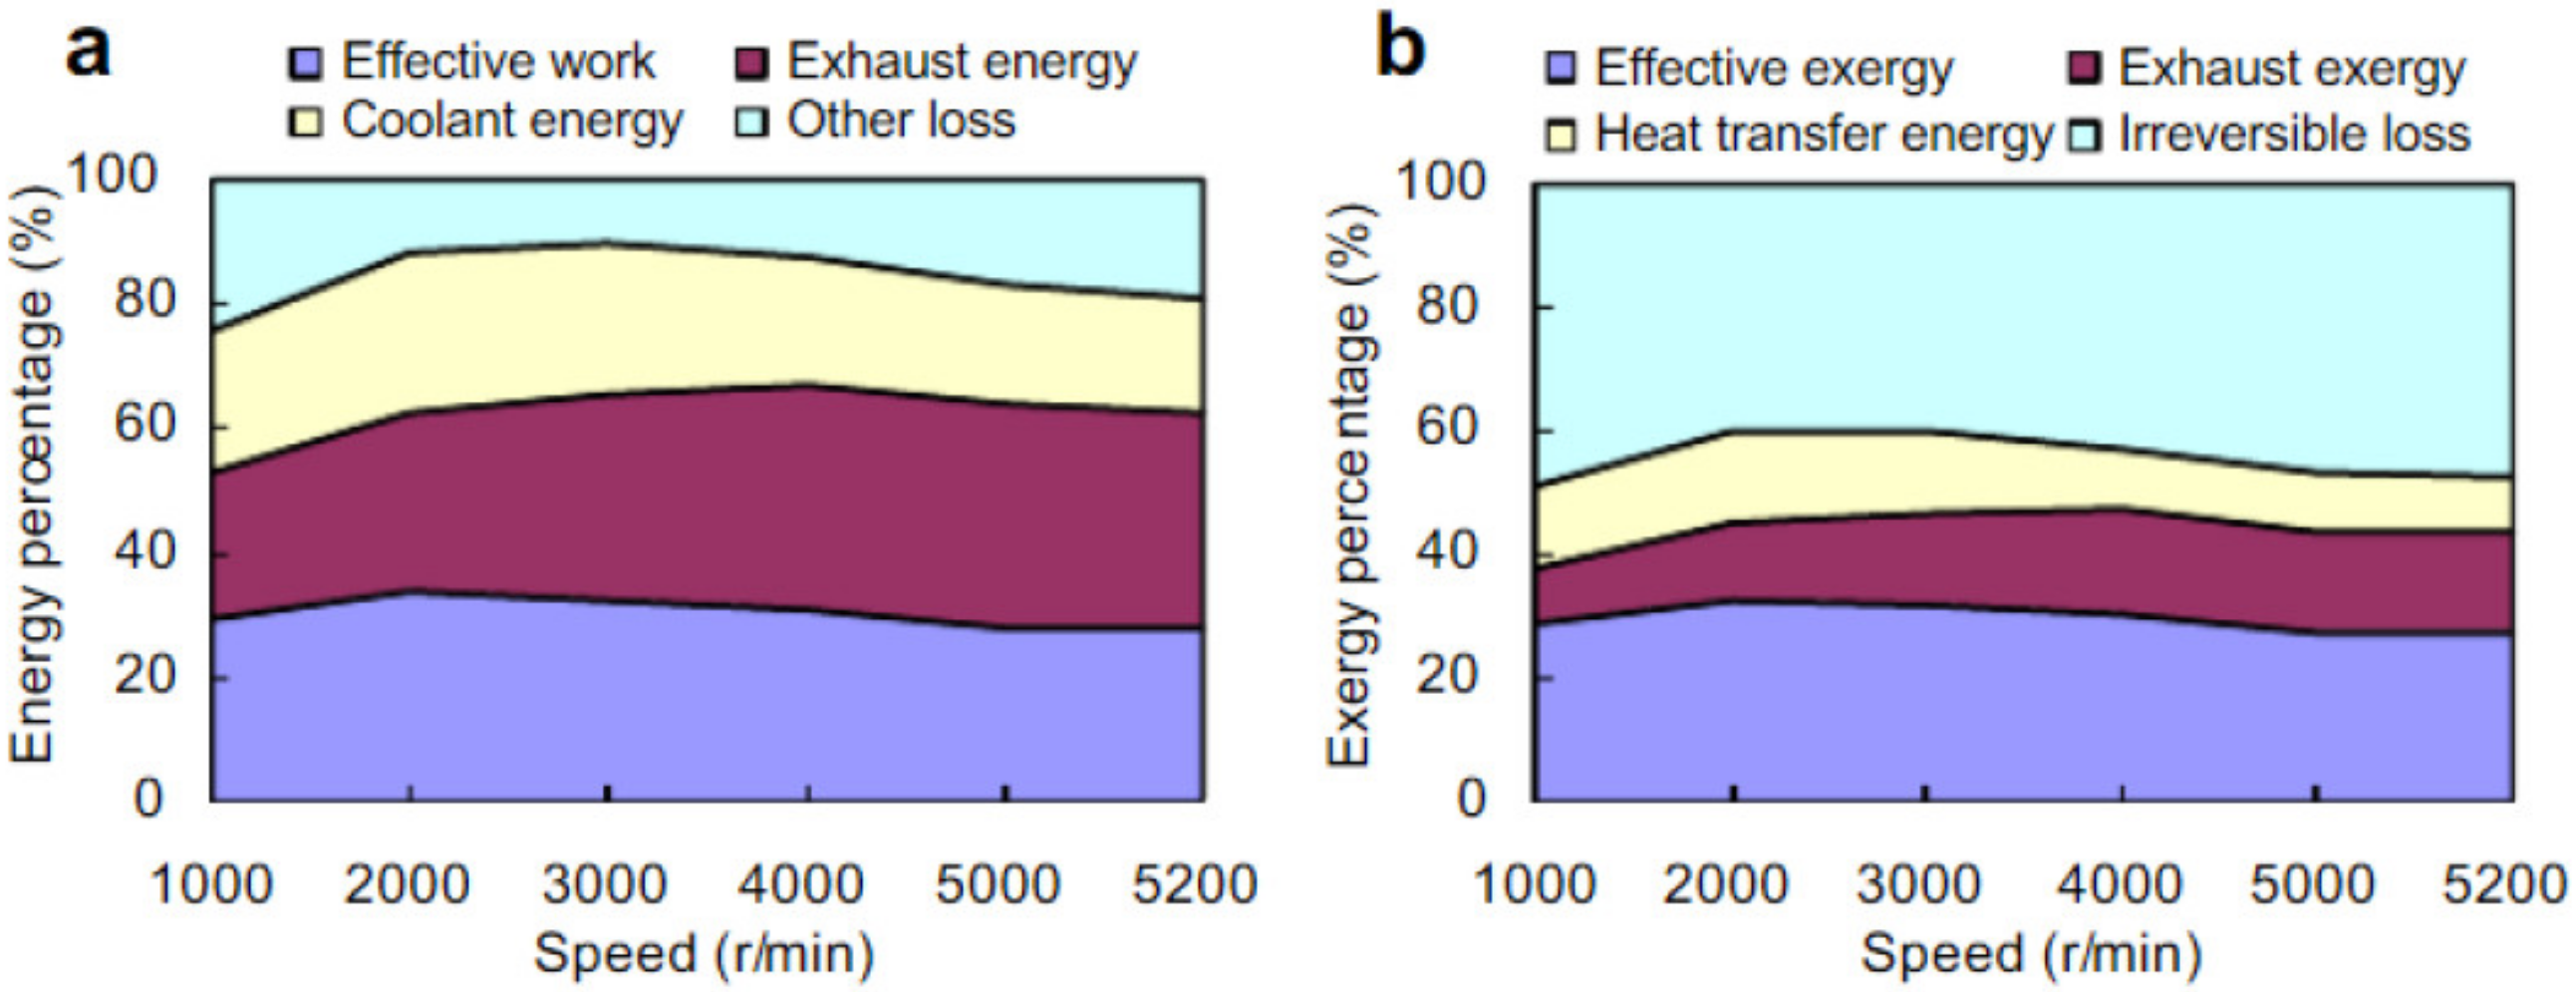
Figure 7.
Rankine Cycles System and the T-S Diagram of the Processes [33].
Figure 7.
Rankine Cycles System and the T-S Diagram of the Processes [33].

Figure 8.
Basic Organic Rankine Cycle (ORC) System Layout.
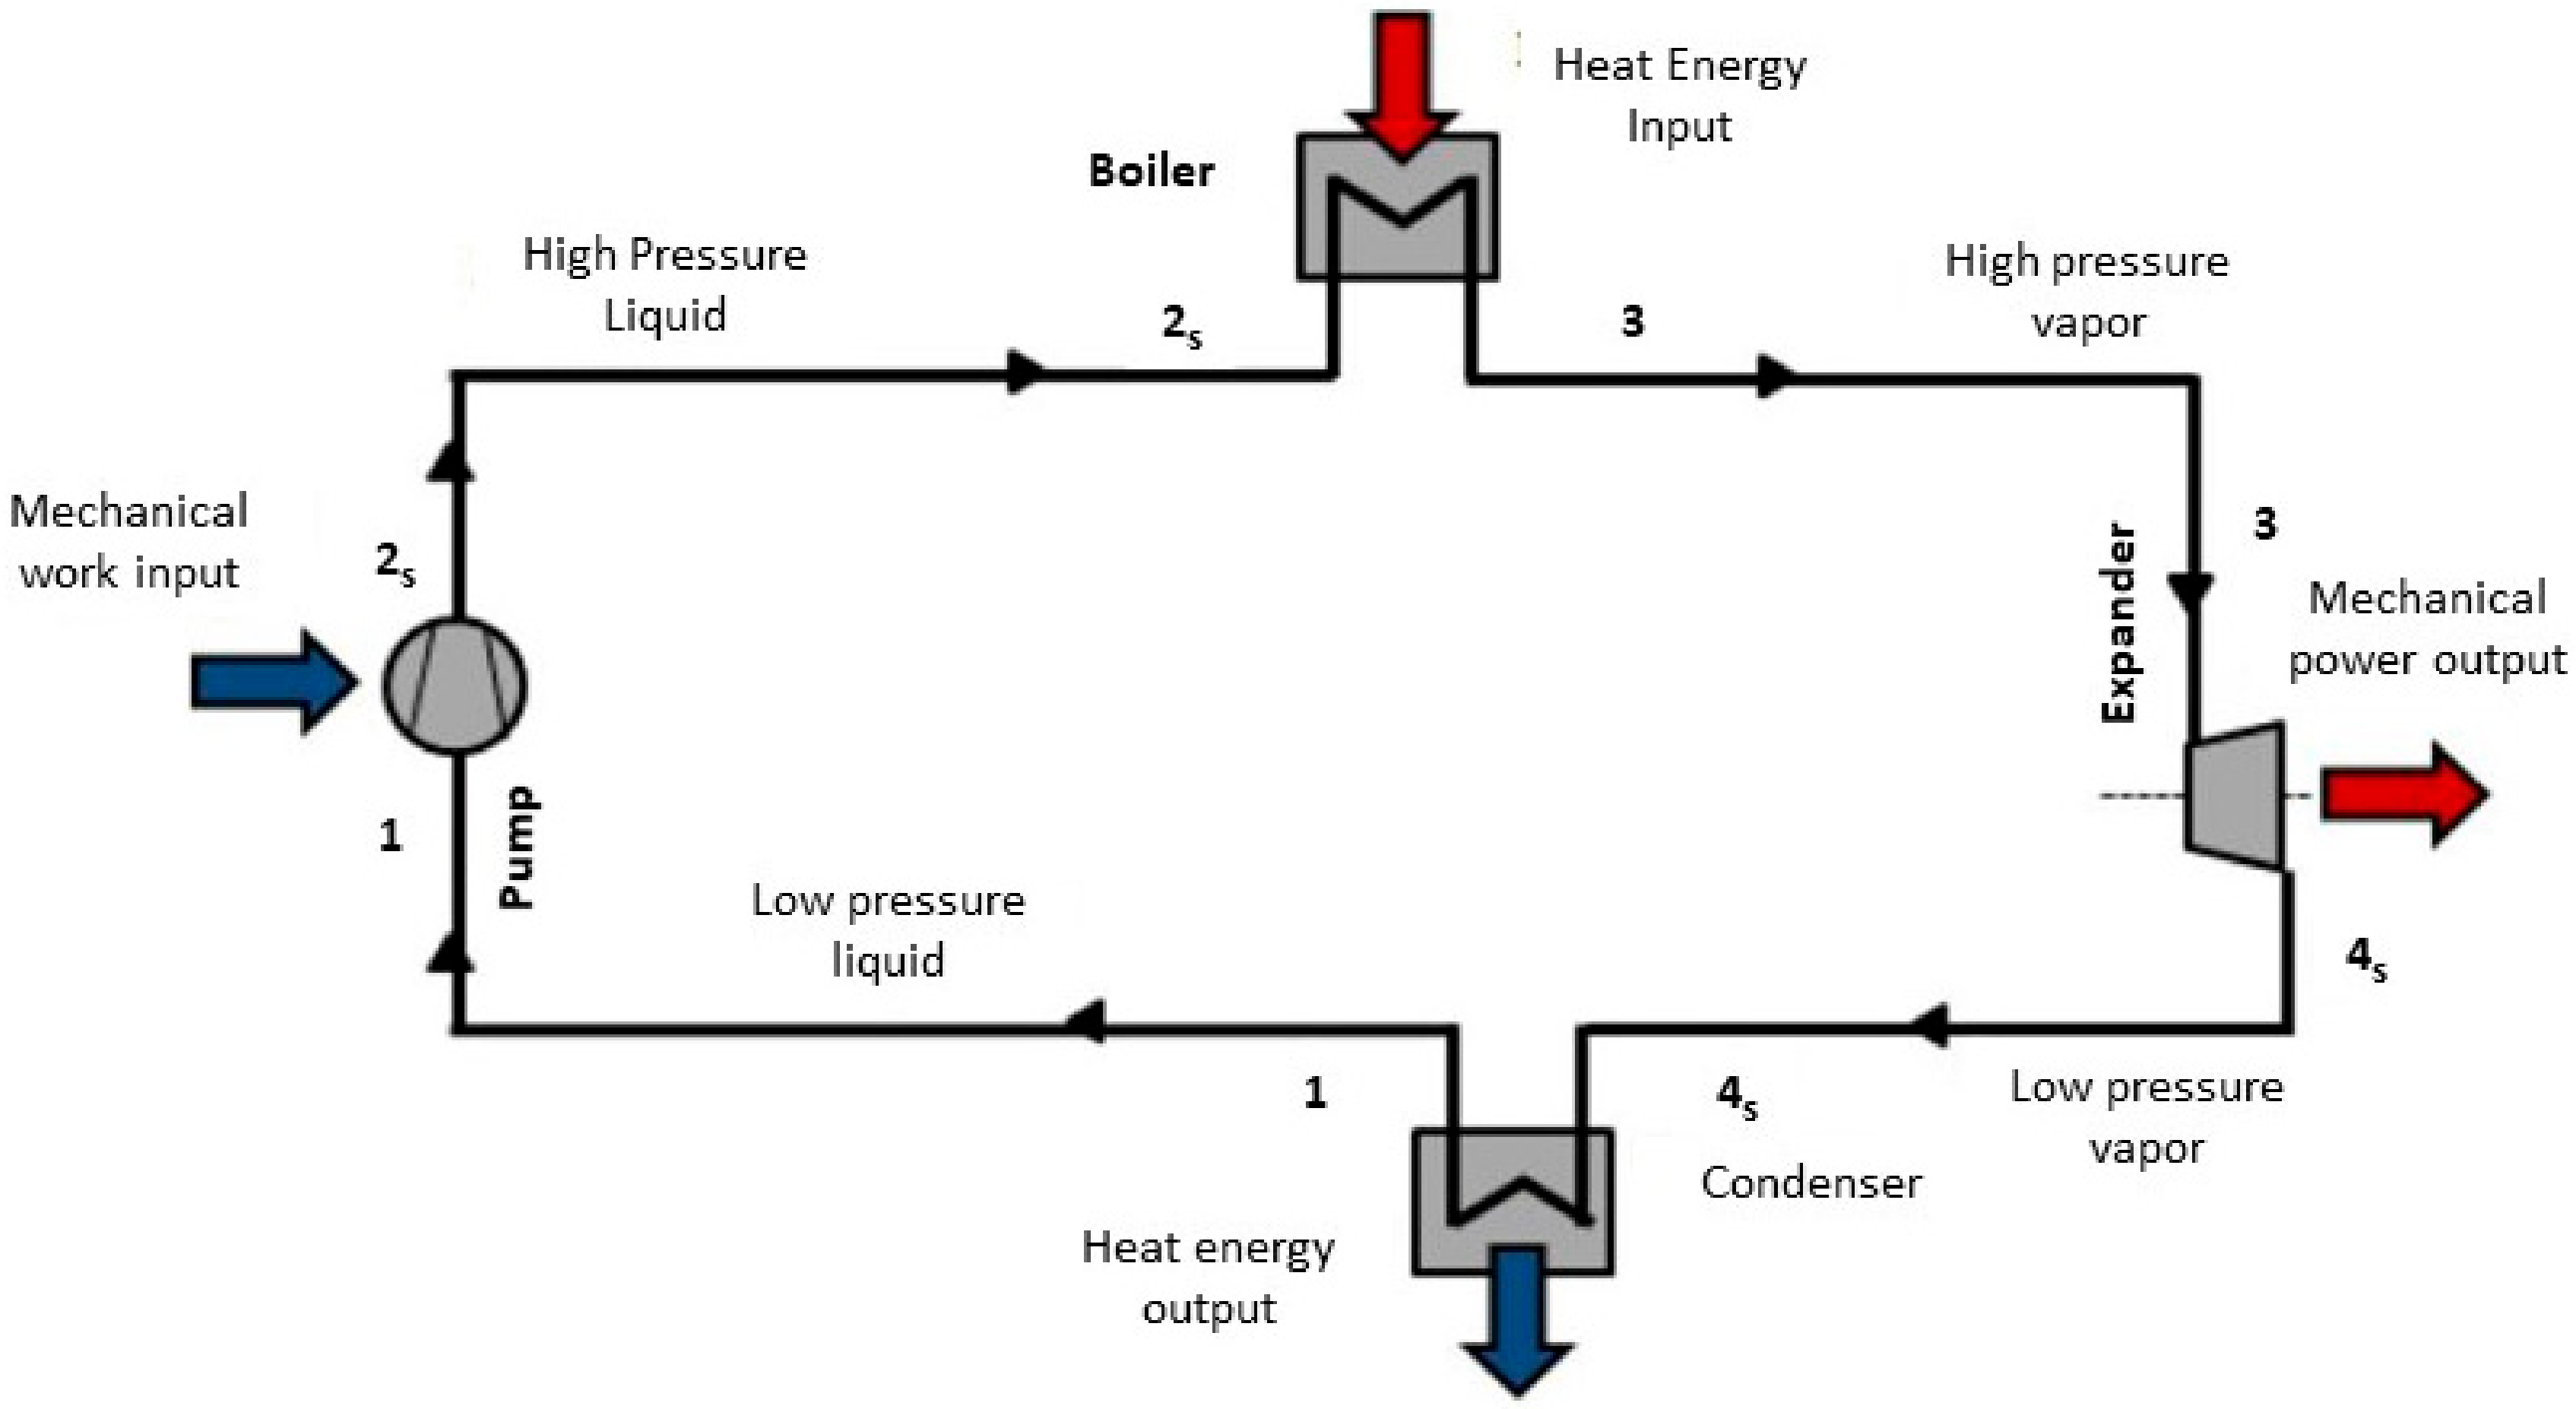
Figure 9.
Recuperative ORC System Layout.

Figure 10.
Brake Specific Fuel Consumption (BSFC) Map of the 2ZR-FXE Engine.
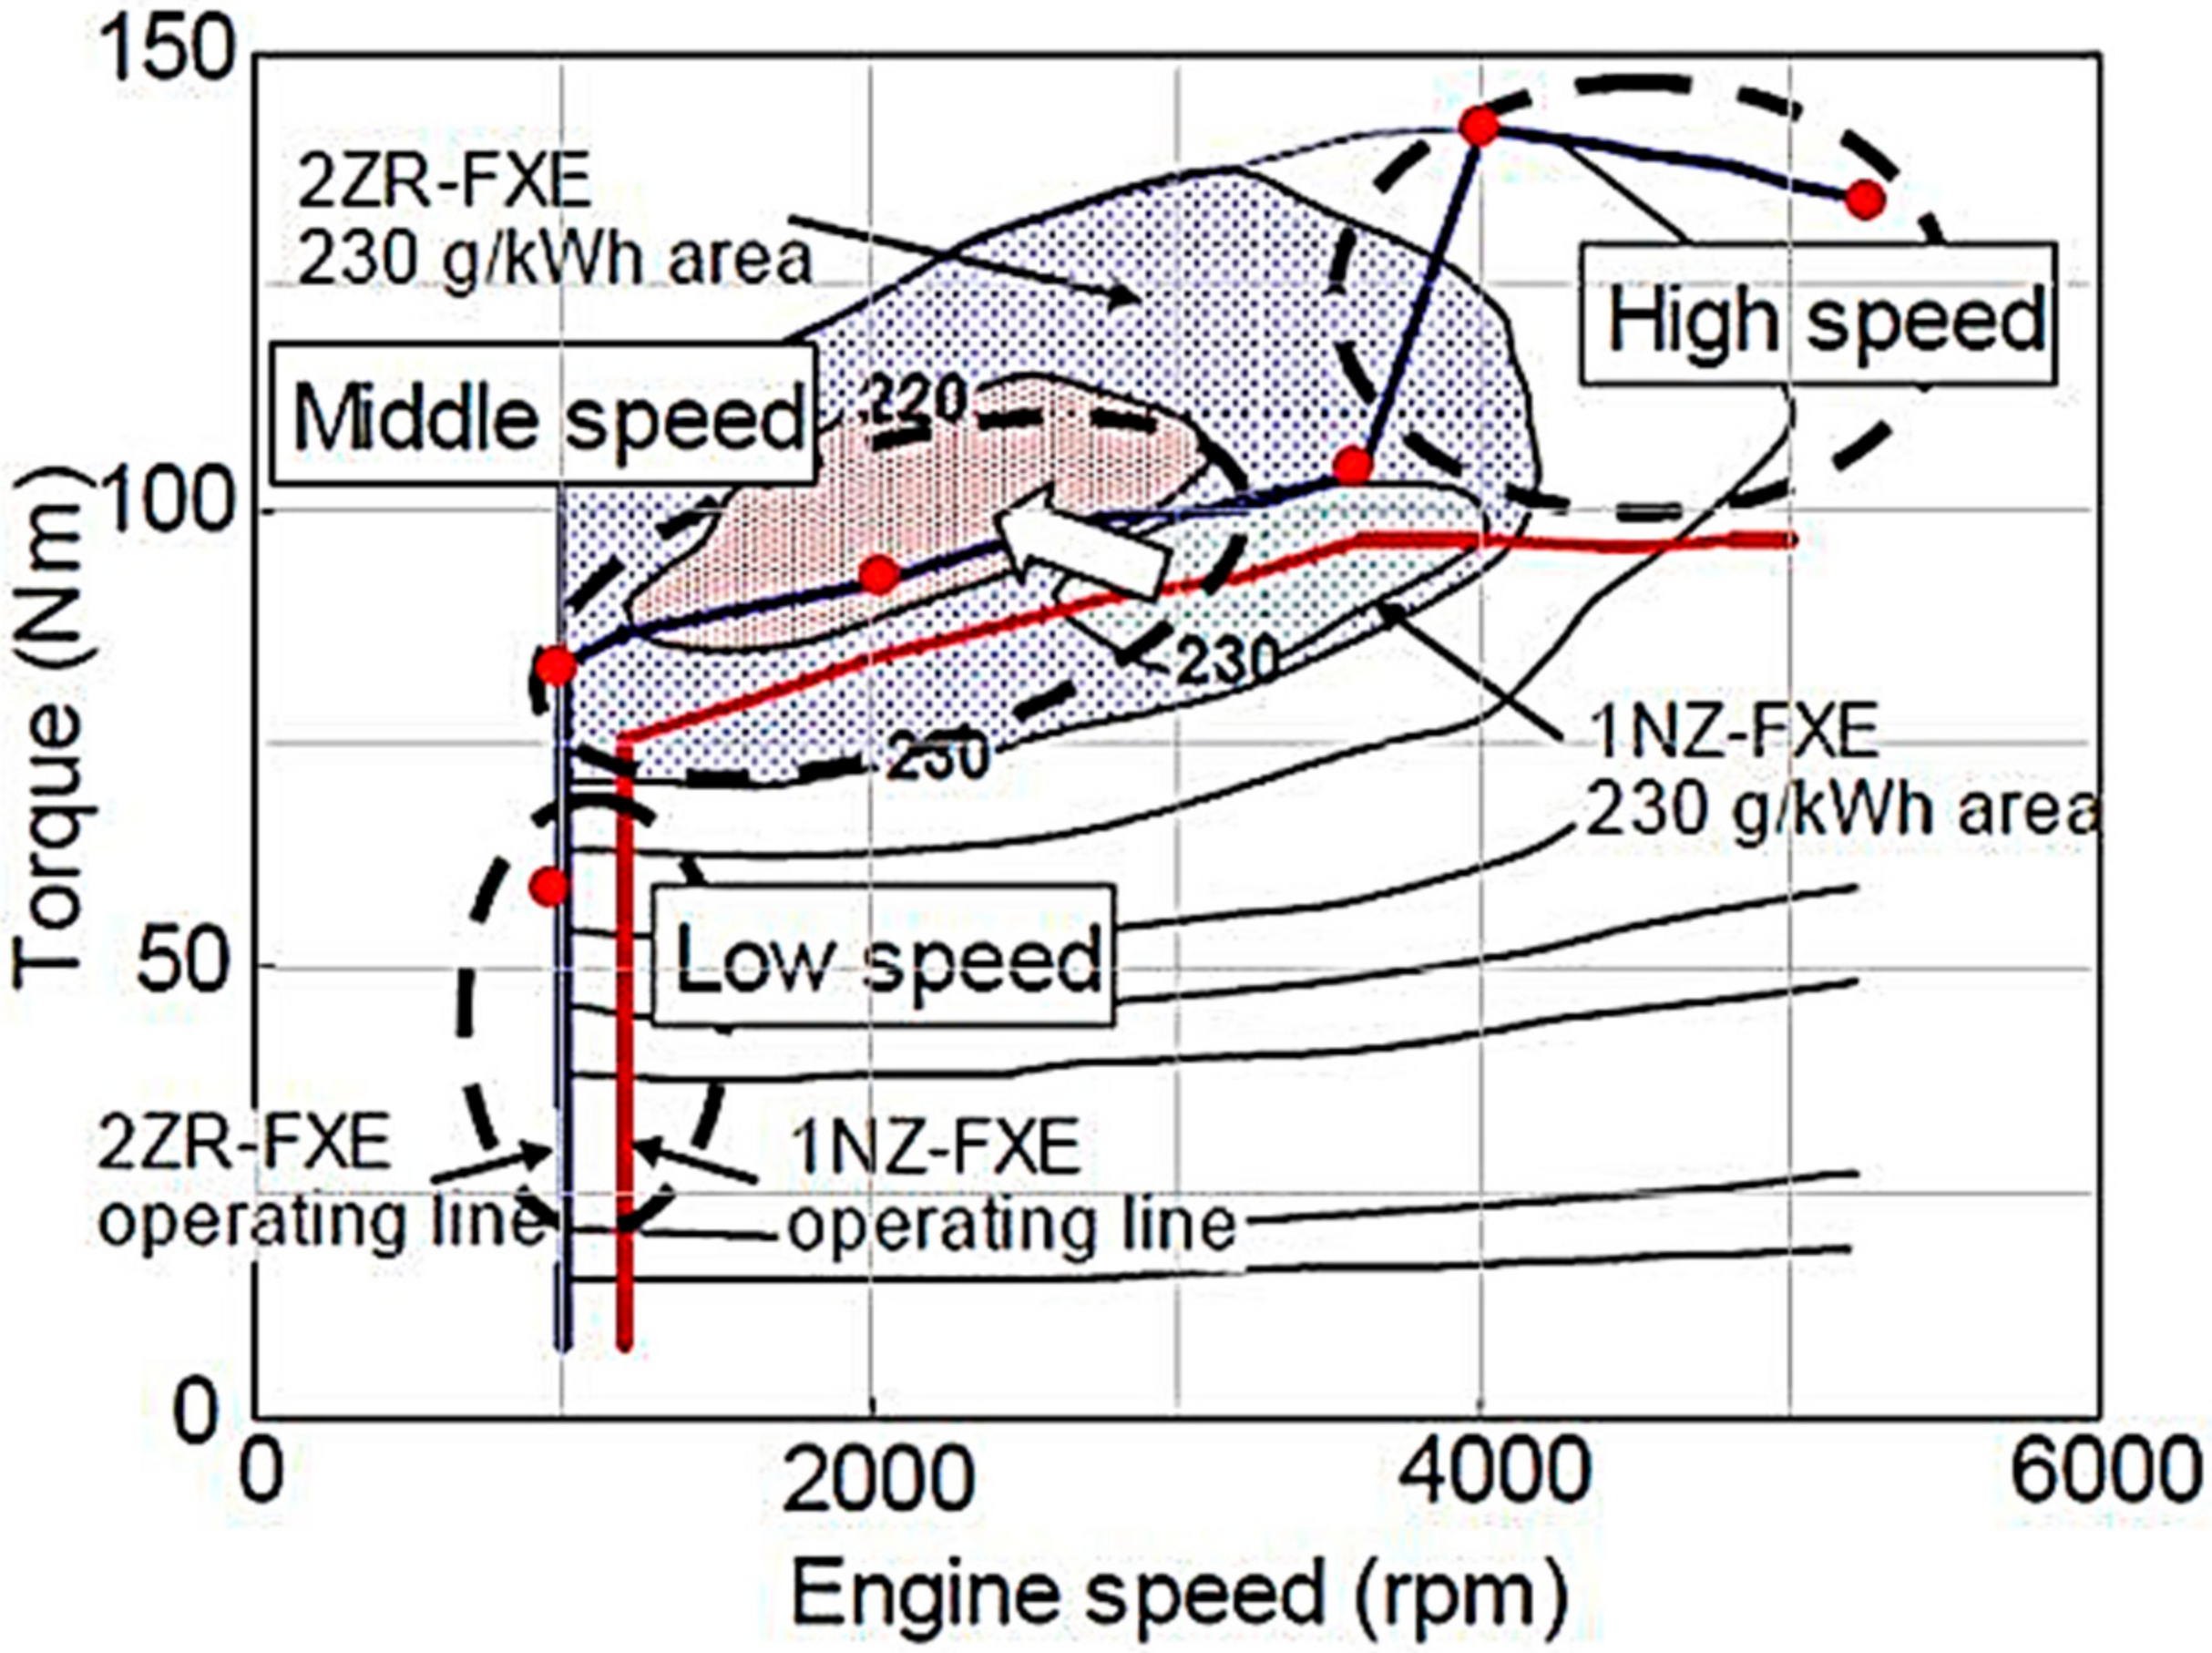
Figure 11.
Performance Map of 1.8 L vs 1.5 L Engine.
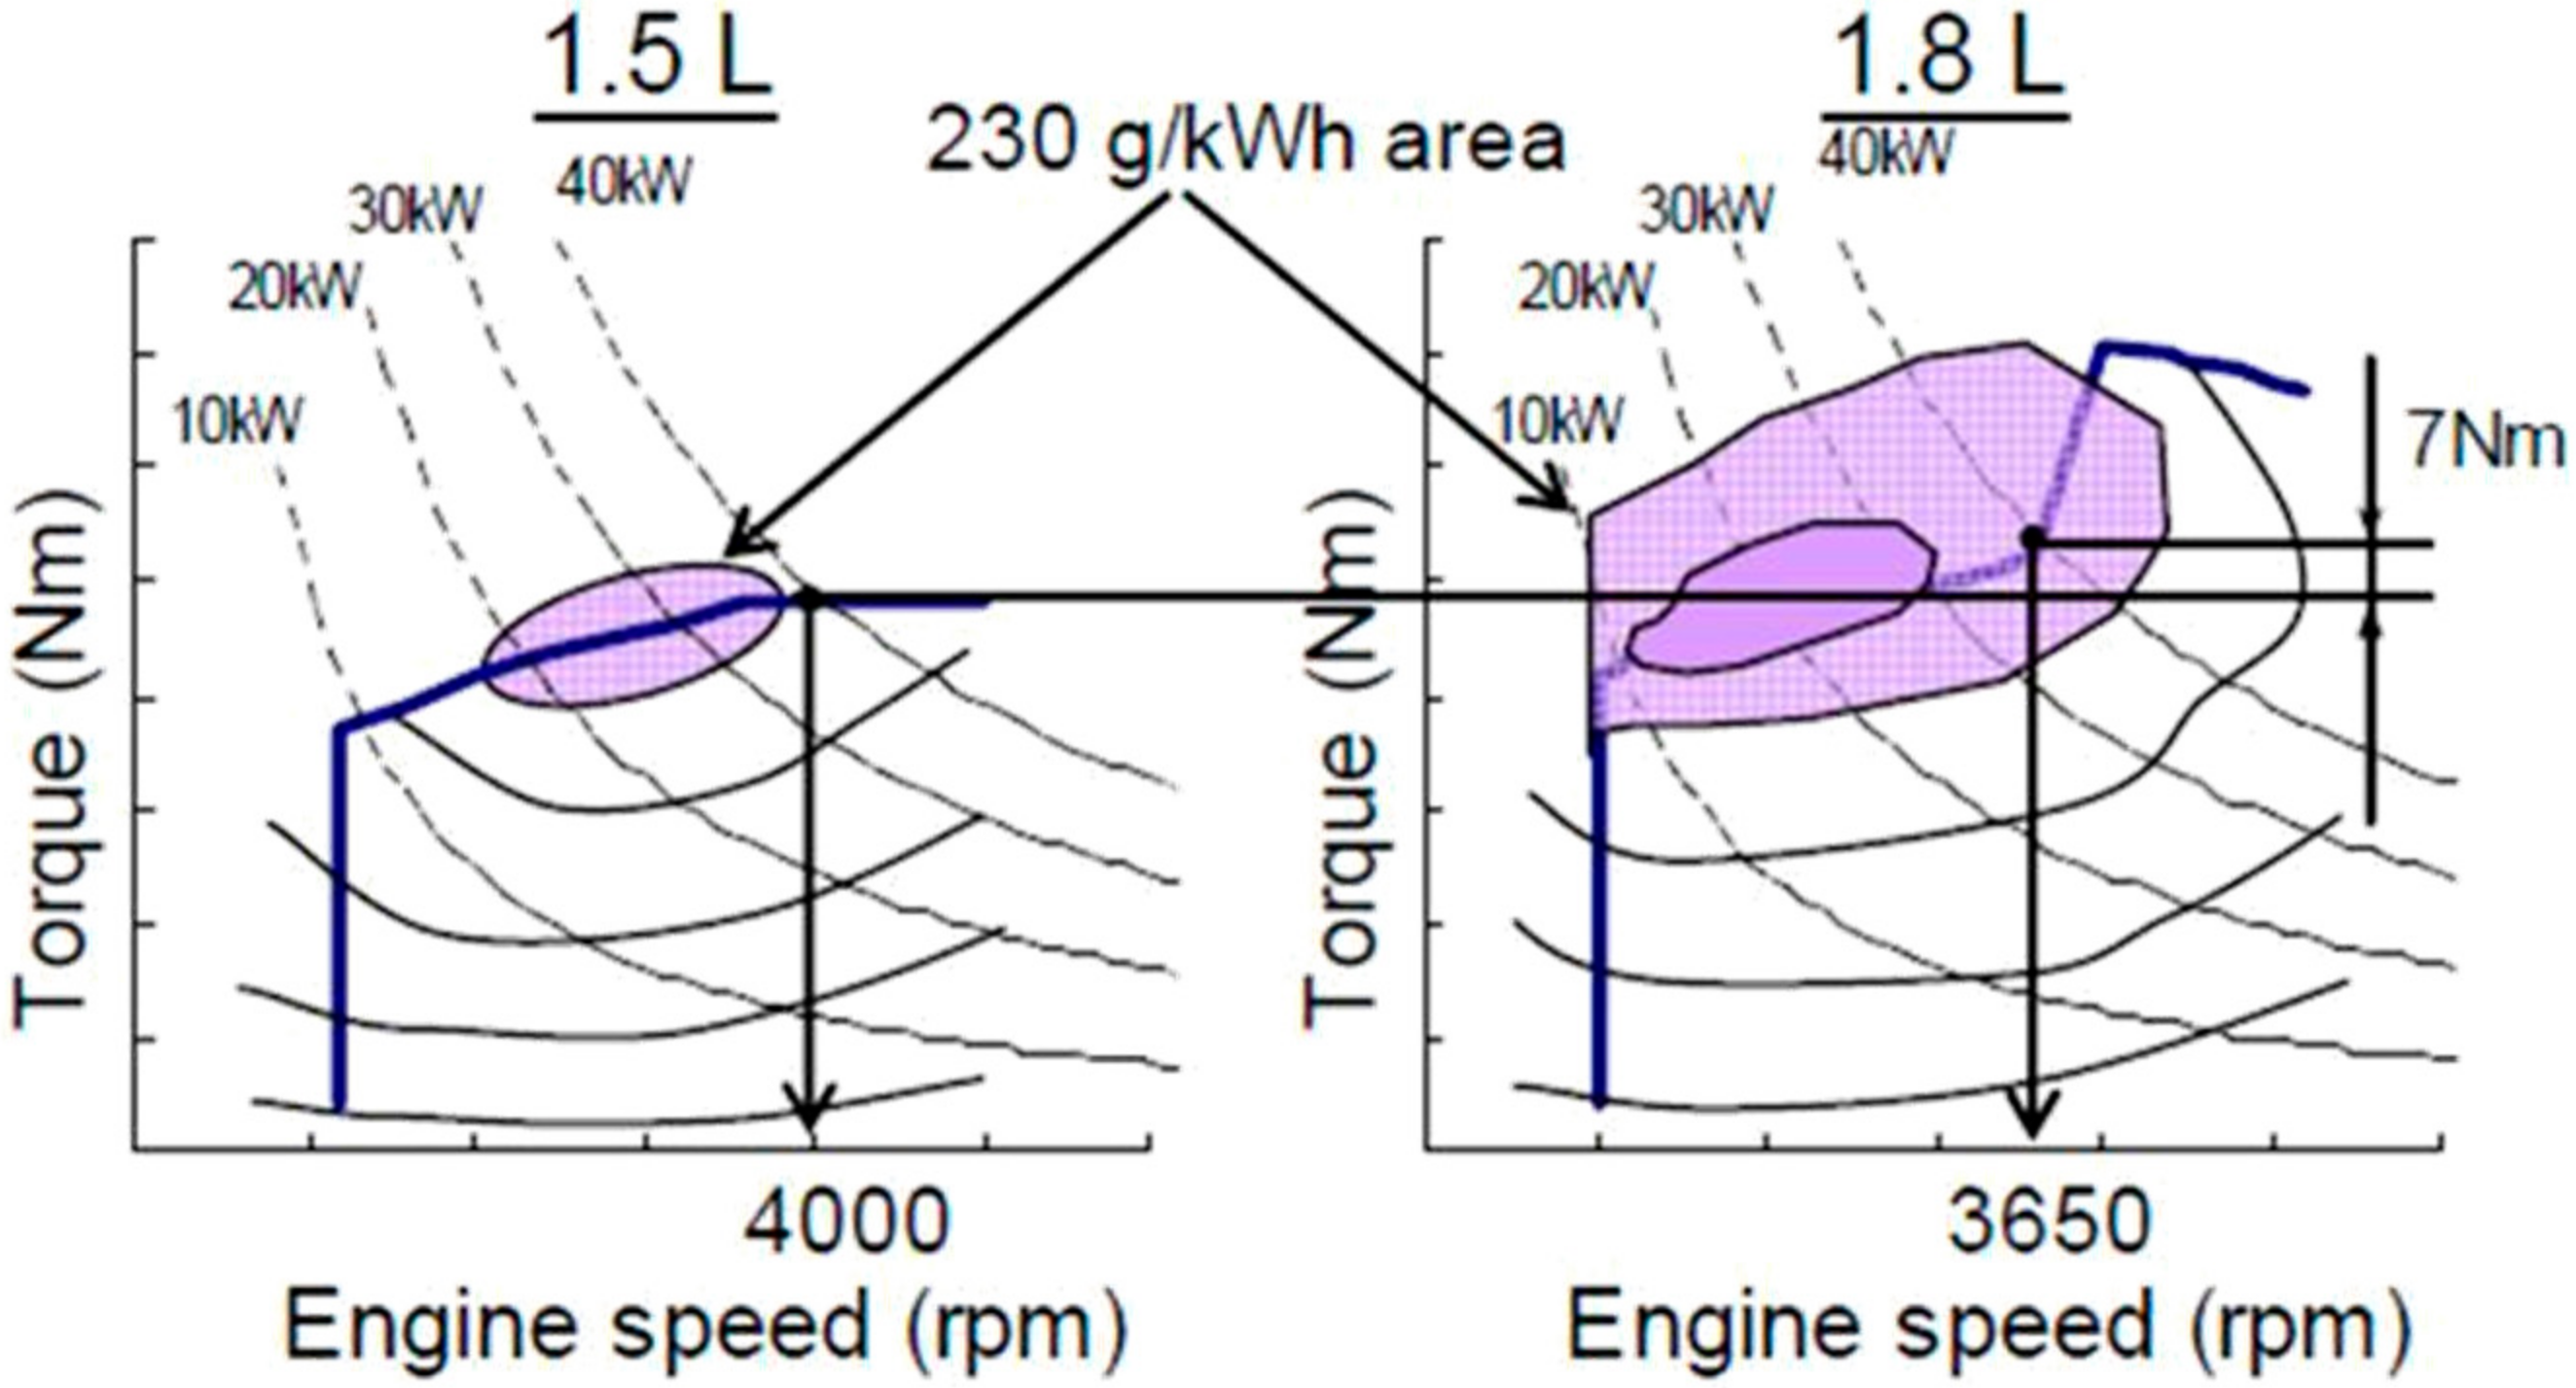
Figure 12.
BSFC from Engine Calibration.
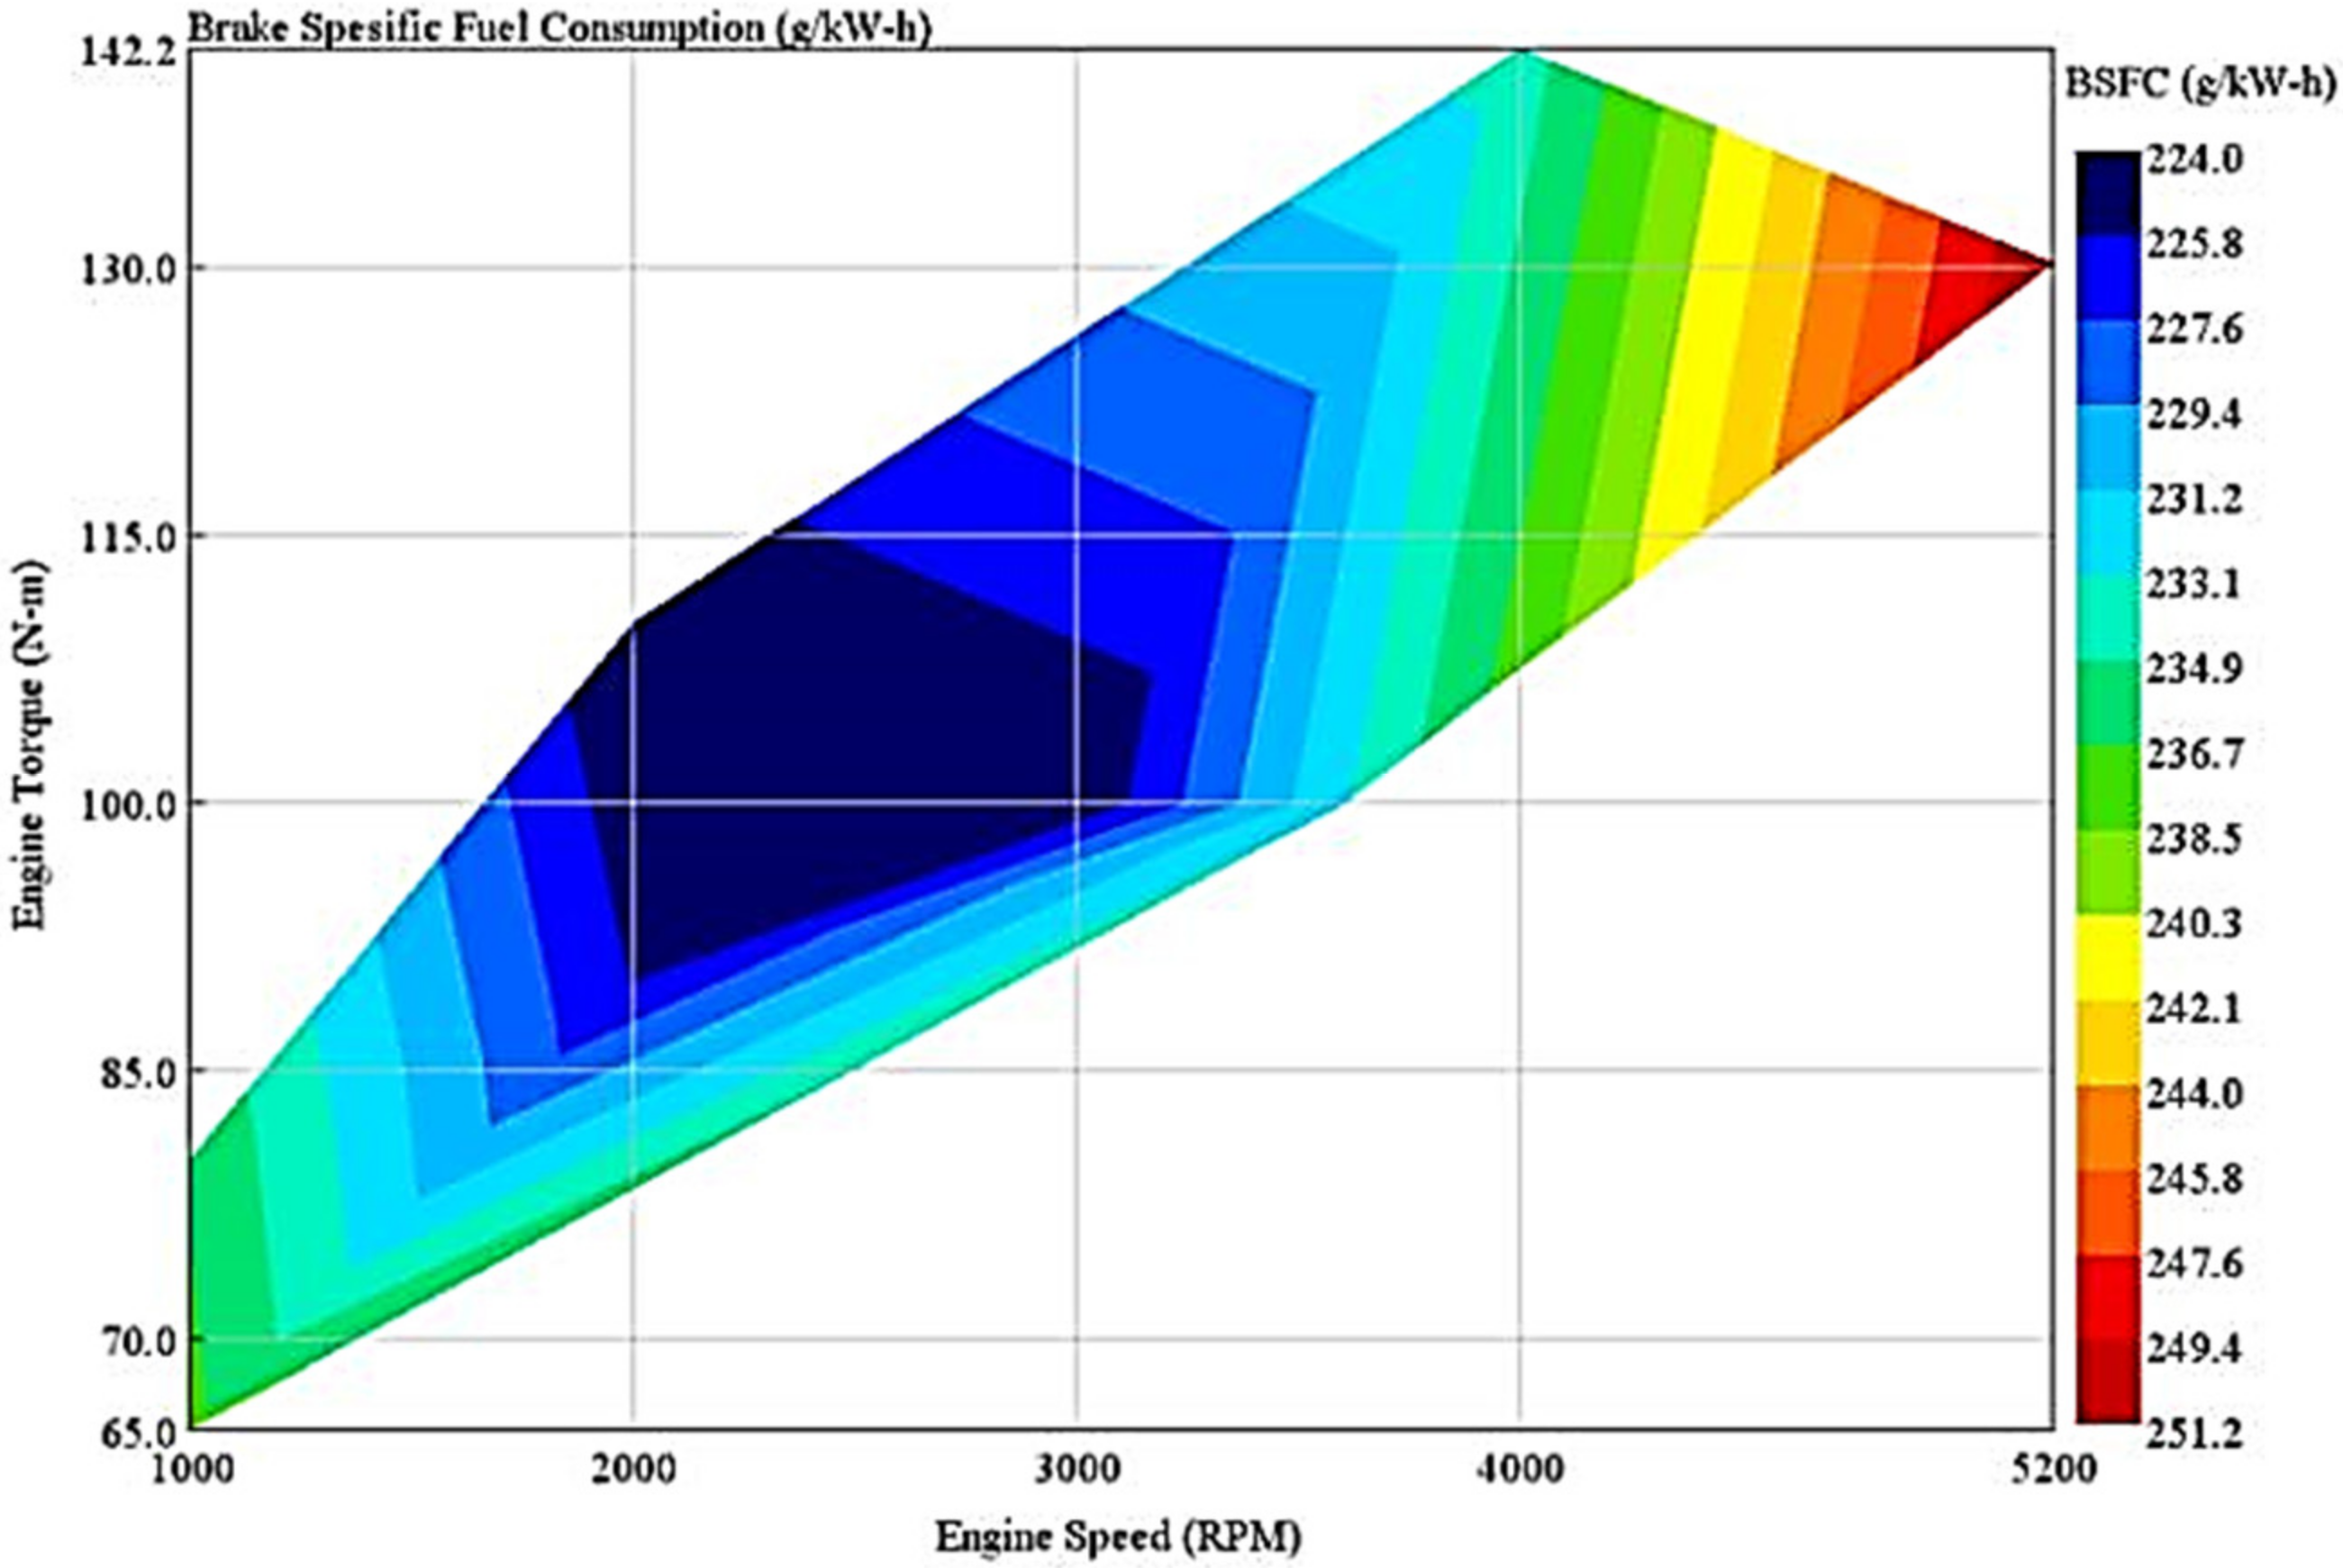
Figure 13.
Brake Power.
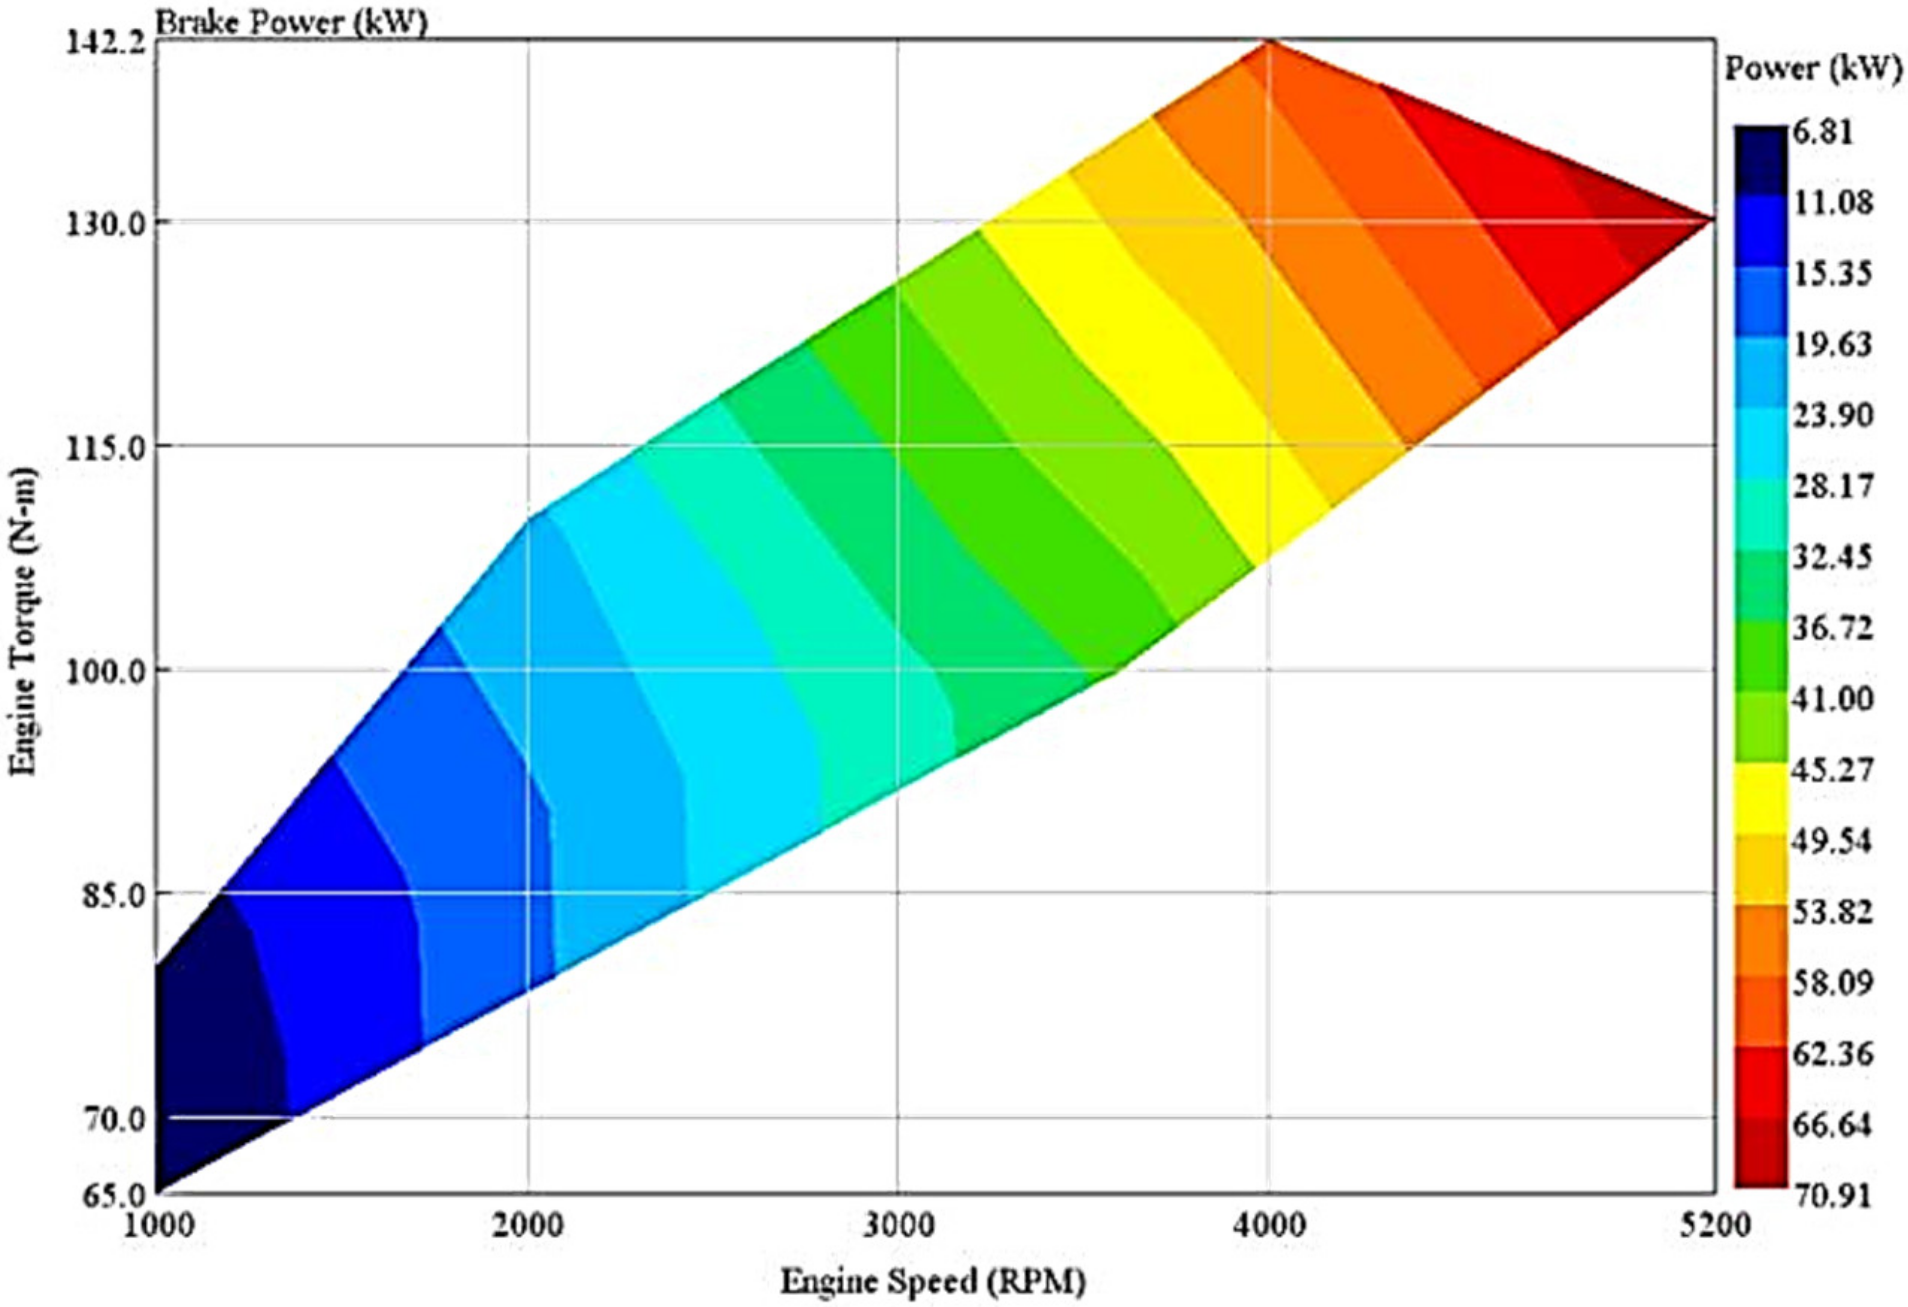
Figure 14.
Four-Cylinder SI (Spark Ignition) Engine Model in GT-SUITE.
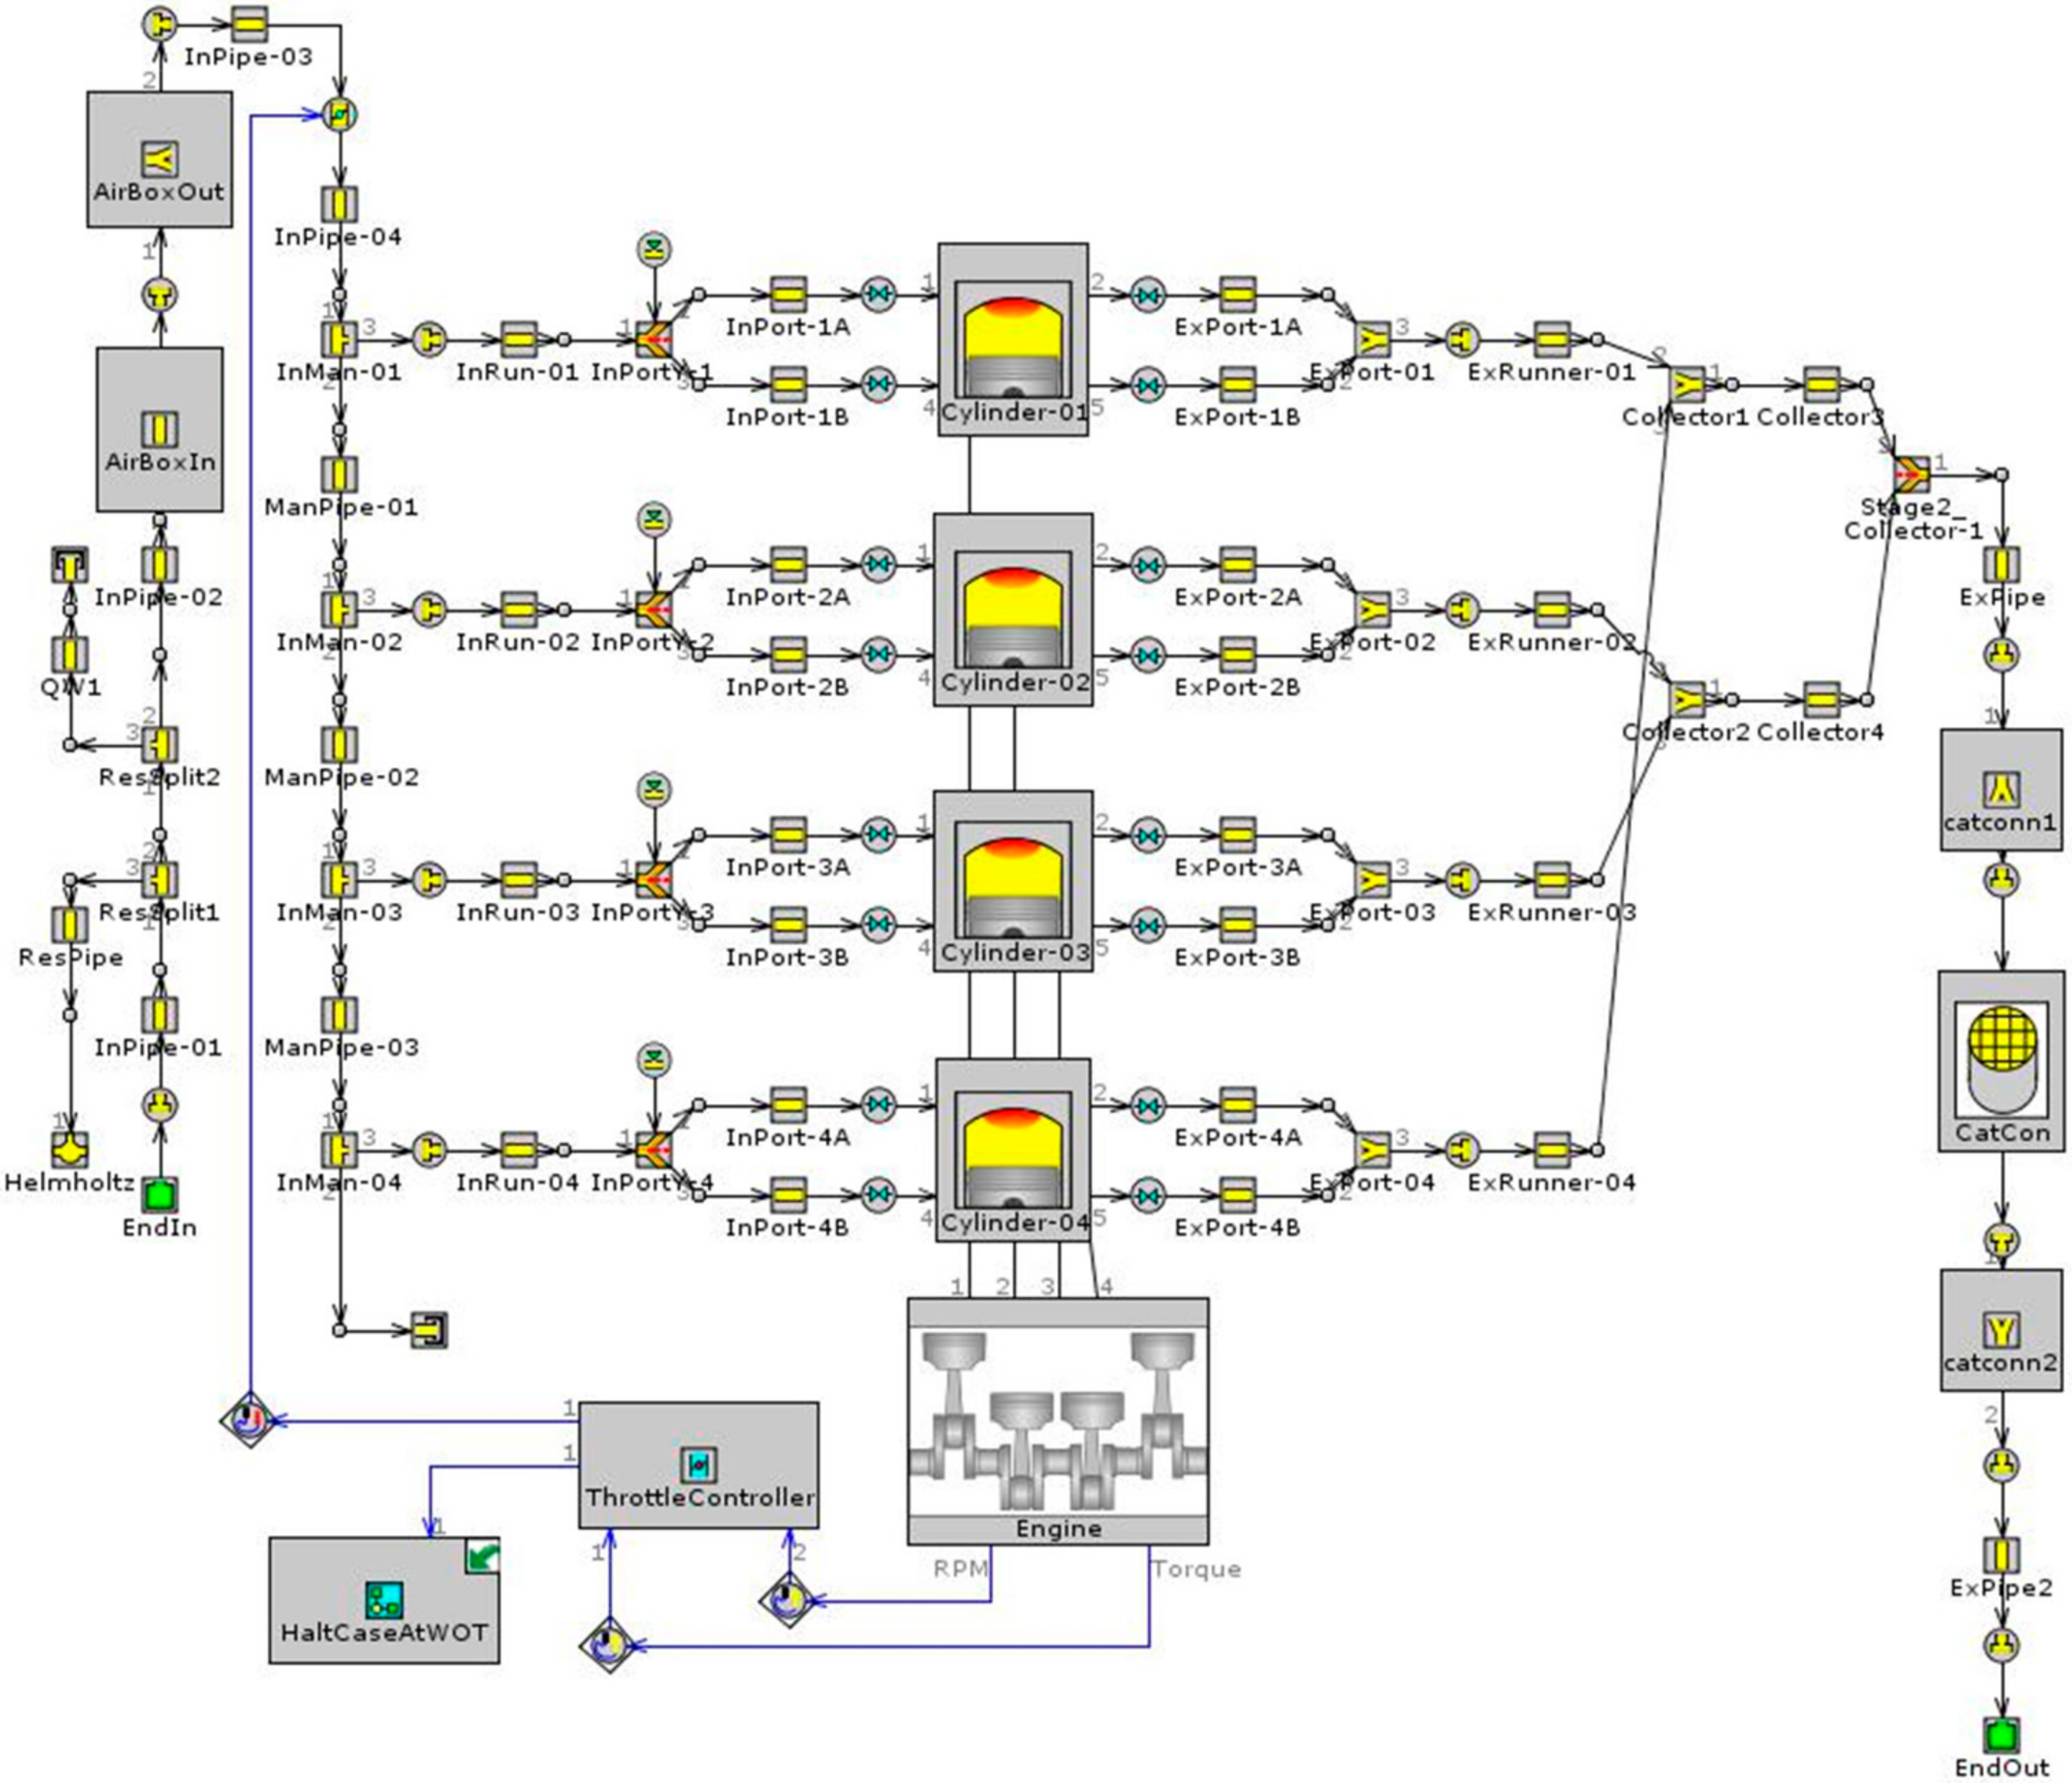
Figure 15.
Schematic of the ORC System in GT-SUITE.
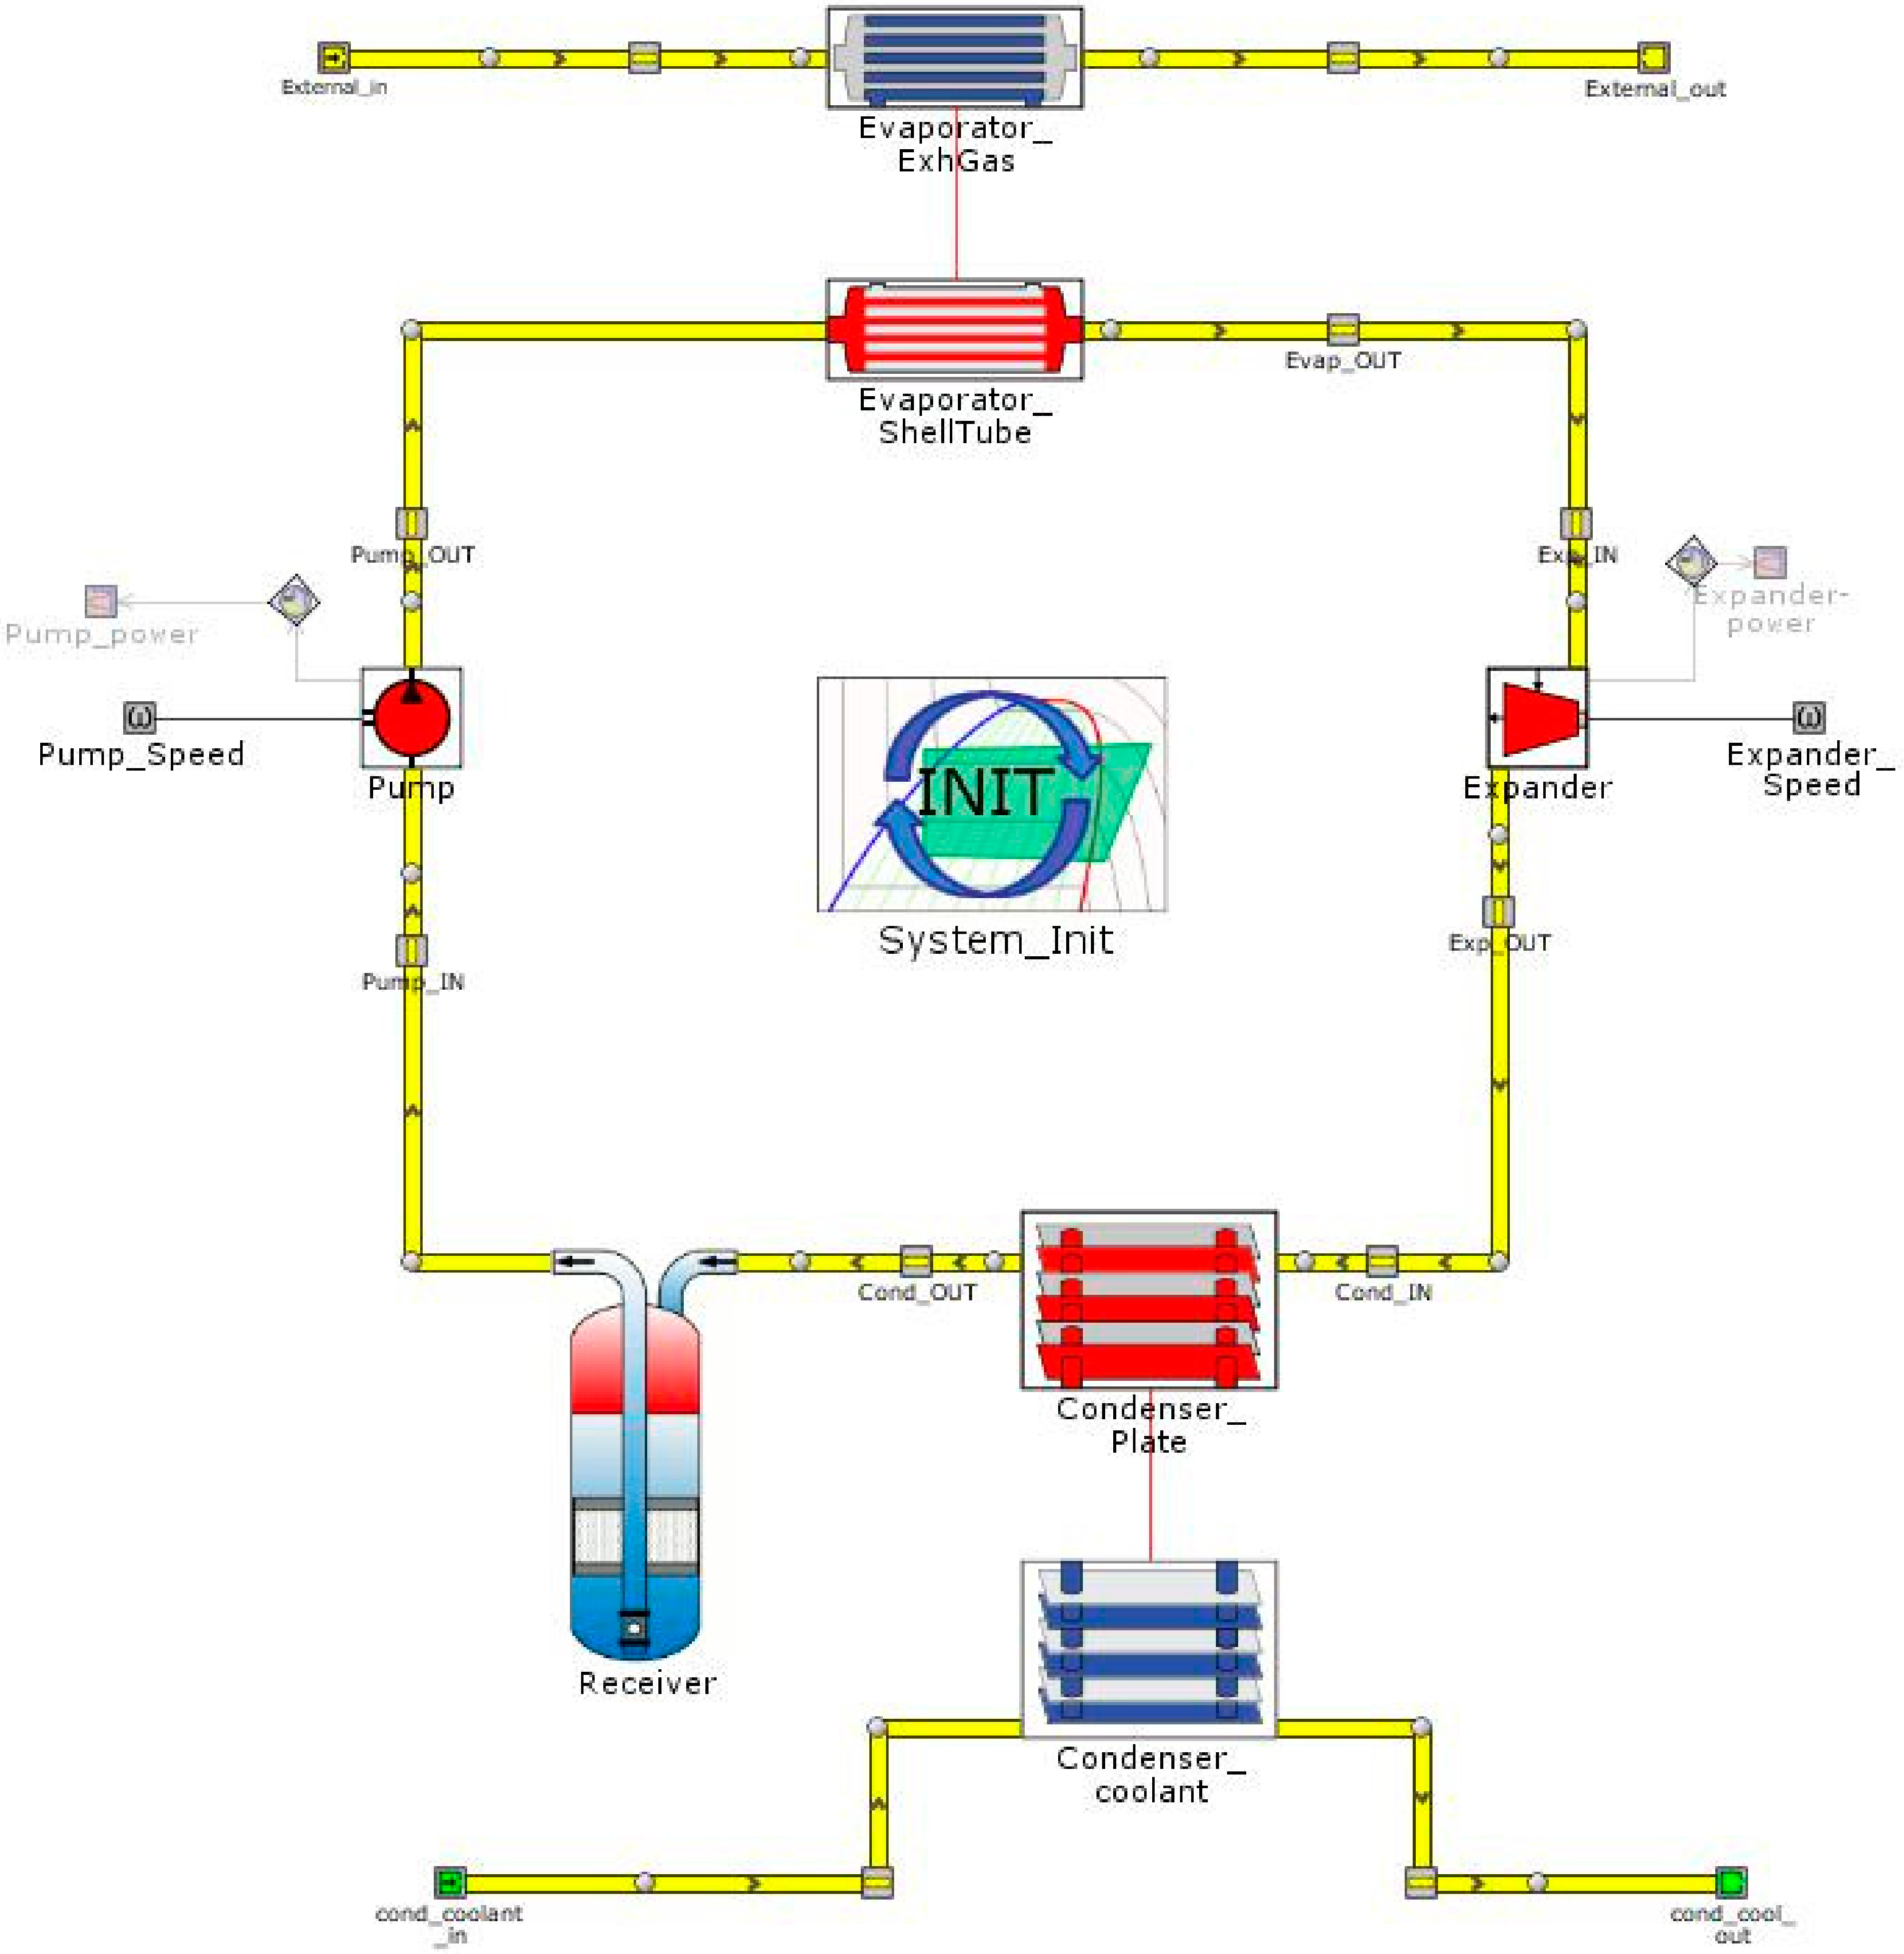
Figure 16.
Power Split Hybrid Electric Vehicles (HEV) Model in GT-SUITE.

Figure 17.
Engine Exhaust Temperature.

Figure 18.
Engine Exhaust Mass Flow Rate.
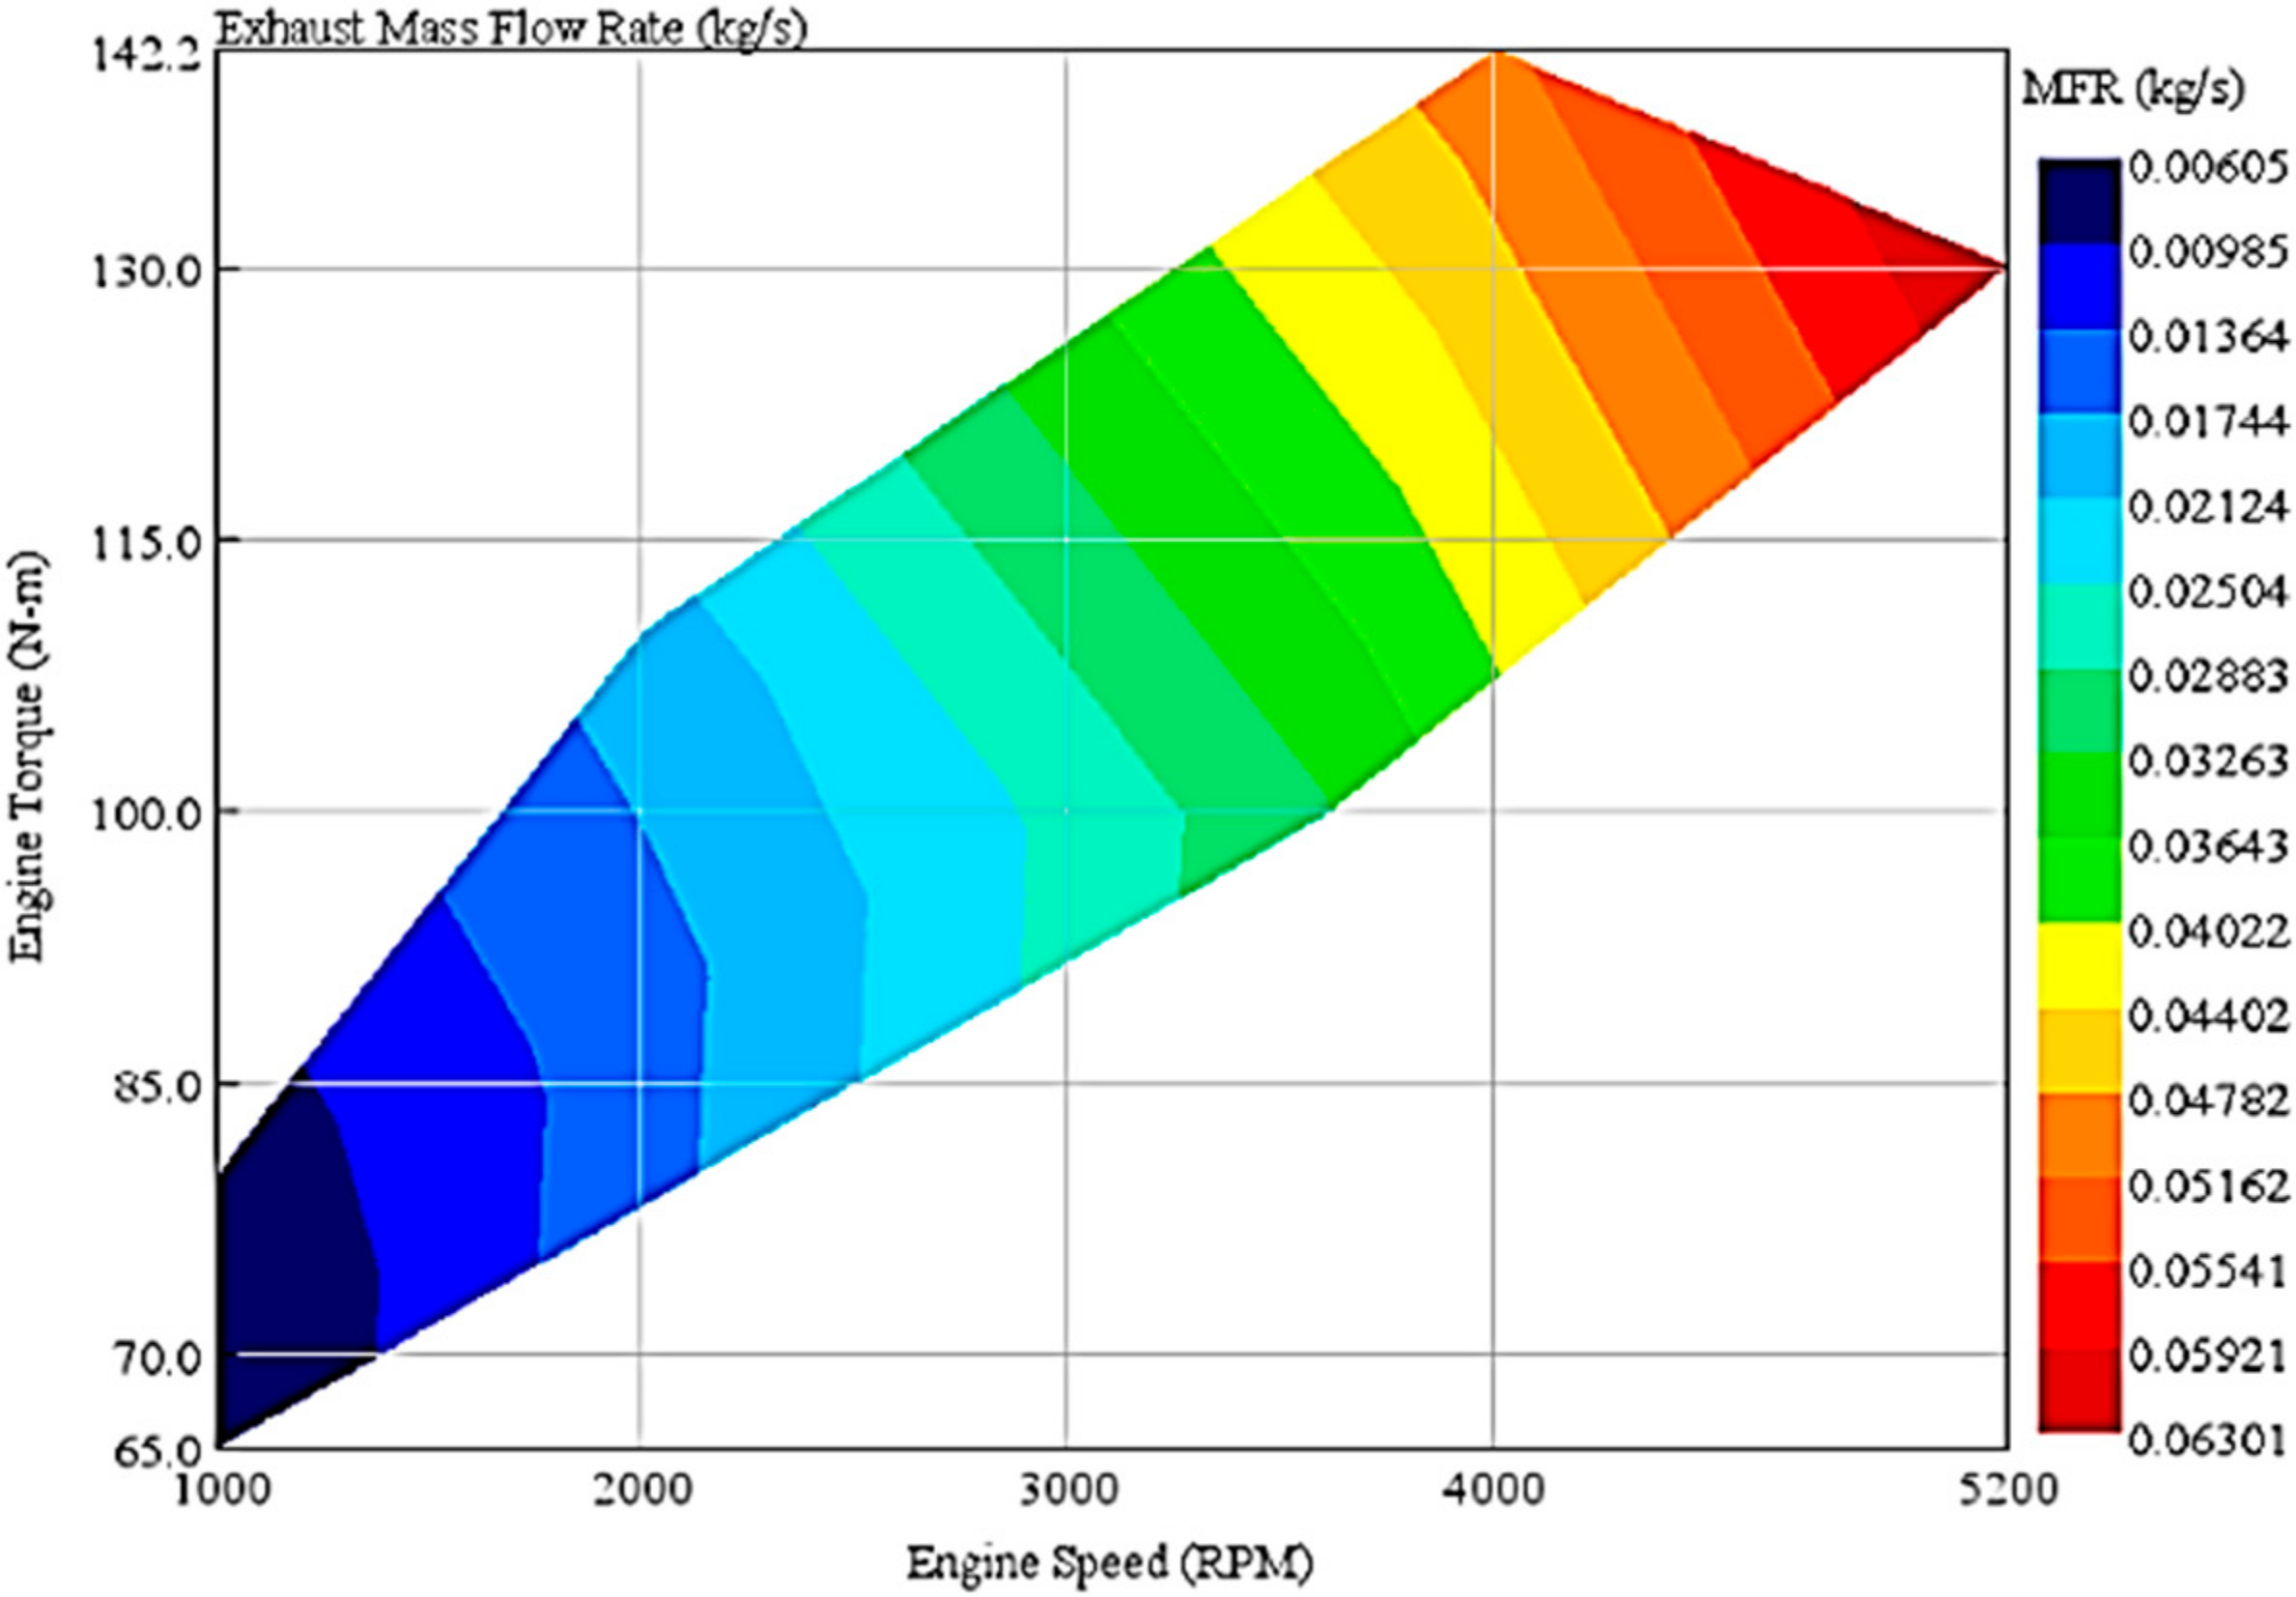
Figure 19.
Pump Efficiency Contour Plot.

Figure 20.
Turbine Efficiency Contour Plot.

Figure 21.
ORC Net Power Output.
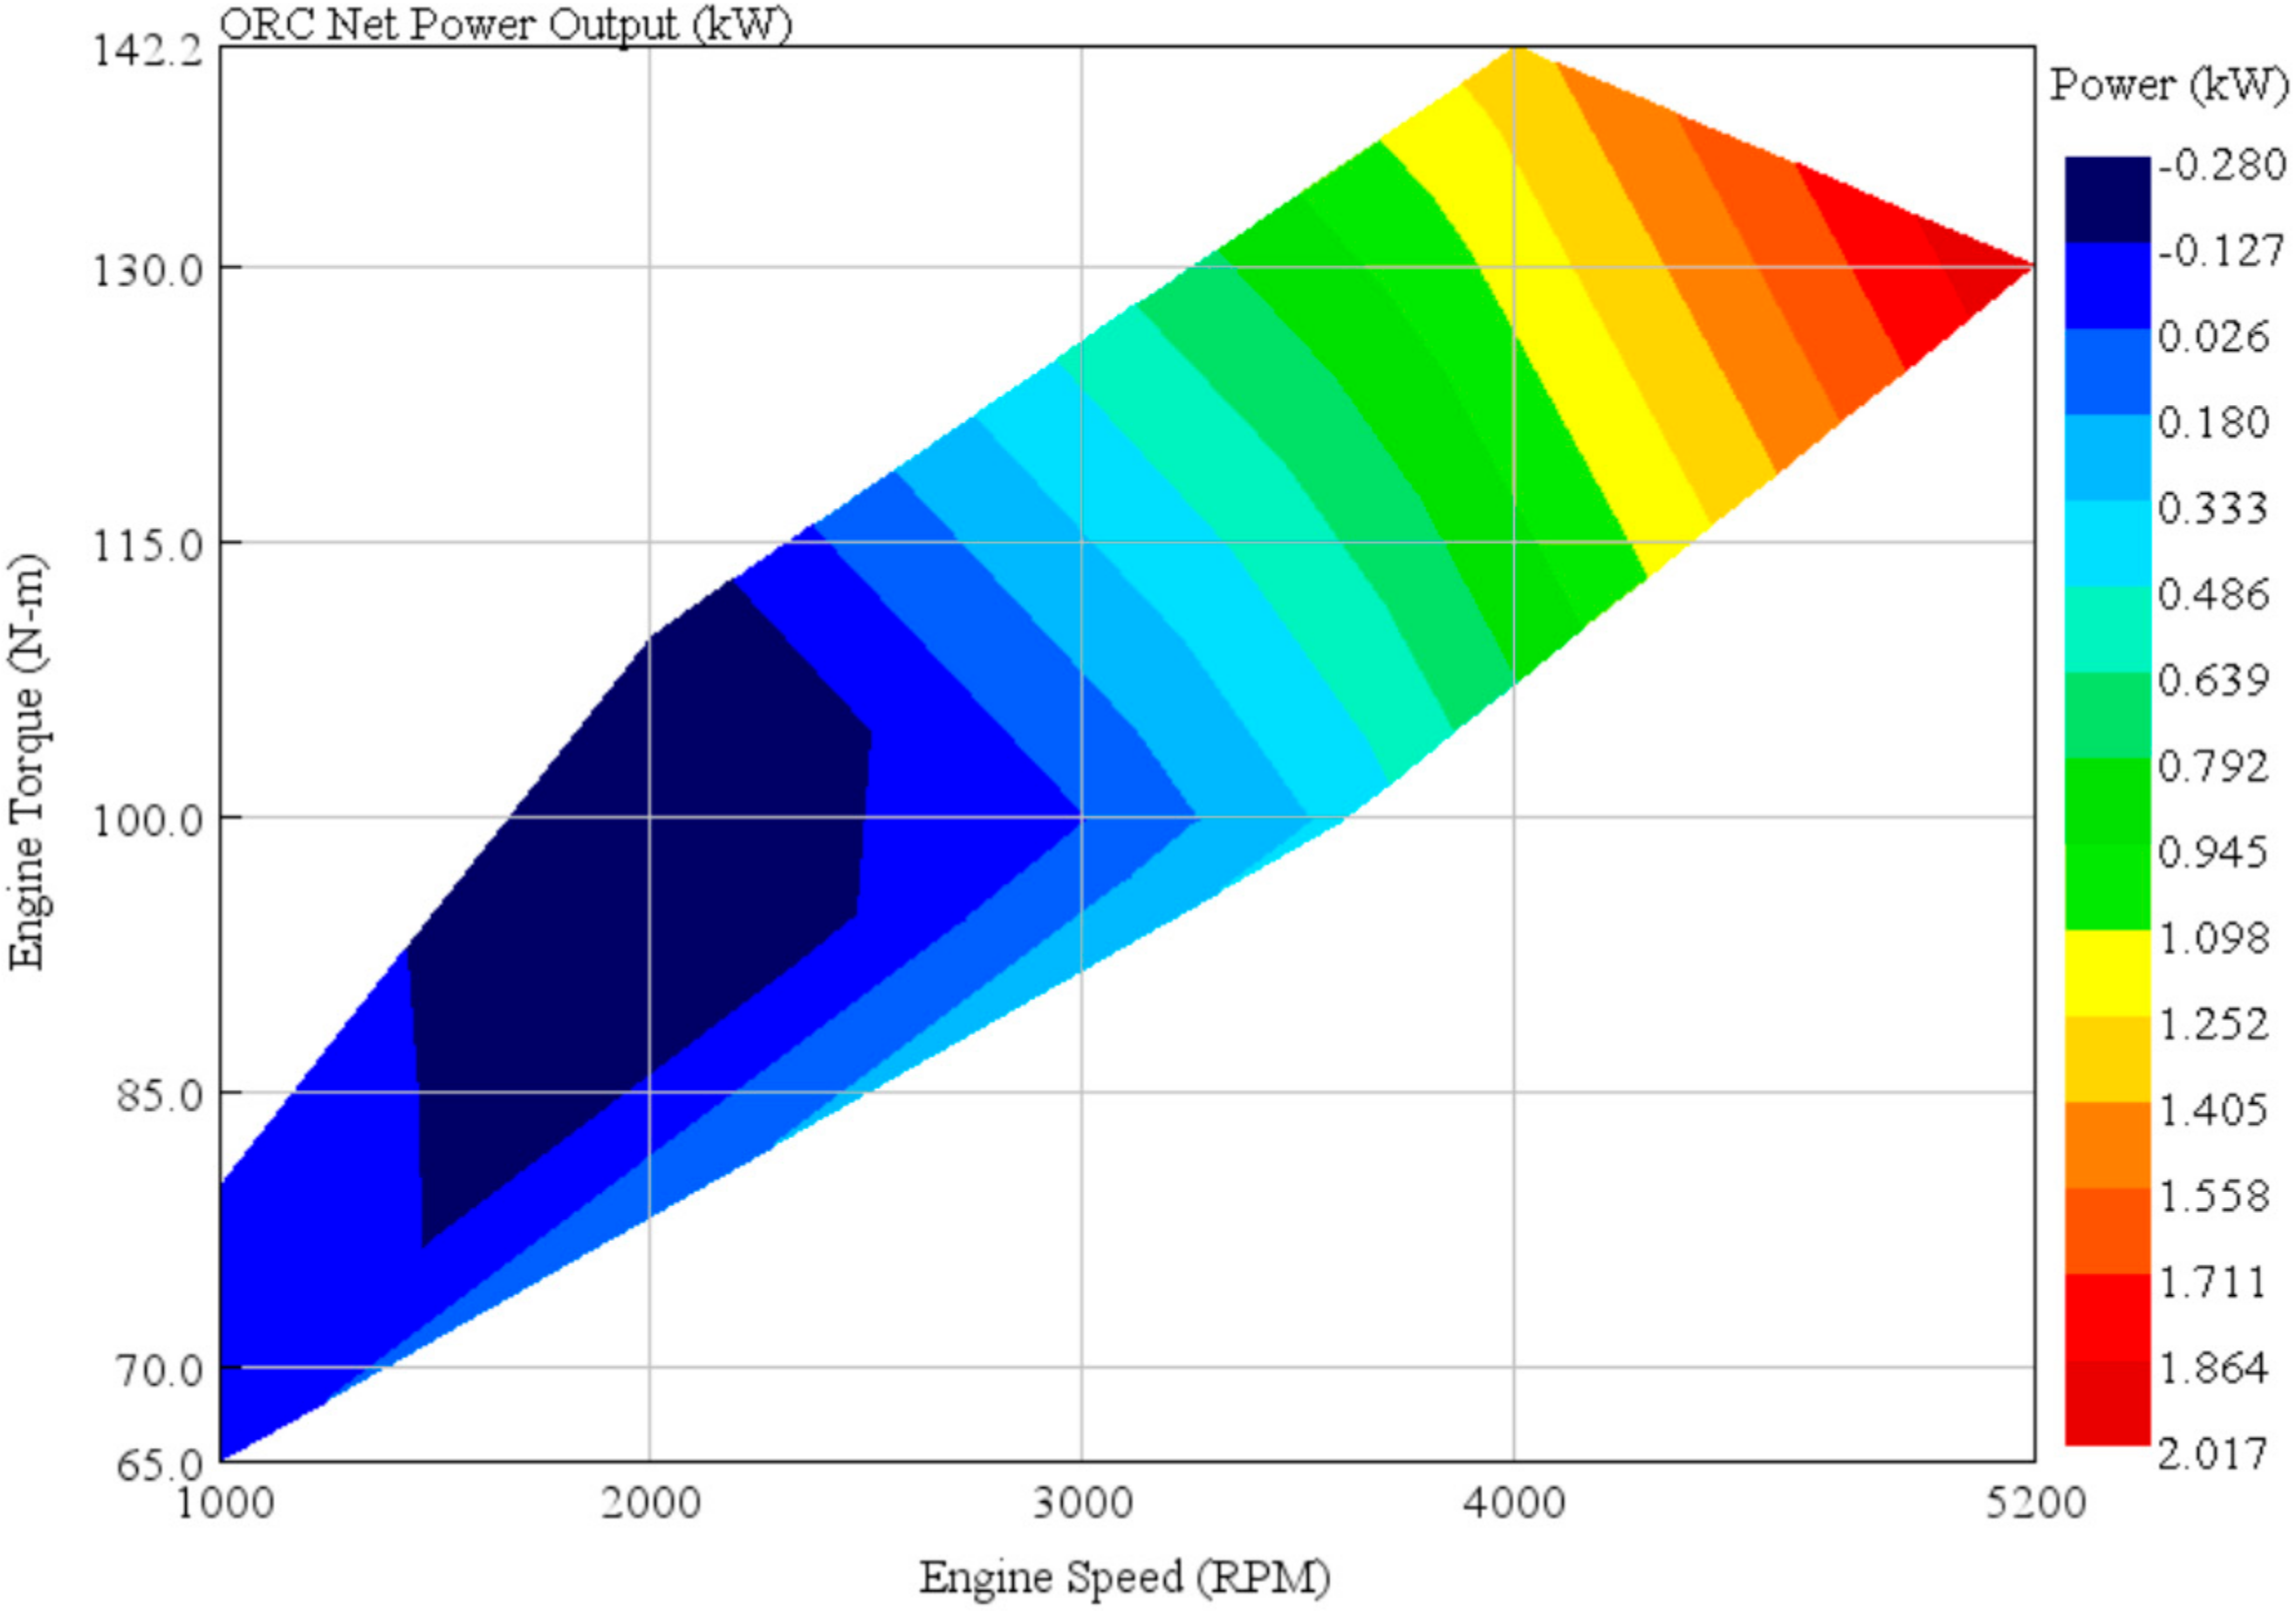
Figure 22.
Comparison of the ORC System with and Without a Recuperator.
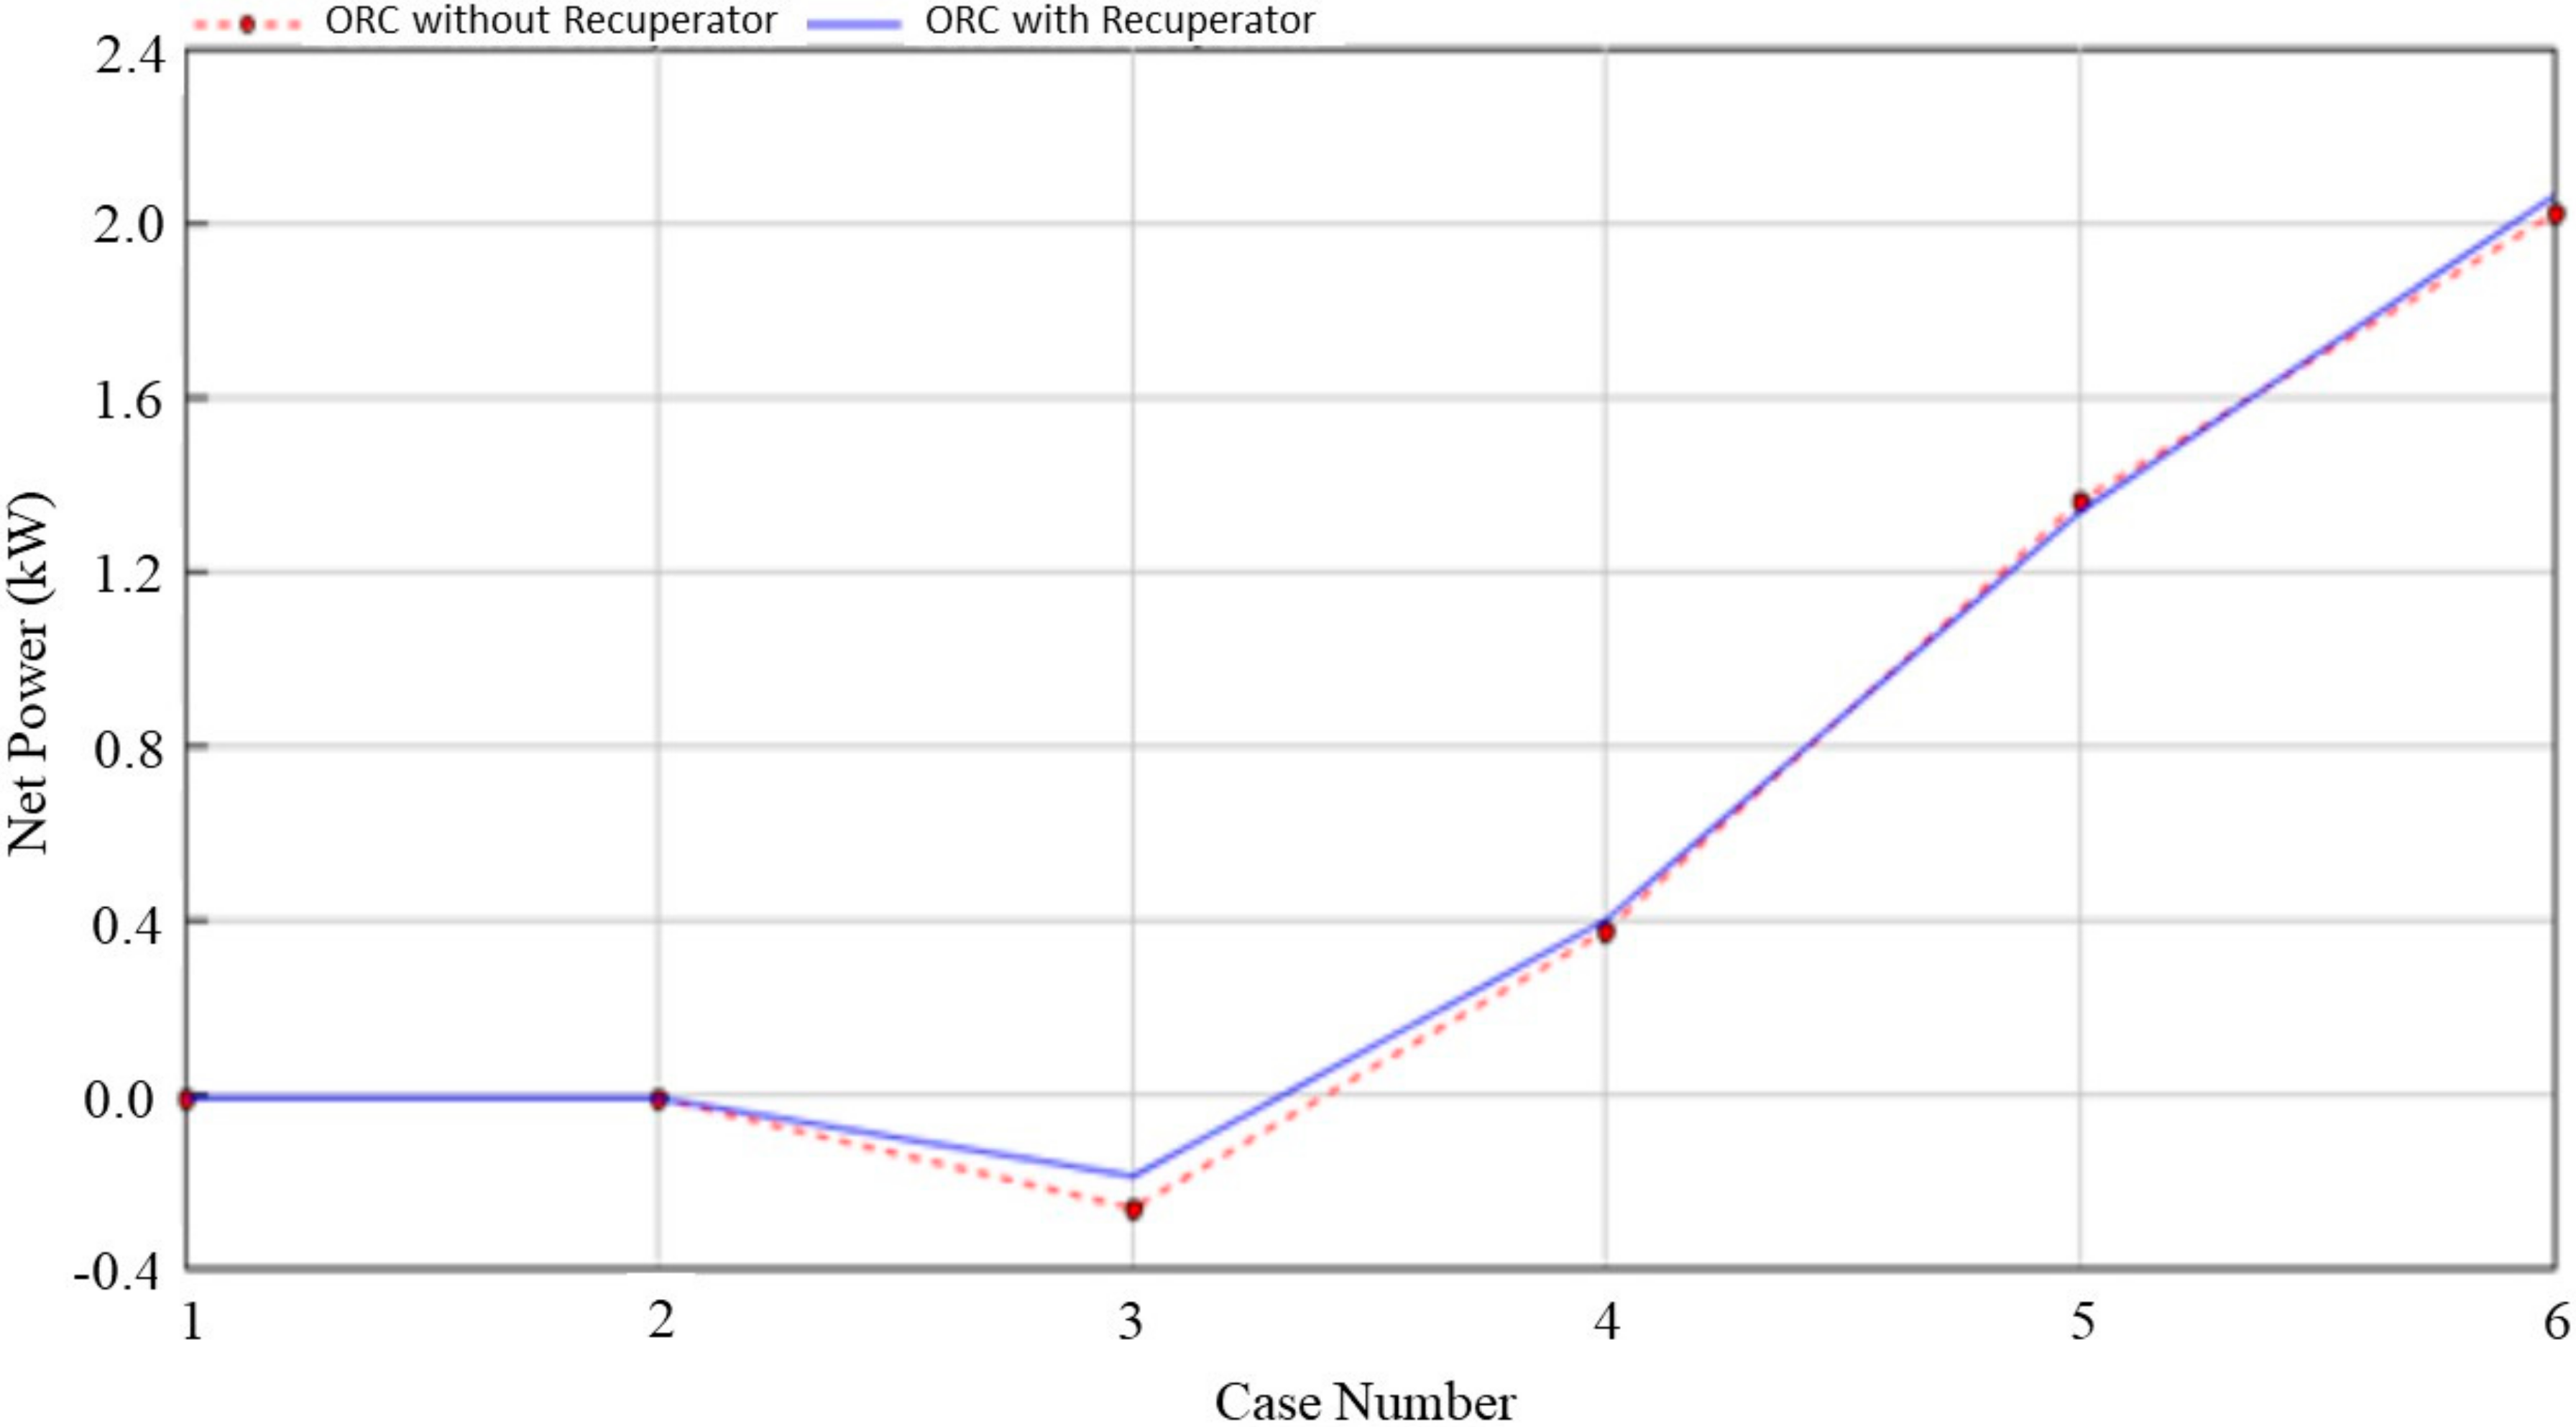
Figure 23.
Evaporator Energy Rate.

Figure 24.
ORC Efficiency Graph.

Figure 25.
Reduction in BSFC.
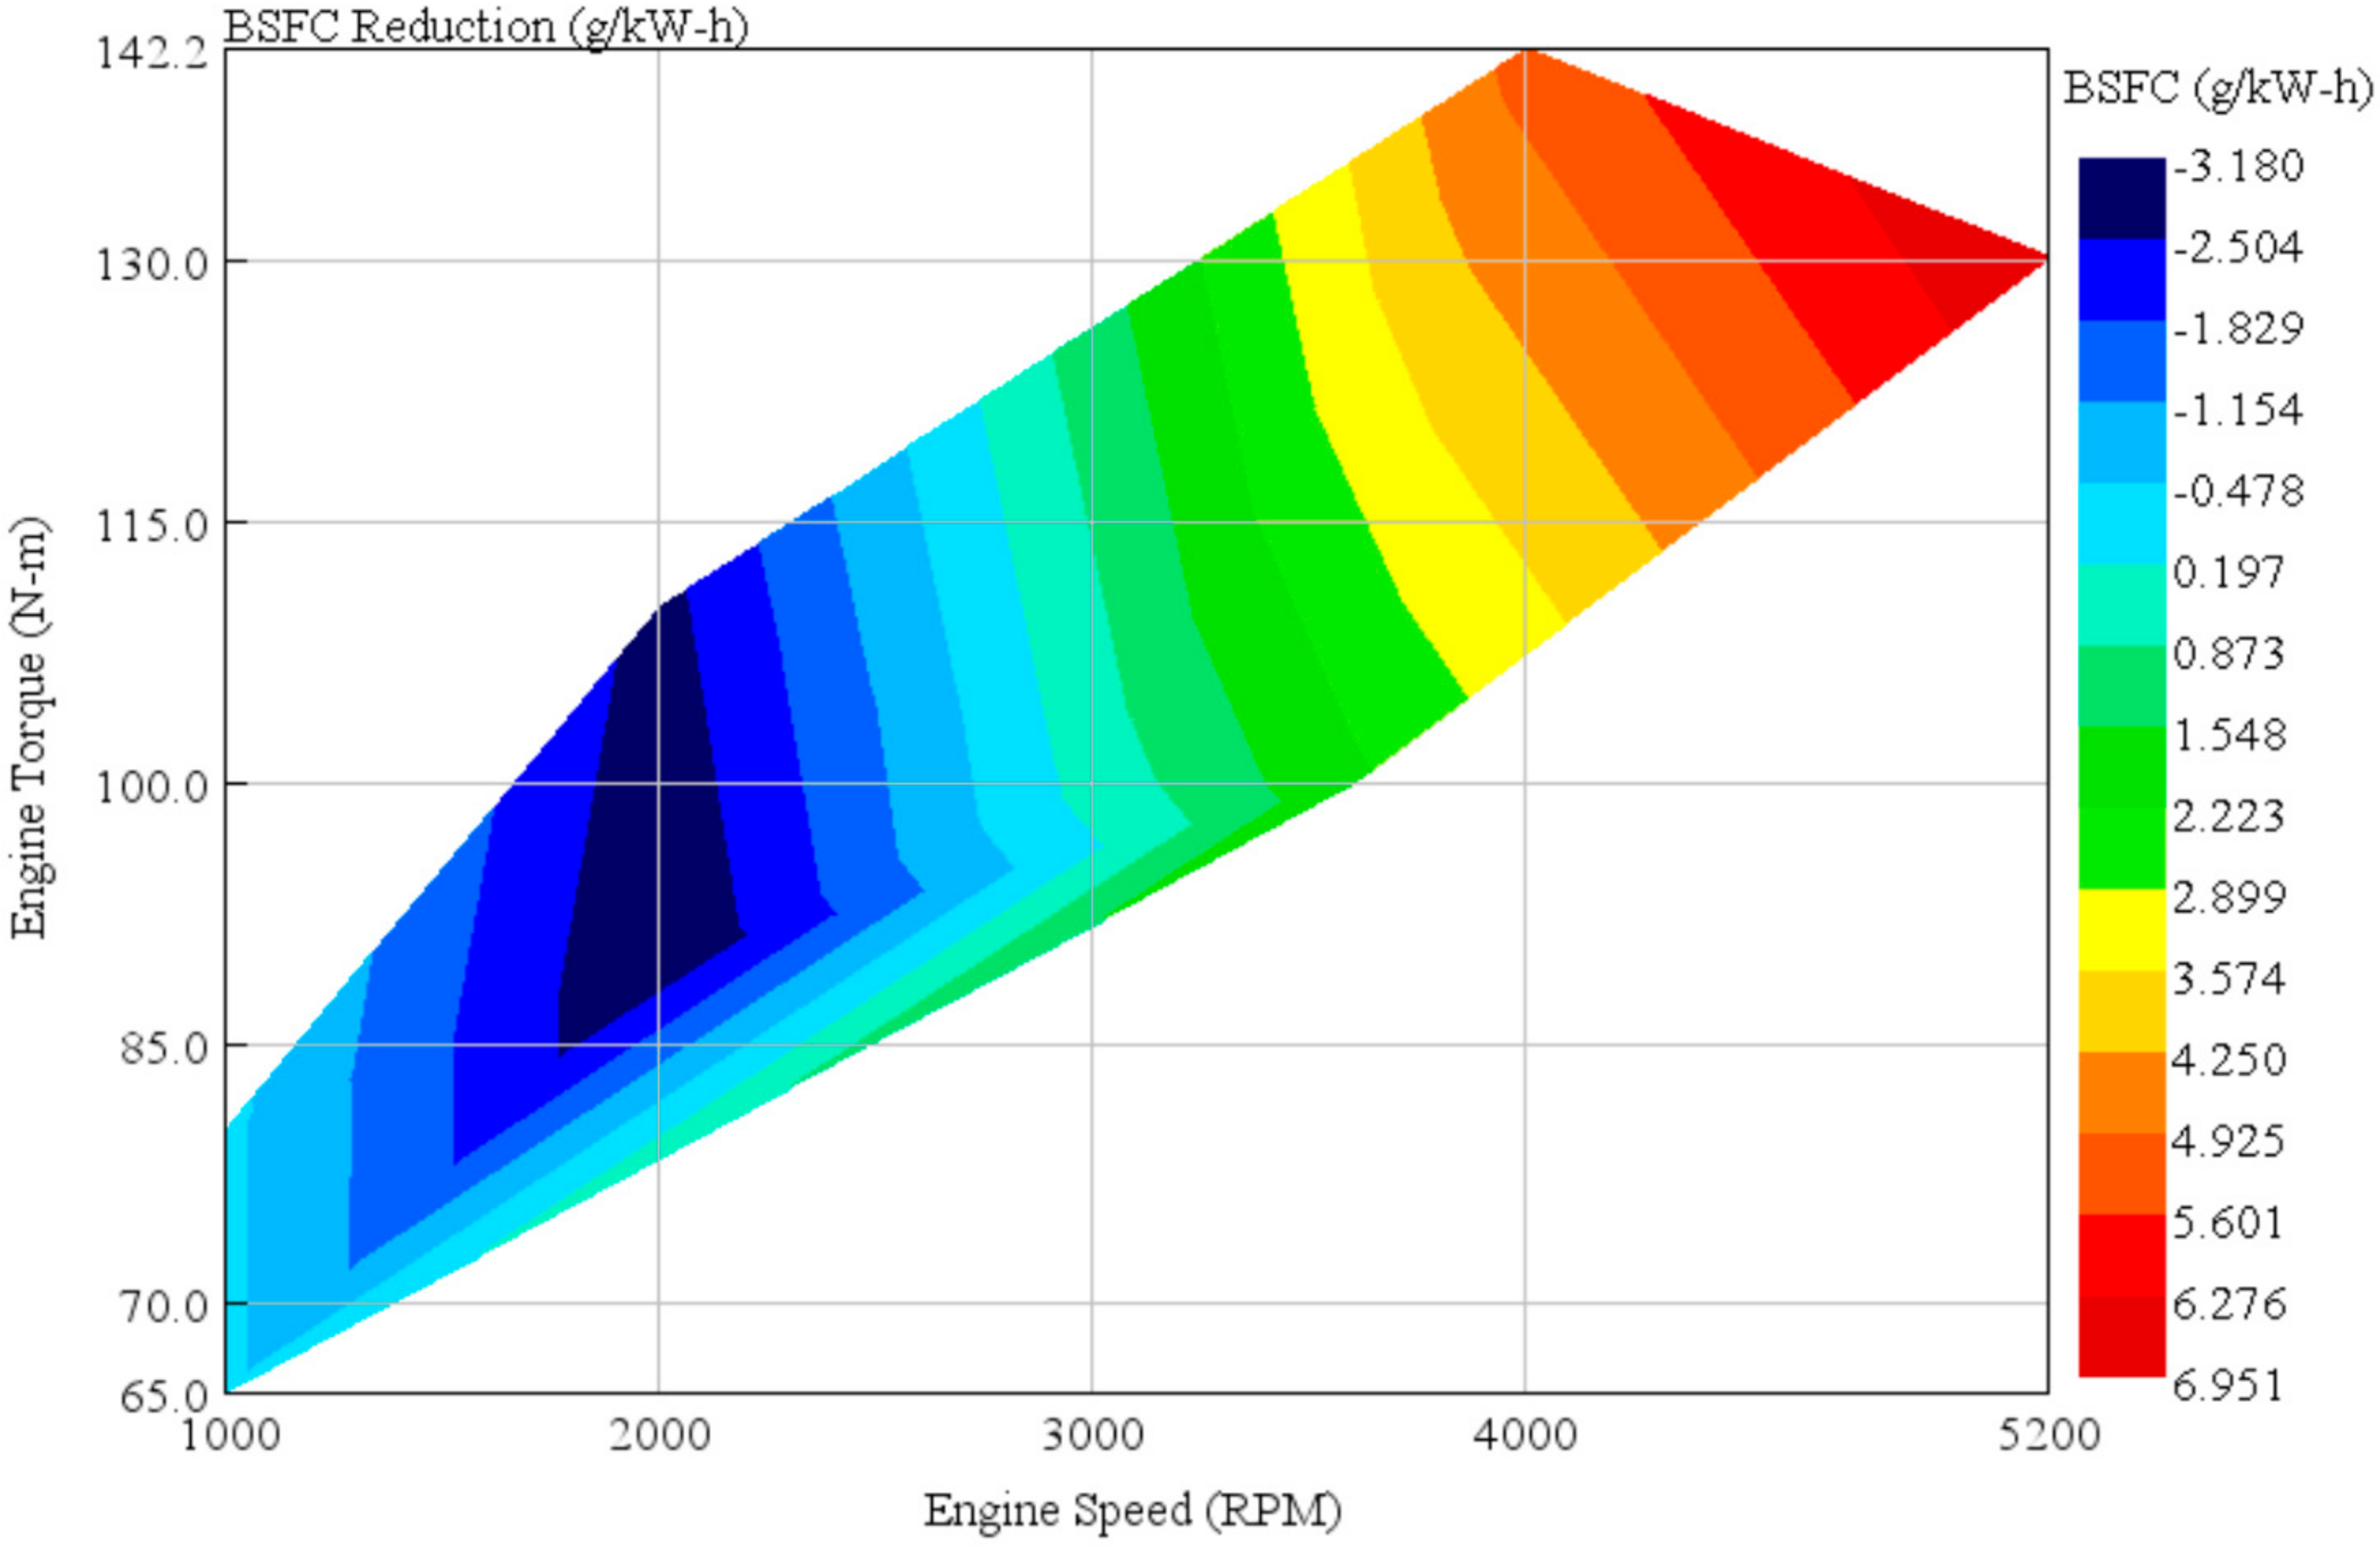
Figure 26.
Engine Thermal Efficiency Improvement.

Figure 27.
Comparison of Power Generated by the Engine.
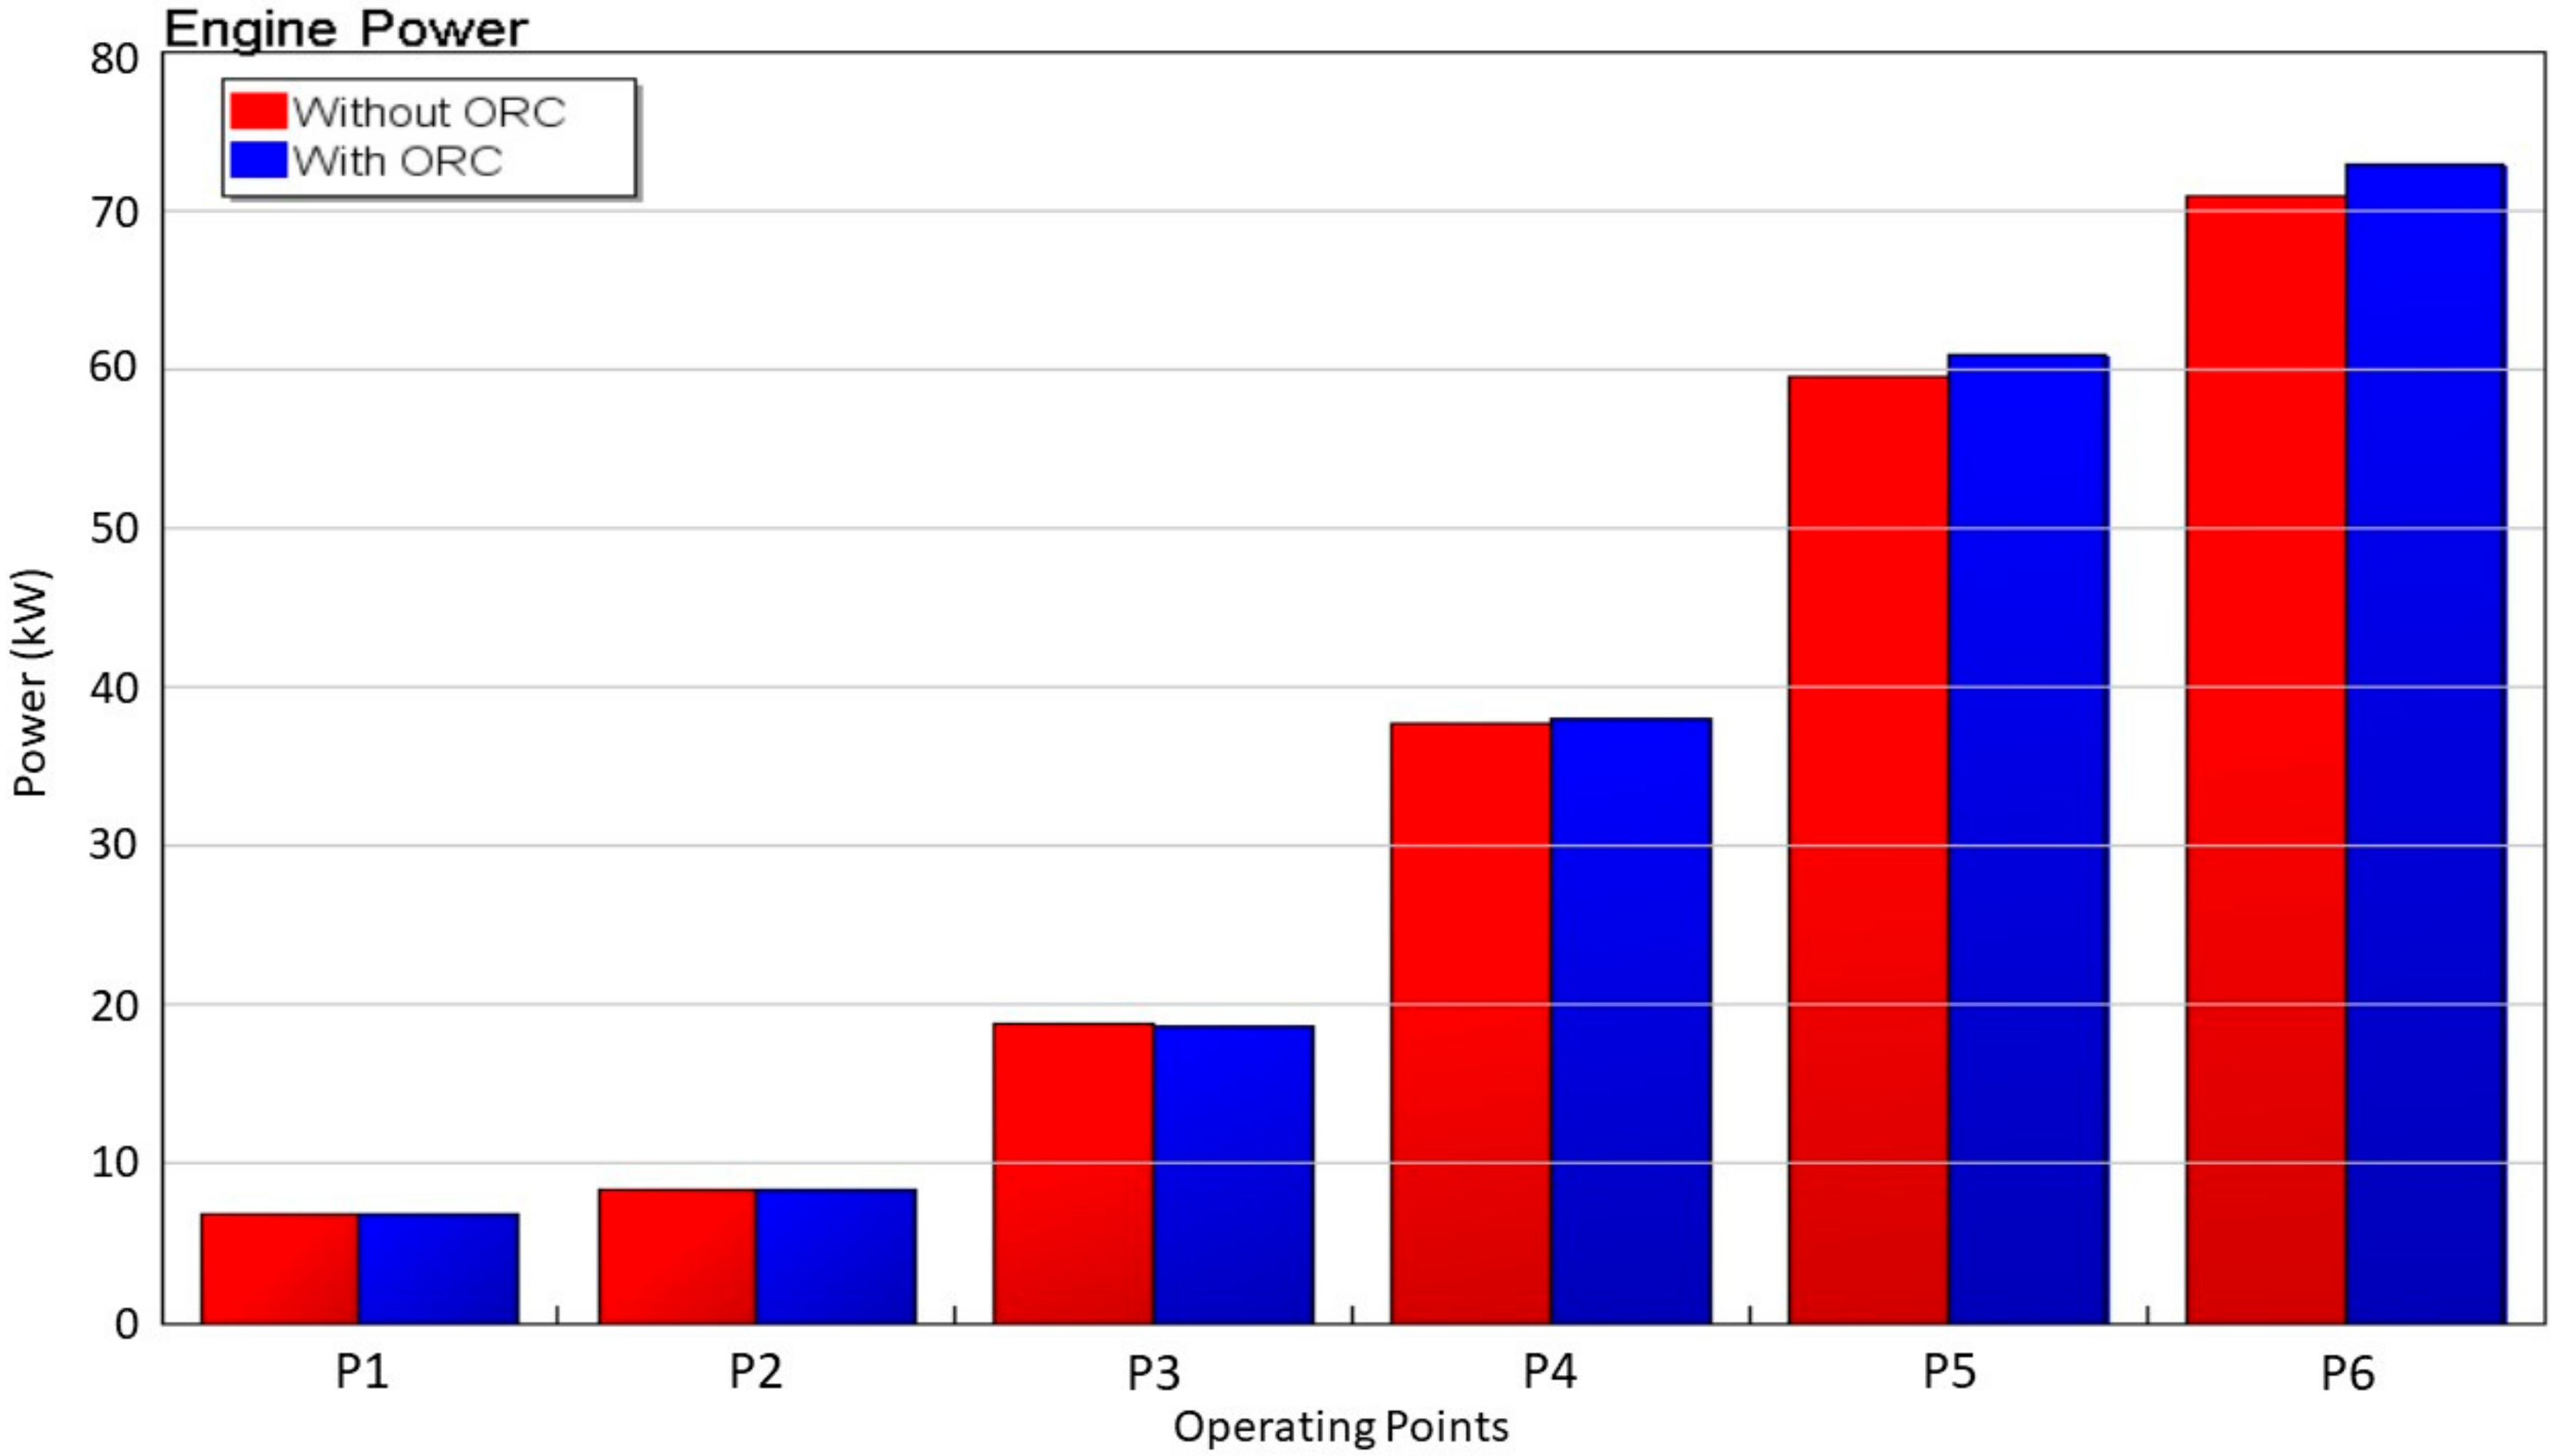
Figure 28.
New European Driving Cycle (NEDC) Driving Cycle.
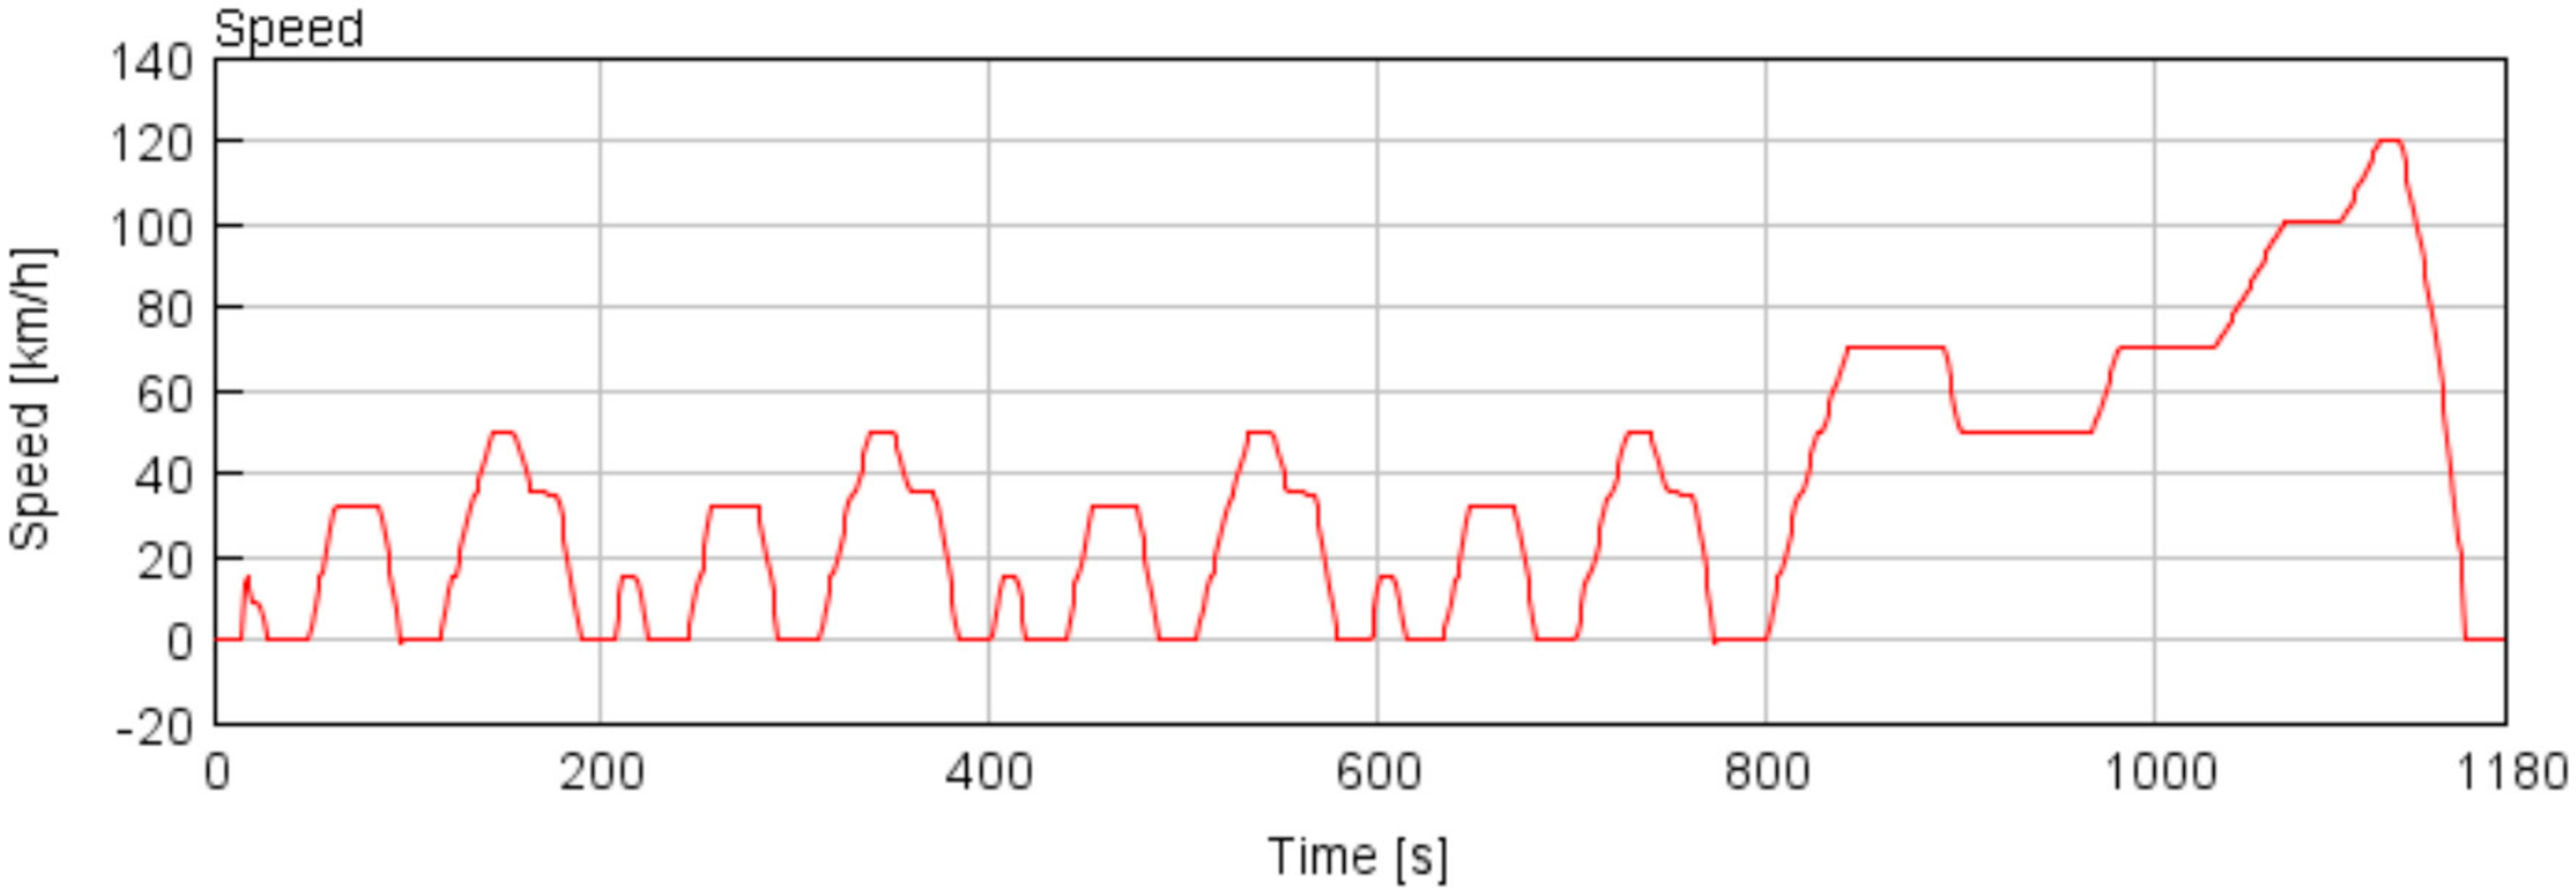
Figure 29.
Worldwide Harmonized Light Vehicle Test Cycles (WLTC) Driving Cycle.
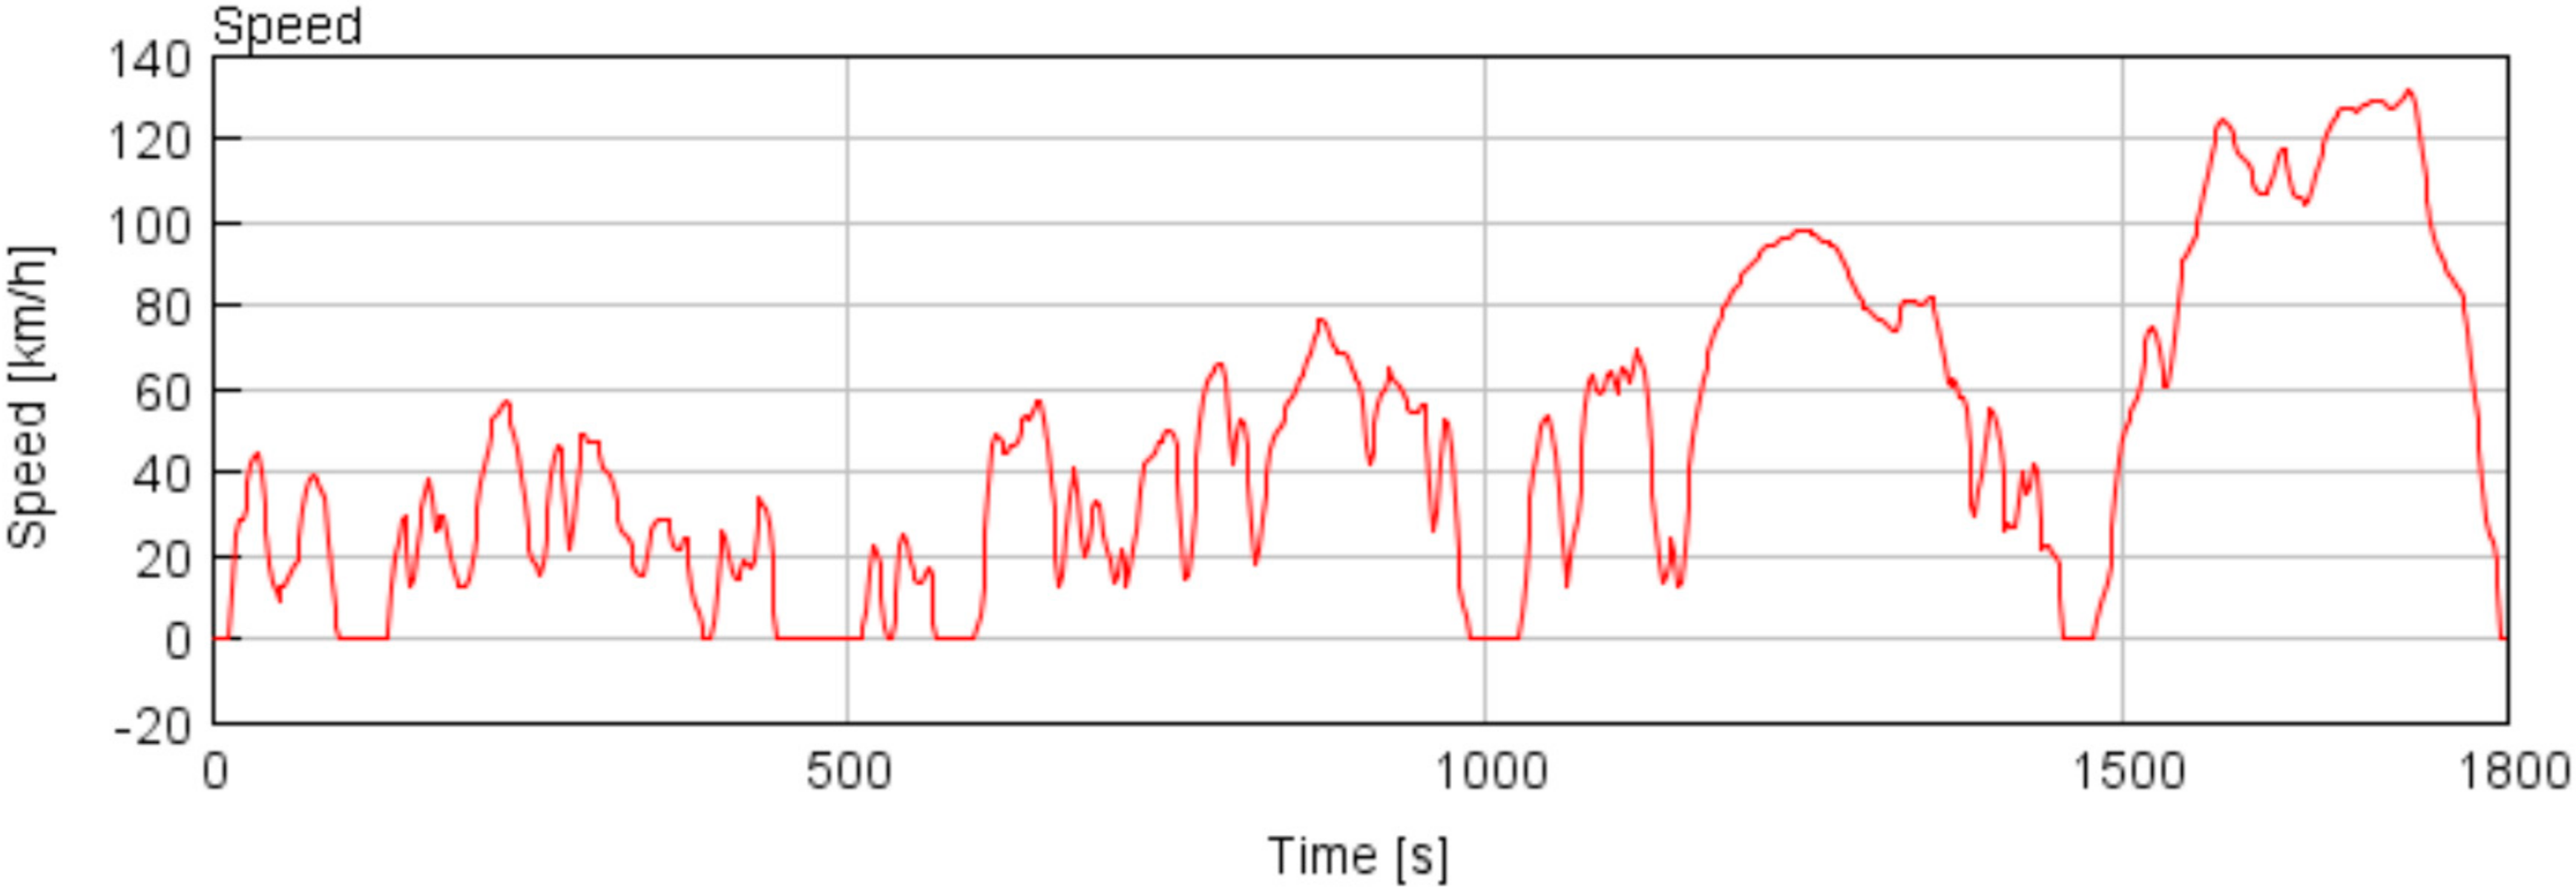
Figure 30.
Battery State of Charge in NEDC.

Figure 31.
Battery State of Charge in WLTC.

Figure 32.
Comparison of Fuel Consumption per Driving Cycle with and Without ORC.


Table 1.
Case setup for the engine model.
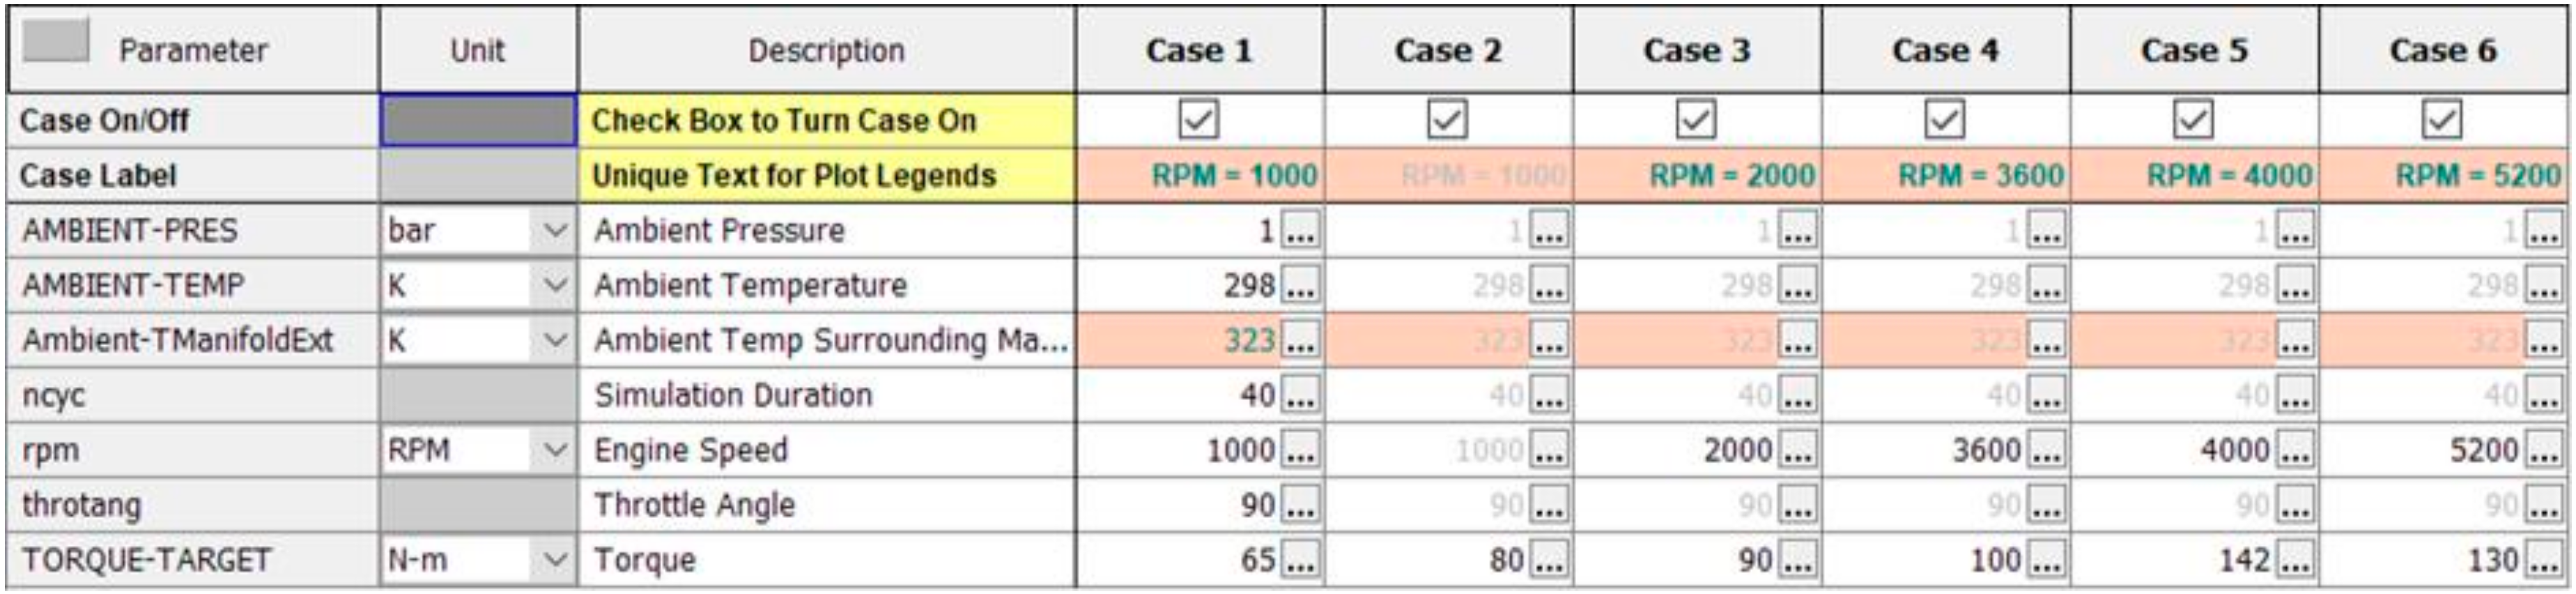
Table 2.
Engine Specifications.
| Engine Specifications | |
|---|---|
| Engine code | 2ZR-FXE |
| Type | 4-cylinder, in-line (1.8-L Atkinson cycle petrol I4) |
| Valve mechanism | DOHC 16-valve with VVT-i |
| Fuel system | Electronic fuel injection |
| Displacement (cc) | 1798 |
| Compression ratio | 13.0:1 |
| Bore × stroke (mm) | 80.5 × 88.3 |
| Max. engine output (kW @ rpm) | 73 @ 5200 |
| Max. engine torque (Nm @ rpm) | 142 @ 4000 |
Table 3.
Engine Model Calibration at Different Operating Points.
| Engine Speed (RPM) | Torque (Nm) | Theoretical | Calibrated | Error (%) | |
|---|---|---|---|---|---|
| P1 | 1000 | 65 | BSFC: 240 g/kWh | BSFC: 237.1 g/kWh | 1.21 |
| P2 | 1000 | 80 | BSFC: 230 g/kWh | BSFC: 236.5 g/kWh | 2.82 |
| P3 | 2000 | 90 | BSFC: 220 g/kWh | BSFC: 225.7 g/kWh | 2.59 |
| Power: 20 kW | Power: 18.86 kWh | 5.70 | |||
| P4 | 3600 | 100 | BSFC: 230 g/kWh | BSFC: 232.9 g/kWh | 1.26 |
| Power: 40 kW | Power: 37.72 kW | 5.70 | |||
| P5 | 4000 | 142 | BSFC: 240 g/kWh | BSFC: 234 g/kWh | 2.50 |
| P6 | 5200 | 130 | Power: 73 kW | Power: 70.91 kW | 2.86 |
© 2020 by the authors. Licensee MDPI, Basel, Switzerland. This article is an open access article distributed under the terms and conditions of the Creative Commons Attribution (CC BY) license (http://creativecommons.org/licenses/by/4.0/).
Share and Cite
MDPI and ACS Style
Bin Wan Ramli, W.R.; Pesyridis, A.; Gohil, D.; Alshammari, F. Organic Rankine Cycle Waste Heat Recovery for Passenger Hybrid Electric Vehicles. Energies 2020, 13, 4532. https://doi.org/10.3390/en13174532
AMA Style
Bin Wan Ramli WR, Pesyridis A, Gohil D, Alshammari F. Organic Rankine Cycle Waste Heat Recovery for Passenger Hybrid Electric Vehicles. Energies. 2020; 13(17):4532. https://doi.org/10.3390/en13174532
Chicago/Turabian StyleBin Wan Ramli, Wan Rashidi, Apostolos Pesyridis, Dhrumil Gohil, and Fuhaid Alshammari. 2020. "Organic Rankine Cycle Waste Heat Recovery for Passenger Hybrid Electric Vehicles" Energies 13, no. 17: 4532. https://doi.org/10.3390/en13174532
Note that from the first issue of 2016, this journal uses article numbers instead of page numbers. See further details here.