Insights on Germany’s Future Congestion Management from a Multi-Model Approach


1
Chair of Energy Economics, Faculty of Economics and Business Management, Technische Universität Dresden, D-01062 Dresden, Germany
2
Chair of Energy Economics, Karlsruhe Institute of Technology (KIT), D-76187 Karlsruhe, Germany
3
Fraunhofer Institute for Systems and Innovation Research ISI, D-76139 Karlsruhe, Germany
4
ESA2 GmbH, D-01187 Dresden, Germany
*
Author to whom correspondence should be addressed.
Energies 2020, 13(16), 4176; https://doi.org/10.3390/en13164176
Submission received: 29 June 2020
/
Revised: 31 July 2020
/
Accepted: 6 August 2020
/
Published: 12 August 2020
(This article belongs to the Special Issue Model Coupling and Energy Systems)
Abstract
:In Germany, the political decision to phase out nuclear and coal-fired power as well as delays in the planned grid extension are expected to intensify the current issue of high grid congestion volumes. In this article, we investigate two instruments which may help to cope with these challenges: market splitting and the introduction of a capacity mechanism. For this purpose, we carry out a comprehensive system analysis by jointly applying the demand side models FORECAST and eLOAD, the electricity market model PowerACE and the optimal power flow model ELMOD. While a German market splitting has a positive short-term impact on the congestion volumes, we find the optimal zonal delimination determined for 2020 to become outdated by 2035 resulting in new grid bottlenecks. Yet, readjusting the zonal configuration would lower the ability of the market split to provide regional investment incentives. Introducing a capacity mechanism with a congestion indicator allows allocating new power plants in regions with higher electricity demand. Consequently, we find the required congestion management to be substantially reduced in this setting. However, given the large amount of design parameters, any capacity mechanism needs to be carefully planned before its introduction to avoid new inefficiences on the market side.
1. Introduction
Climate protection requires the implementation of target-oriented harmonized measures for the efficient and low-emission supply and use of energy. If the progress of the different measures becomes unbalanced, a key success factor for energy system transformation is at risk: the security of supply.
As one of the world’s leading industrial nations, Germany is aware of its responsibility for climate protection. The intense transition towards renewable energy sources (RES) causes breaks in the regionally established energy supply and consumption structures, which have to be bridged to ensure security of supply. Congestion management in the face of limited electricity transport capacities is a major challenge in this context.
In Germany, the industrial load centers are mainly located in the Southern part of the country. In their close vicinity, conventional generation centers have been established in recent decades, primarily with coal-fired and nuclear power generation. On the one hand, as part of the political decision to phase out nuclear power by 2022 and coal-fired power by 2038, substantial generation capacities in Southern Germany will be decommissioned over the next 15 years. This is, in addition to the expected electrification of industrial processes, often located in the Western and Southern part of Germany. Yet, on the other hand, the expansion of wind power has led to substantial amounts of new RES generation capacity being installed especially in the north and east of Germany. With the ongoing phase-out of conventional energy technologies, the generation and consumption centers in Germany are thus increasingly drifting apart, resulting in a locational mismatch.
Not least for reasons of public acceptance in the affected regions, the necessary grid development to adequately link the new generation centers with the historically developed demand centers is being delayed. In recent years, this has increasingly led to situations in which the transmission system operators (TSO) had to correct the market-based dispatch of power plants by redispatching of these generation capacities and even by curtailing renewable energy production units [1]. This caused considerable congestion management costs. Furthermore, substantial changes in the structure of the electricity demand are expected in the course of the coming decades. These include shifts in the economic mix of the consumer structure (e.g., relocation of industry abroad), the diffusion of efficiency technologies (e.g., lighting) and increased electricity demand for existing and new applications (e.g., fuel switch in industry, information and communications technology, heat pumps and electric vehicles). The combination of these trends will lead to both, a change in the height and shape of the system load curve and an increased volatility on the supply side through the ongoing expansion of weather-dependent RES technologies. Both phenomena have a strong impact on congestion management. Against this background, the present study is dedicated to the analysis of congestion management in Germany in a European context.
In previous research on congestion management from a regional perspective, the focus was, among other things, on the optimal definition of market zones and their influence on market results. For example, Burstedde [2] as well as Breuer and Moser [3] show that the costs of redispatching could be reduced if the market zones were oriented more towards the transmission network infrastructure and not, as is the case to date, towards national borders. Trepper et al. [4] divide the German market area according to the DENA grid regions and shows that this could reduce the redispatching volume in Germany by up to 60%. Frontier Economics and Consentec [5] analyse the effects of a division of the German market area into a northern and southern part. Market power indicators are used to examine the structural market power potential arising from this market zone division. However, the effects of changes in market prices (level and volatility) on investments relevant to congestion management in the market areas were not considered.
Studies on national market design have so far focused primarily on questions of security of supply in general and the analysis of the functioning of the energy-only market (EOM) with increasing shares of renewable electricity generation [6,7,8,9]. The effects of implementing various capacity remuneration mechanisms (CRMs) in Germany on innovation and investment are considered, e.g., in [7,9,10]. Bucksteeg et al. [10] consider the implementation of a CRM to be advantageous as it leads to a reduction of risk for investors and thus for the economy as a whole. However, the establishment of a CRM entails regulatory risks that can have a negative impact on the effectiveness and cost efficiency of the system [9,11]. Moreover, it has not yet been explicitly investigated what effects market coupling at a European level has in interaction with different market designs (EOM, CRM) on congestion management in Germany and on relevant European and national investments. In addition, there are numerous forms of electricity market designs available as options [12], so that the assessment of the most effective and efficient design must be done under changing framework conditions.
On the demand side, the majority of existing studies assume that only the volumes of annual electricity demand will change in the future, while the structure of the load curve will remain unchanged. However, ex-post analyses (e.g., for France [13]) show that the technological composition of demand has a very large influence on the shape of the load curve and the formation of peak loads and is therefore highly relevant for congestion management. The effects of changing load structures on congestion management have not yet been adequately addressed in the literature.
The present study takes up the aspects and influencing factors on congestion management in Germany that have not or only insufficiently been investigated to date and examines them using an innovative methodology. More precisely, we are using a comprehensive modeling framework that consists of four specialized models which are jointly applied and cover all relevant determinants for congestion management as outlined in the following:
- Demand models: FORECAST and eLOAD provide a high resolution for the demand in regional, technological and structural terms. The regional component as well as the technological composition have an important impact on the congestion management.
- Market model: PowerACE, an established agent-based market model, determines a detailed market dispatch of power plants as well as investments in new power plant capacity.
- Grid model: ELMOD conducts the load flow calculations of the transmission grid under consideration of future grid extensions and finally derives congestion management measures like redispatching, curtailment and load shedding.
The presented models are connected via a four step procedure, which is described in more detail in Section 2.2, and a common data set is ensured. This comprehensive approach, which aims to cover the essential aspects of congestion management simultaneously, allows us to conduct in-depth analyses on the future congestion management developments in Germany.
Hereby, we focus on two alternative congestion management strategies: market splitting and a modified CRM with an allocation component for new power plant investments that takes congestion into account. The market splitting case examines a division of the German bidding zone into two zones. In the CRM case, centralized capacity auctions are carried out in Germany, which supplement the existing EOM.
Market coupling with neighbouring electricity markets, their specific CRMs and relevant investment decisions are considered. For this purpose, four energy-related models with a different specific focus on the demand side, supply side and the grid side are jointly applied. This novel approach allows for a comprehensive system analysis with a high spatial and temporal resolution.
The remainder of this paper is structured as follows. Section 2 describes the chosen methodology in more detail and briefly introduces the modeling tools used. Section 3 is devoted to the description of the defined scenario framework and the case studies examined. Next, the results of the analyses are presented and discussed in Section 4. Ultimately, the main findings of the study are summarised in Section 5.
2. Methodology
A holistic analysis of the future need for congestion management requires to take into account several aspects simultaneously. Firstly, the challenging dynamics of the electricity demand side in the medium and long term need to be considered. Secondly, a realistic representation of the power plant dispatch on the day-ahead electricity market and investment decisions for new generation capacities have to be included. Thirdly, the market results have to be transferred to the transmission grid and an optimal power flow needs to be calculated which minimizes the costs for congestion management while maintaining system stability.
Since it is difficult to include all these relevant aspects in a single model with high temporal and spatial resolution, we develop and apply a modeling framework, in which four models are coupled. In this section, we first introduce the models applied for the demand side, electricity market and transmission grid. Afterwards, we describe in detail how these models are jointly applied and interact with each other.
2.1. Model Descriptions
In the following, the models used for our model coupling framework are presented according to our main structure: demand side, generation side and grid side.
2.1.1. Demand Side
For our analysis, we look at annual and hourly demand modelling separately and using two different simulation models. For the preparation of scenarios on the future development of annual energy demand for all energy carriers across all European countries, we use the model FORECAST [14]. The result is the annual final energy demand on national and district (NUTS 3) level. For an explanation of the classification of European regions, we refer to [15].The model is divided into industry, household, tertiary and other sectors. Although the general methodology of the respective sectoral modules is comparable (bottom-up, simulation), the structure of these modules differs considerably, depending on technological structure. Common input variables of the model are cross-sectoral and scenario-specific parameters such as economic development (measured by the gross domestic product—GDP), energy wholesale prices and the design of policy measures. Sectoral input variables include a wide range of input data, such as sectoral gross value added (GVA), industrial production, household and living area development and number of employees in tertiary sectors. The diffusion of technology in the residential and tertiary sector, e.g., the substitution of heating devices, buildings and other equipment, is modelled using a stock model approach, in which equipment is replaced according to its age. The investment decision leading to the replacement of equipment subsequently determines energy intensity and energy carrier of new equipment. Due to the heterogeneity of industrial processes, the technological diffusion in the industrial sector is modelled considering also non-rational behavior. Overall, this enables the evaluation of increased energy efficiency, electrification and the impact of policy measures in all demand sectors.
In a subsequent step, the national demand is divided into the 402 NUTS 3 regions for Germany. With sectoral distribution keys and statistical analyses, e.g., sectoral GVA, population density, industrial sites with production capacity, stock of vehicles and heating systems, the regional demand by energy carrier is modeled in high spatial resolution [16].
The model eLOAD (“energy load curve adjustment tool”) is then applied to convert the annual electricity demand projection (provided by FORECAST) to an hourly resolution [17]. It depicts the transformation of the system load and especially the development of peak loads. The hourly national electricity demand is projected into the future using a partial decomposition. The system load curve is based on historical data, including load curves, hourly temperature data and technology-specific demand profiles, as well as process- and application-specific electricity demand, combined with the corresponding demand profiles.
To model the future system load, the system load of the base year is first broken down into individual process load profiles and a remaining residual profile. The residual profile is assumed as static, i.e., it has an hourly resolution, but does not change over the years. It thus matches the total system load minus all individual load profiles. Subsequently, the process load profiles from the base year are scaled such that they correspond to the annual, technology-specific demand quantity of a target year and then combined to form the system load curve of the target year. This decomposition and subsequent reaggregation of the system load allows structural changes in the system load, triggered by technological or social change, to be identified. For further information about the model structure please refer to [17].
Hourly regional demand is initially calculated for the base year 2015. The regional load curve is then projected into the future. To model the regional hourly demand we use a regional partial decomposition consisting of four steps. By combining annual regional consumption data with hourly process load profiles, the hourly load can be broken down into process-specific “load slices” and a remaining “residual” (1). Similar to the residual profile used for the national load projection, this residual has an hourly resolution and does not change over the years. Depending on the structure of the annual demand within a region, i.e., the presence of different consumers, the hourly regional demand of the base year is calculated by reaggregating the previously derived hourly resolved load slices (2). For the years 2020, 2025 and 2035 a new decomposition (3) and reaggregation (4) is carried out analogous to the national load projection.
Overall, the detailed bottom-up modelling of the demand side with both a high temporal and geographical resolution has a core strengths. This approach allows us to include aspects like the structural change of the system load in the future as well the regional characteristic of hourly load in the assessment of load flows.
2.1.2. Supply Side
For the simulation of the electricity markets, we apply the established agent-based simulation model PowerACE. Originally developed for the analysis of the German electricity markets [18], the model has been substantially extended in the past years and now covers multiple interconnected market areas [19,20]. Moreover, PowerACE includes a representation of different CRMs [21], which enables us to investigate the effect of changes in the electricity market design. Although the model has a long-term focus and covers time horizons ranging as long as from 2015 up to 2050, also the short-term perspective is modeled at a high temporal resolution of 8760 /.
PowerACE includes several agents which represent, e.g., generation companies or regulators. These agents follow their own goals, e.g., by deciding on the daily dispatching of their conventional power plants and storage units (short-term perspective) or by deciding on investments in new supply and storage capacities (long-term perspective). The system behaviour ultimately emerges from the individual actors’ decisions. Thus, the model has an explorative rather than a normative character, which distinguishes it from optimization models using a central planner’s perspective as typically applied for the analysis of electricity markets in the literature. This modeling perspective of PowerACE is particularly useful when investigating the impact of different electricity market designs, such as a CRM or the splitting of a price zone.
For the simulation of the day-ahead market, the supply traders of all market areas first create a price forecast, which is required to estimate the running hours of each power plant. The agents then create hourly bids for each of their power plants. The bids consider both variable and start-up costs. Additional price-inelastic bids for renewable feed-in, electricity demand and storage units are created by a single agent per market area. The bids from all market areas are then submitted to a central market operator, which maximizes social welfare by matching supply and demand bids subject to the limited interconnector capacities. Finally, all supply traders determine their individual power plant dispatch based on the outcome of the market clearing. Further details as well as a formal description of the market coupling procedure are provided in [19].
Additionally to the day-ahead market simulation, the supply agents can evaluate potential investments in new generation and utility-scale storage capacity once per simulation year. For this purpose, the agents carry out long-term price forecasts and estimate the profitability of different investment candidates. Given the mutual dependencies of the different agents’ decisions in all market areas, a complex game opens up. In an iterative procedure, a stable outcome for this game (more precisely, a Nash-equilibrium) is determined. For further details on the investment planning, please refer to [20]. The investment module of PowerACE also includes a representation of different CRMs, namely a central buyer mechanism and a strategic reserve. The implementation of these mechanisms is described in [21].
Summing up, the major model outputs of PowerACE relevant in this study are the hourly dispatch of the conventional power plants and utility-scale storage units in all market areas as well as the results of the investment planning procedure under different electricity market design settings.
2.1.3. Grid Side
The optimal power flow model ELMOD analyzes inter-dependencies between electricity generation and transmission. It covers in its basic version the European transmission grid, capacities including conventional and renewable generation as well as storage and a high spatial resolution of electricity demand [22]. ELMOD can be used to conduct a number of different analyses for instance with respect to the impacts of renewable electricity generation on the transmission grid, dispatch of power plant units, congestion management as well as investments in grid infrastructure and generation units (e.g. [23,24]). For this contribution we use ELMOD to calculate cost-minimal congestion management measures using a fixed market-based dispatch of the generation units as input.
The aim of the congestion management calculations is to determine the necessary measures to cover the regional electricity demand under consideration of the transmission grid restrictions. Thereby, the market dispatch should be adjusted as minimal as possible. For this reason, ELMOD receives as an input the hourly dispatch of all power plants from the PowerACE market simulation and the hourly electricity demand on the NUTS 3 level in Germany from eLOAD which are matched with the grid nodes. The congestion management includes three main instruments: redispatching of conventional power plants, curtailment of renewable electricity production and—as an ultimate measure—load shedding. The redispatchable power plant fleet consists of the units which are participating in the market and are dispatched by PowerACE as well as those which are reserved by the TSOs as grid reserve capacities. The following part briefly describes the implementation of the congestion management instruments in ELMOD.
The linear objective function of ELMOD, shown in Equation (1), minimizes the total costs of congestion management across all market areas .
where
- = total redispatching costs in market area m
- = total curtailment costs in market area m
- = total infeasibility costs in market area m
The energy balance presented in Equation (2) is the main restriction of ELMOD. It ensures that the electricity system is balanced at every grid node n and in every hour h. Hereby, it should be noted that the power plant set at node n includes different subsets: conventional power plants , storage units , and renewable power plants . The price-inelastic gross electricity demand is set exogenously. Moreover, the representation of the neighboring countries of Germany is simplified with an aggregated grid node per country. However, auxiliary nodes at the boarders to Germany capture the interconnector behaviour.
where
- = gross load at node n in hour h
- = storage charging of unit p in hour h (decision variable)
- = artificially added load at node n in hour h (decision variable)
- = load shedding at node n in hour h (decision variable)
- = electricity generation of power plant p in hour h (decision variable)
- = net input of the AC lines at node n in hour h
- = net input of the DC lines at node n in hour h
In order to obtain the redispatching costs , we substract the hourly power plant dispatch of PowerACE with from the endogenous generation variable of ELMOD and multiply this difference by the marginal costs of each power plant as presented in Equation (3).
To determine the required curtailment of renewable generation with , ELMOD uses the deviation of the market-based renewable generation and the generation variable which is multiplied by a curtailment penalty and leads to curtailment costs. Curtailment costs are an artificial penalty in order to prioritize renewable generation feed-in. This is according to the Renewable Energy Directive (2009/28/EC) that grants renewable generation a priority access in real time to the grid.) as shown in Equations (4) and (5).
If the grid restrictions or energy balance cannot be fulfilled by using the redispatching and curtailment instruments, ELMOD can add artificial generation or apply load shedding. More specifically, when the electricity demand exceeds the generation or transmission capacities, a certain part of the demand can be dumped through at a high penalty of = 10,000 . The very high penalty avoids unnecessary load shedding. In order to detect model failures and ensure a feasible model solution, the artificially added load can be used, also with very high specific costs of = 10,000 . These infeasible costs terms sum up to as shown in Equation (6) and are also part of the objective function Equation (1).
2.2. Model Coupling
The coupling of the four models described above is illustrated in Figure 1. This figure and the coupling procedure have first been introduced in [25]. However, for the sake of completeness, we briefly recite the main model coupling steps in the following. In the first step (a), the future electricity prices are simulated by PowerACE based on hourly feed-in profiles for different RES, detailed power plant data, and a first preliminary assumption on the hourly electricity demand. The resulting preliminary electricity prices are transferred to FORECAST, which then calculates in step (b) the future electricity demand based on investments in various technologies with underlying techno-economic parameters as described in Section 2.1.1. The resulting yearly electricity demand is used by eLOAD for compiling hourly demand profiles, which are afterwards passed to PowerACE on a zonal level and ELMOD on a nodal level. In step (c), PowerACE can calculate the hourly market power plant dispatch and the yearly development of the power plant investments for the time horizon under consideration of the new demand profiles provided by eLOAD. These PowerACE outputs are then transferred to ELMOD. Besides the results of PowerACE, ELMOD uses in step (d) also the results of FORECAST and eLOAD in order to minimize congestion management costs that may occur when the market-dispatch of power plants from PowerACE as well as the regional demand from FORECAST/eLOAD cannot be balanced due to the grid restrictions in ELMOD. Furthermore, based on the results of PowerACE and ELMOD, security of supply and system costs can be evaluated. It should be noted that there is no feedback of the congestion management results from ELMOD to the market results in PowerACE. The reason for this is that the redispatching of power plants is currently cost-neutral for operators and not based on competition. We therefore assume that the congestion management has no systematic influence on the market result in an EOM design, which is determined in our study by PowerACE.
A major advantage of this model coupling is the holistic approach, which uses different strengths of the individual models. The main reason for this is that the complexity and the new trends in the areas of energy supply and use (e.g., sector coupling, new players, technologies, infrastructure requirements) cannot be taken into account with the required level of detail within a single model approach. This complexity would no longer be manageable in a single model. In addition, a large pool of expertise for sub-disciplines can be accessed through the cooperation of specialized modelers. The comprehensive and cross-sector system view plays an increasingly important role, considering that there is a multitude of inter-dependencies along the entire energy value chain. Thus, the coupling of fundamental and detailed models to a consistent energy modeling framework is the key to adequately taking into account the enormous range of technological and institutional options and their interactions when developing sustainable energy supply strategies.
However, it is worth mentioning that besides these considerable advantages of model coupling, some challenges may occur. Essentially, these consist of mapping the different data structures and ensuring data consistency, which can be summarized as challenges of model compatibility.
In summary, the main aim and scientific novelty of the methodology used in our study does not primarily lie in the coupling of the four models presented above. Rather, this approach results in a comprehensive and simultaneous coverage of the essential aspects of congestion management, i.e., a detailed representation of demand, generation and transmission.
3. Case Study and Data
This section serves to describe the applied scenario framework, the different cases to be investigated and finally the geographical scope of the different models as well as essential data sources. We also briefly explain, how the data transferred between the different models has been mapped to stand in line with the required structures.
3.1. Scenario Definition
To achieve an ambitious mitigation level according to European and German targets for 2030 and beyond, major changes have to take place in the medium to long term, which affects all demand sectors, the power plant fleets and the transmission system.
Therefore, the paper at hand uses an ambitious scenario framework regarding the decarbonization pathway. It is mainly based on the EU Reference Scenario 2016 [26], especially for the assumptions concerning the population and economic growth as well as fuel and CO2 prices. In addition to energy efficiency, an important pillar is a fuel switch from fossil fuels to RES. As these measures are likely to be insufficient to achieve deep decarbonization especially for industry and transport, these demand sectors deploy additional strategies for significant emission reductions until 2050 that are described in Section 3.4.1.
We implement the nuclear and coal phase-out in Germany as described in Section 3.4.2. Furthermore, the renewable share of the electricity production meets the political aims and is described in more detail in Section 3.4.3. For the transmission system, the major challenge is to get the planned grid extension done on schedule, especially with regard to the high-voltage direct current (HVDC) projects in Germany. This is described in more detail in Section 3.4.4.
3.2. Investigated Cases
In the remainder of this paper, we analyze a reference case (REF) as well as two instruments aiming to reduce the required congestion management in Germany in the medium term, i.e, for the years 2025 and 2035. All three cases use the same scenario assumptions described above. An overview of the key differences between the investigated cases is provided in Table 1. Contrary to the REF case with national bidding zones, the German price zone is split into a Northern and a Southern German zone in the SPLIT case, which has previously been shown to successfully reduce congestion management volumes in the short-term [2,3,4,27]. For the analysis of this case, we rely on work from a preceding study [28], in which an optimal zonal configuration for Germany has already been determined (see Figure 2). In the CRM case, the impacts of introducing a CRM in Germany are investigated. A CRM should generally represent a supplement to the EOM, which is intended to ensure sufficient generation capacities and thus generation adequacy. Although the primary objective of a CRM is to incentivize sufficient amounts of secured capacity, such a mechanism can also be combined with a congestion indicator in order to steer the allocation of the new capacity. Thus, the implementation of a CRM could potentially also reduce the required congestion management in Germany. As shown in Table 1, we apply a simplified congestion indicator in the CRM case, which is explained in more detail in Section 3.4.2.
3.3. Geographical Scope
Although the focus of our analyses is on Germany, we also model the German neighboring countries and Italy in order to adequately consider cross-border effects. In this regard, Figure 3 shows the geographical resolution of the different models. In FORECAST and eLOAD, electricity demand is modeled on a NUTS 3 level for Germany and a NUTS 0 level for the remaining countries. PowerACE uses a zonal resolution and includes a power plant representation on unit level in all modeled countries. Moreover, each of the countries differs in terms of the implemented market design which follows the current real-world situation. In ELMOD, the electricity grid is modeled on a nodal level for Germany with auxiliary grid nodes representing the interconnected countries.
3.4. Data
The following subsections present the main data sources and required data mapping. For this purpose, we follow the structure of our modelling set up, i.e., electricity demand, conventional electricity supply, renewable electricity supply and the transmission grid.
3.4.1. Electricity Demand
The demand models FORECAST and eLOAD use various input data from different sources and additional assumptions for the modelled sectors. The main cross-sectoral parameters population and economic development, fuel and CO2 prices for energy-intensive industry are based on the EU Reference Scenario 2016 [26]. The macroeconomic framework data indicates that the industry sector is expected to continue growing until 2050. Please note that our results focus on the years until 2035, but European CO2 mitigation goals are typically defined until 2050. Thus, we first model the demand for all energy carriers over the whole time horizon until 2050 to be able to evaluate the technology mix and target achievement and then only use the electricity demand until 2035. Furthermore, lock-in technologies that actually achieve mid-term targets but prevent deep decarbonization can be identified and avoided.However, energy-intensive industries like the iron and steel industry and the non-ferrous metals industry grow below industrial average (<1% p.a.) in the scenario. Stronger growth is to be expected in non-energy-intensive sectors like engineering (incl. vehicle construction) and the food industry, which reflects structural changes towards less-energy-intensive branches.
Fuel prices in this scenario are increasing up to 2050. The annual final energy demand from the base year is validated with European and German energy balances [29,30]. Another important data source is the annual production for industry for over 60 products from [31], building stock data and heating technology share, e.g., from [32] and various other sources to validate the data and close data gaps.
In the scenario, technical potentials for energy efficiencies will be deployed on a high level. Furthermore, in the industry sector a higher CO2 price than in the EU Reference Scenario leads to mitigating process emissions from chemical reactions originating from production processes in steel and cement manufacturing by change of processes; further CO2 emissions from fossil feedstock for the chemical industry and from steam generation and industrial furnaces with high-temperature needs are decreased by use of hydrogen and electrification, respectively. Increasing the efficiency of the transport system includes a shift to lower emission transport modes, and speeding up the deployment of low-emission alternative energy sources such as electricity. The decarbonization of the residential and tertiary sectors faces major challenges with respect to the thermal renovation of the existing building stock with regard to both the depth and the rate of refurbishment together with renewable heating sources. This is achieved with a high rate of compliance to the national implementation of building and appliances performance standards, the Directive on Energy Performance of Buildings (EPBD) [33] defining building standards and the Ecodesign Directive [34] defining efficiency classes for appliances and electrical products. Above this, an additional restriction of new installation of oil boilers from the year 2030 leads to a higher market penetration of heat pumps and other RES heating technologies.
As regional parameters for the NUTS 3 regionalization of the demand we apply, amongst others, georeferenced industrial production data (see [35]), population, households and employees projections per NUTS 3 region from [36] for households and the tertiary sector, as well as regional vehicle stock statistics from [37] for private cars.
The demand data determined on the NUTS 3 level by FORECAST and eLOAD must be mapped to the grid nodes in ELMOD. For this purpose, the nodes are first filtered in such a way that only pure demand nodes remained. For instance, auxiliary nodes or those with only power plants need to be removed. Afterwards, the NUTS 3 areas that do not have any of the filtered demand transmission grid nodes are merged with a neighboring NUTS 3 region. Finally, the demand of these consolidated NUTS 3 regions is allocated proportionally to the demand grid nodes existing in the region.
3.4.2. Conventional Electricity Supply
The two models PowerACE and ELMOD use a consistent data set of the power plant fleets in 2020, the start year of the simulations. The data have been compiled from [38] for Germany and [39] for the other countries and enriched with own assumptions. While conventional power plants are modeled on a unit level for all countries in PowerACE, technology aggregated data is used in the German neighboring countries by ELMOD. All existing power plants are decommissioned based on their individual commissioning year and expected technical lifetime. For Germany, the phase-out of nuclear power until 2022 and coal-fired power plants until 2038 [40] are considered. Early decommissioning of power plants for economic reasons is not considered. Regarding investments in new conventional power plant capacity, PowerACE applies country-specific technology restrictions to account for the respective political situation. For example, investments in lignite- or coal-fired power plants can only be carried out in the Czech Republic and Poland.
The power plant capacity expansion determined by PowerACE needs to be assigned to the grid nodes of ELMOD. The general assumption behind our approach is that a former power plant site with decommissioned power plants is likely to be used also for new power plants because of the existing infrastructure, especially the grid connection and the probably already existing acceptance from the local residents. Therefore, the nodes with decommissioned power plants are sorted per market area in descending order beginning with the highest accumulated decommissioned capacity per node. The new power plant capacities in the respective market area are then allocated to the list, whereby they refill the decommissioned capacities. In periods where higher capacity investments are made than capacities are decommissioned, the ratio between these capacities is the base for the allocation to the grid nodes, meaning that higher capacities will be installed than before.
This allocation method is principally applied in all investigated cases. However, for the CRM case, we additionally apply a congestion indicator. In contrast to the REF and SPLIT case, we limit the refill of a decommissioned plant site location to the previously installed capacity. New power plant capacities beyond that limit will be installed at nodes that have had the highest positive redispatching volumes in the REF case. These nodes are sorted based on their positive redispatching volumes and the new exceeding capacities are assigned accordingly. The assumption behind that is a structural market-side generation deficit in the REF case at the identified grid nodes with high redispatching volumes. Thus, if new competitive power plants are built at these nodes in the CRM case, and hence are dispatched in the market on a regular basis, then a lower need for redispatching at these nodes tends to be reasonable. Additionally, we argue that a CRM should have some kind of congestion component, because otherwise capacities may be available in the market, but not accessible due to grid congestion.
3.4.3. Renewable Electricity Supply
The assumed electricity generation from RES on a national level is based on hourly historical profiles of the year 2015 obtained from [41] and total yearly generation values from the EU Reference Scenario [26]. Yet, in order to account for the German government’s goals of reaching a 65% share of RES generation in relation to electricity demand until 2030 and 80% until 2050, the yearly generation values are scaled accordingly. Moreover, the yearly generation in the other countries is also scaled, such that an overall RES share of 80% in 2050 across all modeled countries is reached. Please note that our results focus on the years until 2035, but European RES goals are typically defined until 2050. Thus, we first scale the RES generation over the whole time horizon until 2050 and then only use the newly derived values until 2035. For the use within ELMOD, the data on RES generation needs to be assigned to grid nodes. Thus, we first regionalize the renewable power plants based on data from [42]. Using this spatial distribution, the capacities are allocated to the closest 110 grid node and then assigned via a power transfer distribution factor (PTDF) matrix to the transmission grid nodes. One backdrop of this method is that the relative share of renewable capacities of every node stays fixed over time. An analysis of renewable expansion potentials has not been applied in this contribution.
3.4.4. Transmission Grid
As previously described and shown in Figure 3, ELMOD represents the transmission grid on a nodal level in Germany and using aggregated auxiliary nodes in the other countries. Contrary, for the day-ahead market simulation with PowerACE, the electricity exchange between different countries is limited by fixed maximum transfer capacities and intra-zonal grid constraints are not considered. This corresponds to the current real-world market clearing process applied in Europe. The extension of the future grid is generally based on data from the Ten-Year Network Development Plan [43]. However, given the current delays of the HVDC projects in Germany, we assume these projects to be finalized five years later than stated in the official plans.
4. Results and Discussion
In this section, we present the results of the different investigated cases. We first outline the electricity demand developments and then move on to the electricity market perspective with a focus on the power plant fleet development. Finally, we analyse the impacts of these demand side and supply side developments on the required congestion management. The section concludes with a discussion on limitations of our analyses.
4.1. Electricity Demand
4.1.1. Annual Demand
As shown in Figure 4 (left side), the annual electricity demand in Germany increases until 2035. The results of this scenario are in line with the CO2 mitigation targets of −80% until 2050. In the demand sectors residential and tertiary, the increase of efficiency can compensate the increase of electricity consumption by the diffusion of heat pumps. In the industrial and mobility sector, the influence of new technologies like electric cars and fuel switch from fossil energy carriers to electricity in industrial applications leads to an overall increase of the electricity demand especially from 2030 (approx. +26% in 2035 compared to 2020).
In the industry sector, our analysis shows that today’s available technologies are not sufficient. As in this scenario the use of carbon capture and storage (CCS) technologies is avoided, it necessitates the implementation of a variety of different ambitious mitigation options including energy-efficient and low-carbon production innovations, renewable-based electricity and hydrogen (e.g., as feedstock for the chemical industry replacing natural gas), a comprehensive circular economy and improvements in material efficiency. In order to achieve this, the current policy mix needs to be adjusted to effectively support R&D activities directed at the decarbonization of industrial production. Boosting material efficiency and a circular economy approach along the value chain also requires a broad policy mix (e.g., measures to increase recycling rate, measures to keep CO2 price signals visible along the value chain) including targeted public procurement.
In the transport sector, energy demand will change significantly if greenhouse gas emission targets are to be met. While electrification is a key solution for road transport, we model that blends of mainly imported biofuels or synthetic fuels will play a major role in aviation and navigation.
In the residential and tertiary sector, refurbishment of buildings is a prerequisite for the deployment of RES and efficient electricity-based heating technologies. Major efforts among all stakeholders are needed to increase energy efficiency in buildings and raise the refurbishment rate and depth beyond current levels. Ambitious EU-wide regulations for building standards are already in force. Heat pumps can play an important role for decarbonizing heat demand in the tertiary and residential sector. For end-user products, tightening efficiency standards in combination with the introduction of new efficiency classes will be necessary to reduce electricity demand.
Regional electricity demand differs according to the structural characteristics of the German regions as well as future regional developments. A main driver is the population development, as the rural areas in Germany will face decreasing population while urban areas and cities, especially the suburban areas, are growing. This is also visible in Figure 5 (left side). The influence on the regional demand structure depends on different factors. The industrial production areas influence the demand in the region where they are located. Especially the future growing electricity demand for energy-intensive industries like steel, cement and chemical industry will affect the demand of whole regions substantially. In rural areas, the growing demand for electric mobility and heat pumps will increase the overall electricity demand. These effects lead to an increase of over 50% in several NUTS 3 regions. In the suburbs, we observe a growing demand of the tertiary sector, particularly for cooling of buildings and servers which is not as significant as the effects by the other sectors.
4.1.2. Hourly Demand
Trends from the modelling of annual demand are directly reflected in the hourly load curves. Despite a slight increase of the total demand until 2030 (see Figure 4, right side), demand will increase less strong during the night hours. This is due to efficiency gains, especially in lighting and cross-sectional technologies. However, the diffusion of new consumers, especially heat pumps in the tertiary and household sector and private and commercial electric vehicles, affects the average profile of hourly demand over the course of the day. This is visualized in Figure 4 (left side): Electric vehicles are charged particularly during the day and increase the load during these hours. Therefore, the net effect of the demand increase is not evenly distributed over the day. Instead, electric mobility leads to an increase in the midday demand peak, while at the same time a new peak in demand develops in the early evening.
Figure 5 shows the regional change in annual demand and the maximum hourly load in comparison. It shows that a disproportionately strong increase can be expected for the latter. As already described, this is due to the fact that the load of various new applications is irregular both in the course of a day and in the seasonal course. In this way, new, stronger regional load peaks are formed, which could have a substantial impact on the required congestion management measures.
4.2. Electricity Market
Regarding the results of the electricity market simulation, we focus on the long-term development of the power plant fleets in Germany under the different market design settings described in Section 3. For this purpose, Figure 6 presents the installed capacities per technology for all cases and for a time horizon from 2020 up to 2035. As an additional reference, the peak residual demand is depicted. The peak residual demand of a given market area corresponds to the maximum hourly electricity demand not covered by renewable generation. Please note that decommissioning of existing power plants is exogenously defined. The different generation units are gradually decommissioned based on the respective date of initial operation and the assumed technical lifetime. The decommissioning remains unchanged across all scenarios. Contrary, model-endogenous investments in new capacity can be carried out by the supply agents modeled in PowerACE (see Section 2.1.2). These decisions are largely affected by the respective assumptions regarding electricity market design in the different cases and market areas.
The first thing to notice across all cases is the sharp decline in nuclear power until 2022 as well as lignite- and coal-fired generation throughout the simulation period. This finding is related to the political decisions of the German government to phase-out nuclear power by 2022 as well as lignite- and coal-fired generation by 2038 [40], which are implemented in PowerACE. Moreover, despite the assumed strong increase in renewable electricity generation, the lack of simultaneity with the (growing) electricity demand leads to the peak residual demand rising from 78 in 2020 to 92 in 2035. Consequently, strong financial incentives exist for the modeled supply agents to invest in substantial amounts of new gas-fired generation capacity. In contrast, due to a lack of arbitrage potential on the day-ahead market and high investment expenses as compared to conventional power plants, no investments in utility-scale battery storage are carried out until 2035.
In the SPLIT case, we can observe a development of the German power plant fleet that is almost identical to that of the REF case in terms of total installed capacities. What differs, however, is the allocation of those capacities within Germany (see Figure 7). While newly built power plants are distributed equally across the single German price zone in the REF case, we find a substantial bias towards the Southern German price zone DES and against the Northern German price zone DEN in the SPLIT case. The reasons for this finding are extensively discussed in a preceding study [28], thus, we only recite the basic idea here: When splitting the German market area into two price zones, a limit is set on the transmission capacities between DEN and DES and grid bottlenecks become visible in the market to a certain extent. In consequence, the price zone DES suffers from higher electricity prices since less wind generation can be imported from DEN. The higher prices in turn increase the investment incentives for building new conventional power plants in DES. Thus, the majority of new power plants is built in DES rather than in DEN under a zonal splitting.
From a modeling perspective, the implementation of a CRM corresponds to setting a minimum target of secured generation and storage capacity which then needs to be procured, e.g., in a centralized auction. Against this background, Figure 6 also shows how the installed conventional capacities develop in the CRM case. We can observe that under this setting, substantially more investments in open cycle gas turbines (OCGTs) are carried out than in the REF case. At the same time, these investments partially substitute investments in combined cycle gas turbines (CCGTs) at a later point in time, because a so-called lock-in effect occurs. Given the lower fixed costs of OCGTs as compared to CCGTs, the introduction of a CRM leads to a technology shift towards OCGTs, as these units are able to bid cheaper into the capacity auctions. This result is confirmed in a recent study [44] which finds that bundling CRMs with call options ultimately creates a bias towards technologies with lower fixed costs and higher operating costs.
As described in Section 2.2, the simulated developments of the conventional capacities in all cases are used as an input for the grid simulation with ELMOD. In the different cases investigated, not only the total installed capacity of conventional power plants differs, but also the technological composition (particularly in the CRM case) and the spatial allocation (particularly in the SPLIT case). These changes also strongly impact the required congestion management, which is analysed in the following.
4.3. Congestion Management
The congestion management results from ELMOD are first analyzed for the REF case. For the year 2025, we first investigate the impact of a delay of the planned HVDC projects on the required congestion management. Like this, we want to increase the awareness for the importance of these projects. Then, we move on to the deviations of the SPLIT and CRM cases in contrast to the REF case, explain them and derive some important insights.
What we could already see in the results of the demand development in Section 4.1 is a significant increase from 536 in 2020 to 673 in 2035. This goes along with higher peak loads as shown in Figure 4. However, the spatial distribution is crucial for the congestion management. As can be seen in Figure 5, the increased demand has a focus in Western and Southern Germany. Meanwhile, stagnating demand is more likely in the northeast. This trend tends to exacerbate the North-South bottlenecks in Germany.
From the market results of PowerACE and in particular the expansion of the power plant fleet, no bottleneck-reducing effect can be expected in the REF case despite the considerable expansion until 2035 that Figure 6 shows. This is due to the fact that no congestion management signal is used to allocate new power plants. In this respect, the existing or decommissioned power plant locations will be replenished. This is useful, e.g., at the former nuclear power plant locations in Southern Germany. Yet, former lignite- and coal-fired power plants in Central and Northern Germany are also being replenished, which cannot make a positive contribution to eliminating the structural North-South bottlenecks. Thus, it can be expected that the congestion volumes for the REF scenario increase over the time.
In order to make the development of the congestion volume over time and between the different cases more comparable, we introduce the gross congestion volume indicator. It accumulates all congestion measures carried out in absolute terms and thereby comprises negative redispatching, positive redispatching and curtailment volumes. Similarly, when we use the term redispaching volume, we refer to the negative plus positive redispatching volumes in absolute terms, respectively. The idea behind this procedure is that every congestion management action, positive or negative, is an intervention in the market dispatch result.
4.3.1. Reference Case (REF)
For the REF case, Figure 8 shows an increase from 30 of gross congestion volume in 2020 to 37 in 2035. As stated above, the increased demand, especially in Southern Germany and new generation capacities that are not allocated in a congestion reducing manner are contributing to that development. Further reasons are on the one hand additional wind capacities installed in the North and on the other hand the assumed 5-year delay of the HVDC projects (cf. Section 3.4.4), which has a major impact on the results in 2025. The resulting effect can be seen in particular in the increase of the curtailment volumes from 8 in 2020 to 17 in 2025 in Figure 8. However, by 2035, all HVDC projects are assumed to be realized in Germany. Thus, the curtailment volumes in particular for wind power decrease despite the additional wind generation capacities in the North.
In that context, the comparison with an on-schedule realization of the HVDC projects brings additional insights, which can be seen on the right side of the same figure. It can clearly be seen that the planned HVDC projects would almost completely remove congestion in 2025 if available by then. 14 less curtailment is the main reason for this positive and major effect, where the total congestion volume drops by 80%. This result shows the high importance of the HVDC projects for tackling the North-South grid congestion in Germany.
However, it should be noticed that the original reasons for the congestion—the spatial incompatibility of generation capacities (wind and conventional power plants) as well as high load areas in the south and west of Germany—persist and regarding the wind generation are getting even more critical. Therefore, even if the HVDC projects were realized on schedule, already in 2035, we can again observe a tremendous increase of congestion volumes compared to the almost congestion free situation in 2025. In this context, Figure 9 presents the high utilized transmission lines, which are defined by the number of hours in 2035 where the utilization is higher than 90% of the transmission line capacity. We can clearly see the extremely high utilization of the HVDC lines as well as AC lines in the North and interconnectors, especially to Denmark, Austria and France. Additionally, the curtailment volumes are marked with blue circles and the positive redispatching volumes in green. Ultimately, the illustration shows the above mentioned North-South congestion in Germany again, despite the realized HVDC projects. Wind generation in the North of Germany, with a focus on Lower Saxony and Schleswig Holstein, is largely curtailed and positive redispatching volumes are mainly provided by southern regions of Germany, Austria and the Czech republic. Thus, in order to reduce these congestion volumes, an extension of flexibility options and probably further transmission capacities would be required.
For the REF case, we can summarize that due to increasing demand especially in the south and west of Germany, a missing congestion allocation component for new power plant capacities and a further increase of renewable generation—especially wind generation from Northern Germany—the gross congestion volumes are rising significantly until 2035. This is true despite the intensified coupling of the neighboring electricity markets and the realization of the planned HVDC projects in Germany. While the timely grid expansion of planned projects is essential in the short and mid term, in the long term it must be supplemented with additional flexibility, further grid extensions and advanced market designs or allocation instruments that account for the differences of the market and grid structure.
For this reason, as described in Section 3.2, we also analyze two cases that implement instruments for a better congestion handling and investment allocation. Firstly, we investigate a market splitting in Germany, the SPLIT case, that takes the grid congestion into account via a bidding zone reconfiguration. Secondly, we consider a CRM case, which considers a simplified grid congestion indicator for the allocation of the new capacities that exceed capacities at former power plant locations, as described in Section 3.4.2.
4.3.2. Market Splitting Case (SPLIT)
Figure 10 (left side) presents the congestion volumes of the SPLIT case as well as their differences as compared to the REF case. Significantly lower congestion volumes in 2020 (−37%) and 2025 (−29%) can be observed compared to the REF case. This result shows that the allocation effect of the market splitting for new capacity investment relieves congestion. As already shown in Figure 7 in the previous section, the decommissioning of nuclear and coal power plants has been completely compensated in the southern market area DES. Meanwhile the capacities in the northern market area DEN are declining. Hence, the pressure for negative redispatching measures in Northern Germany is also reduced.
This allocation effect of new capacity investments to DES continues and gets even stronger from 2028 onward. Regarding congestion volumes in 2035 for the SPLIT case, Figure 10 (left side) shows an increase of +25%. The main cause is an extensive structural change in the grid and the before mentioned power plant fleet which leads to new intra-zonal bottlenecks in DES. Figure 11 shows these effects for 2035. On the left side, the green circles show the additional regional capacity investments compared to the REF case and also the difference of the transmission line utilization. On the one hand, the HVDC lines are significantly relieved, but on the other hand we see a higher utilization of some critical AC lines in both German market areas, and especially in DES. The consequence is shown in Figure 11 (left side), where higher positive redispatching volumes in DES and higher curtailment volumes in DEN occur. All in all, we see that the zonal configuration becomes inefficient again in 2035. Thus, a reconfiguration of the zonal layout would be required. Yet, this could be seen as an unstable investment environment and could therefore reduce investment incentives for new power plant investment in the South. Thus, an alternative to avoid this effect is additional grid reinforcement at the newly congested transmission lines within DES.
In summary, we can state that regional price signals, from a higher number of smaller zones reconfigured with respect to intra-zonal congestion, can be a useful complement to further grid expansion. The division of the German price zone significantly lowers the congestion volumes in the medium term, but brings along new long-term risks. Thus, this solution is questionable and the bidding zone configuration would have to be readjusted or flanked by adjusted grid extensions.
4.3.3. Capacity Remuneration Mechanism Case (CRM)
An alternative to a German market splitting could be the introduction of a CRM with an allocation component, which we studied in our CRM case. Figure 10 (right side) shows that congestion volumes remain relatively stable for the CRM case until 2025 (−4%) and even decline slightly in 2035 (−16%) as compared to the REF case. Indeed, the CRM case has the lowest congestion volume in 2035 compared to REF and SPLIT. To understand this result, Figure 12 (right side) shows (with green circles) where more capacity has been installed in the CRM case compared to the REF case. Obviously, as we could already see for the SPLIT case, Southern Germany benefits largely. However, the major difference for new capacity investments between the SPLIT and CRM case can be found in Central-Western Germany, the so called “Ruhr area”. The additional capacities in the CRM case correspond to the increased demand in that area, which was already highlighted in Figure 5 in Section 4.1.
This specific demand development was not part of the bidding zone reconfiguration of the SPLIT case which has a long-term orientation that might be inflexible to react on such changes. In contrast, the CRM congestion allocation component uses a more flexible indicator as explained in Section 3.4.2. It is based on congestion in the REF case in 2035, where the newly installed power plant capacities exceed the capacities of power plant locations that were previously decommissioned. Thus, it is able to steer new capacities in areas of higher demand, which leads to lower congestion management volumes, especially to lower positive redispatching volumes in Southern Germany.
Overall, we can therefore conclude, that a CRM with a congestion allocation component can both, attract new capacities and allocate them in a targeted manner.
4.4. Discussion of Limitations
Despite tremendous modelling effort, our study still has some limitations, which we briefly address in the following. Firstly, our scenario, particularly with regard to framework assumptions and the demand side modelling, presents a consistent pathway to the future, considering incremental changes [45]. As is the nature of such trend scenarios, we do not consider unexpected events, disruptive changes and discontinuities (also referred to as “bifurcations” or “wild cards”) [46]. Although the use of discontinuities in scenario development is discussed controversially, this is criticized by some scholars as risk-averse (e.g. [47]) and could therefore be integrated in future scenarios.
The use of multiple scenario paths, rather than just one as in this contribution, is generally recommendable. However, given the computational burden of our model coupling framework approach, we deliberately chose only one scenario path. Since the focus of our paper is on congestion management and the chosen path is rather critical from this perspective, we do not consider this to be a particular issue. The critical assumptions for congestion management include, e.g., the delayed realization of the HVDC projects, a completely inflexible demand, fully available trading capacities between the market areas in every hour. In addition, some simplifications have been made in the modelling, which affect the results. This concerns, e.g., the regional distribution of electricity generation from RES, which we have assumed to follow today’s situation also in the future. In addition, the German neighboring countries are only represented as consolidated nodes in the grid and electrical neighbors such as Norway and Sweden are neglected. Especially the exchange options with Norway and Sweden could bring important benefits for the German congestion management by integrating the high wind generation amounts of Northern Germany. In this context, it should also be noted that the modelling of consumers, which currently have a very low electricity demand, but will play a major role in the transformation of the electricity system and will therefore have a substantial demand in the future, is subject to high uncertainties. This concerns in particular sector coupling technologies such as electric vehicles or heat pumps, but also hydrogen-based processes in industry. In this respect, both the level of future demand (affecting e.g., the necessary power plant capacity) and its spatial distribution (influencing power line utilization and possibly extension) are of high relevance for future research. Furthermore, effects on congestion management by different flexibility options on the demand side were not considered, as only one demand scenario is applied in the study. However, these could possibly be established to a significant extent by 2035 and ramp up until 2050 and then have considerable positive effects on the required congestion management and grid extension. What remains to be investigated is whether more regional electricity markets and extensive use of demand side flexibility options like electrolysis, e.g., for industrial hydrogen demand, might be an alternative solution or at least a reasonable complement to additional grid extension. From a modelling perspective, integrating demand flexibility into our framework is possible but depends vastly on the use of demand flexibility: If flexibility use aims at the market integration of RES, flexible demand should be shifted in order to flatten the national residual load. This could be added at the interface between the hourly demand model eLOAD and the power plant dispatch in PowerACE (both have already been demonstrated, e.g., in [48] for eLOAD and [49] for PowerACE). Alternatively, flexible demand could be applied in the local or national management of grid congestions. In this case, load shifting could be integrated into the congestion management in ELMOD, which would, however, necessitate additional data transfer between eLOAD and ELMOD.
Another interesting aspect to be examined relates to the welfare effects, which are particularly relevant for the SPLIT case. However, since we deliberately focus the present study on congestion management, we would like to refer to a corresponding analysis in [28].
In general, determining an allocation method for new generation capacities at grid nodes is challenging because of the high number of uncertainties like available sites, public acceptance, permissions and grid connection costs. Our method accounts for many of these points by preferably using former power plant sites. However, as we could see in the results, the allocation of new capacities to the grid has a huge impact on the congestion management volumes. Therefore, is must be considered that our method is not the only option of allocating the capacities.
Regarding the positive results of the CRM case it should be noted that CRMs can be shaped in a very broad way and do not necessarily contain an allocation component. We use a mechanism that includes a simplified congestion indicator as explained in Section 3.4.2. The assumption that there is a structural market-side generation deficit at grid nodes with high redispatching volumes represents the essential basis of our simple congestion indicator. This assumption can of course be questioned. Firstly, because the positive redispatching volumes show that there are already generation capacities at these nodes that are able to provide the positive redispatching. Secondly, it is also not certain that newly built power plants at these nodes will actually be dispatched in the market. However, this simple mechanism clearly leads to positive effects in our CRM results. As can be seen in Figure 12, the nodes with increased new generation capacities (green circles) compared to the REF case are primarily in areas with increasing demand over time and behind local congestion in the grid. Without this specified allocation component, the CRM case would be at most as good as the REF case. The parameters of such a congestion indicator as well as the CRM itself must therefore be carefully planned before it is introduced. Further research studies on this issue are recommended.
5. Conclusions
In this article, we investigated novel aspects of the future congestion management in Germany that previously had not or only insufficiently been researched. For this purpose, we successfully applied an innovative model coupling framework consisting of the demand side simulation models FORECAST and eLOAD, the agent-based electricity market model PowerACE and the optimal power flow model ELMOD. This novel approach enabled us to carry out a comprehensive system analysis, which includes all sectors and drivers relevant for the assessment of congestion management and uses a high spatial and temporal resolution at the same time.
Our results show that an ambitious CO2 reduction scenario requires drastic measures in all sectors. Moreover, the future hourly demand structure as well as its regional resolution affect both necessary backup capacity from conventional power plants and regional grid congestion. Against the background of the German plans to phase-out nuclear power (until 2022) and coal-fired generation (until 2038) as well as delays of the planned grid expansion, we find a high need for new conventional generation capacity in the upcoming years. At the same time, renewable electricity generation needs to be substantially increased if the political targets of a 65% share until 2030 and 80% until 2050 are to be reached. This is particularly true since the decarbonization efforts are likely to result in a significantly higher, regionally differently distributed electricity demand, as compared to today’s situation. In consequence, despite the strong interconnection of the European electricity markets, we find the curtailment of renewables to be on the rise towards 2035.
In order to cope with these challenges, we investigated two instruments aiming to reduce future grid congestion in Germany, namely a split of the German market area into a Northern and a Southern part, and the introduction of a capacity remuneration mechanism with an additional congestion indicator. While a German market splitting has a positive impact on the congestion volumes in the short term, it also brings along new long-term challenges. Given the large amount of new power plants, the expansion of renewables and the ongoing grid extension, a completely different setup exists in 2035 as compared to 2020. Thus, we find the optimal zonal delimination determined for 2020 to become outdated by 2035 resulting in new grid bottlenecks within the Southern German price zone. In consequence, the zonal configuration would have to be readjusted, which would likely reduce regional investment incentives—one of the major goals of a market splitting in the first place. Thus, a market splitting seems unlikely to solve the German congestion management issues in the long term.
If a capacity remuneration mechanism with a congestion indicator were introduced in Germany, the allocation of new power plants could be steered towards regions with higher electricity demand. In consequence, we find the required congestion management to be substantially reduced in this setting as compared to both, the reference case and the market splitting case. However, given the large amount of design parameters, such a capacity remuneration mechanism needs to be carefully planned before its introduction in order to avoid new inefficiencies on the market side. Moreover, given the ambitious European decarbonization targets and the corresponding substantial increase of renewable electricity generation that will be required, a further expansion of the transmission grid even beyond the high-voltage direct current lines currently under construction or planned for realization seems inevitable.
Author Contributions
Conceptualization, D.H., C.F., M.K., P.M., R.K.; methodology, D.H., C.F., M.K., P.M., R.K.; formal analysis, D.H., C.F., M.K., P.M.; investigation, D.H., C.F., M.K., P.M.; data curation, D.H., C.F., M.K., P.M.; writing–original draft preparation, D.H., C.F., M.K., P.M., R.K.; visualization, D.H., C.F., M.K., P.M. All authors have read and agreed to the published version of the manuscript.
Funding
The authors acknowledge the financial support of the German Federal Ministry for Economic Affairs and Energy (BMWi) under grant number 0324002A–C (AVerS—Analyse der Versorgungssicherheit in Süddeutschland unter Berücksichtigung der europaweiten Kopplung der Strommärkte).
Conflicts of Interest
The authors declare no conflict of interest.
Abbreviations
The following abbreviations are used in this manuscript:
| CCGT | Combined cycle gas turbine |
| CCS | Carbon capture and storage |
| CRM | Capacity remuneration mechanism |
| EOM | Energy-only market |
| GDP | Gross domestic product |
| GVA | Gross value added |
| HVDC | High-voltage direct current |
| ICT | Information and communications technology |
| NUTS | Nomenclature of territorial units for statistics |
| OCGT | Open cycle gas turbine |
| PTDF | Power transfer distribution factors |
| RES | Renewable energy sources |
| TSO | Transmission system operator |
References
- Bundesnetzagentur and Bundeskartellamt (Federal Network Agency and Federal Antitrust Division). Monitoring Report 2016; Bundesnetzagentur: Bonn, Germany, 2016.
- Burstedde, B. From Nodal to Zonal Pricing—A Bottom-Up Approach to the Second-Best; Number 12/09 in EWI Working Paper; Institute of Energy Economics at the University of Cologne (EWI): Köln, Germany, 2012. [Google Scholar]
- Breuer, C.; Moser, A. Optimized bidding area delimitations and their impact on electricity markets and congestion management. In Proceedings of the 2014 11th International Conference on the European Energy Market (EEM), Krakow, Poland, 28–30 May 2014; IEEE: Piscataway, NJ, USA. [Google Scholar] [CrossRef]
- Trepper, K.; Bucksteeg, M.; Weber, C. Market splitting in Germany—New evidence from a three-stage numerical model of Europe. Energy Policy 2015, 87, 199–215. [Google Scholar] [CrossRef]
- Frontier Economics Europe; Consentec GmbH. Bedeutung von Etablierten Nationalen Gebotszonen für die Integration des Europäischen Strommarktes—Ein Ansatz zur Wohlfahrtsorientierten Beurteilung—Ein Bericht für die Bundesnetzagentur; Frontier Economics Europe: London, UK, 2011. [Google Scholar]
- Elberg, C.; Growitsch, C.; Höffler, F.; Richter, J.; Wambach, A. Untersuchungen zu Einem Zukunftsfähigen Strommarktdesign —Im Auftrag des Bundesministerium für Wirschaft und Technologie (BMWi); Institute of Energy Economics at the University of Cologne (EWI): Köln, Germany, 2012. [Google Scholar]
- Frontier Economics; Consentec GmbH. Folgenabschätzung Kapazitätsmechanismen (Impact Assessment)—Ein Bericht für das Bundesministerium für Wirtschaft und Energie (BMWi); Frontier Economics Europe: London, UK, 2014. [Google Scholar]
- Nicolosi, M. Notwendigkeit und Ausgestaltungsmöglichkeiten eines Kapazitätsmechanismus für Deutschland— Zwischenbericht für das Umweltbundesamt; Number 12/2012 in Climate Change; Umweltbundesamt: Dessau-Rosslau, Germany, 2012.
- r2b Energy Consulting GmbH. Endbericht Leitstudie Strommarkt—Arbeitspaket Funktionsfähigkeit EOM & Impact-Analyse Kapazitätsmechanismen—Im Auftrag des Bundesministeriums für Wirtschaft und Energie (BMWi); r2b Energy Consulting GmbH: Cologne, Germany, 2014. [Google Scholar]
- Bucksteeg, M.; Niesen, L.; Himmes, P.; Schober, D.; Weber, C.; Baumgart, B.; Plöger, T.; Willemsen, D.; Nailis, D.; Schuffelen, L.; et al. Marktdesign für Zukunftsfähige Elektrizitätsmärkte unter Besonderer Berücksichtigung der Vermehrten Einspeisung von Erneuerbaren Energien (DESIRE)—Endbericht für das Bundesministerium für Wirtschaft und Energie (BMWi); Technische Informationsbibliothek (TIB): Essen, Germany, 2014. [Google Scholar]
- Renz, L.; Keles, D.; Fichtner, W. Modellgestützte Analyse von Designoptionen für den deutschen Elektrizitätsmarkt zur Gewährleistung der Versorgungssicherheit bei zunehmender Stromerzeugung aus erneuerbaren Energien. In Innehalten und Ausblick: Effektivität und Effizienz für die Energiewende, Proceedings of the EnInnov. 13. Symposium Energieinnovation, TU Graz, Austria, 12–14 February 2014; Bachhiesl, U., Ed.; Verlag der Technischen Universität: Graz, Austria, 2014; pp. 171–172. [Google Scholar]
- Süßenbacher, W.; Schwaiger, M.; Stigler, H. Kapazitätsmärkte und-Mechanismen im Internationalen Kontext; Internationale Energiewirtschaftstagung an der TU Wien: Vienna, Austria, 2011; pp. 1–28. [Google Scholar]
- Boßmann, T.; Elsland, R.; Lickert, F.; Wietschel, M. The German load curve in 2050: Structural changes through energy efficiency measures and their impacts on the electricity supply side. In ECEEE Summer Study Proceedings; European Council for an Energy-Efficient Economy (ECEEE): Stockholm, Sweden, 2013; pp. 1199–1211. [Google Scholar]
- Fleiter, T.; Rehfeldt, M.; Herbst, A.; Elsland, R.; Klingler, A.L.; Manz, P.; Eidelloth, S. A methodology for bottom-up modelling of energy transitions in the industry sector: The FORECAST model. Energy Strategy Rev. 2018, 22, 237–254. [Google Scholar] [CrossRef]
- Eurostat. NUTS Classification. Available online: https://ec.europa.eu/eurostat/web/nuts/background (accessed on 18 June 2020).
- Elsland, R.; Klingler, A.L.; Degner, P.; Oswald, Y.; Wietschel, M. Are current regionalisation approaches sufficient to decompose electricity demand?—A German case study. In Proceedings of the ENERDAY 2015, 10th Conference on Energy Economics and Technology, Dresden, Germany, 16–17 April 2015; TU Dresden, Ed.; Technische Universität Dresden: Dresden, Germany, 2015. [Google Scholar]
- Boßmann, T. The Contribution of Electricity Consumers to Peak Shaving and the Integration of Renewable Energy Sources by Means of Demand Response. Ph.D. Thesis, Karlsruher Institut für Technologie, Karlsruhe, Germany, 2015. [Google Scholar]
- Genoese, M. Energiewirtschaftliche Analysen des Deutschen Strommarkts mit Agentenbasierter Simulation, 1st ed.; Nomos-Verl.-Ges: Baden-Baden, Germany, 2010. [Google Scholar]
- Ringler, P.; Keles, D.; Fichtner, W. How to benefit from a common European electricity market design. Energy Policy 2017, 101, 629–643. [Google Scholar] [CrossRef]
- Fraunholz, C.; Keles, D.; Fichtner, W. Agent-Based Generation and Storage Expansion Planning in Interconnected Electricity Markets. In Proceedings of the 2019 16th International Conference on the European Energy Market (EEM), Ljubljana, Slovene, 18–20 September 2019; IEEE: Piscataway, NJ, USA, 2019. [Google Scholar] [CrossRef]
- Keles, D.; Bublitz, A.; Zimmermann, F.; Genoese, M.; Fichtner, W. Analysis of design options for the electricity market: The German case. Appl. Energy 2016, 183, 884–901. [Google Scholar] [CrossRef]
- Leuthold, F.U.; Weigt, H.; von Hirschhausen, C. A large-scale spatial optimization model of the European electricity market. Netw. Spat. Econ. 2012, 12, 75–107. [Google Scholar] [CrossRef]
- Weigt, H.; Jeske, T.; Leuthold, F.; von Hirschhausen, C. Take the long way down: Integration of large-scale North Sea wind using HVDC transmission. Energy Policy 2010, 38, 3164–3173. [Google Scholar] [CrossRef]
- Schönheit, D.; Hladik, D.; Hobbie, H.; Möst, D. ELMOD Documentation: Modeling of Flow-Based Market Coupling and Congestion Management. Available online: http://hdl.handle.net/10419/217278 (accessed on 21 May 2020).
- Hladik, D.; Fraunholz, C.; Manz, P.; Kühnbach, M.; Kunze, R. A Multi-Model Approach to Investigate Security of Supply in the German Electricity Market. In Proceedings of the 2018 15th International Conference on the European Energy Market (EEM), Lodz, Poland, 27–29 June 2018; IEEE: Piscataway, NJ, USA. [Google Scholar] [CrossRef]
- European Commission. EU Reference Scenario 2016: Energy, Transport and GHG Emissions: Trends to 2050; Publications Office: Luxembourg, 2016. [Google Scholar]
- Egerer, J.; Weibezahn, J.; Hermann, H. Two price zones for the German electricity market—Market implications and distributional effects. Energy Econ. 2016, 59, 365–381. [Google Scholar] [CrossRef] [Green Version]
- Fraunholz, C.; Hladik, D.; Keles, D.; Möst, D.; Fichtner, W. On the Long-Term Efficiency of Market Splitting in Germany; Number 38 in Working Paper Series in Production and Energy; Karlsruhe Institute of Technology (KIT): Karlsruhe, Germany, 2020. [Google Scholar] [CrossRef]
- Arbeitsgemeinschaft Energiebilanzen (Working Group on Energy Balances). Anwendungsbilanzen. Available online: https://ag-energiebilanzen.de/8-0-Anwendungsbilanzen.html (accessed on 31 August 2018).
- Eurostat. Energy Statistics Table nrg_bal_c. Available online: https://ec.europa.eu/eurostat/data/database (accessed on 31 August 2018).
- Eurostat PRODCOM. Statistics on the Production of Manufactured Goods. Available online: https://ec.europa.eu/eurostat/web/prodcom/data/database (accessed on 31 August 2018).
- Odyssee-Mure. Energy Efficiency Database. Available online: https://www.indicators.odyssee-mure.eu/energy-efficiency-database.html (accessed on 31 August 2018).
- European Parliament and of the Council of 19 May 2010 on the Energy Performance of Buildings (Recast); Directive 2010/31/EU; The Council of the European Union: Brussels, Belgium, 2010.
- European Parliament and of the Council of 21 October 2009 Establishing a Framework for the Setting of Ecodesign Requirements for Energy-Related Products; Directive 2009/125/EC; The Council of the European Union: Brussels, Belgium, 2009.
- Manz, P.; Fleiter, T.; Aydemir, A. Developing a georeferenced database of energy-intensive industry plants for estimation of excess heat potentials. In Industrial Efficiency Proceedings: Leading the Low-Carbon Transition; European Council for an Energy-Efficient Economy (ECEEE): Stockholm, Sweden, 2018. [Google Scholar]
- Bundesinstitut für Bau-, Stadt-, Raumforschung (Federal Institute for Research on Building, Urban Affairs and Spatial Development). Raumordnungsprognose 2035. Available online: https://www.bbsr.bund.de/BBSR/DE/Veroeffentlichungen/AnalysenKompakt/2015/DL_05_2015.pdf?__blob=publicationFile&v=4 (accessed on 31 August 2018).
- Kraftfahrt-Bundesamt (Federal Office for Automotives). Statistics Motor Vehicles Stock. Available online: https://www.kba.de/DE/Statistik/Fahrzeuge/Bestand/bestand_node.html (accessed on 31 August 2018).
- Bundesnetzagentur (Federal Network Agency). Kraftwerksliste. Available online: http://www.bundesnetzagentur.de/DE/Sachgebiete/ElektrizitaetundGas/Unternehmen_Institutionen/Versorgungssicherheit/Erzeugungskapazitaeten/Kraftwerksliste/kraftwerksliste-node.html (accessed on 7 August 2018).
- S&P Global Platts. World Electric Power Plants Database. Available online: http://www.platts.com/products/world-electric-power-plants-database (accessed on 6 May 2019).
- Bundesministerium für Wirtschaft und Energie (Federal Ministry for Economic Affairs and Energy). Abschlussbericht der Kommission “Wachstum, Strukturwandel und Beschäftigung”; Bundesministerium für Wirtschaft und Energie (BMWi): Berlin, Germany, 2019.
- ENTSO-E. Transparency Platform. Available online: https://transparency.entsoe.eu/ (accessed on 7 August 2018).
- Bundesnetzagentur (Federal Network Agency). EEG Master Data: Renewable Energy Installations Core Data. Available online: https://www.bundesnetzagentur.de/SharedDocs/Downloads/DE/Sachgebiete/Energie/Unternehmen_Institutionen/ErneuerbareEnergien/ZahlenDatenInformationen/VOeFF_Registerdaten/2019_01_Veroeff_RegDaten.xlsx (accessed on 4 April 2019).
- ENTSO-E. Ten Year Network Development Plan 2016: Market Modeling Data. Available online: https://www.entsoe.eu/Documents/TYNDP%20documents/TYNDP%202016/rgips/TYNDP2016%20market%20modelling%20data.xlsx (accessed on 22 August 2017).
- Mays, J.; Morton, D.P.; O’Neill, R.P. Asymmetric risk and fuel neutrality in electricity capacity markets. Nat. Energy 2019, 4, 948–956. [Google Scholar] [CrossRef]
- Ducot, G.; Lubben, G.J. A typology for scenarios. Futures 1980, 12, 51–57. [Google Scholar] [CrossRef]
- van Notten, P.; Sleegers, A.M.; van Asselt, M. The future shocks: On discontinuity and scenario development. Technol. Forecast. Soc. Chang. 2005, 72, 175–194. [Google Scholar] [CrossRef]
- Marien, M. Futures studies in the 21st Century: A reality-based view. Futures 2002, 34, 261–281. [Google Scholar] [CrossRef]
- Globisch, J.; Kühnbach, M.; Dütschke, E.; Bekk, A. The stranger in the German energy system? How energy system requirements misalign with household preferences for flexible heat pumps. Energy Res. Soc. Sci. 2020, 67, 101604. [Google Scholar] [CrossRef]
- Zimmermann, F.; Bublitz, A.; Keles, D.; Dehler, J.; Fichtner, W. An analysis of long-term impacts of demand response on investments in thermal power plants and generation adequacy. In Proceedings of the 2016 13th International Conference on the European Energy Market (EEM); IEEE: Piscataway, NJ, USA, 2016; pp. 1–5. [Google Scholar] [CrossRef]
Figure 1.
Coupling of the models FORECAST, eLOAD, PowerACE and ELMOD. Source: [25].
Figure 1.
Coupling of the models FORECAST, eLOAD, PowerACE and ELMOD. Source: [25].

Figure 2.
Delimination of the German price zone as applied for the investigation of the SPLIT case. Source: [28].
Figure 2.
Delimination of the German price zone as applied for the investigation of the SPLIT case. Source: [28].

Figure 3.
Geographical resolution of the different models applied and assumptions regarding the implemented market designs in the different countries.
Figure 3.
Geographical resolution of the different models applied and assumptions regarding the implemented market designs in the different countries.

Figure 4.
Annual electricity demand development in Germany by sector (left) and average hourly electricity demand over the course of a day (right).
Figure 4.
Annual electricity demand development in Germany by sector (left) and average hourly electricity demand over the course of a day (right).

Figure 5.
Change of maximum hourly load per region and regional annual electricity demand in the German districts in 2035 vs. 2020.
Figure 5.
Change of maximum hourly load per region and regional annual electricity demand in the German districts in 2035 vs. 2020.

Figure 6.
Simulated development of the conventional power plant capacities in Germany for all three cases REF, SPLIT and CRM. Abbreviations: CCGT—combined cycle gas turbine, OCGT—open cycle gas turbine.
Figure 6.
Simulated development of the conventional power plant capacities in Germany for all three cases REF, SPLIT and CRM. Abbreviations: CCGT—combined cycle gas turbine, OCGT—open cycle gas turbine.

Figure 7.
Simulated development of the conventional power plant capacities in the two German price zones DEN and DES in the SPLIT case. Abbreviations: CCGT—combined cycle gas turbine, OCGT—open cycle gas turbine.
Figure 7.
Simulated development of the conventional power plant capacities in the two German price zones DEN and DES in the SPLIT case. Abbreviations: CCGT—combined cycle gas turbine, OCGT—open cycle gas turbine.

Figure 8.
Congestion volumes for Germany in the REF case.

Figure 9.
Lines in Germany with high utilization in the REF case and year 2035.

Figure 10.
Congestion volumes for Germany and differences in the SPLIT case (left) and CRM case (right) as compared to the REF case.
Figure 10.
Congestion volumes for Germany and differences in the SPLIT case (left) and CRM case (right) as compared to the REF case.

Figure 11.
Regional distribution of the new power plant capacities (left) and congestion management measures (right) in the SPLIT case as compared to the REF case.
Figure 11.
Regional distribution of the new power plant capacities (left) and congestion management measures (right) in the SPLIT case as compared to the REF case.

Figure 12.
Regional distribution of the new power plant capacities (left) and congestion management measures (right) in the CRM case as compared to the REF case.
Figure 12.
Regional distribution of the new power plant capacities (left) and congestion management measures (right) in the CRM case as compared to the REF case.


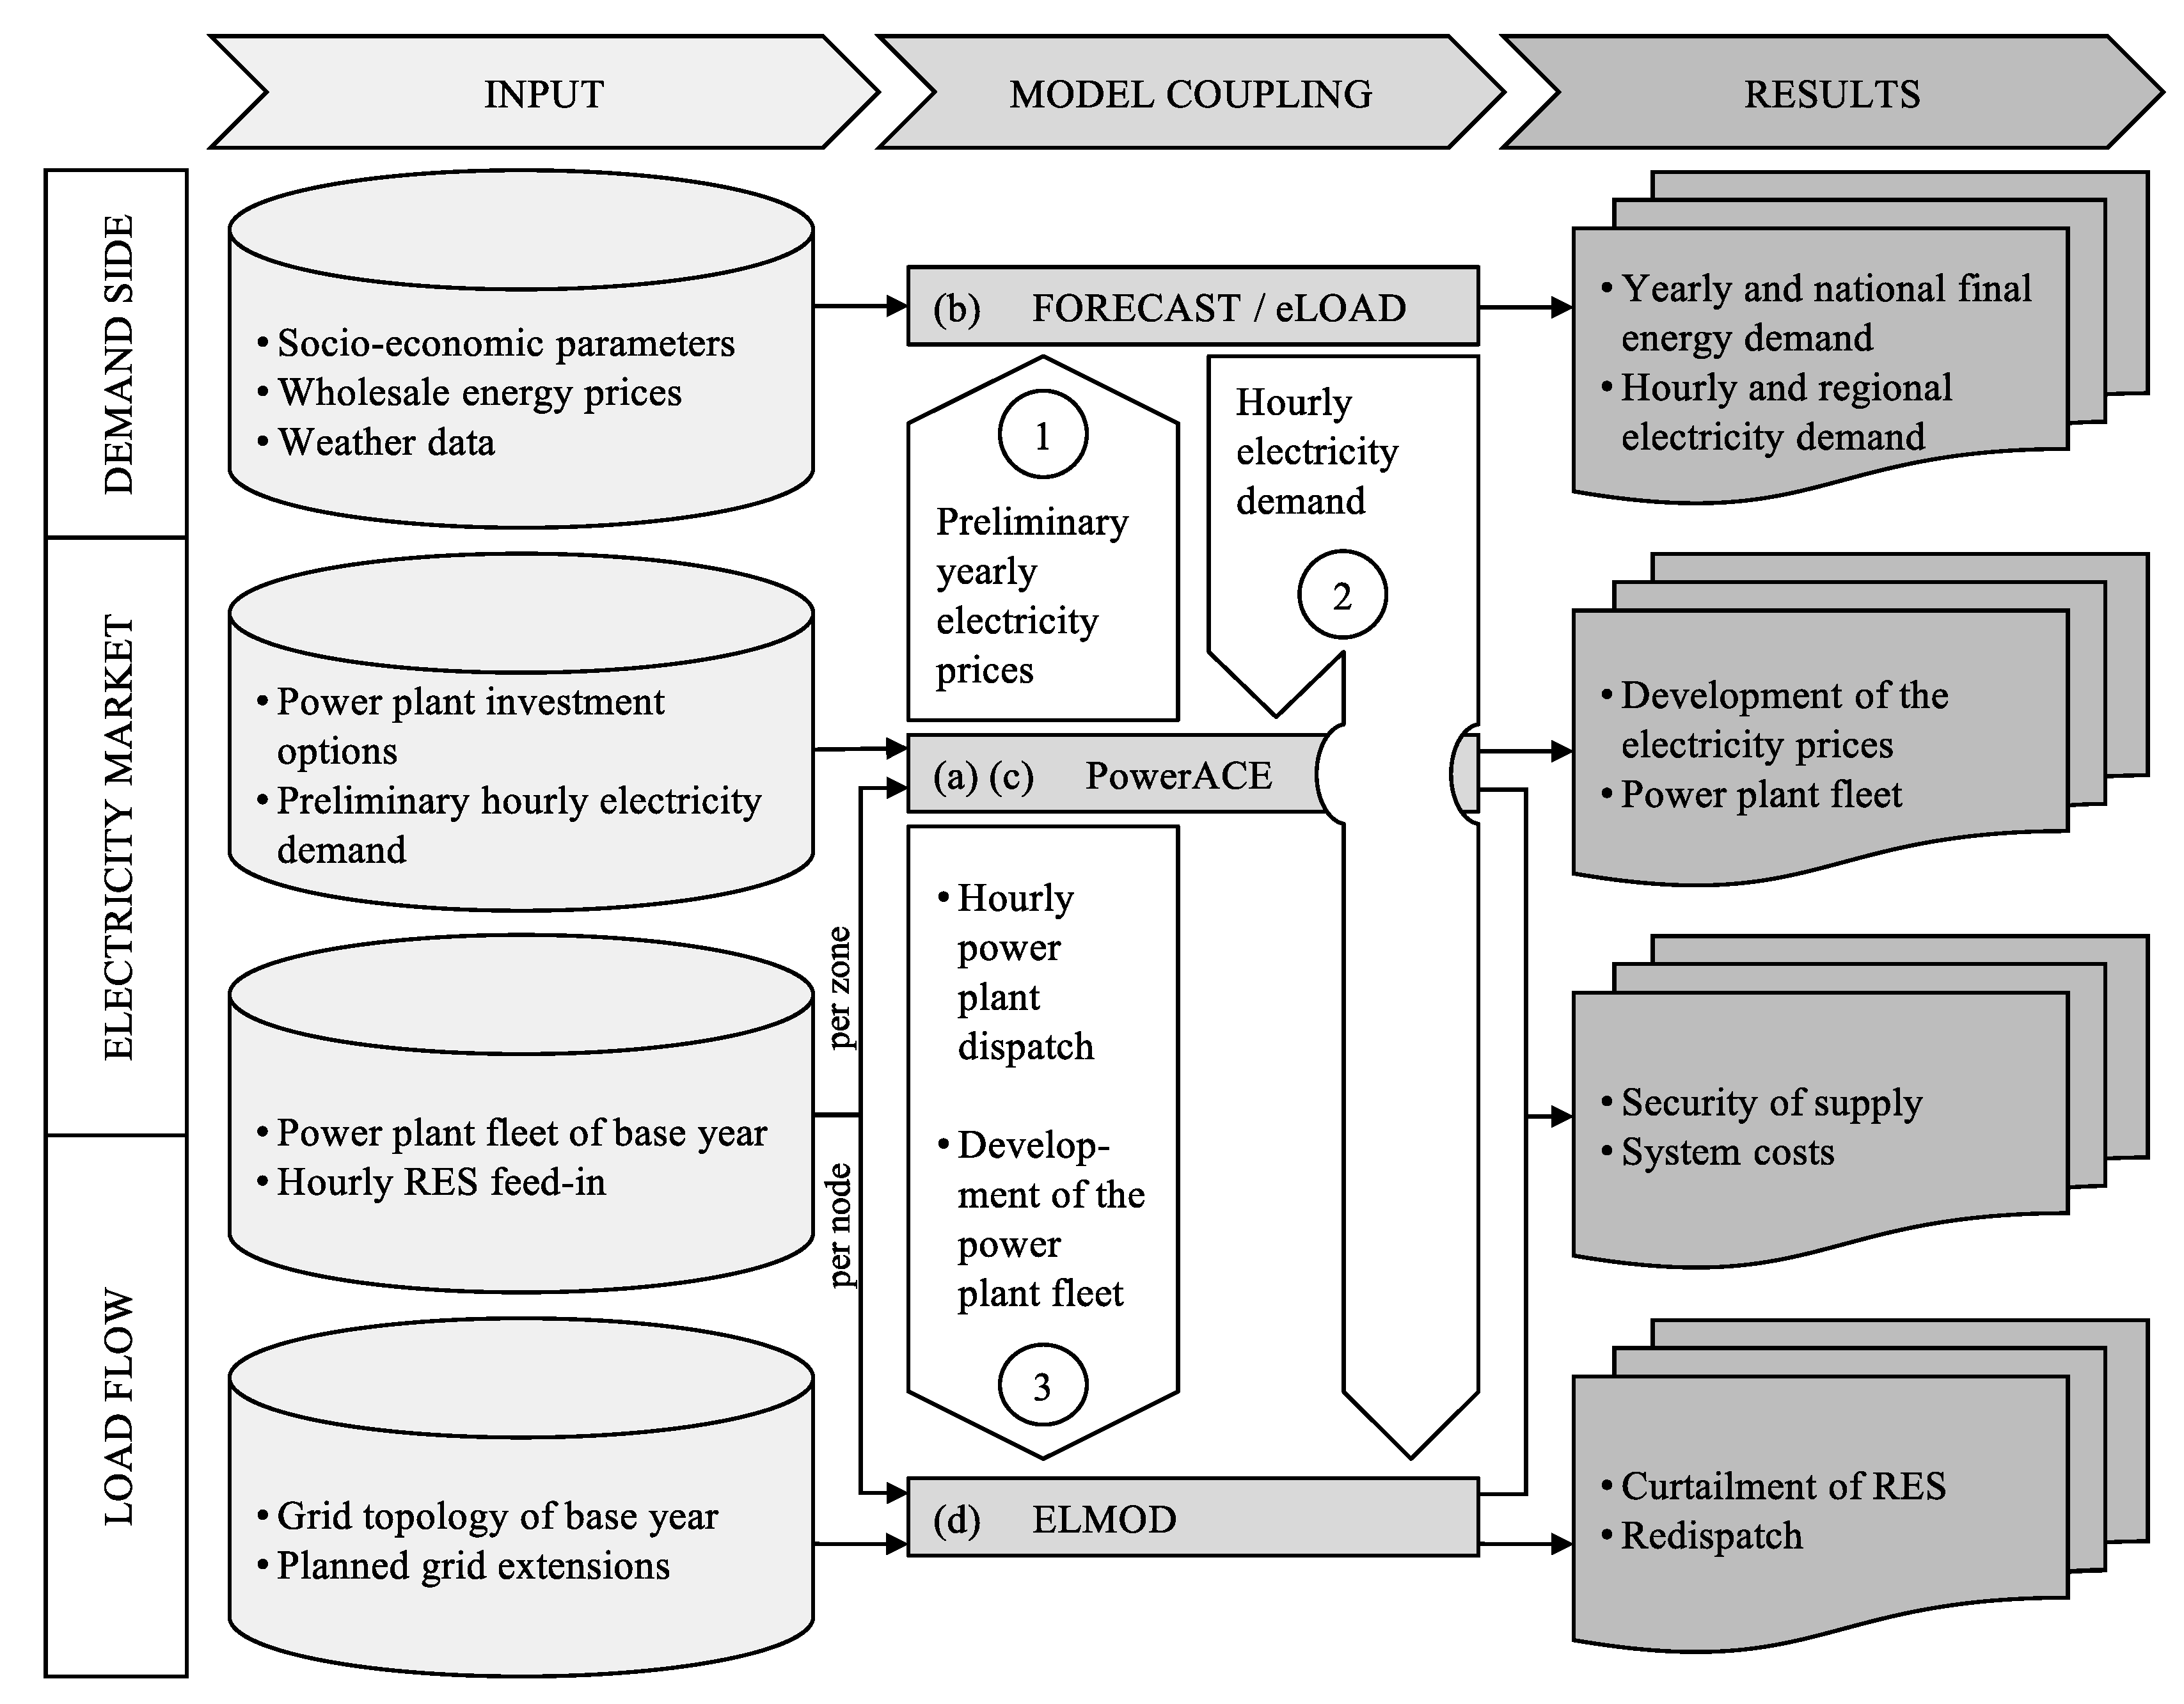
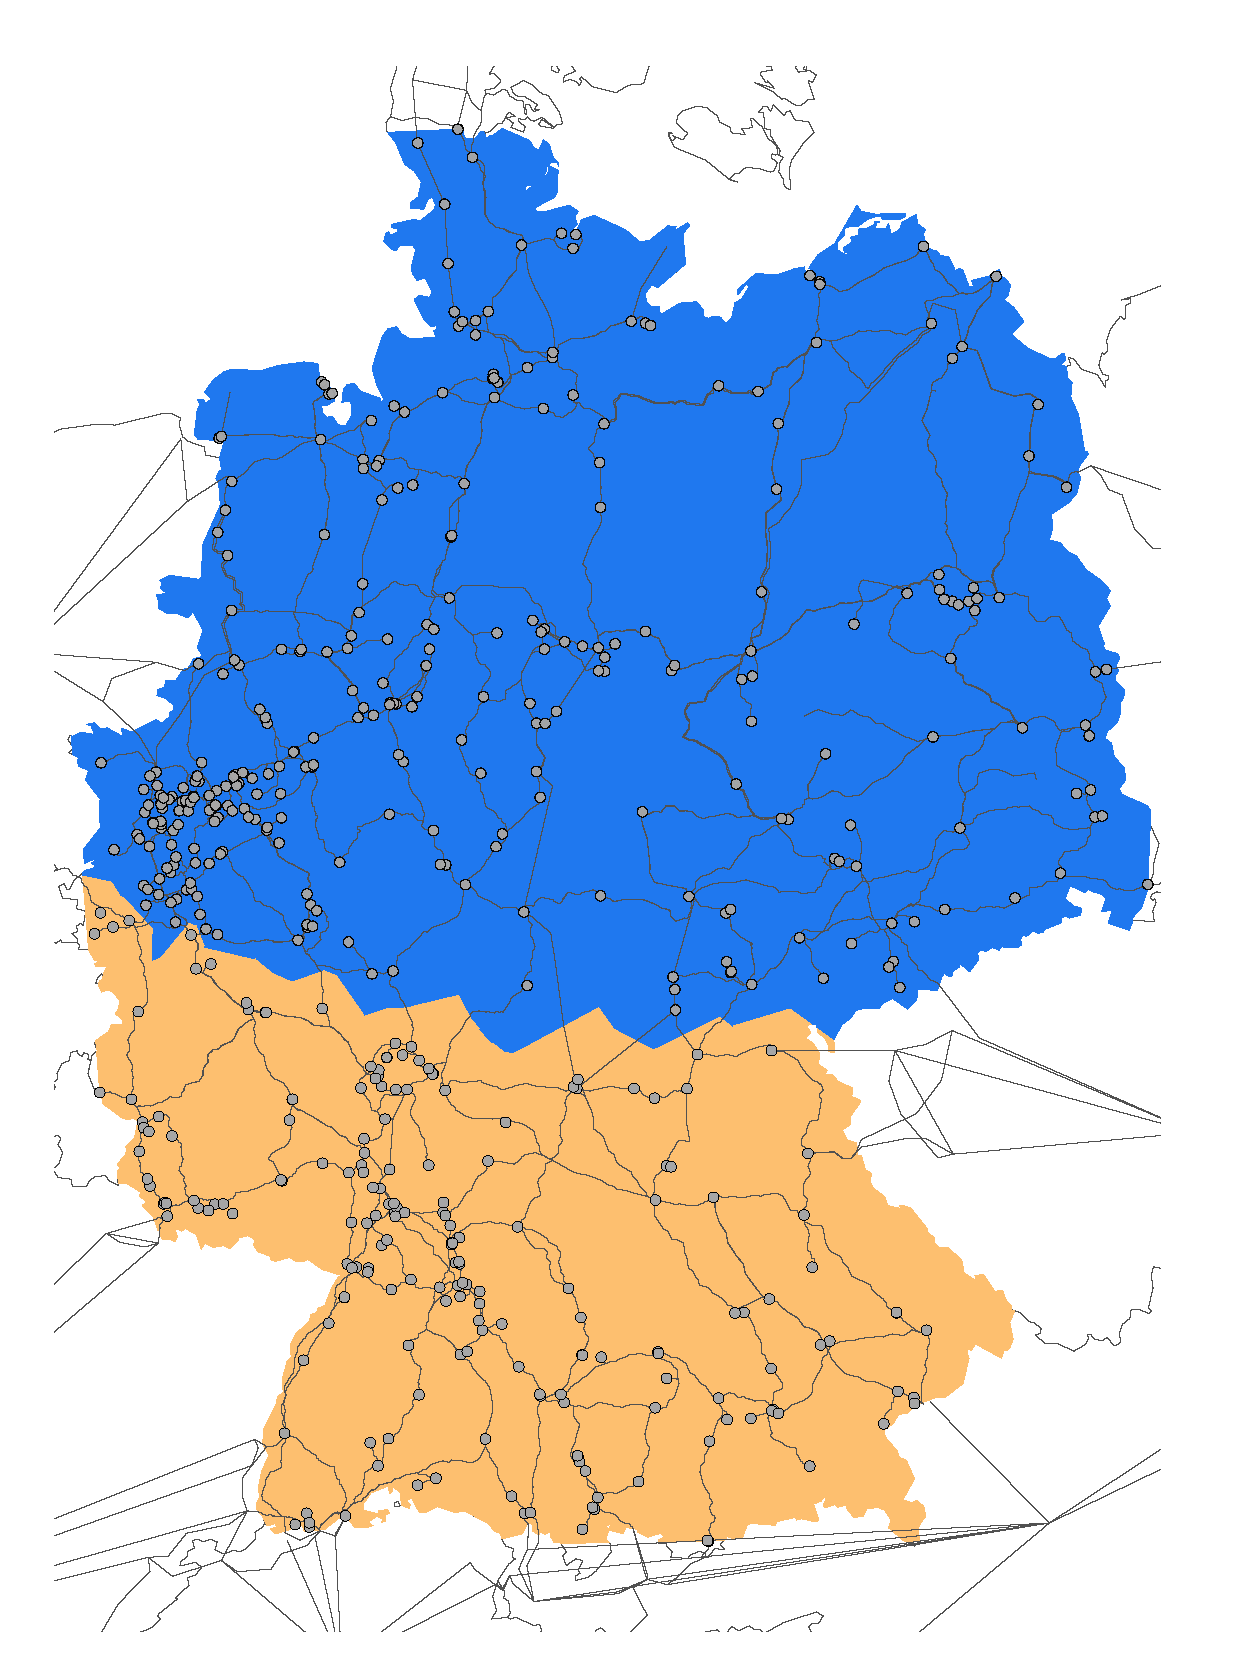
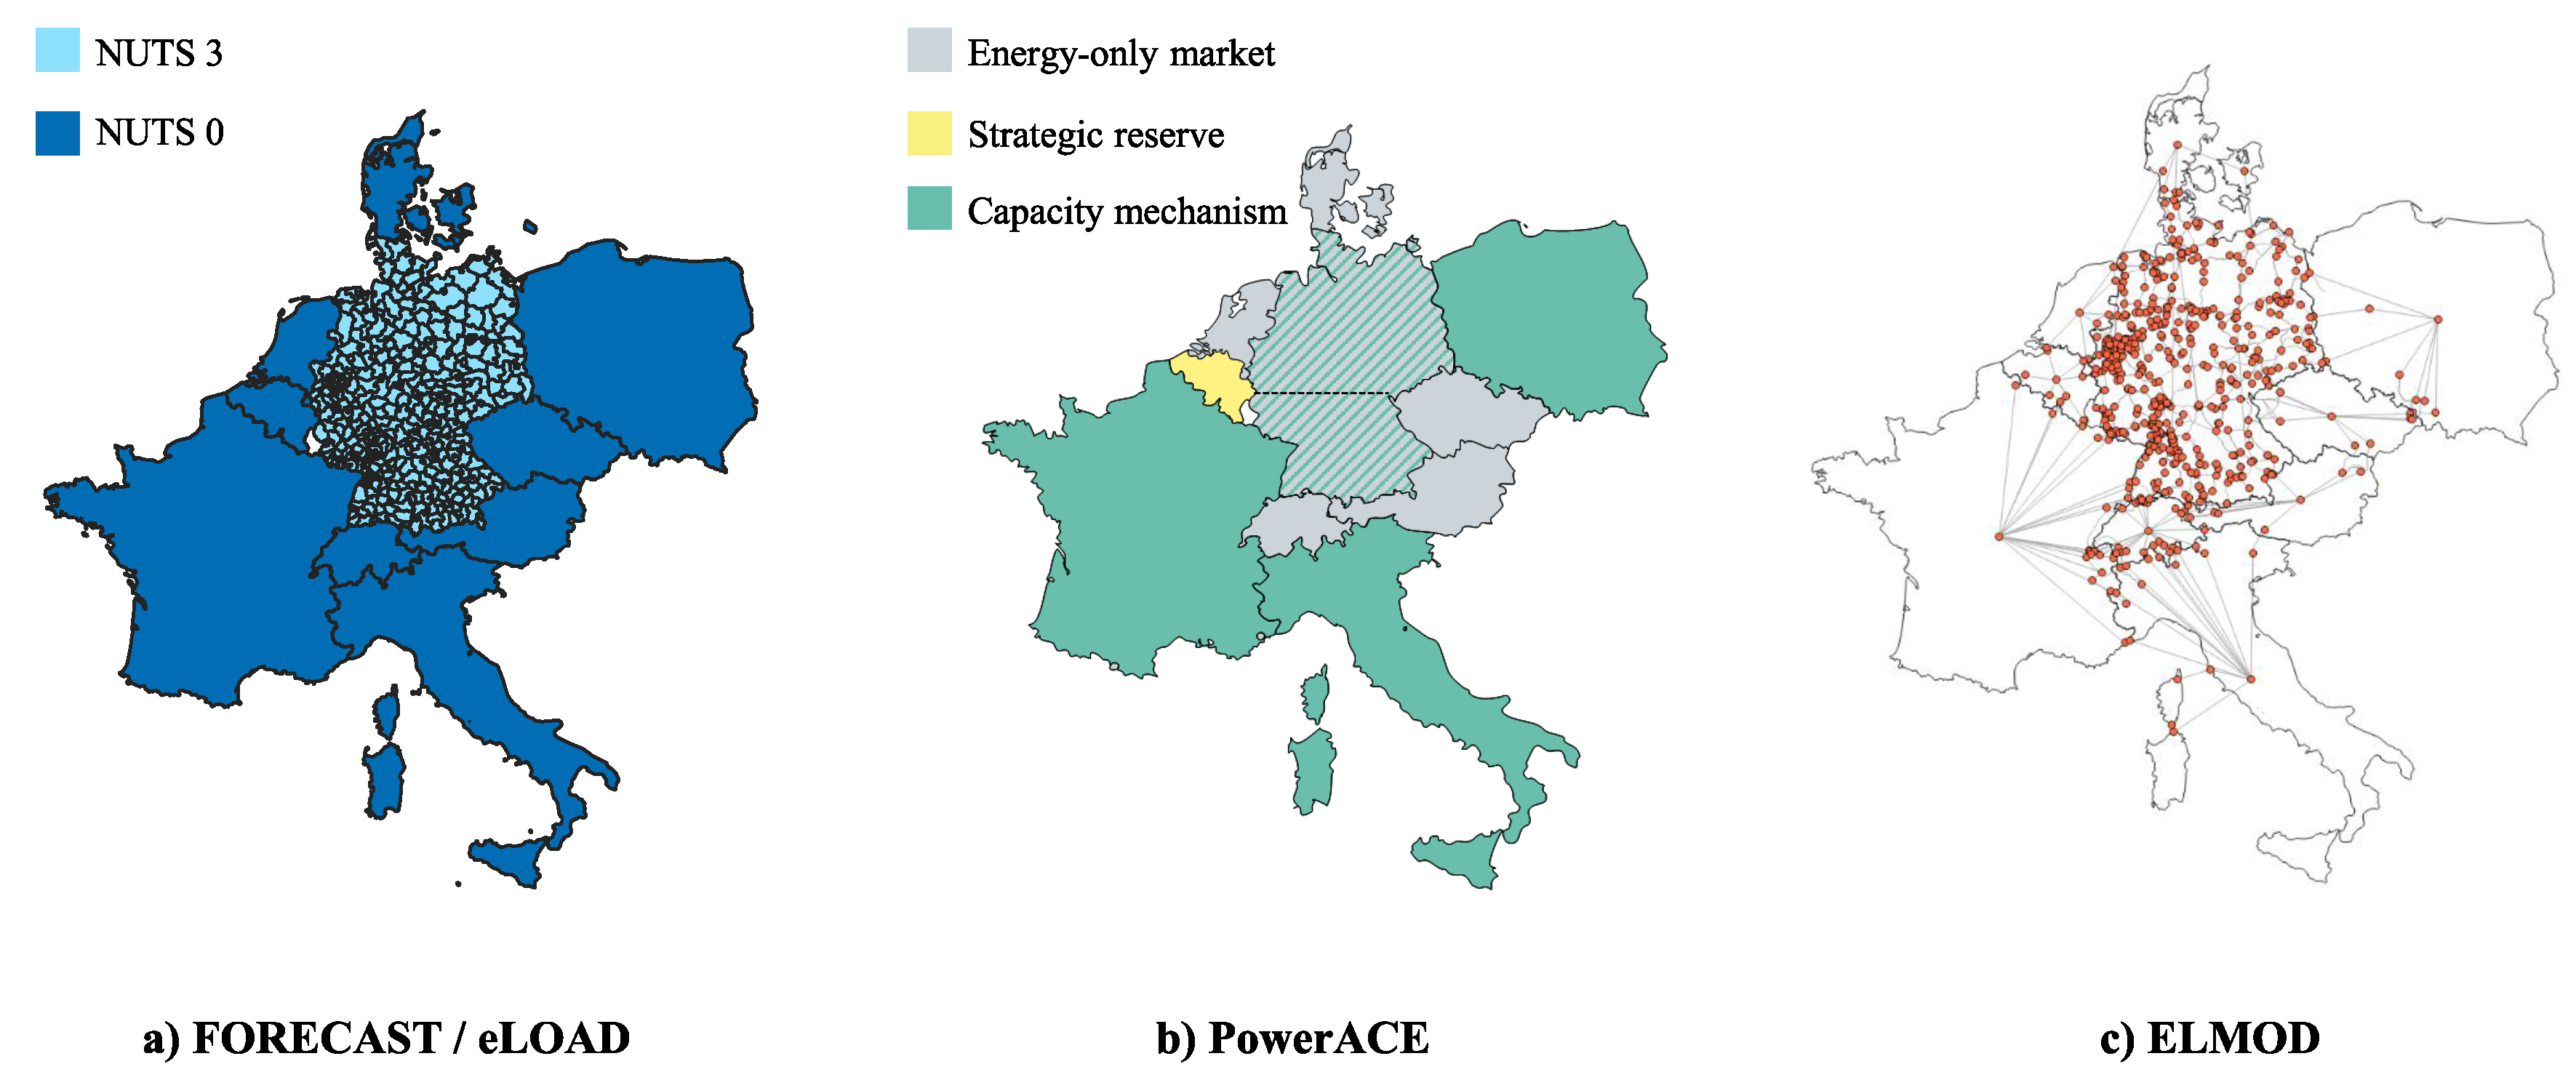
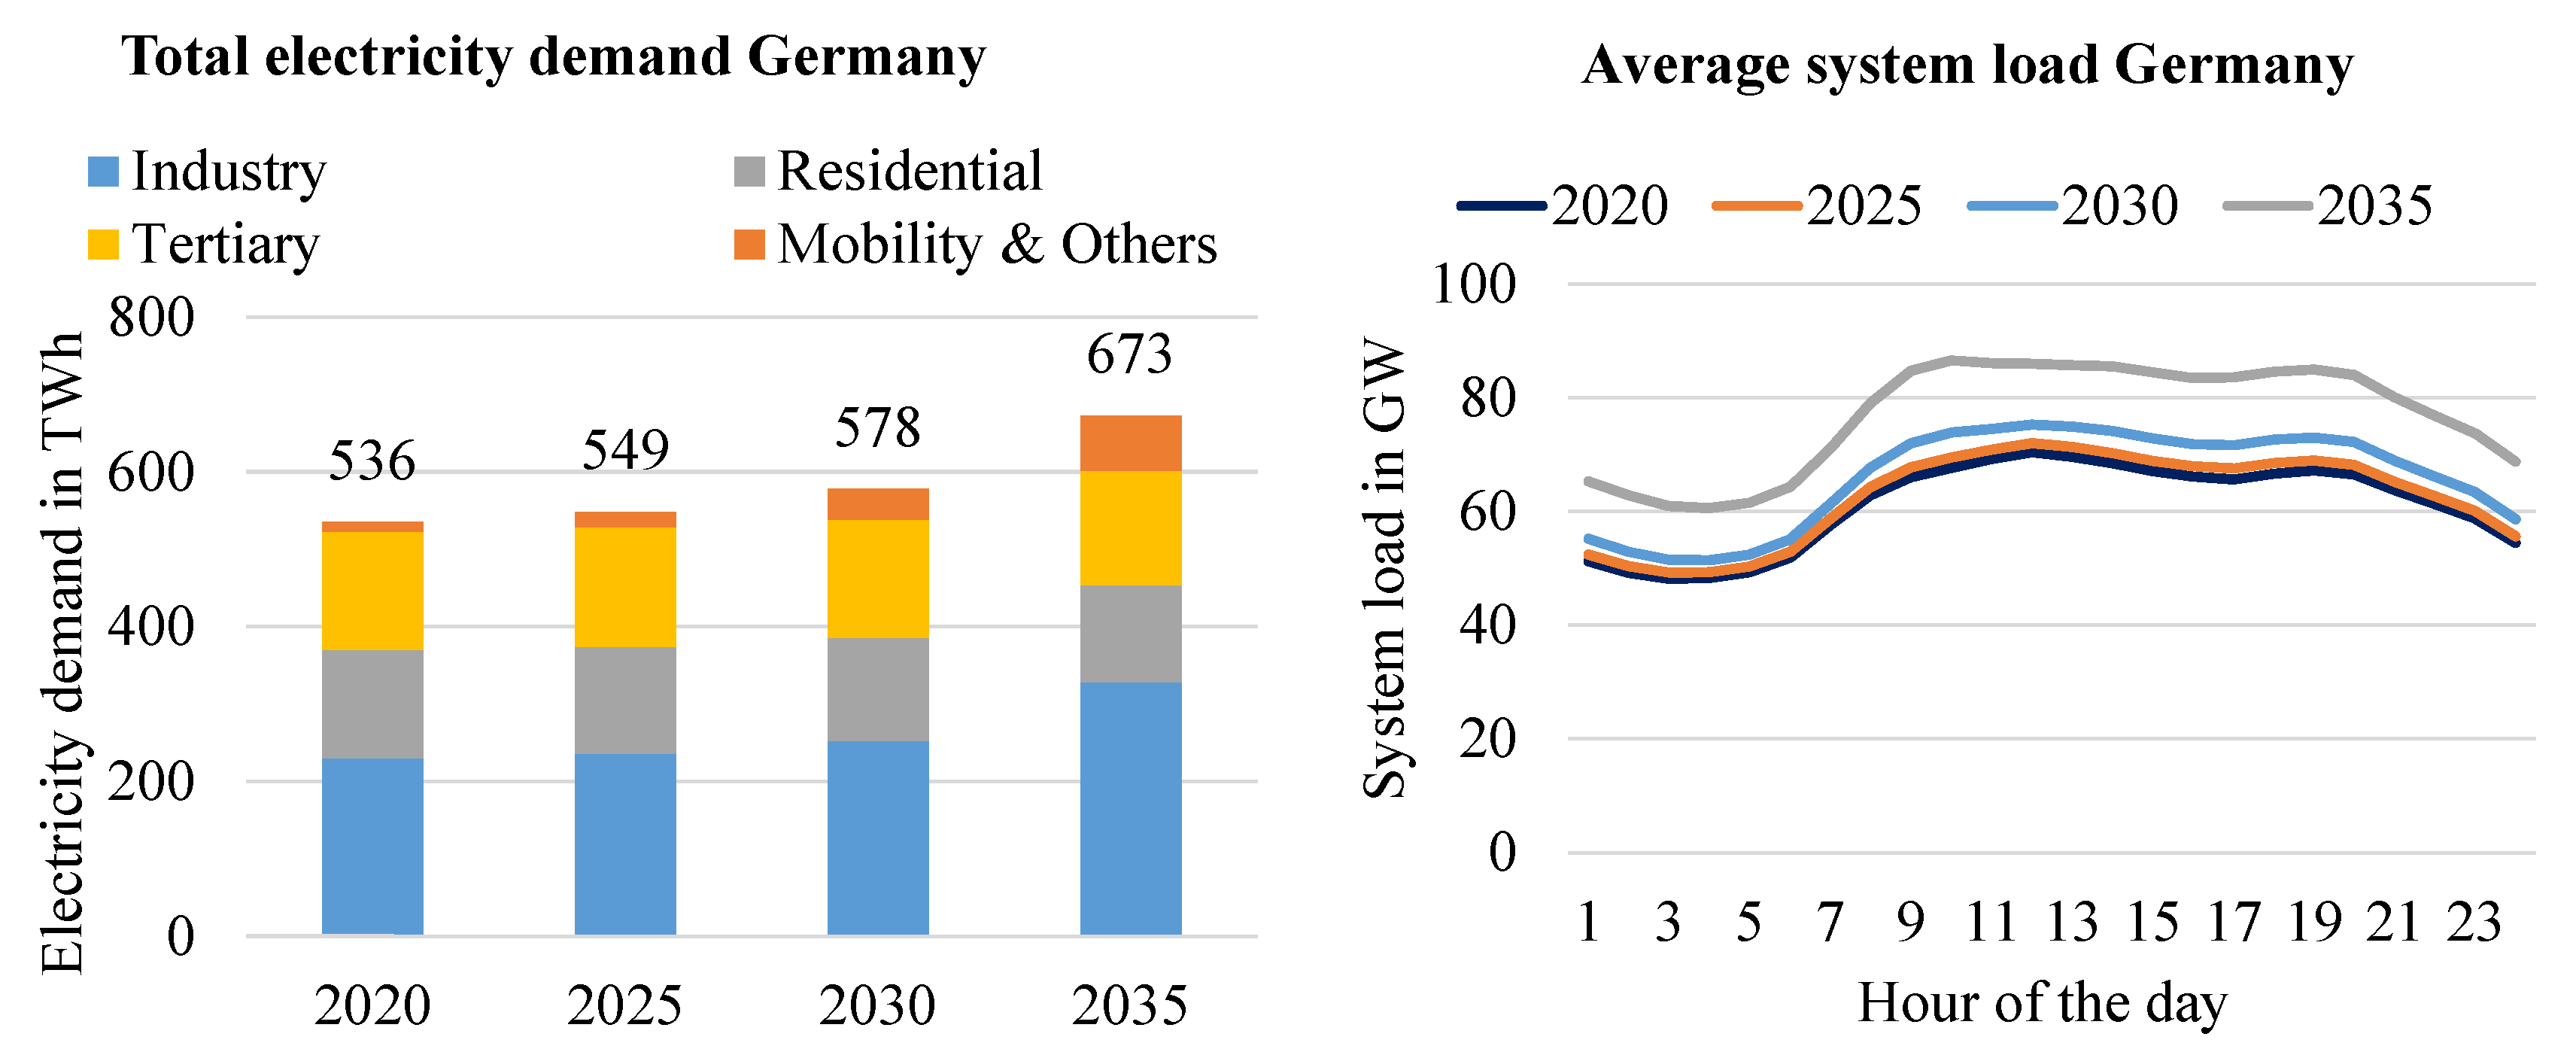
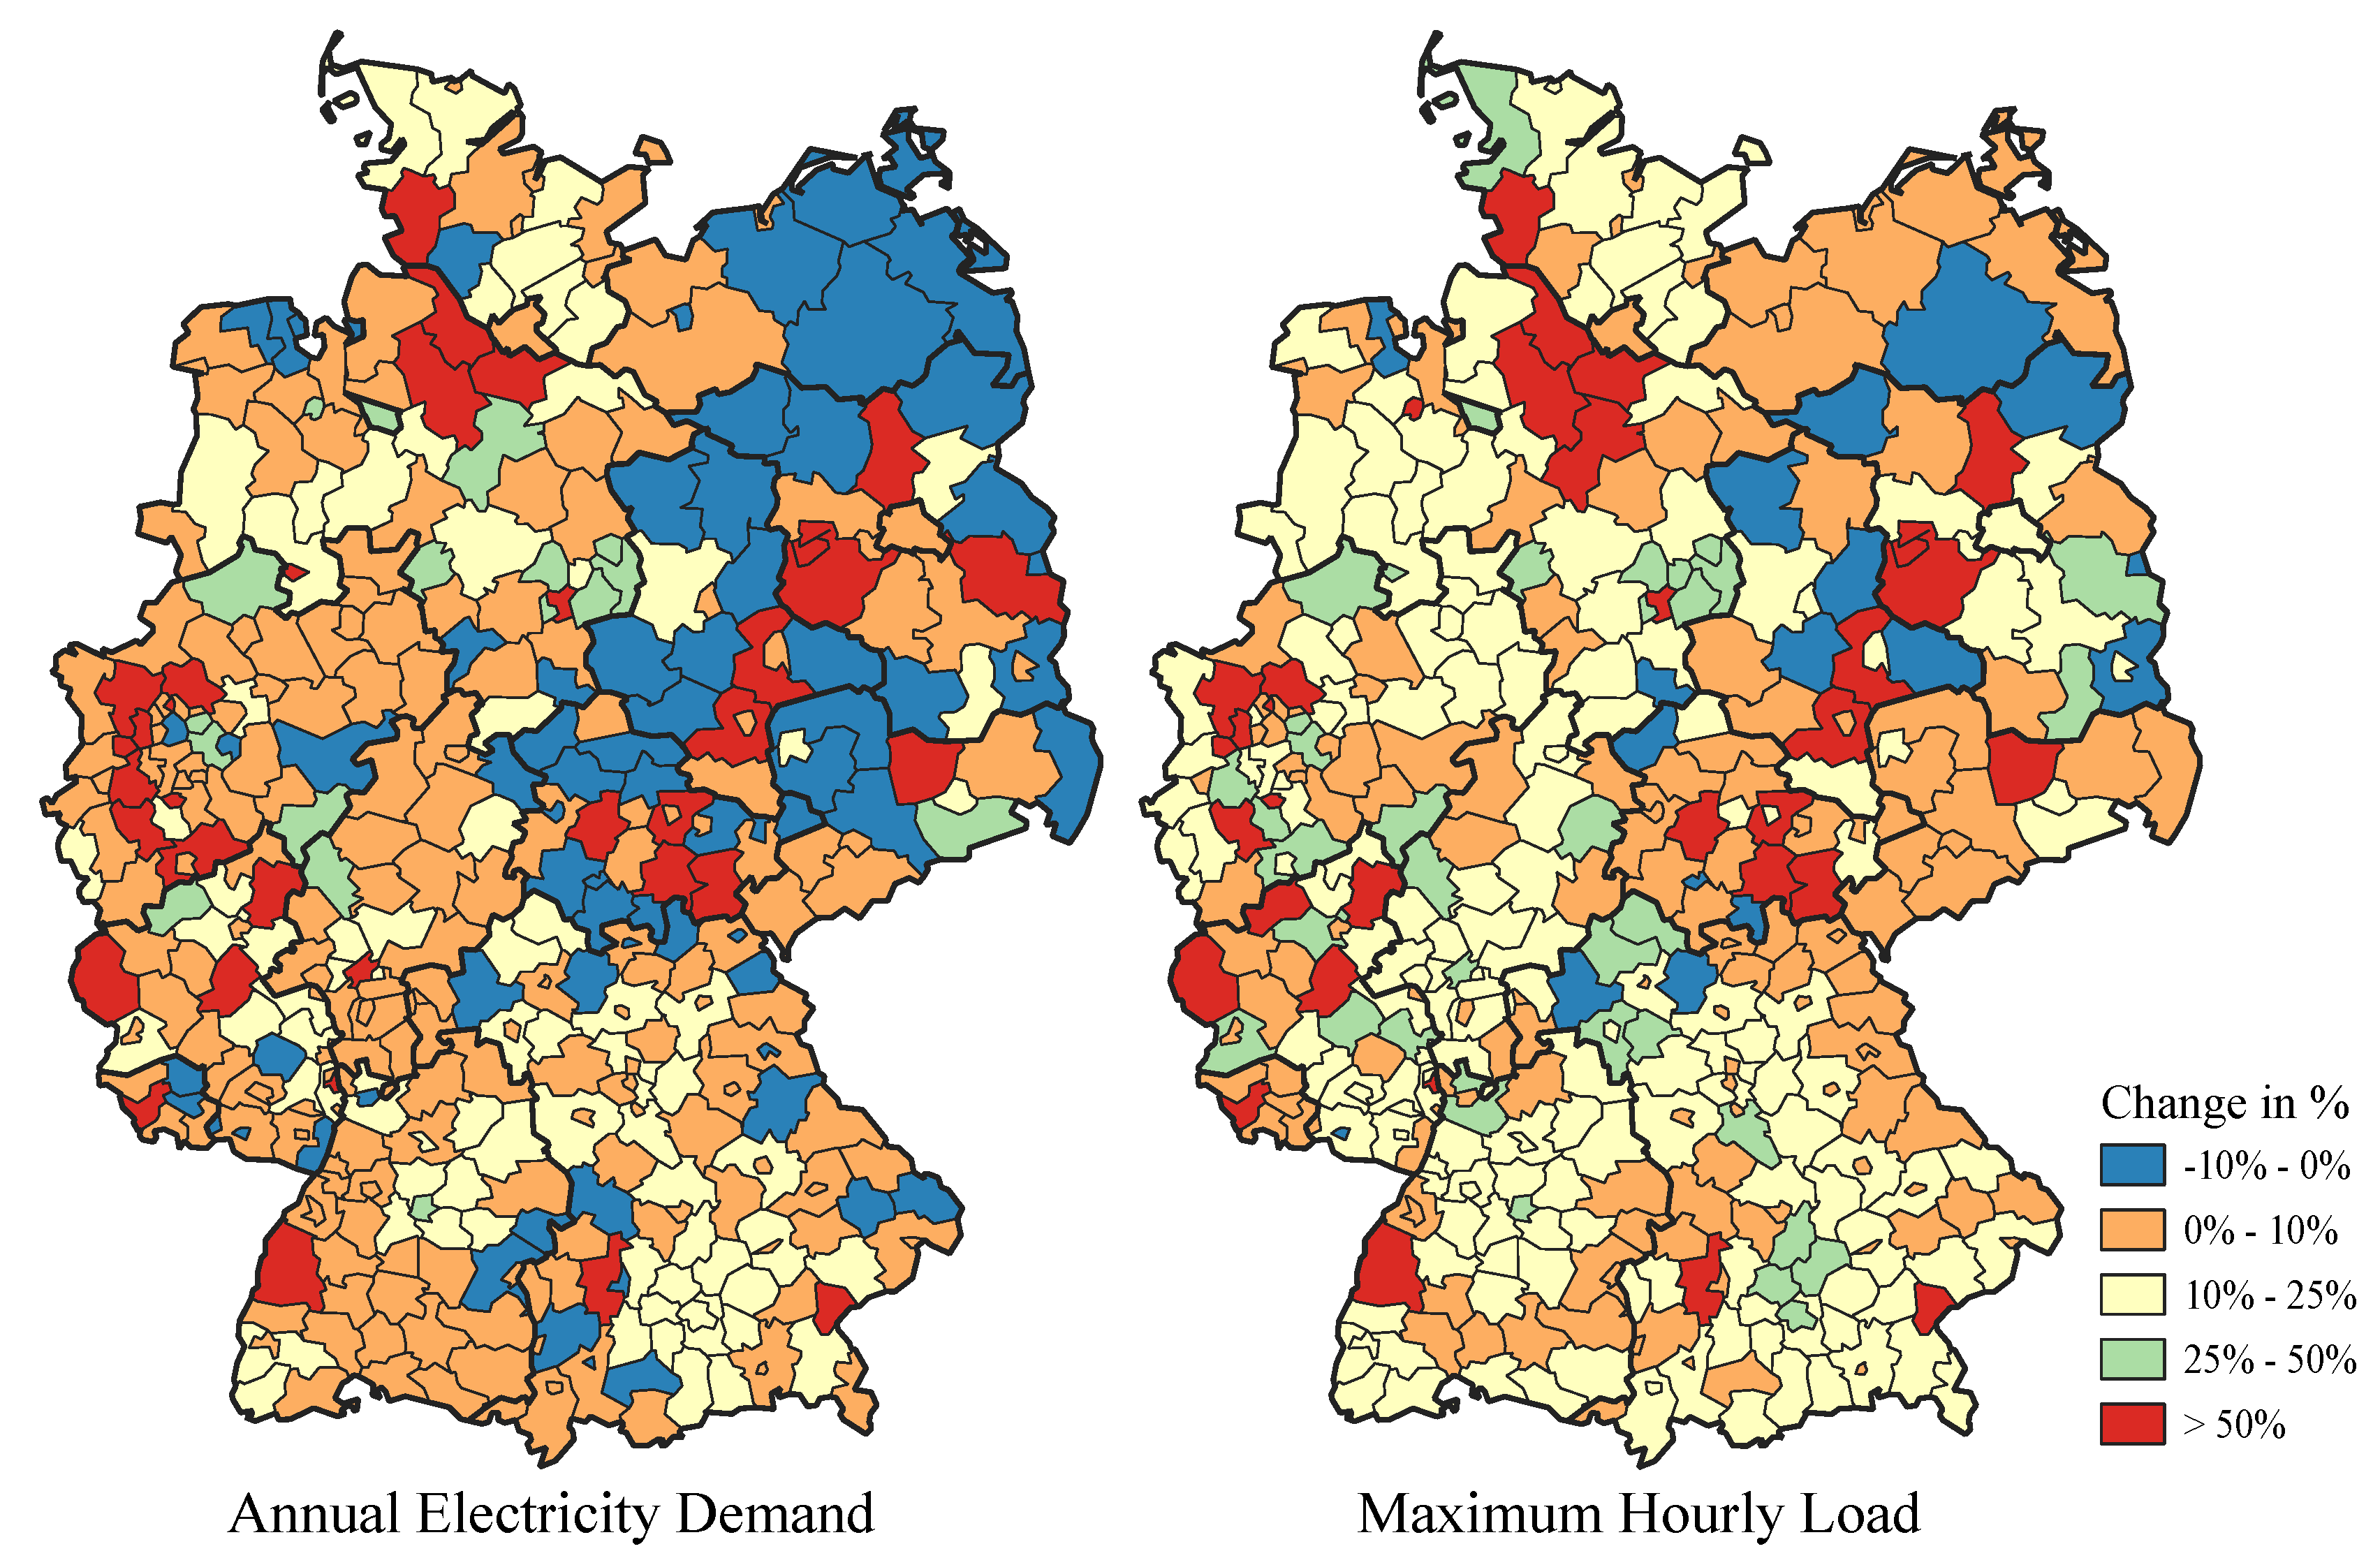
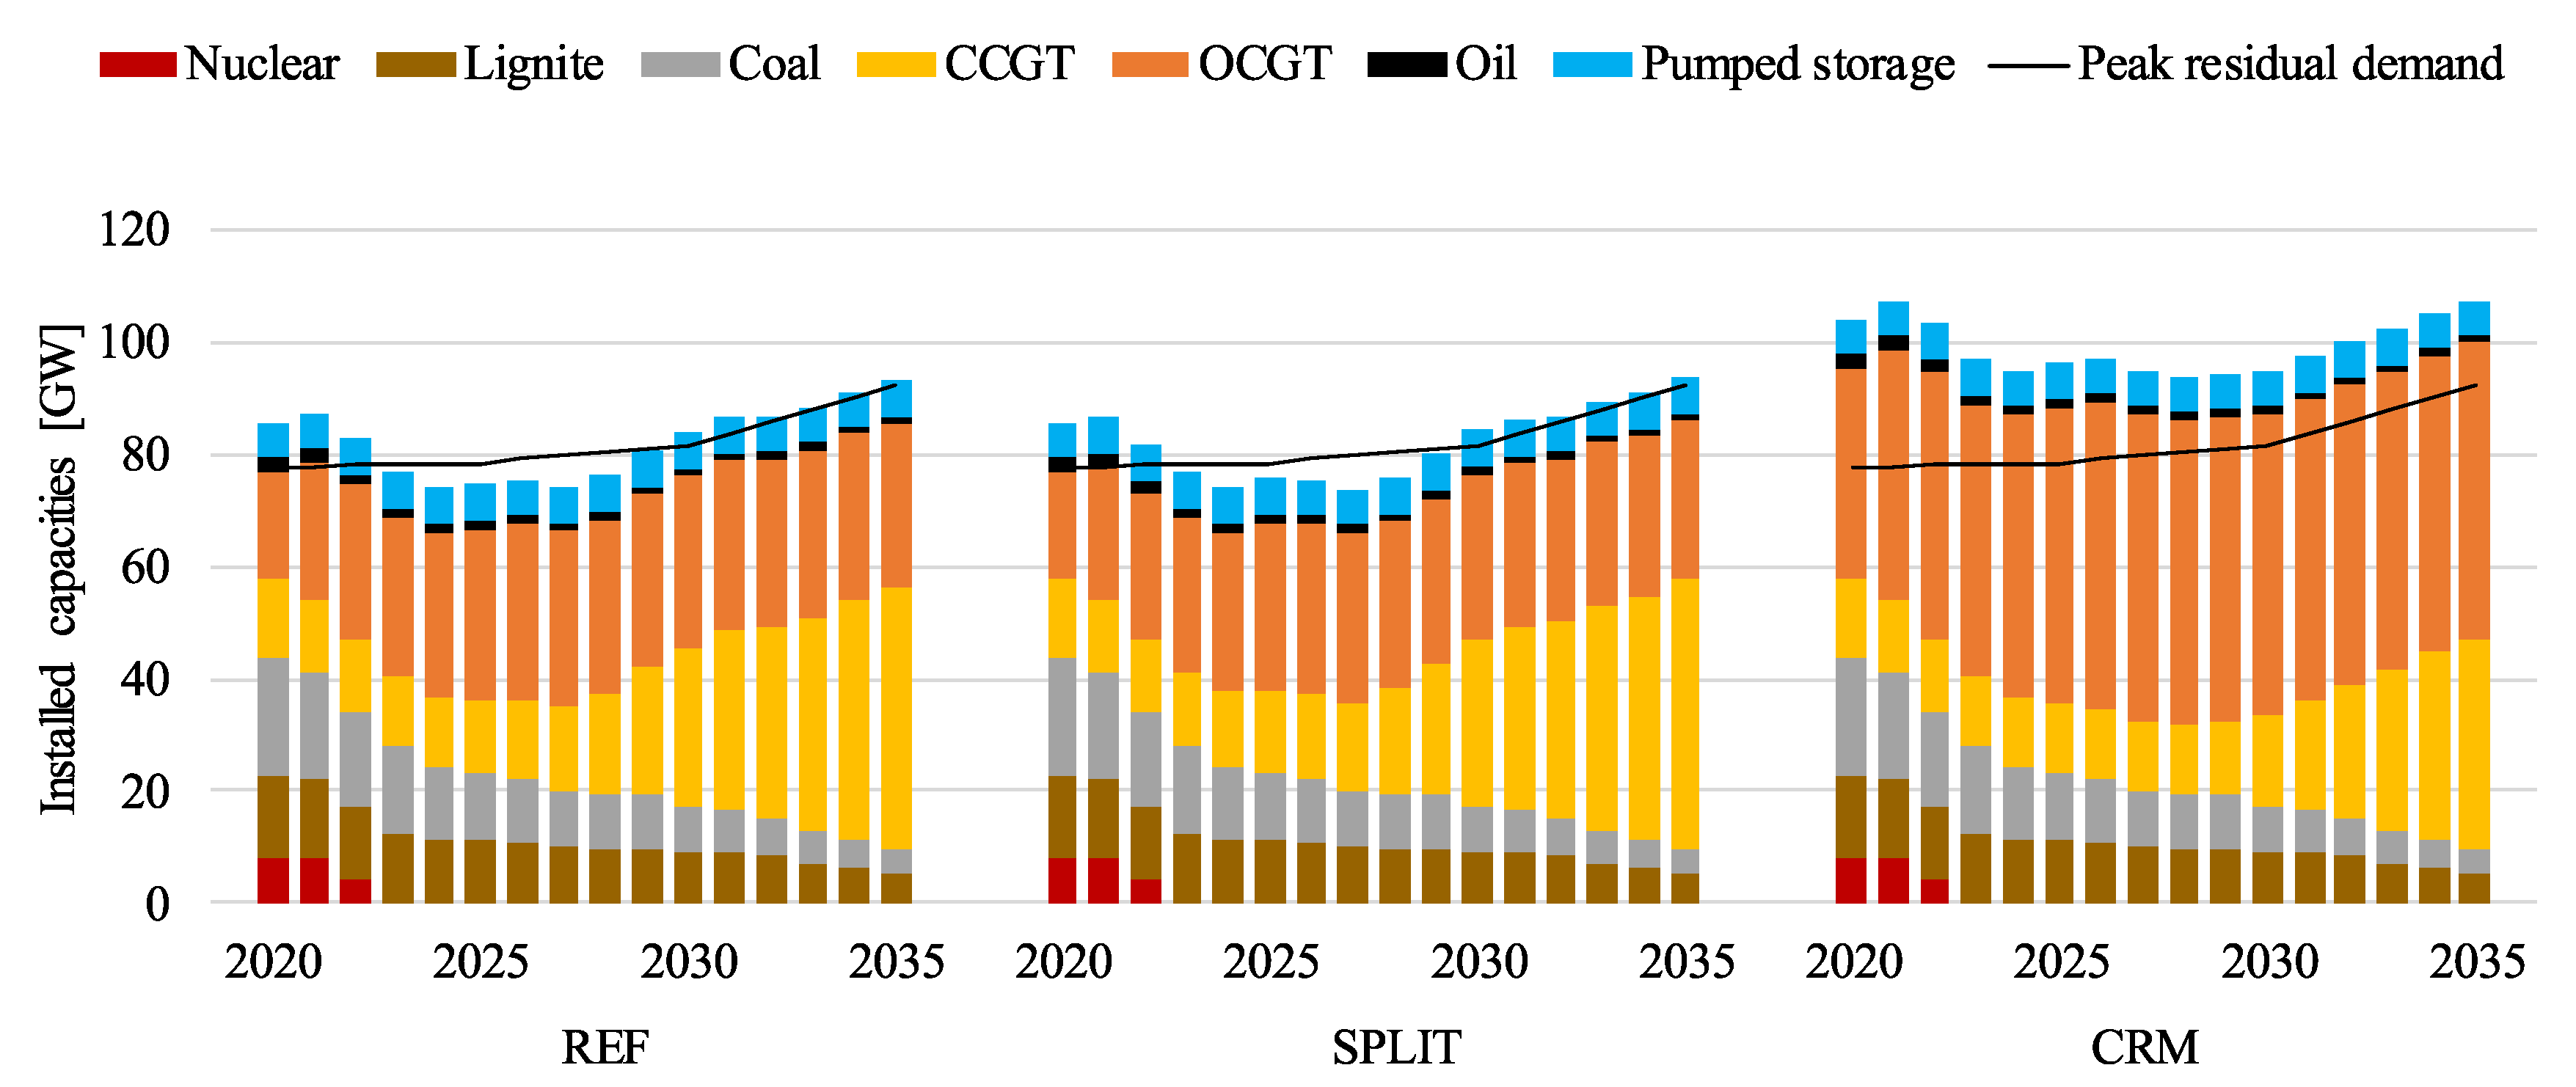
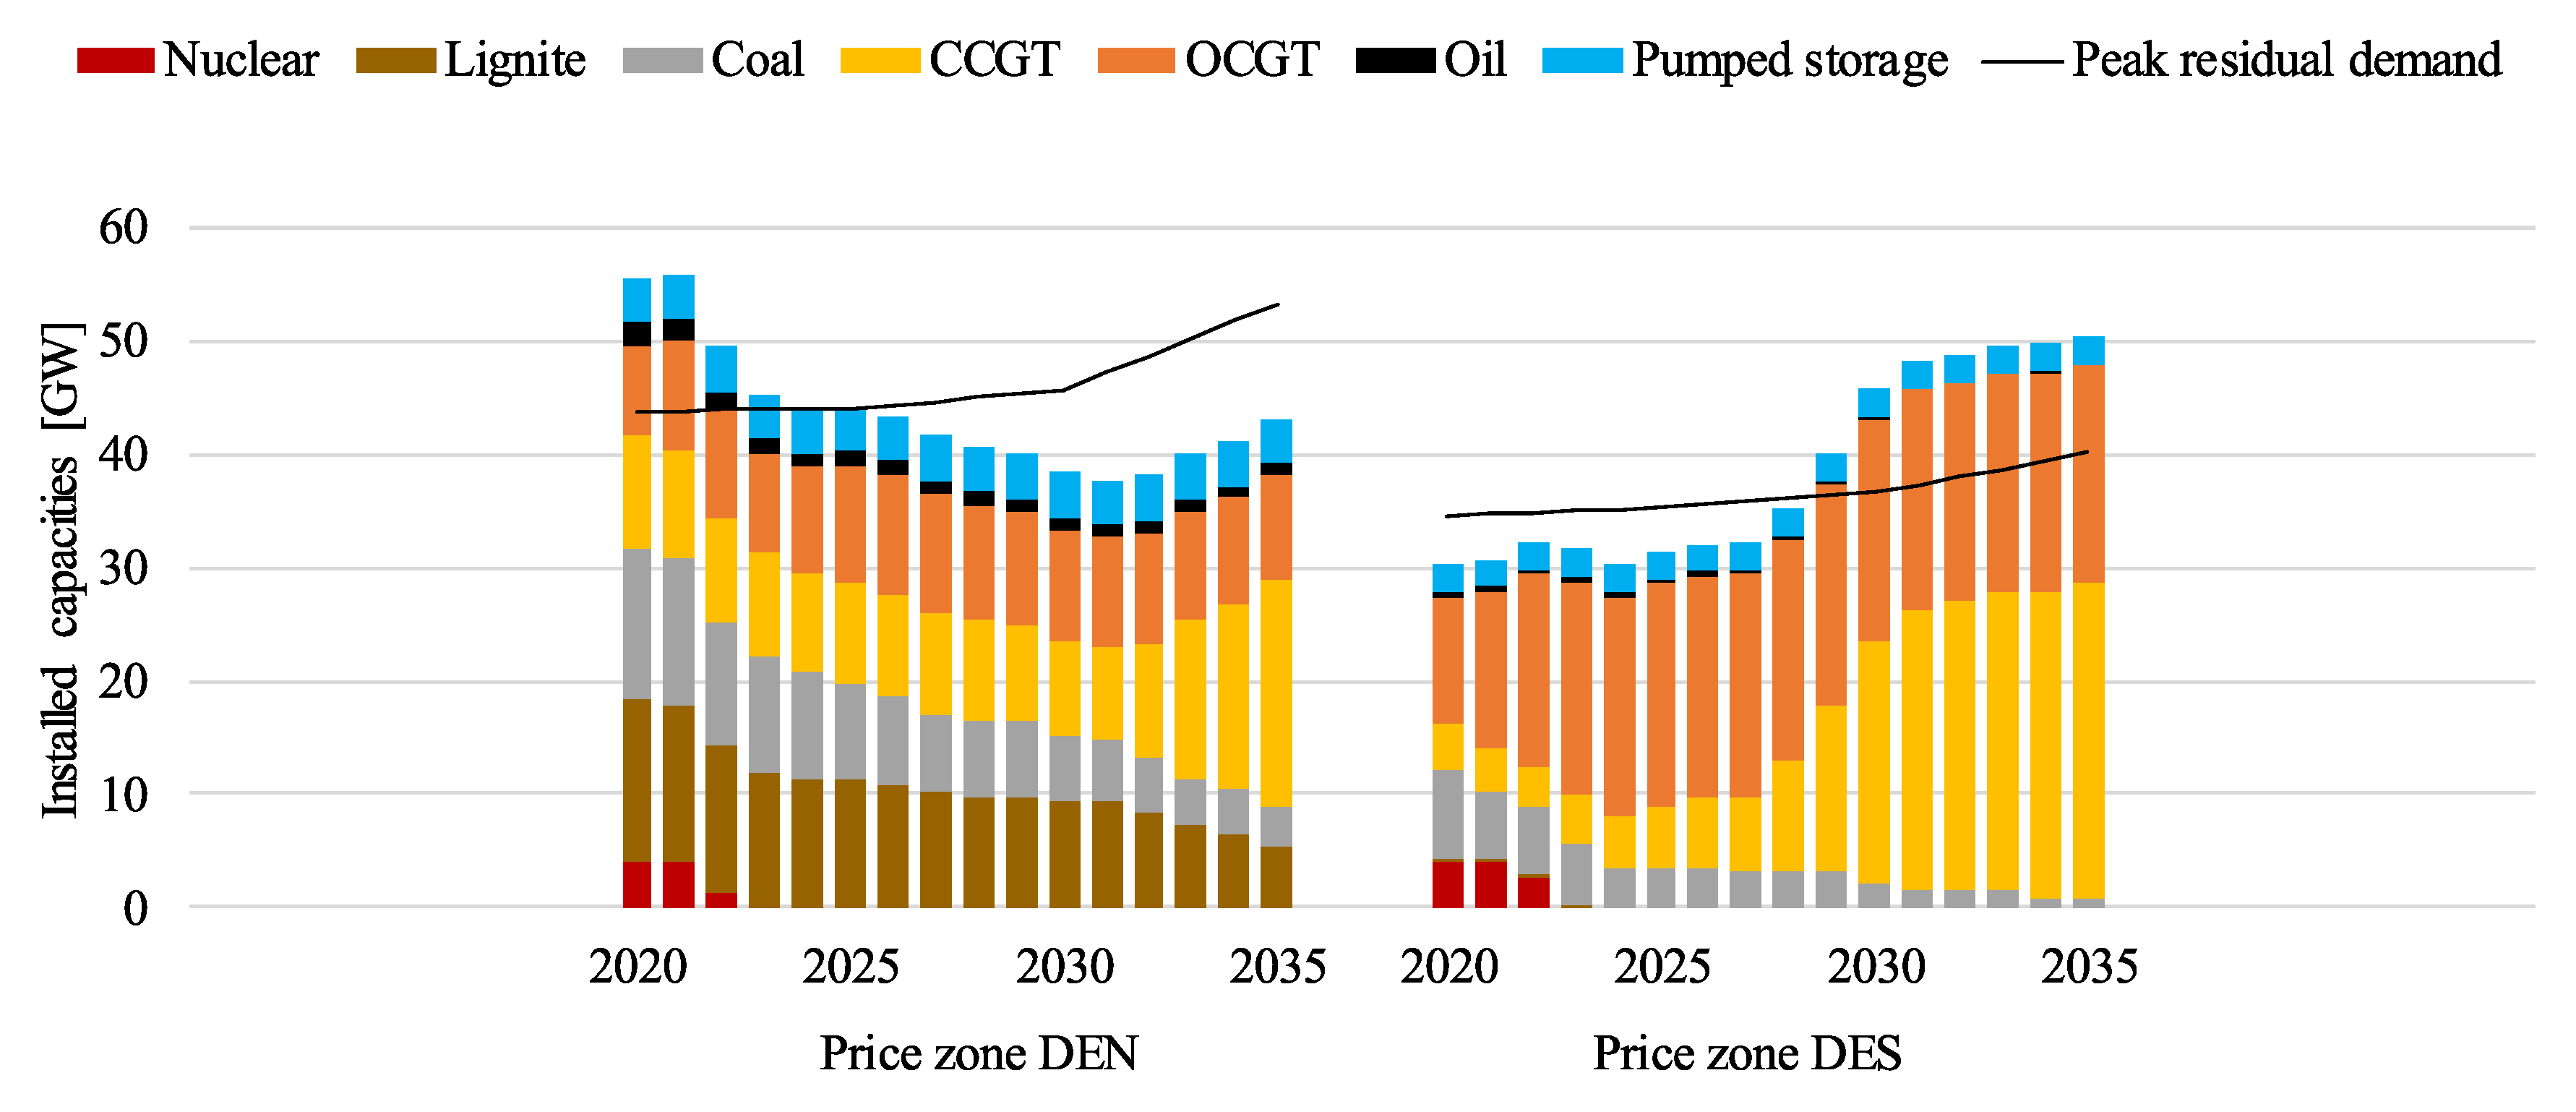
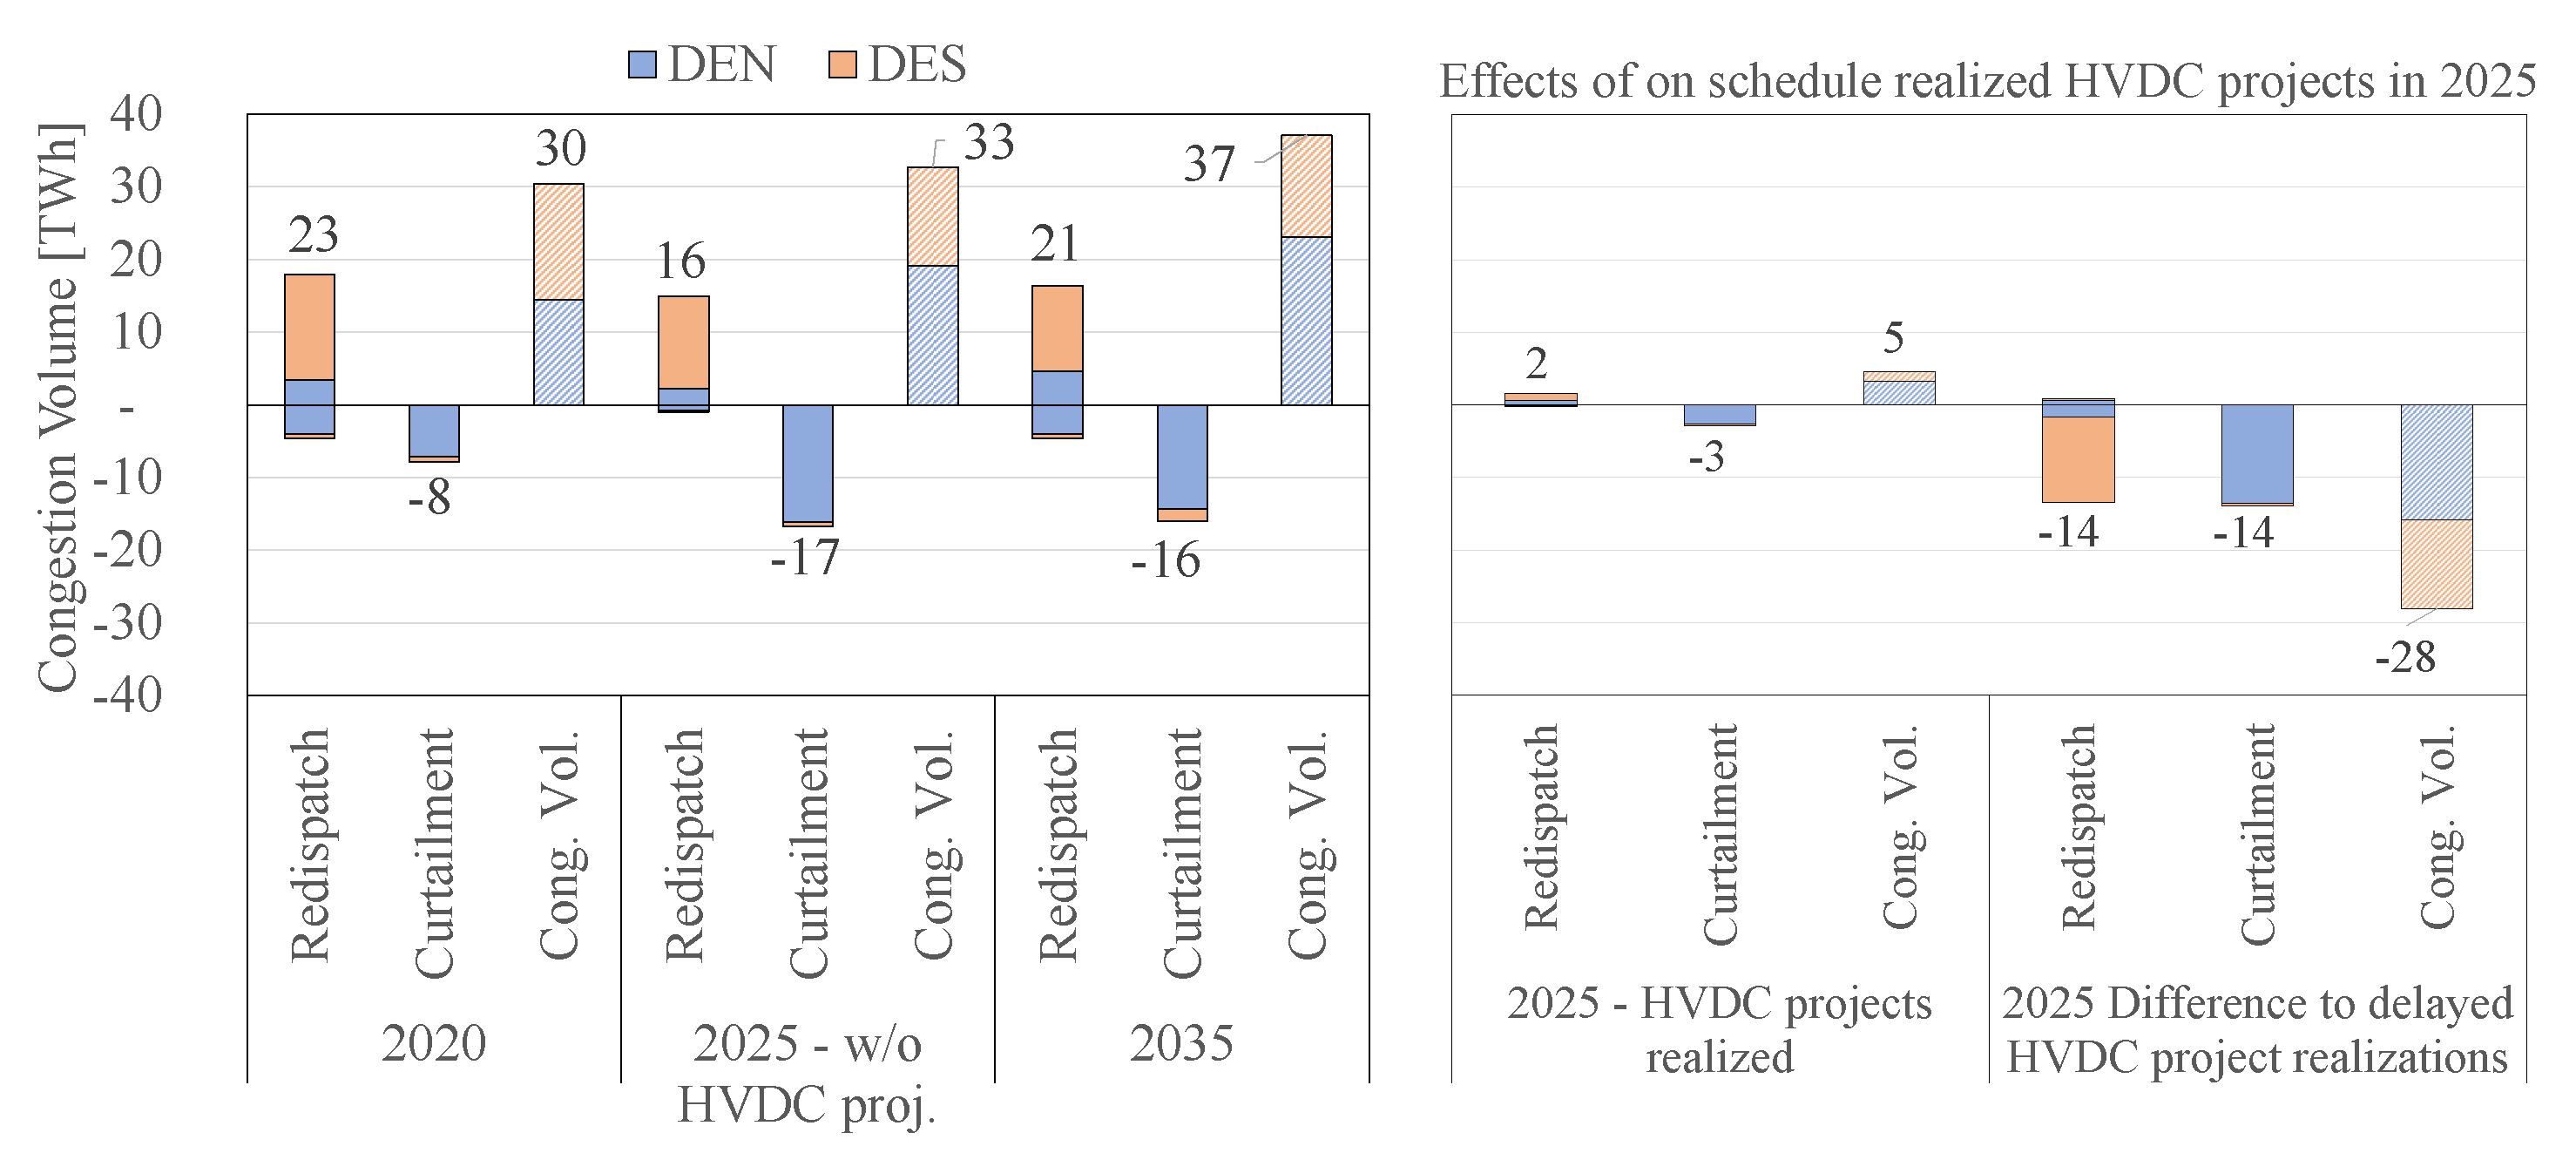
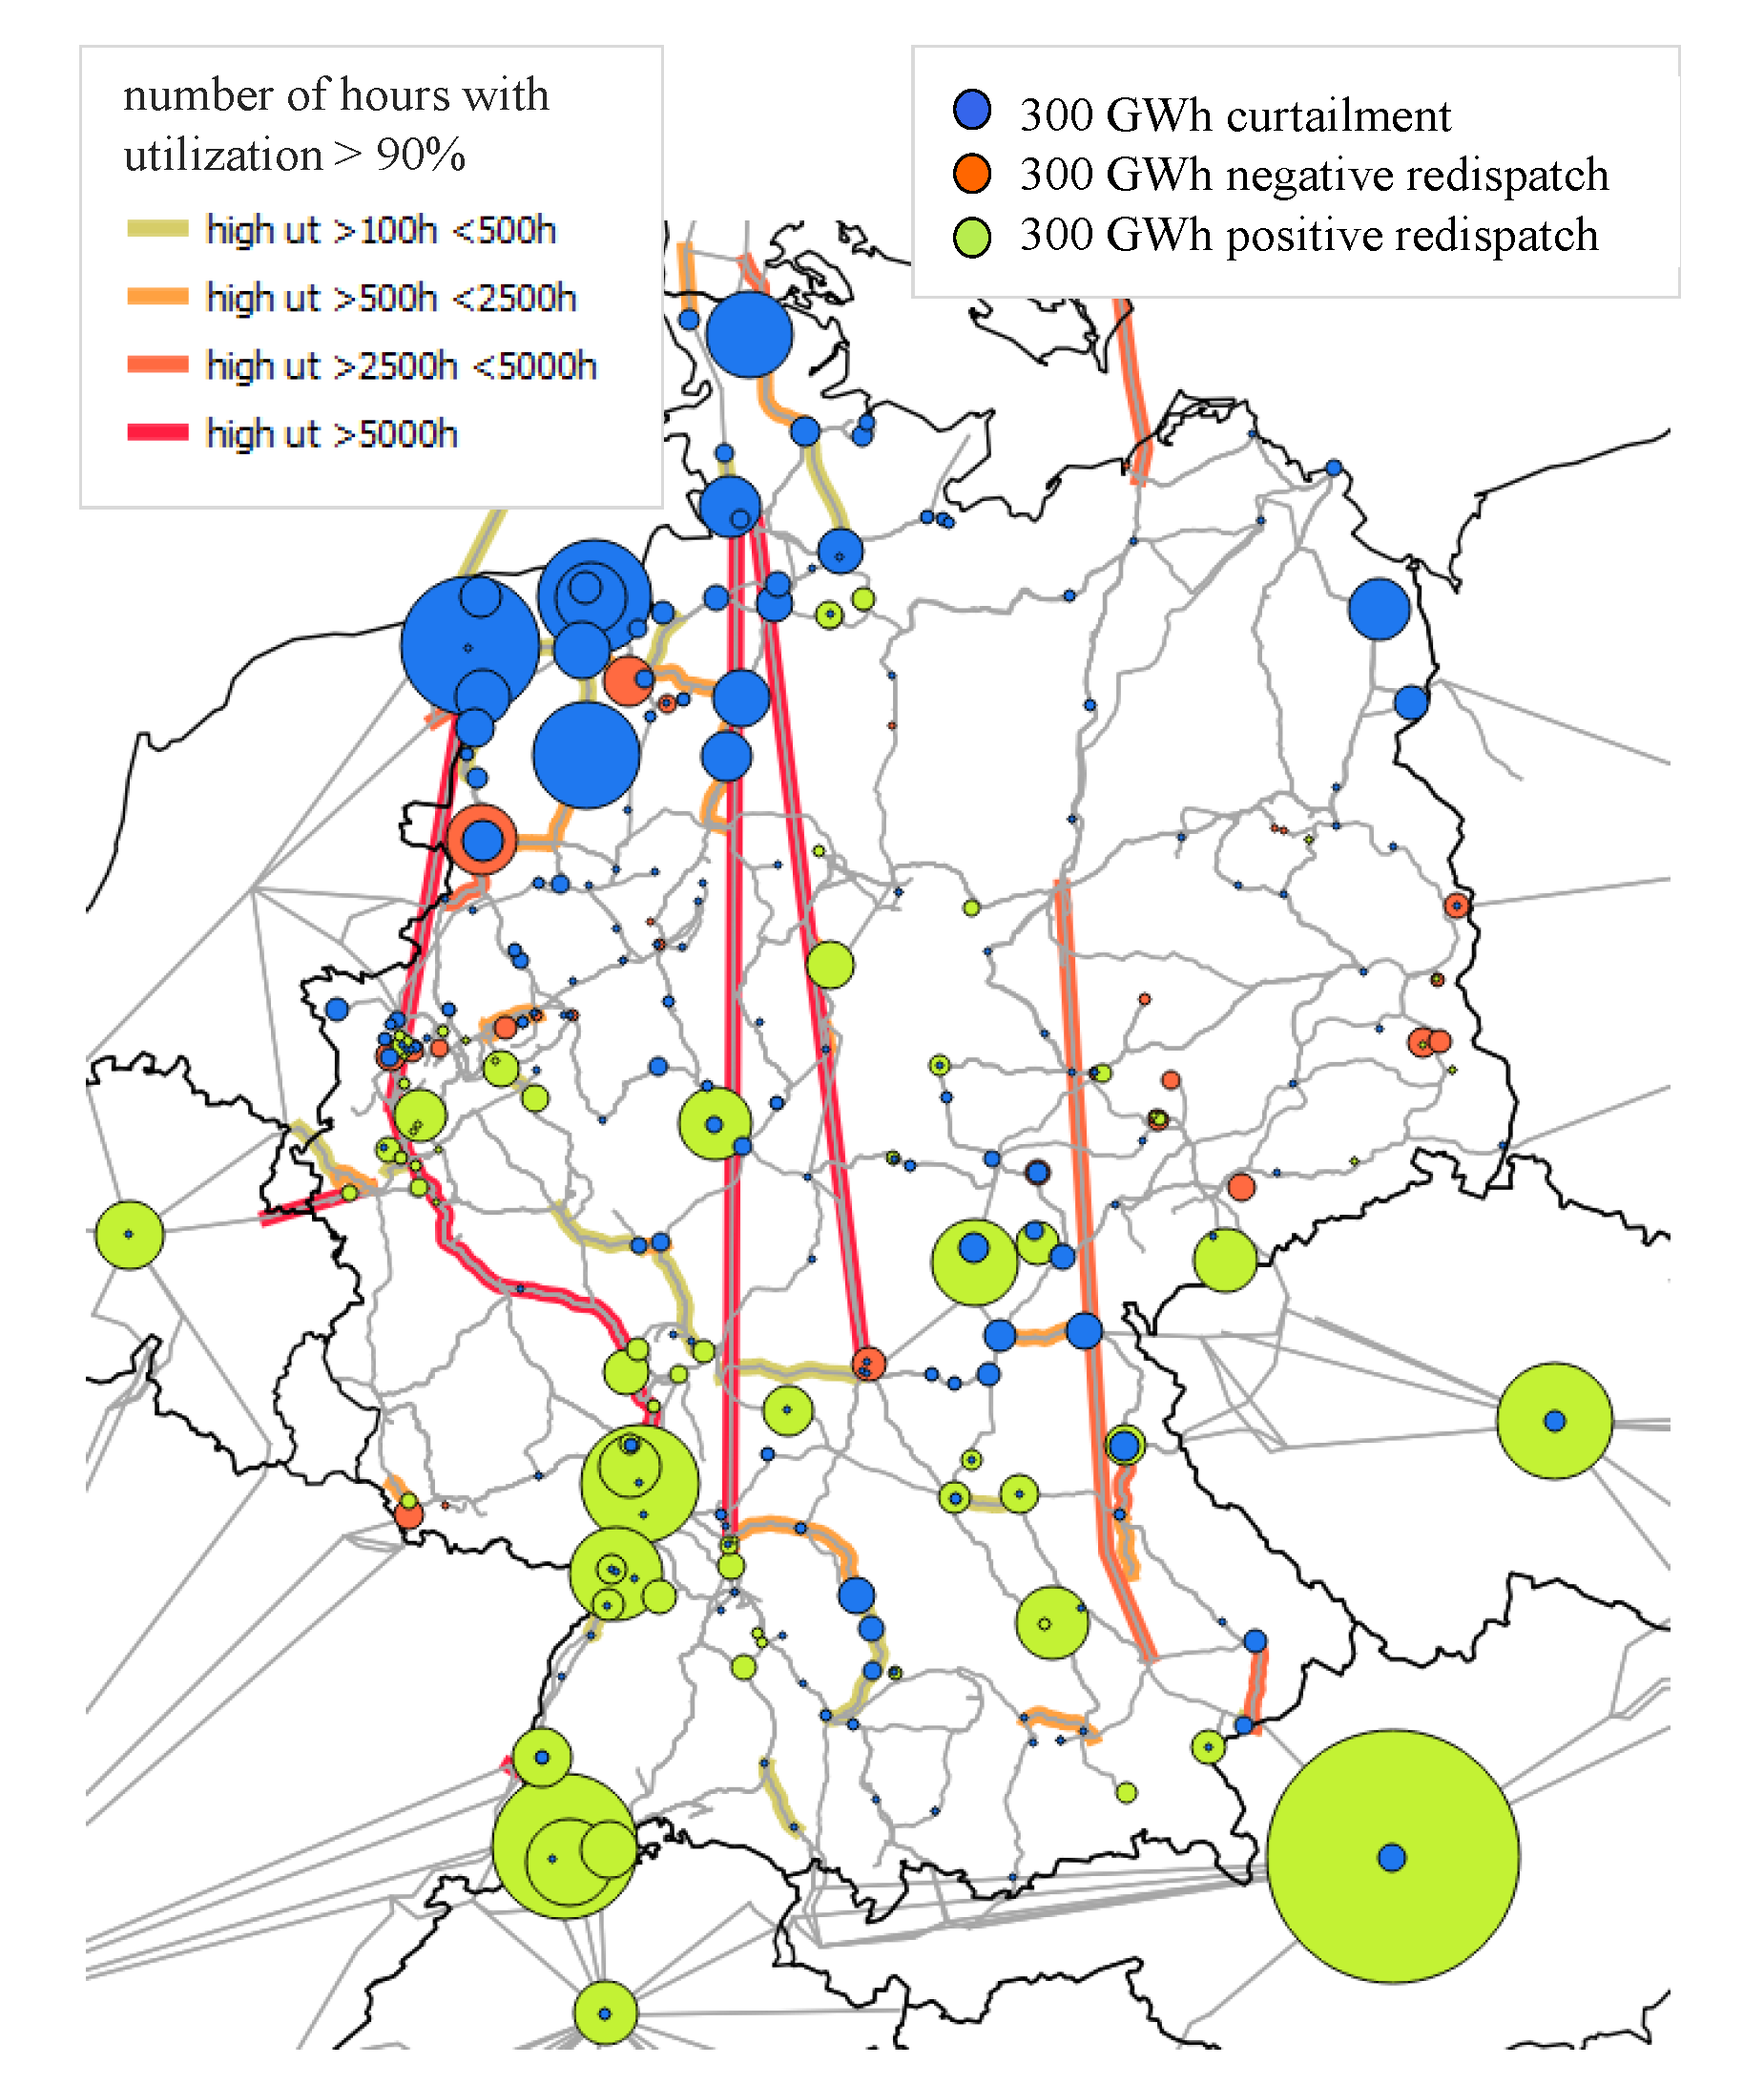
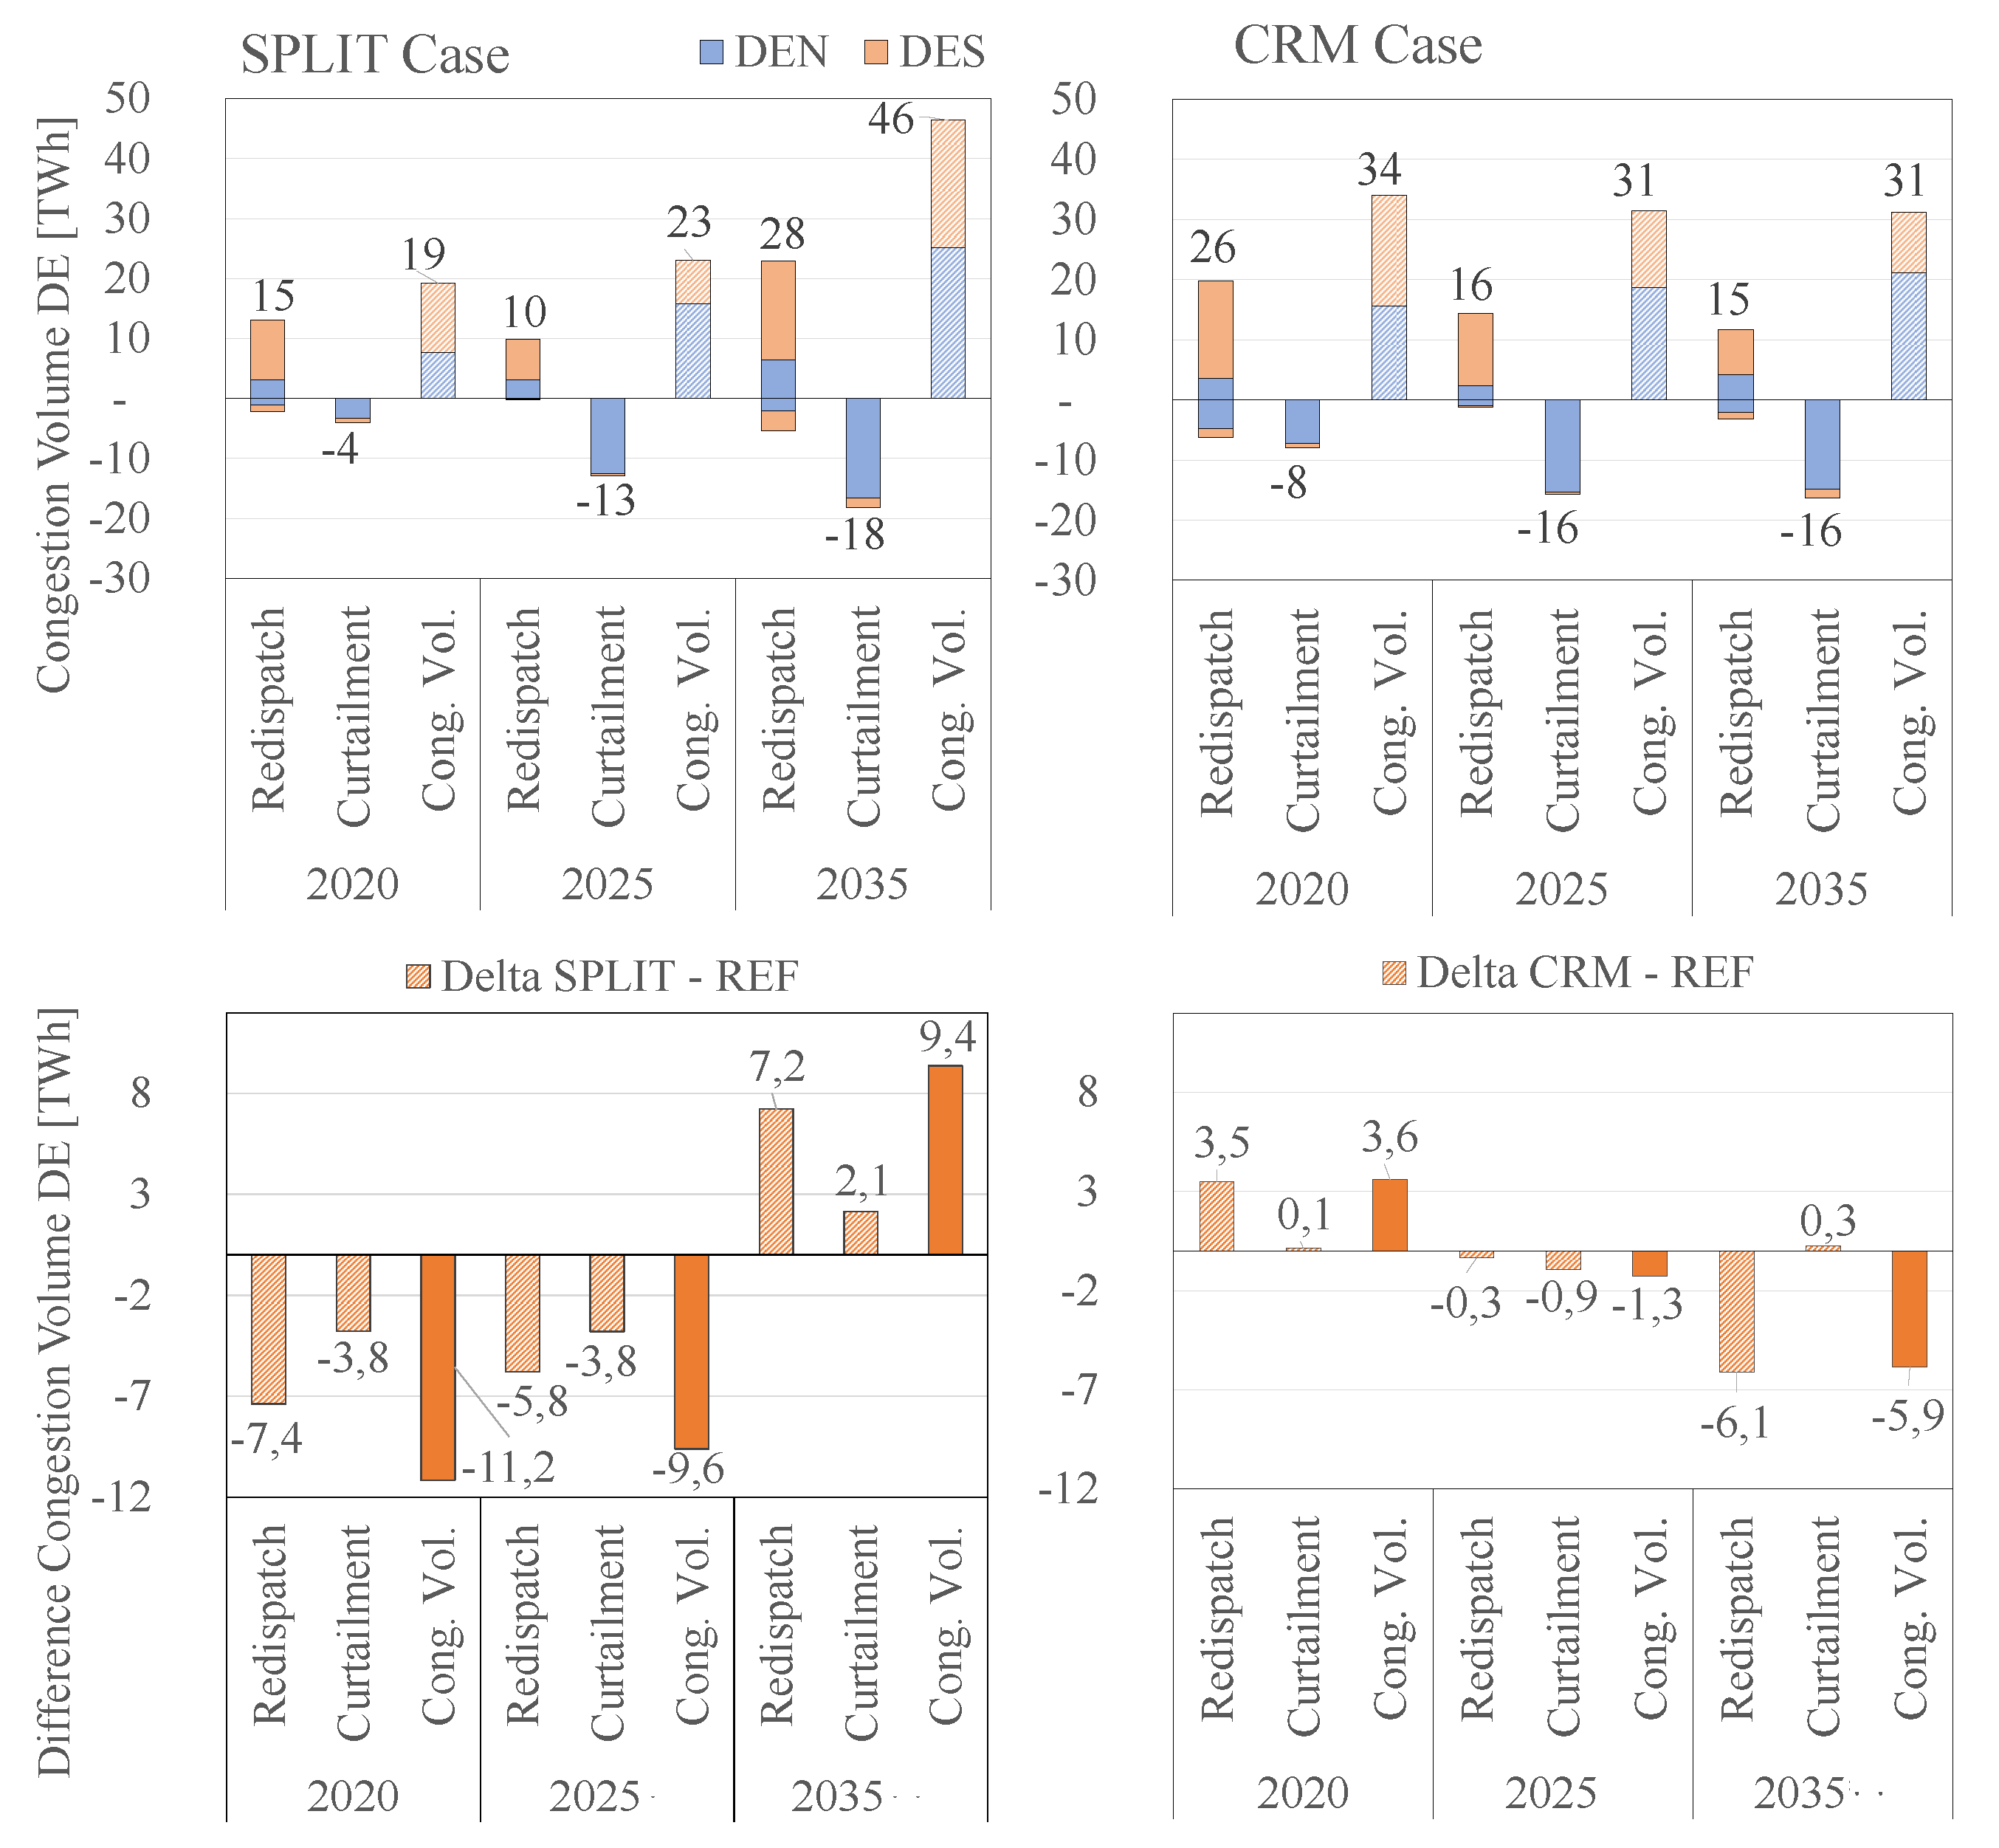
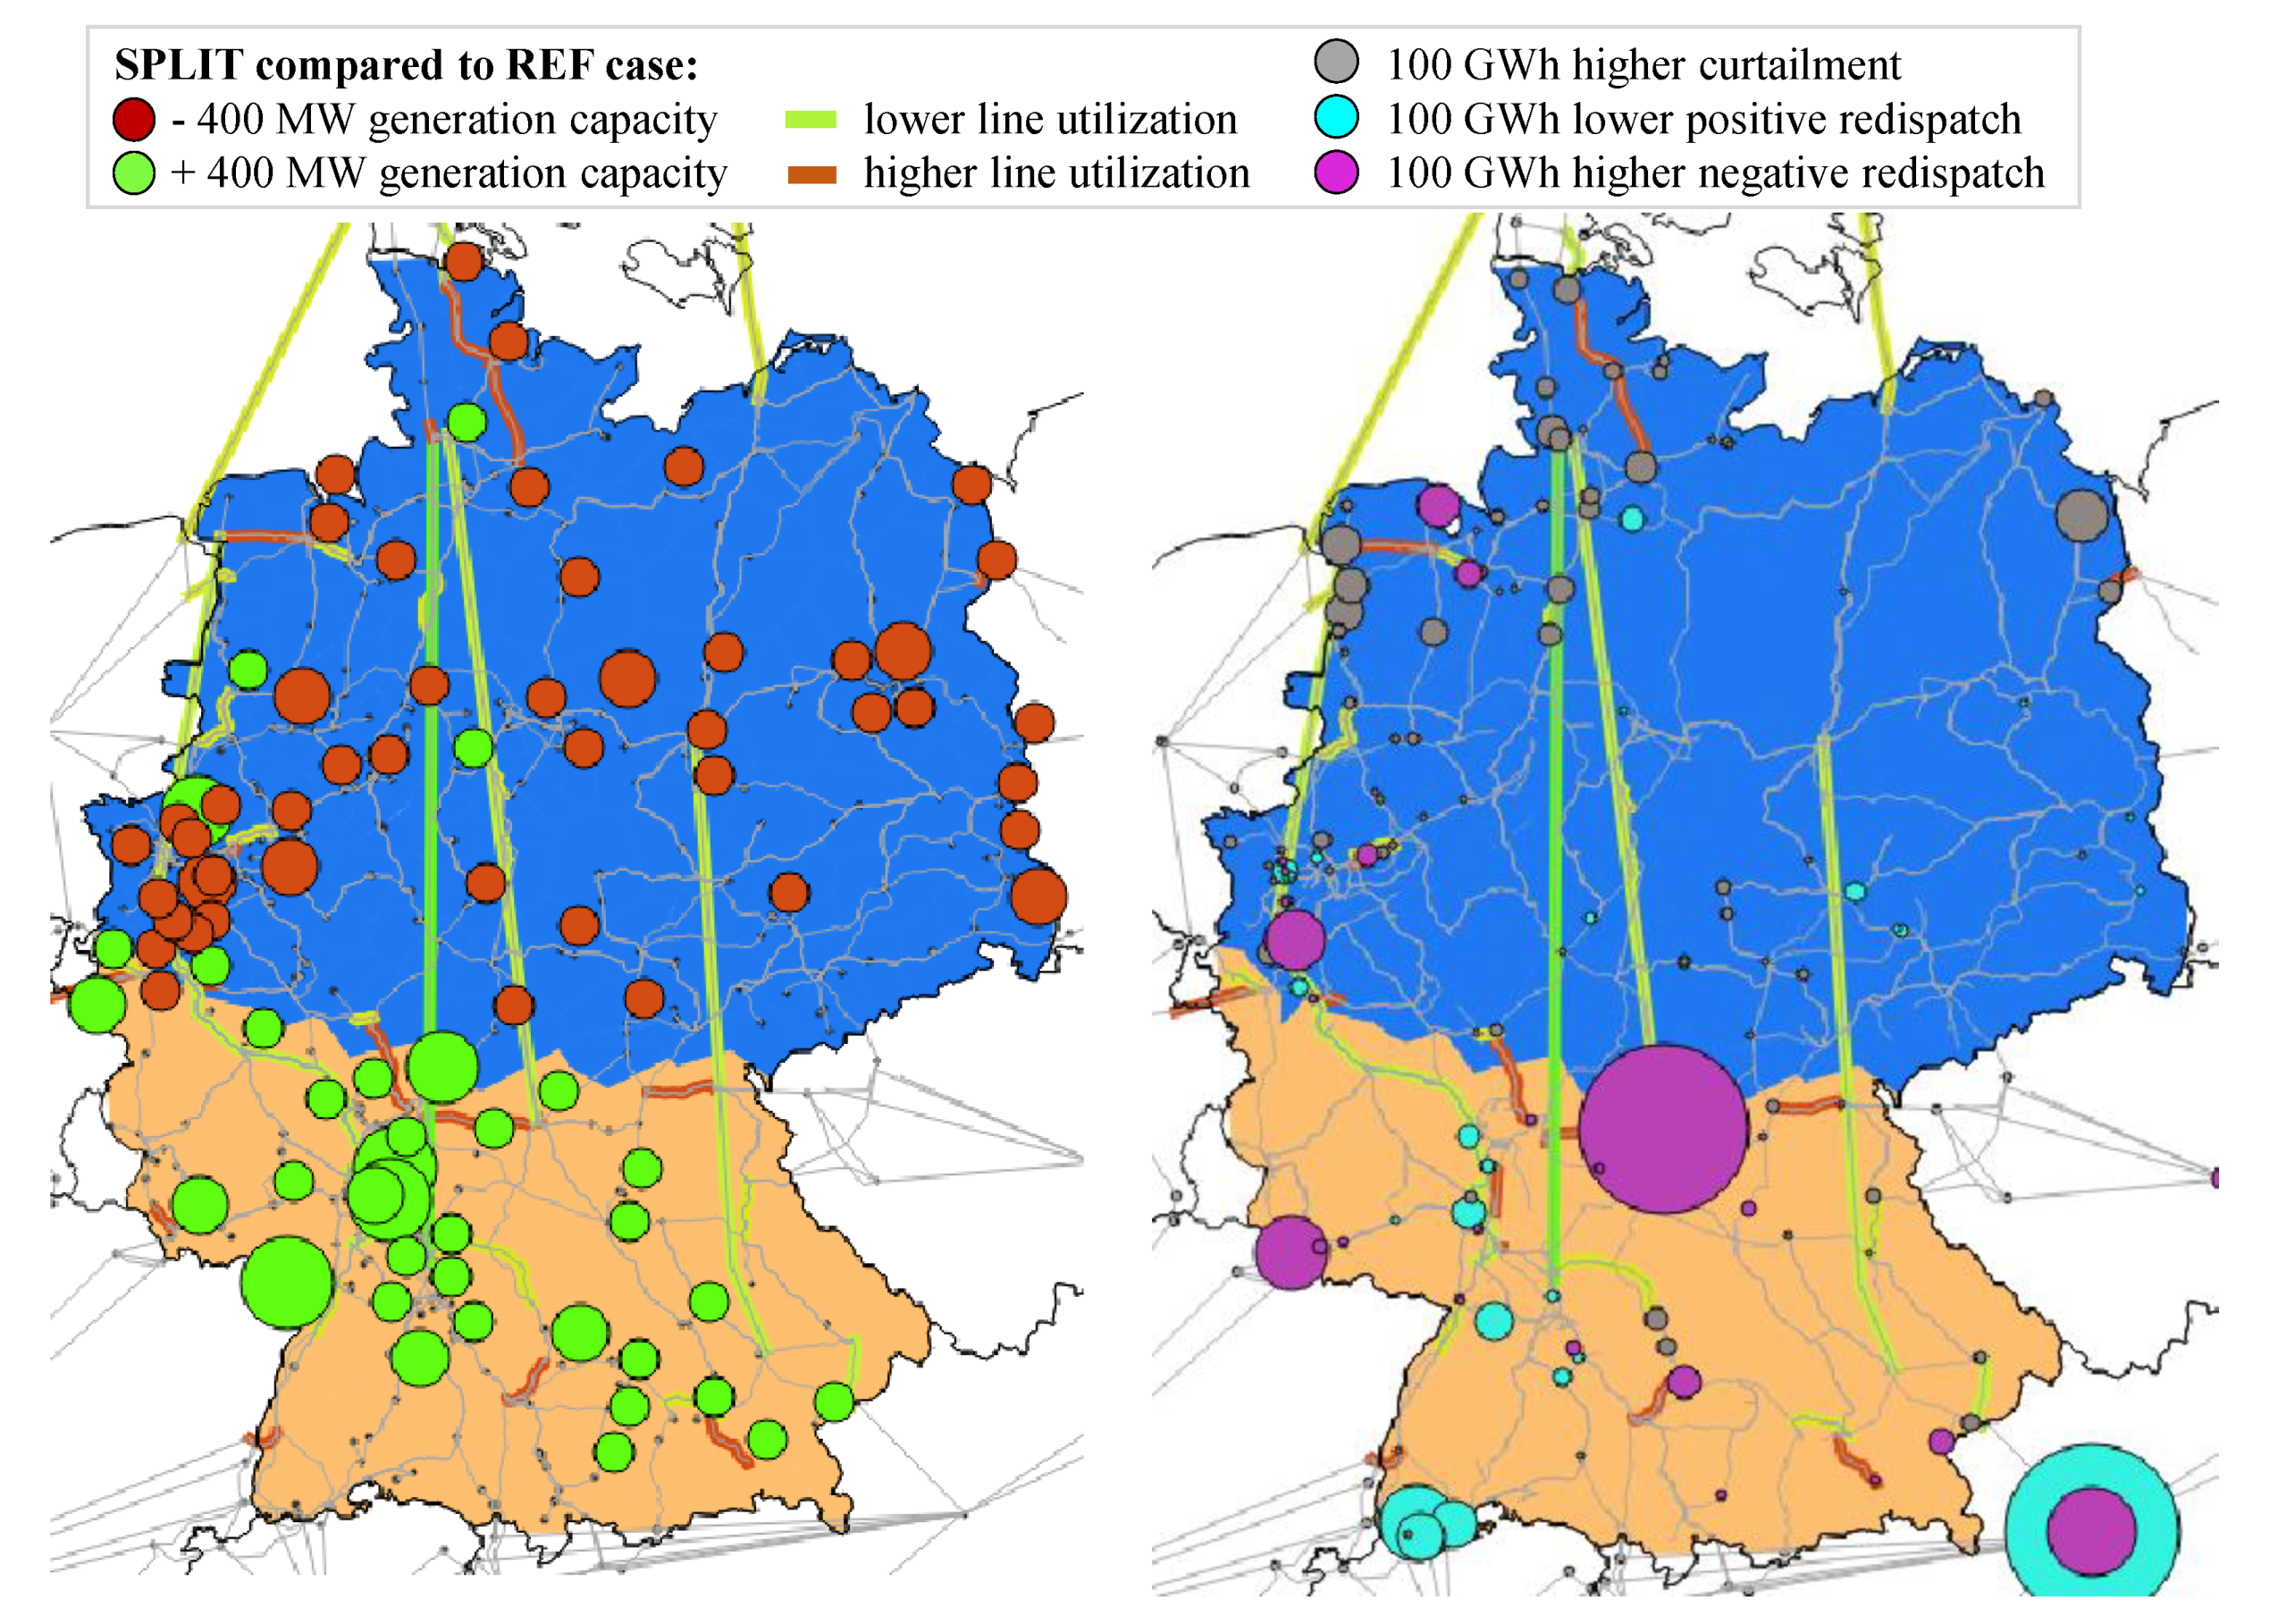
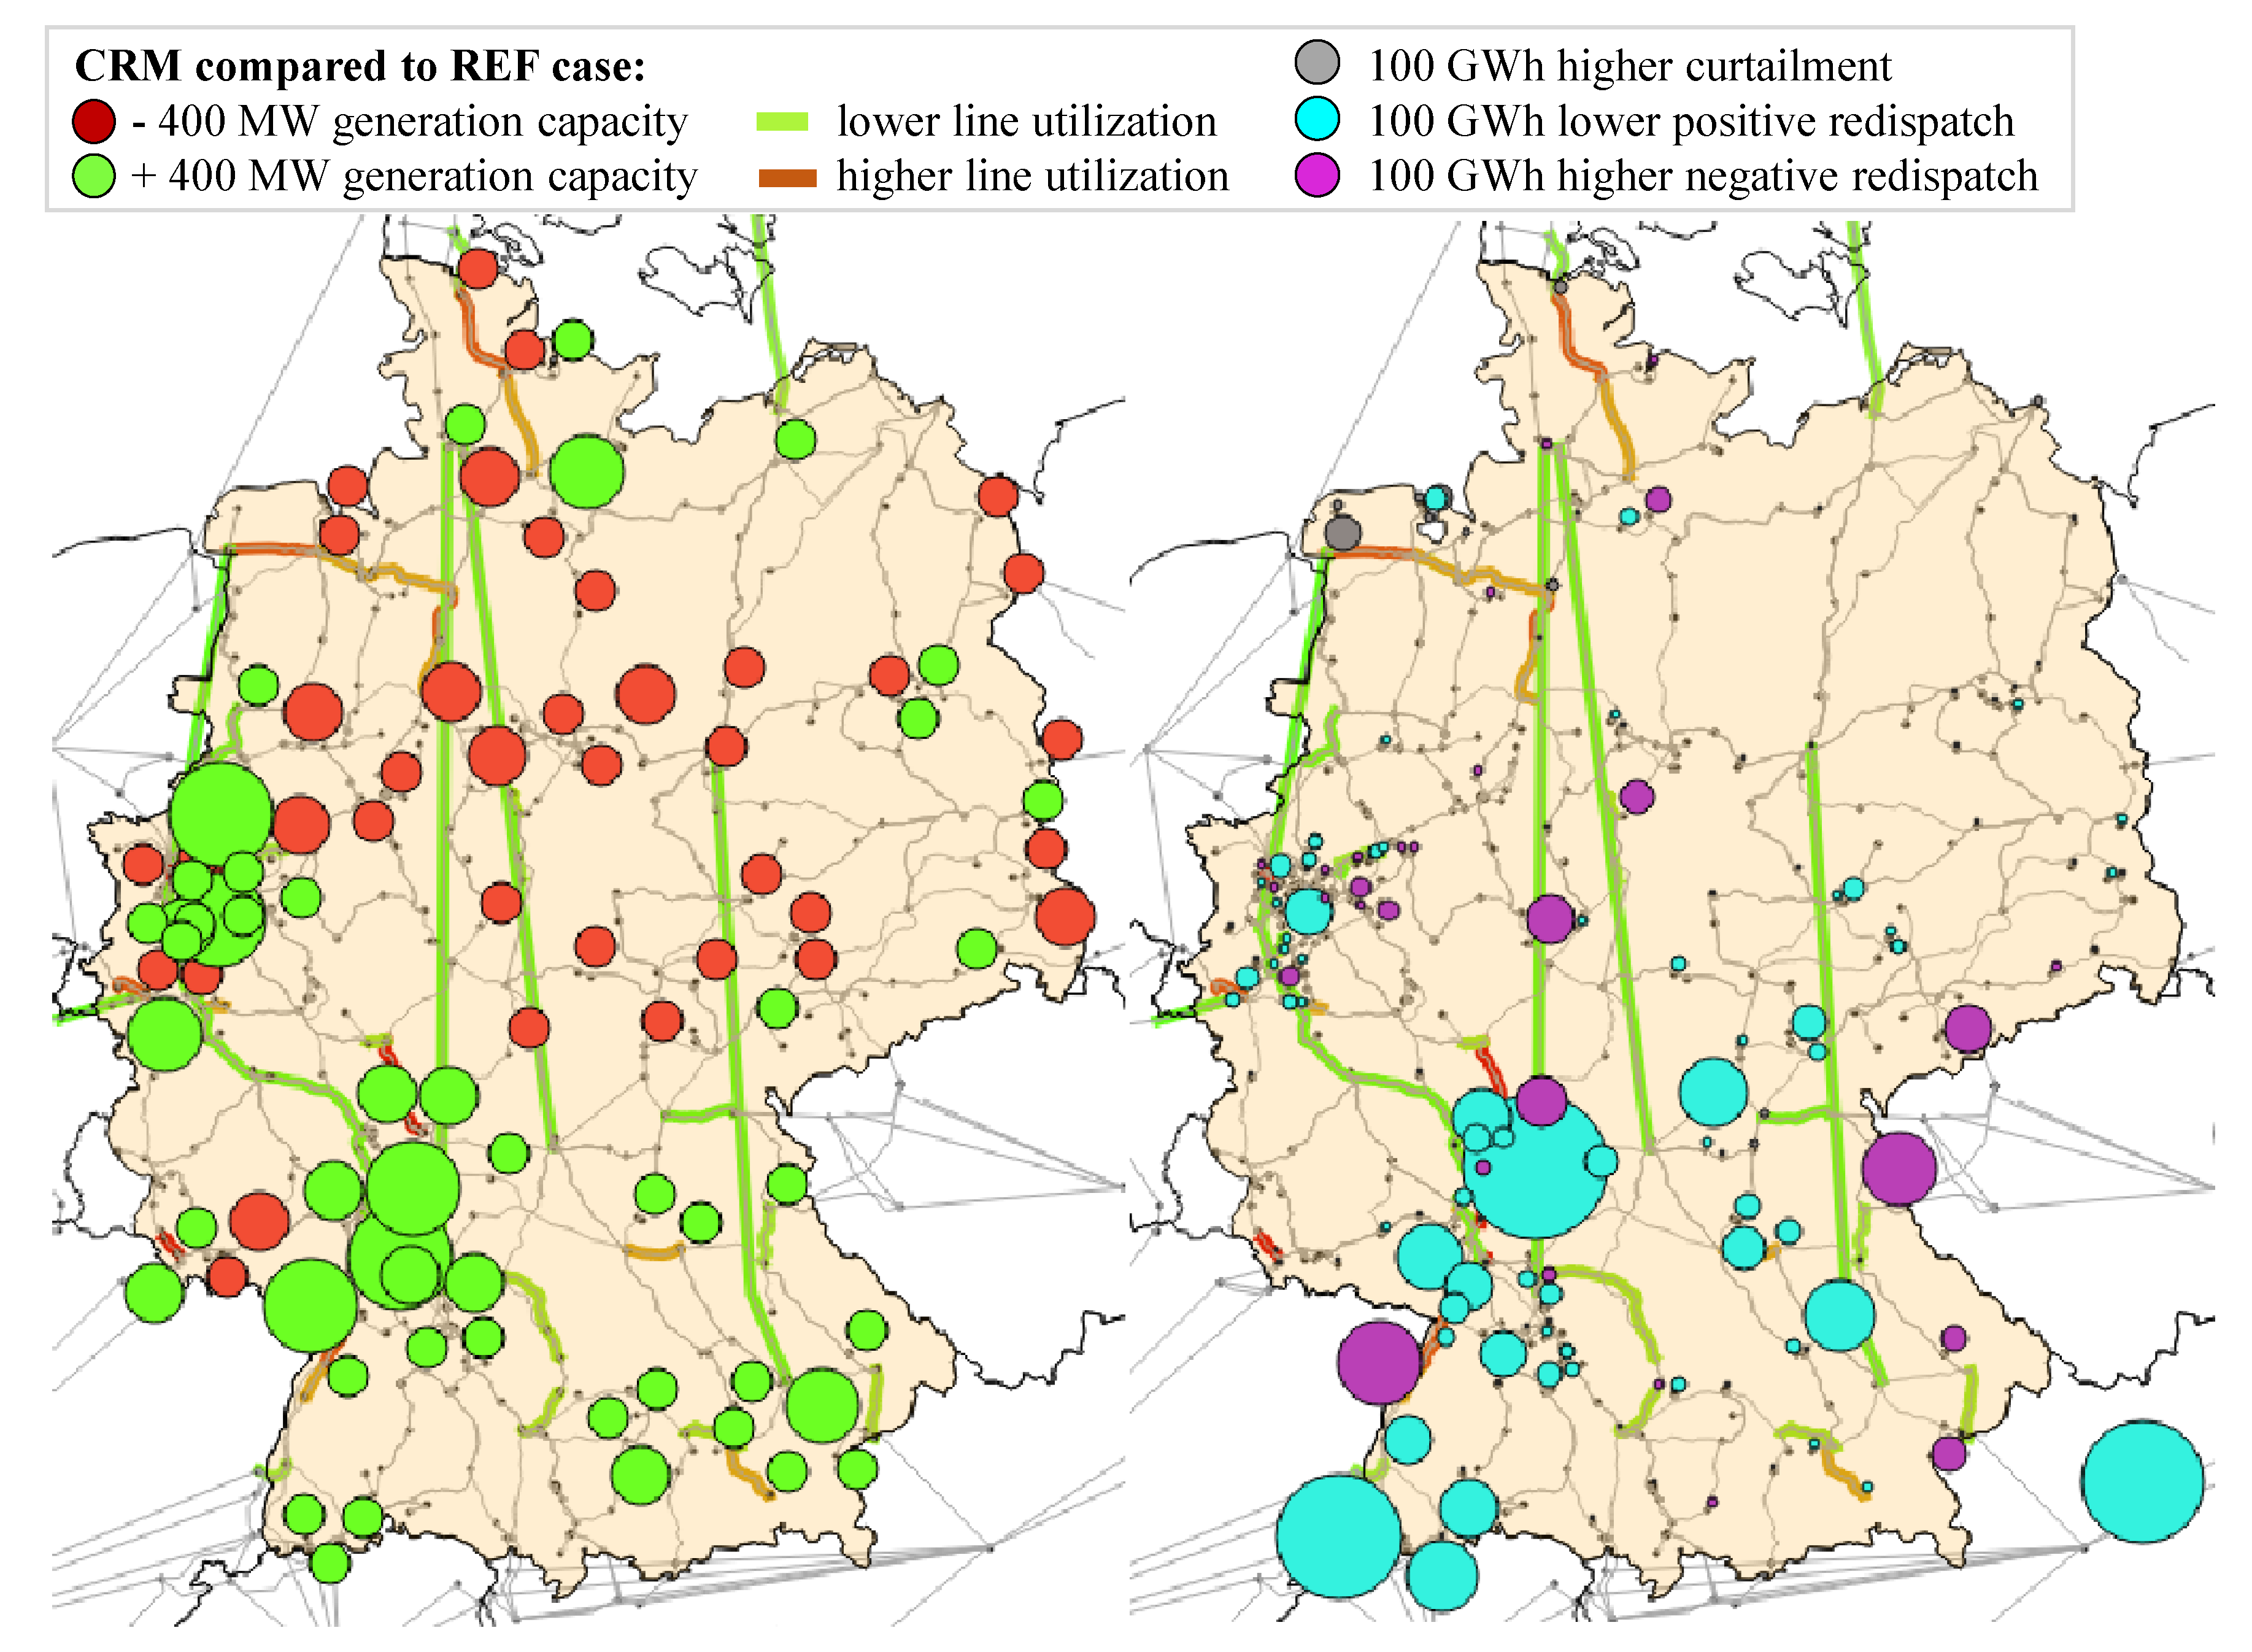
Table 1.
Overview of the investigated cases. The REF case reflects the current status quo in the real world and serves as a benchmark for the other cases. In the SPLIT case, the German market area is split into two zones in order to consider grid congestion already at the market clearing stage. The CRM case investigates the introduction of centralized capacity auctions with an additional grid indicator in Germany. This instrument aims to steer the allocation of new generation capacity.
| Case | Bidding Zones | Market Design | Allocation of New Power Plants |
|---|---|---|---|
| REF | national | EOM in Germany, status quo in other countries (cf. Figure 3b) | based on sites with decommissioned capacity |
| SPLIT | national, Germany split in two zones | EOM in Germany, status quo in other countries (cf. Figure 3b) | based on sites with decommissioned capacity |
| CRM | national | CRM in Germany, status quo in other countries (cf. Figure 3b) | based on sites with decommissioned capacity, additionally simplified consideration of grid bottlenecks |
© 2020 by the authors. Licensee MDPI, Basel, Switzerland. This article is an open access article distributed under the terms and conditions of the Creative Commons Attribution (CC BY) license (http://creativecommons.org/licenses/by/4.0/).
Share and Cite
MDPI and ACS Style
Hladik, D.; Fraunholz, C.; Kühnbach, M.; Manz, P.; Kunze, R. Insights on Germany’s Future Congestion Management from a Multi-Model Approach. Energies 2020, 13, 4176. https://doi.org/10.3390/en13164176
AMA Style
Hladik D, Fraunholz C, Kühnbach M, Manz P, Kunze R. Insights on Germany’s Future Congestion Management from a Multi-Model Approach. Energies. 2020; 13(16):4176. https://doi.org/10.3390/en13164176
Chicago/Turabian StyleHladik, Dirk, Christoph Fraunholz, Matthias Kühnbach, Pia Manz, and Robert Kunze. 2020. "Insights on Germany’s Future Congestion Management from a Multi-Model Approach" Energies 13, no. 16: 4176. https://doi.org/10.3390/en13164176
Note that from the first issue of 2016, this journal uses article numbers instead of page numbers. See further details here.