1. Introduction
The integration of distributed generators (DGs), such as wind turbines or photovoltaics, causes formerly unknown load flow situations that can endanger the operational security of power systems. In Germany, particularly in rural areas, the increasing installation of DG systems coincides with low hosting capacities due to the historical dimensioning of the network [
1]. Hence, violations of operational security limits, such as overvoltage problems or thermal overloadings of grid components, can occur more frequently [
2]. To prevent this, grid operators are required to enhance existing congestion management regimes. In the long term, grid expansion and reinforcement measures are required to ensure larger DG penetrations without jeopardizing the operational security of power systems. However, several studies have analyzed the grid expansion demand in Germany and agreed that the provision of a system without any bottlenecks solely through grid expansion or reinforcement is neither the most efficient solution at the distribution level (≤110 kV) [
3] nor at the transmission level (≥220 kV) [
4]. Consequently, an efficient utilization of existing grid capacities through operational congestion management approaches will become more relevant in the future in times of high renewable feed-in [
5].
In the literature, a wide range of congestion management regimes is investigated. Market design approaches, such as nodal pricing or market splitting [
6], consider network restrictions in the trading stage and therefore prevent congestions from the outset. Technical solutions, such as control of generation [
1], consumption [
7], or power flow controlling devices [
8], are used to solve congestions in short-term network security management. These can further be subdivided into market-oriented and direct congestion management measures [
9]. Market-oriented approaches require contractual agreements between grid operator and flexible consumers or generators, respectively. Local flexibility markets are a possible organizational form of these agreements. However, these markets face challenges regarding illiquidity, lack of customer participation, and regulatory problems [
10]. Direct congestion management measures are executable by the grid operator without the necessity of additional agreements. These can either be the application of controllable grid components, such as switching actions, or the control of generation or consumption in emergency situations [
9].
In Germany, both transmission system operators (TSOs) and distribution system operators (DSOs) are allowed to temporarily reduce the power injections of DGs to maintain grid security in critical situations. DG operators are then legally required to reduce their power generation output. Hence, this measure constitutes a direct emergency action and is called feed-in management (FIM). Although DG curtailment can only be exploited as a last resort in Germany [
1], a significant historical increase of these measures can be observed. In 2017, FIM caused annual costs of approximately 610 M€ because each curtailed DG was financially compensated [
11]. Consequently, reducing DG curtailment offers the potential to both significantly reduce the costs for congestion management and increase the hosting capacity of power systems for renewable energy generation. The remainder of the paper will thus focus on optimizing the practical implementation of DG curtailment as a congestion management measure.
Therefore, this work presents a simulation framework for DG curtailment based on load flow analysis. Different operational aspects to enhance grid capacity utilization compared to the recent best practice are investigated. Consequently, this work demonstrates possibilities to improve the practical implementation of DG curtailment and, thus, maximize the integration of renewable energy generation into power systems.
Several studies have examined selected aspects of DG curtailment as an operational congestion management measure. The effect of increasing the controllability of DGs on the resulting curtailment demand is analyzed in [
1]. The authors show that the amount of curtailed energy can be reduced by controlling small scale DGs individually and thus increasing the granularity of curtailment measures. In [
12] a linear state estimation algorithm and a remedial action scheme are developed and used to determine the optimal amount of DG curtailment based on the DC power flow model. The algorithms enable the substitution of preventive DG curtailment by offering fast automated control actions. The authors of [
13] show that a curtailment strategy based on power flow sensitivities can reduce the amount of power adjustments compared to established principles of access in the United Kingdom. The substitution of DG curtailment by fast-reacting curative congestion management measures is investigated in [
5]. The authors show that capacities of the transmission network can be utilized more efficiently, if fast-reacting measures, such as phase shifting transformers, are implemented. Reference [
14] proposes a congestion management regime including multiple voltage levels simultaneously. The results indicate optimization potentials regarding the coordination between grid operators of different voltage levels. In [
15], potentials for reducing the demand for redispatch and DG curtailment in the transmission network through dynamic line rating are depicted.
The above articles analyze selected aspects and their influence on DG curtailment. However, to the best of the authors’ knowledge, neither a comparative study taking into account multiple operational aspects simultaneously nor the validation of curtailment simulations based on real grid data have been carried out yet. One of the main contributions of this paper is thus the development of a curtailment simulation framework and its application to the model of a real 110 kV distribution network from a region located in Germany. To validate the simulated amount of DG curtailment, recent best practice approaches are first implemented into the framework and the results derived from load flow simulations are compared to curtailment measures from real grid operation. Another main contribution of this work is the proposal of three novel operational concepts to improve grid capacity utilization in critical operating states. These concepts include increasing the grid operator’s ability to control DG units by implementing smaller curtailment level increments, improving DG selection methods with a special focus on increasing the coordination between different grid operators and adapting the deterministic n-1 security criterion to maximize DG integration. Furthermore, combinations of the proposed concepts are investigated to demonstrate possible interdependencies. The concepts are implemented into the simulation framework and their potential to reduce the incidental amount of renewable energy curtailment compared to the best practice is quantified. Hence, by combining the proposal of different operational concepts and their implementation into the validated model of a real distribution network, this work extends the existing research in the field by quantifying the influence of several operational aspects on DG curtailment and by depicting potentials to maximize DG integration into power systems by enhancing the utilization of existing transmission capacities.
The remainder of the paper is structured as follows.
Section 2 introduces the simulation framework and discusses different operational aspects influencing DG curtailment. The current best practice regarding these aspects in grid operation and concepts to improve the practical implementation are discussed.
Section 3 includes a description of the 110 kV distribution grid model and the validation based on the simulation of best practice curtailment as a reference scenario. Furthermore, scenarios for the implementation of the proposed concepts are defined and simulation results for each of the scenarios are presented, summarized, and discussed.
Section 4 concludes the most relevant findings of the paper.
3. Implementation and Simulation Results
The developed simulation framework is applied to the model of a real 110 kV distribution network of a region located in Germany, which is characterized by a high share of installed DG capacities. Firstly, the model and data sources are described. Then, best practice curtailment approaches are implemented as a reference simulation scenario to validate the model regarding its capability to reproduce historical curtailment measures based on load flow simulations. Finally, different scenarios including the proposed novel concepts are defined and implemented, and the resulting reduction potential compared to the reference scenario is quantified and discussed.
3.1. Grid Simulation Model and Data Sources
The model of a real 110 kV high voltage (HV) distribution system with 100 nodes and a ring topology located in Germany is used as a case study in this paper. Grid topology data of the 110 kV level are provided by the respective grid operator and further extended by a simplified representation of the superordinate transmission system. Accordingly, the power flows at the interconnection points between transmission and distribution system are also modelled to simulate possible congestions of transformers operated by the TSO. The investigated 110 kV system is supplied by three interconnection points and operated by the DSO.
The amount of curtailment due to congestions on the subordinate medium voltage (MV) and low voltage (LV) levels is negligibly small, which can be derived from a dataset including historical curtailment requests in the region. Thus, grid restrictions on the MV and LV level are not considered. Instead, DG units and loads on the MV and LV level are modelled in aggregate at the interconnection point to the HV network. Historical measurements of active and reactive power flows of all HV/MV transformers with a resolution of 15 min are available, which enable time series load flow simulations. Since these measurements are aggregated and the wind feed-in needs to be known separately to determine curtailment potentials, the method presented in [
30] is used to disaggregate the measured time series into aggregated power injections of wind energy generators and the remaining part. Consequently, the simulation of curtailment is limited to wind turbines whereas other DG technologies are neglected. This assumption is expected as reasonable since FIM is mainly carried out using wind turbines [
11]. Additionally, the time series are distorted by historical curtailment measures since the feed-in of DGs is reduced in these situations. The disaggregation enables the simulation of times with historical curtailment measures since the potential DG feed-in can be estimated based on meteorological data. A clear sky model provides the solar radiation [
31] whereas the wind speed and ambient temperature are provided by the COSMO-DE analysis of the DWD (German Meteorological Service) [
32]. These are geographically interpolated to the coordinates of all MV grid districts. Measured time series of wind farms directly connected to the 110 kV level are not available. Therefore, these are created synthetically by using the meteorological data set and the performance curve of a typical wind turbine [
33]. The meteorological data set is also used to implement dynamic line rating for the respective 110 kV transmission lines. For this, each transmission line is assigned to the substation it has the shortest geographical distance to.
The balance of the total real and reactive power within power flow simulations in the region is ensured by the reference node on the 220 kV level. The parameters of transmission lines on the 110 kV level are provided by the respective grid operator (GO). Furthermore, the line lengths of the 220 kV lines are derived from a publicly available GIS database and the electrical parameters are extracted from a typical AL/ST 265/35 220 kV overhead line model [
34]. Capacities of 220 kV/110 kV transformers are also given through grid operator information, whereas the short-circuit voltage for power flow calculations is specified to 13% based on [
35]. A schematic graphical representation of the model is given by
Table 1 including an overview of all numbered model objects and the respective data sources.
3.2. Validation of Simulated Curtailment Demand
The aim of the model validation is to assess the extent to which the developed simulation framework is capable of displaying realistic curtailment measures. Therefore, the recent best practice approaches for DG curtailment are implemented into the framework and the simulated curtailment measures are compared to historical measures, which are derived from published data by the respective grid operators in the model region.
Firstly, the best practice scenario setup is implemented into the simulation framework. The feasible set of curtailment levels is considered as:
Furthermore, the iterative curtailment method is implemented and the curtailment requests by TSO and DSO are derived independently. In addition, the maximum loading of grid components in contingency situations is set to 100%. In the following, this scenario configuration is also considered as the reference scenario to evaluate the effectiveness of the proposed concepts.
The published data set of historical curtailment measures includes starting time, level (1, 0.6, 0.3, 0), ending time, and the receiving substation of each request. Due to the frequent occurrence of curtailment requests in the historical data set and the availability of comprehensive time series data, February 2016 was selected as the investigated time period in this work.
Hence, the historical curtailment of DG units is determined using the respective time series and the historical data set with a resolution of 15 min. For the same time horizon, the incidental curtailment using the best practice approaches is simulated. Therefore, in each time step, a contingency analysis is executed to assess the security state of the network. In the alert state, DG curtailment is requested as a preventive congestion management measure. In case of multiple critical contingencies, grid operators usually initiate countermeasures ordered by the severity of operational limit violations [
22]. Subsequently, the amount of curtailment is determined for the most severe contingency at first. This is iteratively repeated until all congestions in each possible n-1 event are terminated.
Firstly, according to the cascading grid operation approach (
Figure 2), congestions on the TSO level are identified by performing a contingency analysis of all 220/110 kV transformers in the grid area. For all insecure grid states, the resulting amount of DG curtailment is derived by the simulation framework. Since most curtailment measures contained in the historical data set result from congestions of transformers connecting the transmission and distribution system it is assumed that the TSO requests FIM measures only to prevent overloadings of transformers. Thus, congestions of 220 kV transmission lines are not considered in this work. After deriving curtailment requests by the TSO, another contingency analysis is executed to determine the security state of the 110 kV system and derive curtailment requests by the DSO if necessary. Although the curtailment demand is determined for each installed DG unit individually, simulation results are validated for the total amount of curtailment in the investigated region to assess the overall amount of incidental renewable energy curtailment.
3.2.1. Validation Metrics
In the first step of the validation process, the accordance of simulated curtailment with the historical measures in each of the 15-min intervals is analyzed. Therefore, each simulation step can be assigned to one of the four binary states visualized in
Table 2. In each time step, it is examined if the historical data set contains any curtailment requests and if curtailment requests are simulated based on the best practice approach. Consequently, four different combinations (a, b, c, d) of these aspects are possible [
37].
To increase the comparability of the simulation results achieved in this work, these are put in relation to the study of [
2] as a reference. There, the authors developed a congestion forecast model based on autonomous neural networks for a German transmission network and validated it based on historical data about congestion management measures. Although neither these measures are quantified nor multiple system levels are considered in [
2], the results can be compared to the simulations carried out in this work regarding the ability to represent historical congestion situations. The precision (p), recall (r), and f1-score (f) are used as similarity indices between simulation and historical values in [
2], which are defined as follows:
For each of those indices, a value of 1 indicates total similarity. Additionally, in this work the mean absolute error (MAE) and the root mean square error (RMSE) are used as error metrics to assess the accuracy of curtailment simulations, which are defined as follows [
38]:
where n describes the number of simulated time steps, P
curt,historic the amount of power reduction in the historical data set, and P
curt,simulated the simulated power curtailment per time step.
Due to the independent simulation of curtailment requests by the TSO and the DSO, the similarity indices and error metrics are calculated separately for both grid operators. In addition, the aggregated results, defined as the sum of TSO and DSO curtailment requests, are determined.
Table 3 depicts the resulting similarity indices from reference [
2] compared to those achieved in this paper. Furthermore, the resulting MAE and RMSE from this work are depicted. In order to visualize the significance of the absolute values for the error metrics, the maximum amount of simulated power curtailment is also depicted.
According to
Table 3, regarding all similarity values, the simulation of TSO curtailment is more accurate compared to [
2], whereas DSO measures are depicted less accurately. The results also show that the aggregated consideration has the highest values in all similarity indices. Both error metrics have the lowest values for the DSO curtailment and the highest values for the aggregated consideration.
Consequently, the similarity metrics indicate a lack of accuracy regarding the simulation of curtailment requests by the DSO. This is due to several reasons. In particular, the recall r of only 26.3% indicates a poor model performance. Since this index is dependent on the inaccurate state b, it can be concluded that a large number of historical DSO requests do not appear in the simulation results, because the corresponding congestions are already resolved by the prior determined TSO curtailment demand. In 86% of the times assigned to state b, TSO requests are simulated. Hence, congestions in the distribution network are often already resolved and no additional DSO curtailment is necessary. On the contrary, 58% of times assigned to state c are accompanied by an underestimation of TSO curtailment requests. Consequently, the precision p is also influenced by this dependency but to a smaller extent. Accordingly, this index indicates a larger similarity of 46.2%. The MAE values are relatively small compared to the maximum occurring power reductions in all three cases. The RMSE values are considerably larger than the MAE values. Hence, it can be concluded that the curtailment simulation values occasionally include larger deviations from the historical values, since the RMSE is more sensitive to large errors than the MAE [
38]. However, both error metrics are relatively small compared to the maximum occurring values. The differences between simulation results and historical data are further visualized by the time series comparison of requests by the TSO, DSO and the aggregated amount of DG curtailment in
Figure 3. The time series confirm the high degree of temporal coincidence between simulation and historical values. Occasionally, larger deviations are apparent, which contribute to the larger RMSE values.
Overall, the simulation of curtailment measures requested by the DSO is highly influenced by the simulation of the TSO demand beforehand, which also contains errors, as can be seen in
Table 3. Nevertheless, the aggregated results gain the highest similarity values and only slightly higher values in the error metrics. This confirms that some measures historically requested by the DSO are mistakenly simulated as measures by the TSO and vice versa. The relatively low values of MAE and RMSE and the graphical time series comparison in
Figure 3 confirm the accuracy of simulated DG curtailment, particularly considering the aggregated results.
Possible sources of errors decreasing the accuracy of curtailment simulations are the meteorological data which affect both the wind power time series and the dynamic line rating approach. As stated in [
39], the quality of the dynamic line rating approaches could be improved by further increasing the maximum geographical resolution of 2.8 km of established meteorological models, which are also used in this work. This is especially relevant for the 110 kV lines and, thus, for the curtailment requests by the DSO. Additionally, due to the available data basis, the simulation was carried out for 15-min time intervals. However, grid security is typically assessed more frequently (e.g., in intervals of 2 [
40] or 5 [
41] min) by state estimation algorithms. Therefore, the practical security assessment fluctuates more than in the simulations, which can also affect the derivation of curtailment measures.
3.2.2. Comparison of Historical and Simulated Renewable Energy Curtailment
In addition, the total amount of renewable energy curtailment in the considered time horizon is derived from the data of simulated and historical curtailed power per time step. The resulting amounts of energy curtailment requested by TSO, DSO, and aggregated are depicted in
Figure 4.
The curtailed energy due to requests by the TSO is slightly underestimated by 1.78 GWh (6.5%), whereas the demand from the DSO is overestimated by 1.43 GWh (45.6%). Consequently, the combined energy amount is underestimated by 0.35 GWh or 1.1%. Accordingly, the model is able to project the historical curtailment measures regarding the total amount of curtailed energy very well. The share of TSO requests in the aggregated amount is comparably large in the simulation (84.89%) and the historical (89.74%) dataset. Consequently, most curtailment requests are due to congestions of transformers linking the distribution and transmission system.
Overall, the similarity measures, time series analysis, and evaluation of the curtailed energy indicate the capability of the simulation framework to represent the demand and number of curtailment measures in the investigated region to a reasonable extent. Despite inaccuracies regarding the allocation of curtailment measures to the requesting grid operator, the aggregated simulation results are particularly promising. Therefore, the developed simulation framework is assumed to achieve reasonable results regarding the simulation of DG curtailment. The resulting amount of renewable energy curtailment of 30.27 GWh in the reference scenario is thus further used to assess the extent to which the proposed operational concepts can increase grid capacity utilization and, thereby, decrease the incidental amount of DG curtailment.
3.3. Scenarios for the Implementation of Novel Operational Concepts
Section 2 discusses relevant aspects influencing the demand for DG curtailment including the description of recent best practice approaches and possible concepts to improve the practical implementation on a theoretical basis. Based on different scenarios, these concepts are implemented into the simulation framework to quantify their benefit in terms of maximizing the integration of renewable energy generation into the investigated 110 kV distribution network. The concepts include increasing the DG controllability by extending the feasible set of curtailment levels. In addition, the implementation of the proposed novel DG selection procedures is investigated. These include the coordination of curtailment requests between TSO and DSO by implementing both the optimization (Equation (3)) and the hybrid selection method (Equation (7)) into the simulation framework. Finally, the concept of improving the utilization of transmission capacities by increasing the maximum permissible loading of grid components in possible contingency events is considered. However, the implementation of one of these concepts does not exclude the coincident implementation of the others. Instead, combinations can be also realized to improve the DG curtailment process regarding different aspects simultaneously.
Table 4 gives an overview of the investigated scenarios regarding the considered adaptations compared to the best practice reference scenario.
Firstly, the reference scenario includes four discrete curtailment levels, the iterative selection scheme accompanied by independent curtailment request of TSO and DSO, and a maximum loadability of grid components of 100% in contingency events. The first scenario quantifies the benefit of decreasing curtailment level increments and thereby enabling the grid operator to control DG units to a larger extent. The DG selection procedure and maximum permissible loading in contingency events remain unmodified in comparison to the reference scenario. The second scenario supplements the larger control opportunities by also implementing the optimization and hybrid approaches as candidate DG selection methods and thereby improving the coordination between TSO and DSO. Finally, the last scenario quantifies reduction potentials of DG curtailment dependent on increasing the maximum loadability of grid components in n-1 events. This scenario also considers the different DG selection methods. In the following, simulation results for each of the described scenarios are presented.
3.4. Curtailment Reduction Potentials of Proposed Concepts
3.4.1. Scenario 1: Extended Feasible Set of Curtailment Levels
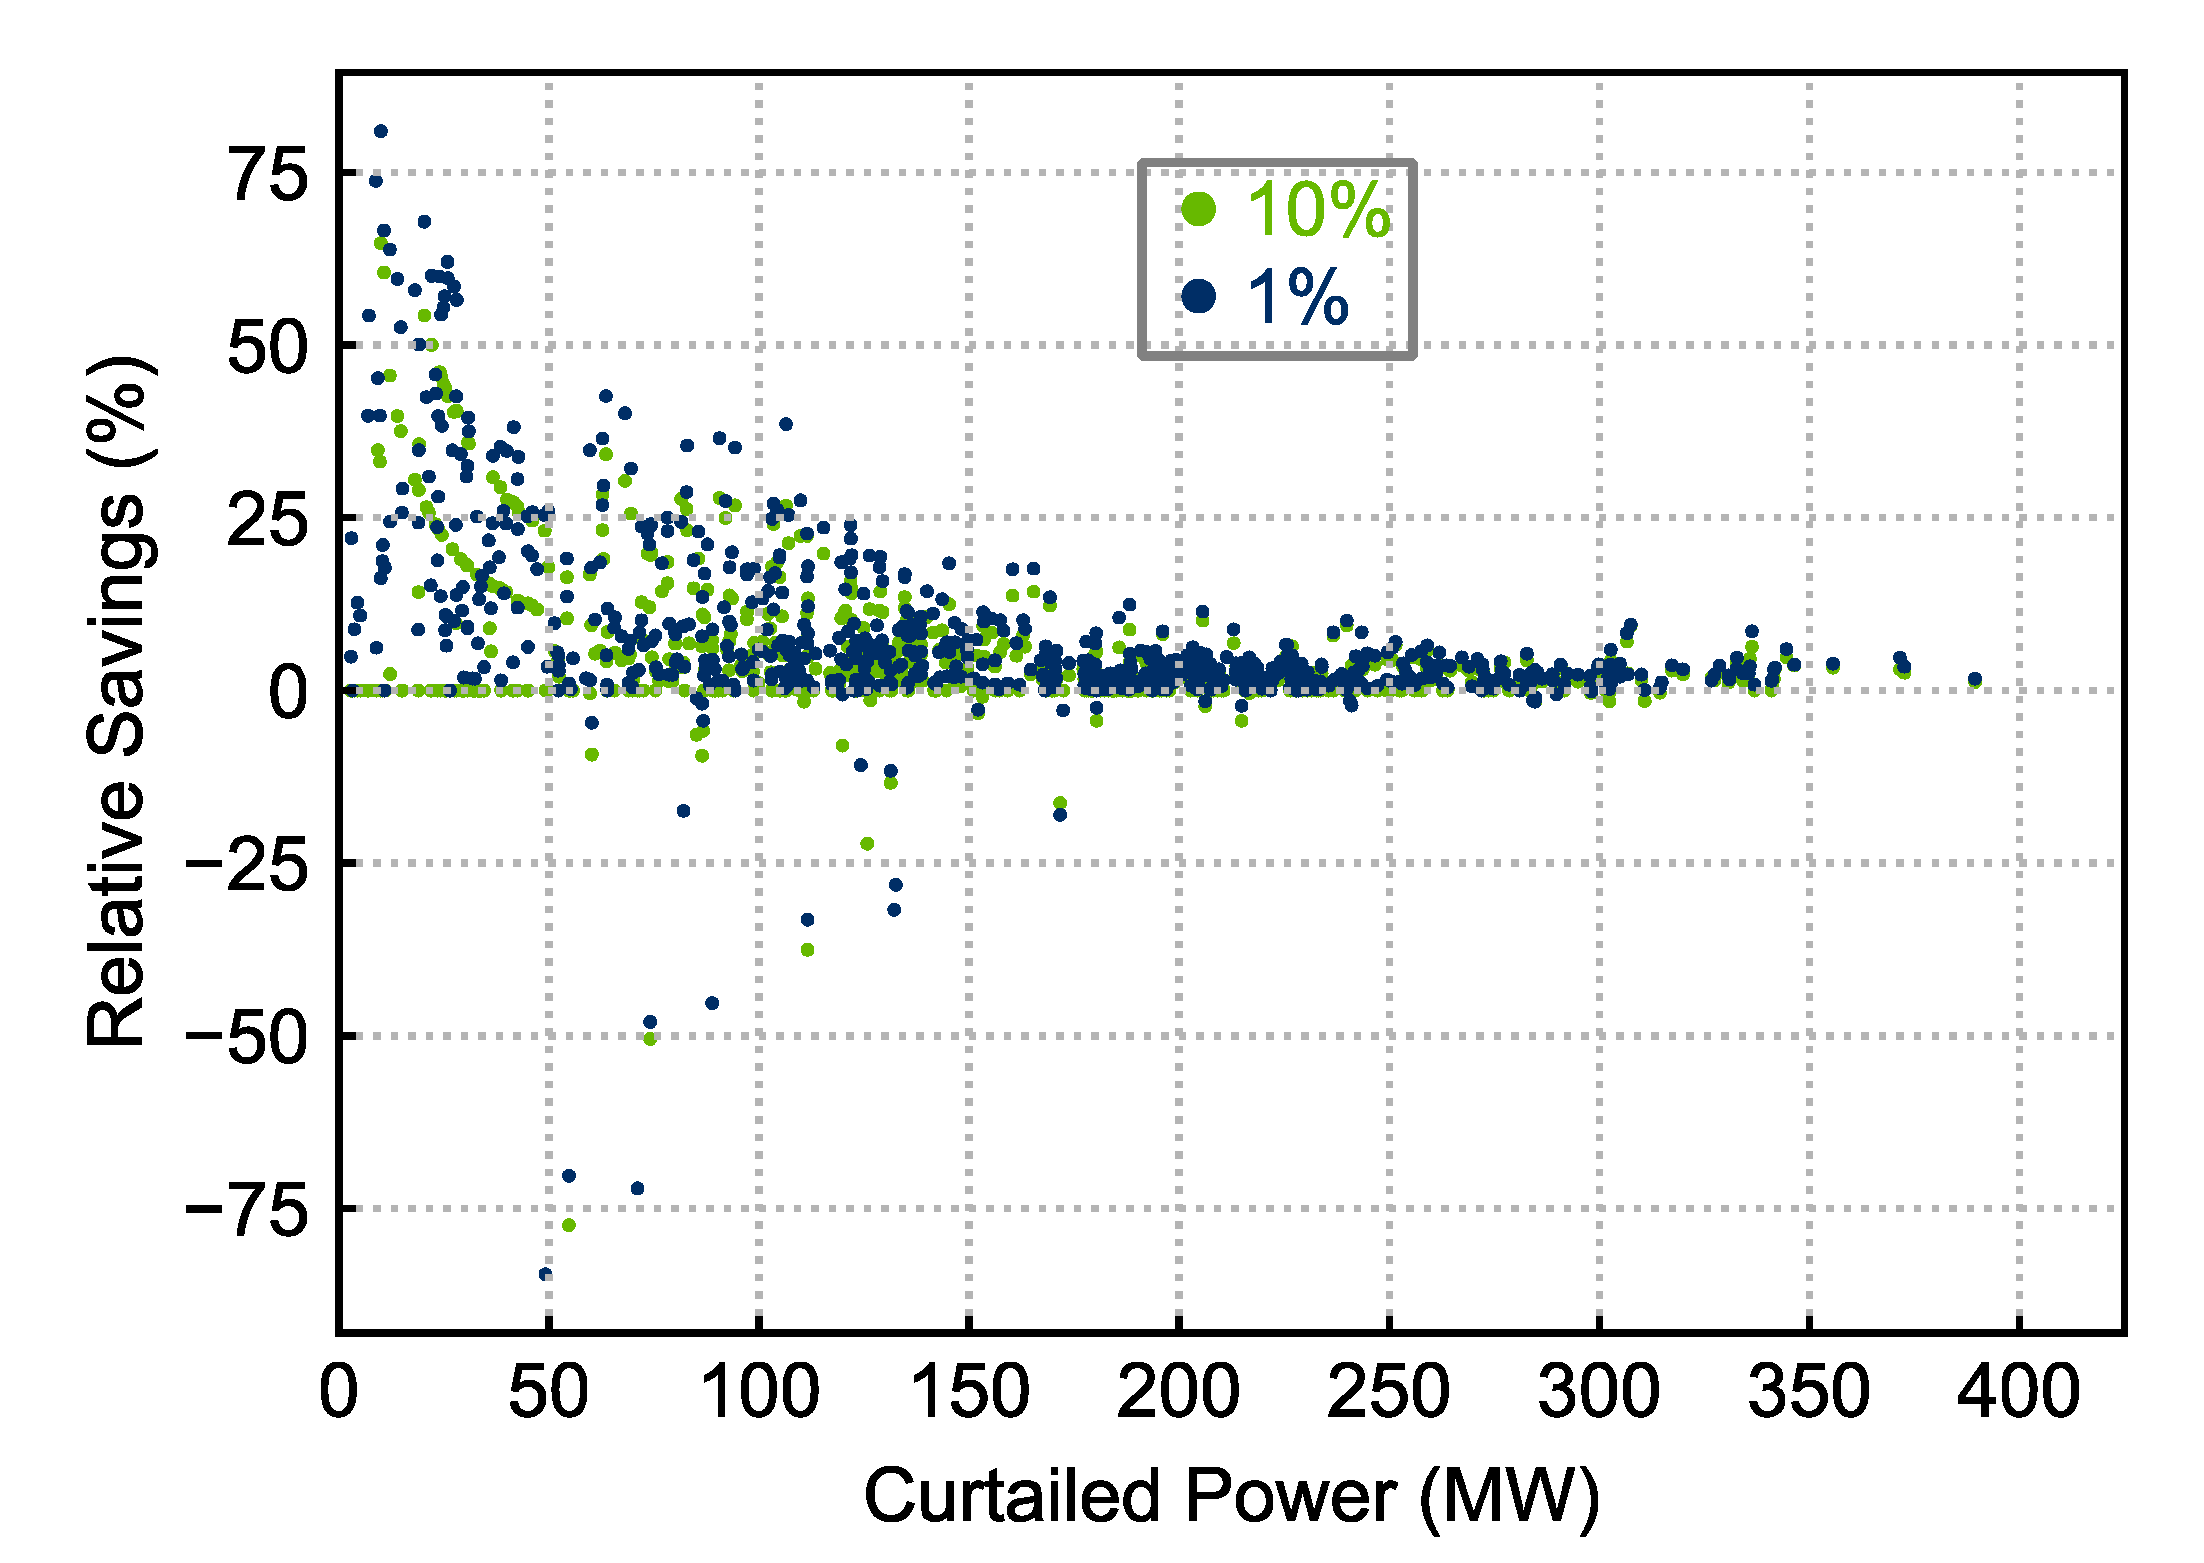
Smaller curtailment level increments enable more efficient requests due to the enhanced DG control capability of grid operators. Consequently, feasible sets of curtailment levels with smaller increments compared to the best practice approach are implemented into the simulation framework to quantify the benefit of this concept. The incremental sizes investigated in this scenario are 10% and 1% related to the nominal capacity of DG units.
Table 5 depicts the resulting amount of DG energy curtailment within the considered time horizon of one month requested by DSO, TSO, and the aggregated sum of both in comparison to the reference scenario with only four discrete levels.
Curtailment requested by the DSO can be reduced by 0.41 GWh (9%) for 10% and 0.58 GWh (12.7%) for 1% increments. Moreover, TSO curtailment can be reduced by 0.51 GWh (2%) and 0.72 GWh (2.8%). Accordingly, the aggregated savings amount to 0.92 GWh (3%) and 1.3 GWh (4.3%) for 10% and 1% increments, respectively. The results show that the reduction of the total amount of curtailment is comparable between DSO and TSO. Consequently, the relative savings achievable by the DSO are distinctly higher. Due to the iterative selection scheme applied in this scenario, the benefit of smaller curtailment level increments is limited to the least sensitive DG unit affected by the respective request, because each of the other affected units is fully curtailed. Hence, the relative reduction of curtailed energy is reduced significantly only in the case of less severe congestions that induce a small amount of total power curtailment.
This effect is illustrated in
Figure 5, which shows the relative reduction of the aggregated amount of DG curtailment requested by TSO and DSO gained by 10% and 1% increments per time step depending on the respective amount of total power reduction. The relative savings are related to the best practice increments. It becomes clear that the highest relative savings are achieved at the less severe congestions. Smaller increments tend to only have minor advantages in situations with large amounts of power reductions. As depicted by
Table 5, the relative reduction potential is thus considerably lower for TSO requests, since these exhibit larger amounts of power adjustments compared to DSO curtailment.
Furthermore, a few measures show negative savings for 10% and 1% increments in
Figure 5. This is due to the fact that TSO curtailment also reduces congestions at the distribution level. Therefore, the avoidance of TSO requests can inevitably lead to a higher amount of curtailment demand at the distribution grid level. Consequently, the aggregated amount resulting from smaller increments can even exceed the demand induced by larger increments in certain situations.
In total, the advantage of decreasing the curtailment level increments is its easy implementation into existing grid control strategies, since modern communication standards and technologies already enable a finer granularity in DG controllability compared to FIM [
20]. However, the simulation results in this scenario imply that the potential to reduce the curtailed energy is limited to a few percent due to the frequent occurrence of severe congestions in real grid operation practice, especially in combination with the iterative DG selection approach. Therefore, the benefit of this concept is also assessed in combination with implementing the novel DG selection methods in the following scenario.
3.4.2. Scenario 2: Coordinated DG Selection Methods
In this scenario, the optimization approach (Equation (3)) and the hybrid approach (Equation (7)) are implemented as candidate DG selection methods to increase the coordination between TSO and DSO. The benefit of this concept is assessed based on both the potential to reduce the resulting amount of renewable energy curtailment and the complexity of its practical implementation compared to the best practice iterative approach. Therefore, in addition to the resulting amount of DG curtailment, the number of necessary control signals is also considered to evaluate the communication demand associated with the implementation of this concept.
To implement the hybrid approach (Equation (7)), firstly a suitable choice for the fixed cost parameter c
fix in the objective function has to be determined. Therefore, this parameter is varied iteratively between 100 € and 500 € in steps of 100 € and analyzed regarding its influence on the curtailed energy and the number of requested measures. Both variables are depicted in
Table 6 dependent on the respective fixed cost parameter. In addition, the results obtained from the reference scenario are shown. As expected, the lowest fixed cost parameter (100 €) causes the lowest amount of curtailed energy but the largest number of measures. In contrast, the highest fixed cost parameter of 500 € prioritizes the number of measures over the amount of curtailed energy. Compared to the reference case, an increase in the number of curtailment measures for all parameters is present, whereas the amount of curtailed energy is lower. For the further analyses in this work, the parameter is set to a value of 300 €, since this causes a considerable reduction of curtailed energy (2.79 GWh) while increasing the number of curtailment measures acceptably (49.43%) compared to the iterative approach.
The three different DG selection methods are compared regarding the incidental amount of renewable energy curtailment and the number of resulting curtailment requests. In addition, the approaches are combined with the concept of smaller curtailment level increments to show possible interdependencies between both concepts. Therefore, nine different scenario specifications are investigated. The resulting energy curtailment and the number of measures are visualized in
Figure 6. The different increments are represented by varying colors, and the number and the amount of curtailment are reflected by different markers (‘o’,’x’), respectively.
The iterative approach yields the least number of measures and the highest amount of curtailed energy. Decreasing the curtailment increments mainly reduces the curtailed energy (
Section 3.4.1.), whereas the number of measures nearly remains constant. In contrast, the implementation of the optimization approach reduces the amount of curtailed energy by up to 3 GWh (10%) at the expense of 1660 additional curtailment requests. In contrast to the iterative approach, the energy amount remains constant with decreasing increments whereas the number of measures can be reduced considerably. This is due to the fact that smaller increments result in a higher flexibility regarding the controllability of DGs. Therefore, it is less probable that curtailment measures are firstly cancelled and, subsequently, reactivated if congestions return. Smaller increments allow the grid operator to carefully return the DGs feed-in to the initial value while monitoring the operational security limits of the network. Finally, the hybrid approach nearly obtains the same amount of curtailed energy compared to the optimization approach (dashed trend line) and a similar number of curtailment measures compared to the iterative approach (dotted trend line). Moreover, the dependence of this approach on the incremental size is relatively small.
Overall, the hybrid approach yields the best trade-off between the amount of curtailed energy and the complexity of its practical implementation. Combining this strategy with smaller increments only has a minor effect on both of these aspects. However, compared to the iterative approach, the curtailed energy can be reduced by 2.78 GWh at the expanse of 216 additional curtailment measures. Considering the average financial reimbursement of DG operators, reducing curtailment by 2.78 GWh could save 305,800 € of compensation payments within the investigated time period of one month. Concurrently, 1444 measures can be avoided compared to the optimization approach, which reduces the communication demand and the complexity of the implementation into grid operation significantly. This is realized at the expense of increasing the amount of curtailed energy by only 0.24 GWh.
3.4.3. Scenario 3: Increased Loadability in Contingency Events
Increasing the loadability of grid components in contingency events requires the availability of fast-reacting curative congestion management measures, such as fast power flow controlling devices, to terminate the occurring overloading in case of n-1 events as soon as possible. In this work, these measures are not explicitly investigated. Rather, the focus is on analyzing the resulting demand for preventive curtailment measures in the alert security state, if grid components can be loaded more heavily in case of contingency events.
This concept is implemented into the simulation framework by increasing the maximum permissible real power flow P
comp,max,n-1 in the security constraints (Equation (9)). Therefore, the maximum thermal loading of grid components is enhanced iteratively in steps of 5% until a maximum value of 130% related to the physical limit of grid components in this scenario. Hence, a value of 130% assumes that the loading of grid components in any contingency situation is preventively reduced to a maximum value of 130%. If this contingency actually occurred during grid operation, curative measures would have to ensure the return of the thermal loading to a value below 100% as quickly as possible. Concurrently, a maximum thermal loading of grid components of 100% in the base case is assured and, thus, the system remains in the alert state and does not reach the emergency state. Furthermore, the concept is applied for the iterative, optimization, and hybrid DG selection methods. The resulting amount of renewable energy curtailment for different maximum loading values and the different selection methods is depicted in
Figure 7.
The results clearly illustrate the potential to reduce the incidental DG curtailment significantly by increasing the thermal loadability of grid components in n-1 situations. By enhancing the thermal loadability to 130%, the curtailed energy amounts to only 1.56 GWh, which is 5.2% of the initial value. According to
Figure 7, the differences between different DG selection methods decrease as the loadability is increased. Hence, the potential to reduce DG curtailment by implementing novel selection methods is lowered due to the massive reductions obtained by increasing the loadability of grid components in contingency events.
In addition to curative congestion management measures, another possibility to increase the loadability of grid components in contingency events is to consider their thermal inertia, as presented in [
15]. Using more detailed thermal models of components, the temperature rise in contingency situations can be simulated dynamically and, thus, a critical time can be derived until the maximum temperature of transmission lines or transformers is reached to derive timely congestion management measures.
3.4.4. Summary and Discussion
To summarize the presented simulation results from the investigated scenarios,
Table 7 presents the curtailment reduction potentials of the proposed concepts and evaluates the complexity of implementing these concepts into grid operation practice. The potential to reduce the incidental amount of DG curtailment by implementing smaller curtailment level increments of 10% and 1% was proven to be small due to the frequent occurrence of severe congestions. However, the implementation of this concept can be realized without large expanses since modern communication standards and technologies already enable a finer granularity in DG controllability compared to best practice [
20]. Furthermore, simulation results show that the amount of DG curtailment can be reduced by implementing novel DG selection methods. The hybrid approach was proven to be the most suitable approach for the practical implementation since it nearly reaches the same reduction of renewable energy curtailment (9.48%) compared to the optimization approach (10.14%), while reducing the complexity of operational implementation by reducing the number of curtailment requests significantly. The coordinated curtailment procedure requires an extended data exchange between different grid operators regarding the demand for power flow adjustments and power flow sensitivities considering multiple system levels. Due to the low complexity of their practical implementation, both of the aforementioned concepts could be realized in the near term to maximize the integration of DG units into power systems. However, in the long-term perspective the concept of utilizing existing grid capacities by allowing heavier loadings of grid components in uncertain contingency events should be intensified since it clearly shows the highest potential to reduce incidental renewable energy curtailment, by up to 94.8%. On the contrary, this concept requires the implementation of curative congestion management measures or dynamic thermal models of components into grid operation. Therefore, future research should address the question of whether investments in novel curative technologies can be justified by their potential to reduce the amount of renewable energy curtailment quantified in this work.
4. Conclusions
The on-going integration of DGs into the energy system causes an increase in curtailment measures executed by grid operators due to limited transmission capacities. To address this problem, this paper presents a simulation framework for optimizing the practical implementation of DG curtailment based on load flow analysis. The framework proved to be sufficient for simulating the curtailment demand in the investigated region in Germany, although the allocation of curtailment measures between DSO and TSO shows some inaccuracies. The framework is further used to analyze the ability of three operational concepts and combinations of these to reduce renewable energy curtailment. Firstly, an enhancement of DG controllability is investigated. Furthermore, novel DG selection methods are proposed that enable a simultaneous consideration of multiple voltage levels. Additionally, an extension of the deterministic n-1 criterion is considered by enhancing the maximum thermal loading of grid components in contingency events.
The simulation results obtained indicate that the amount of renewable energy curtailment can be reduced both by implementing smaller curtailment level increments by up to 4.3% and by establishing coordinated novel DG selection methods by up to 10%. To limit the complexity of the practical implementation, the hybrid approach proves to be superior to solely minimizing the amount of power adjustments. Both concepts could be a temporary solution to optimize the curtailment process since the effort for their realization is rather small. However, the concept of increasing the utilization of transmission capacities by enhancing operational limits in contingency situations has clearly proven to be the most efficient concept to reduce preventive DG curtailment. Enhancing the maximum permissible loadings of grid components to 130% reduces the amount of renewable energy curtailment by up to 94.8% and, thus, nearly leads to a complete prevention of these congestion management measures. Concurrently, this is also the most challenging concept regarding its implementation. Therefore, future research should address possibilities to extend operational limits, such as considering the thermal inertia of grid components or establishing fast-reacting, curative congestion management measures, and compare the additional costs of these measures with their benefit regarding the reduction of renewable energy curtailment.


