Article

Identification of the Efficiency Gap by Coupling a Fundamental Electricity Market Model and an Agent-Based Simulation Model

by
Laura Torralba-Díaz
1,2,*,
Christoph Schimeczek
1,3,
Matthias Reeg
1,3,†,
Georgios Savvidis
1,2,
Marc Deissenroth-Uhrig
1,3,†,‡,
Felix Guthoff
1,2,
Benjamin Fleischer
1,2,†,§ and
Kai Hufendiek
1,2
1
Stuttgart Research Initiative on Integrated Systems Analysis for Energy (STRise), Keplerstraße 7, 70174 Stuttgart, Germany
2
Institute of Energy Economics and Rational Energy Use (IER), University of Stuttgart, Heßbrühlstraße 49a, 70565 Stuttgart, Germany
3
Institute of Engineering Thermodynamics, German Aerospace Center (DLR), Pfaffenwaldring 38-40, 70569 Stuttgart, Germany
*
Author to whom correspondence should be addressed.
Former affiliations
School of Engineering, University of Applied Sciences (htw saar), Goebenstraße 40, 66117 Saarbrücken, Germany
§
MVV Energie AG, Luisenring 49, 68159 Mannheim, Germany
Energies 2020, 13(15), 3920; https://doi.org/10.3390/en13153920
Submission received: 26 June 2020 / Revised: 23 July 2020 / Accepted: 27 July 2020 / Published: 31 July 2020
(This article belongs to the Special Issue Model Coupling and Energy Systems)

Abstract

:
A reliable and cost-effective electricity system transition requires both the identification of optimal target states and the definition of political and regulatory frameworks that enable these target states to be achieved. Fundamental optimization models are frequently used for the determination of cost-optimal system configurations. They represent a normative approach and typically assume markets with perfect competition. However, it is well known that real systems do not behave in such an optimal way, as decision-makers do not have perfect information at their disposal and real market actors do not take decisions in a purely rational way. These deficiencies lead to increased costs or missed targets, often referred to as an “efficiency gap”. For making rational political decisions, it might be valuable to know which factors influence this efficiency gap and to what extent. In this paper, we identify and quantify this gap by soft-linking a fundamental electricity market model and an agent-based simulation model, which allows the consideration of these effects. In order to distinguish between model-inherent differences and non-ideal market behavior, a rigorous harmonization of the models was conducted first. The results of the comparative analysis show that the efficiency gap increases with higher renewable energy shares and that information deficits and policy instruments affect operational decisions of power market participants and resulting overall costs significantly.

Graphical Abstract

1. Introduction

The global need for climate protection demands a profound transformation of the energy system in many countries. Therefore, the share of variable renewable energies (VRE) has to be increased, while at the same time, greater system flexibility is required to integrate the conjoined variable feed-ins. In order to achieve the expansion of renewable energies while guaranteeing the security of supply, the entire energy system is affected; controllable thermal power plants, storage facilities, flexible demand, sector coupling technologies, grids on transport, and distribution level need to be integrated with growing VRE production.
Different modeling approaches have been developed to provide scientific support to political and other decision-makers in setting the most efficient and appropriate measures for achieving climate policy goals [1]. These modeling approaches may differ with regard to their target group, intended application, complexity, temporal and spatial scale, conceptual framework, including the ability to model bounded rationality aspects or uncertainties, and the information available [2].
Fundamental optimization approaches typically assume that decision-makers behave like ideal homo economicus and that markets have perfect competition. Thus, market participants base their actions on financial criteria from a centralized perspective and under full transparency of information. This leads to results that represent the most cost-effective solution requiring these ideal circumstances. Therefore, this type of model is actively applied in providing insights on the effects of policy instruments on the evolution and operation of power systems [3,4] and in analyzing the role of complementary flexibility options (e.g., bioenergy [5], demand response [6,7] or energy storage [8]) in power systems with high shares of VRE. The results of fundamental optimization models represent a normative approach characterizing the extreme case, e.g., minimum costs for reaching certain targets. This is still valid, in case stochastic approaches are applied, e.g., in order to assess the impact of uncertainties such as wind volatility [9,10] or water inflow seasonality [11].
However, the real implementation of the energy transformation shows discrepancies to the results of fundamental optimization models based on a purely techno-economic basis [12]. For example, a system optimizing curtailment of VRE from the perspective of a social planner leads to a different utilization of the VRE plants than a market driven curtailment determined by the economic decisions of individual actors in the market. Another example is that investment decisions have always been made without having full information about other actors’ decisions or future developments. Even more, some investors might not be driven by pure financial aspects, e.g., local concerns.
The energy transition does not only require the identification of optimal target states, but also the definition of political and regulatory frameworks that foster these target states to be achieved. In this context, it is important to analyze the real behavior of the actors. Agent-based models (ABM) allow for capturing the individual decision-making behavior of the market participants. They can thereby assess market effects such as uncertainties and distortions caused by imperfect information and support regimes [13]. Therefore, ABM are typically used for addressing market design aspects [14,15], such as imperfect information, non-ideal behavior of decision-makers, market power, bidding strategies, or pricing mechanisms [16,17].
The differences between a fundamental optimization and an ABM approach lead to differing results which can be used to assess the so-called “efficiency gap”. Following the definition of this term by [18], the authors understand the term efficiency gap as the differences between a theoretically optimal energy system configuration and the configuration of the energy system in reality. Reasons for these differences, which lead to low levels of investments in energy efficiency [19] and higher system costs than theoretically expected, are manifold and, according to [18], can have both market failure and non-market failure-based causes. In [20], the author argues that in power markets, there are demand-side flaws disturbing the market mechanisms to balance the markets in the long term.
Three primary causes for deviations from the ideal assumptions were identified within the work presented here:
  • the economic calculation of the actors, including bounded-rationality aspects,
  • imperfect foresight or decision-making under uncertainties, and
  • distortions due to regulatory framework conditions.
The effects of these deviations can lead to significantly higher costs for the transformation path than those corresponding to the theoretical normative case or might hamper the implementation of an originally planned transformation path. In order to ensure the best realizable as well as cost-effective system configuration, analyses need to include the development of the regulatory framework and the economic calculation of flexibility operators as well as imperfect predictions regarding prices and weather forecasts. By coupling a fundamental optimization model and an ABM, these effects can be included in the analysis, and thus the efficiency gap can be studied in detail.
In order to be able to identify the differences between normative theory and reality by means of a model coupling-based analysis, it is first necessary to exclude the possibility that differences in modeling may occur due to other reasons, such as differences in the input data. This is achieved by harmonizing the models, which implies the targeted adjustment of input parameters as well as model configurations with the aim of aligning results.
There are many examples of model coupling reported in literature covering a variety of research areas and including a wide spectrum of models (macroeconomic models, energy system models, climate models, transport models…) and coupling techniques (integrated models and unidirectional as well as bidirectional hard-linked and soft-linked models). In this paper, we adopt the definitions of hard-linking and soft-linking given by [2,21], whereby the latter term refers to the manual data transfer between the models and hard-linking is defined as the transfer established without a user judgement and usually entails using an automatic routine. Following the categorization of model coupling techniques in [22], two models are integrated if they are merged into one and, therefore, they can be solved in a single model run. In [23], the authors verify the plausibility of the electricity generation portfolio obtained with an energy system planning model using a high resolution power system modeling tool by means of a unidirectional soft-link. The authors of [24] present a soft-linking methodology to quantify the impact of low level of detail in energy system planning models. Examples of bidirectional soft-linking techniques for iteratively adapting the results of planning models can be found in [25,26]. With the aim of developing an integrated assessment toolbox for the European energy system, the authors of [27] combine iterative and non-iterative soft-links to couple an energy system model with a computable general equilibrium (CGE) model as well as a health impact assessment model. In [22], the authors use a hard-linking methodology to study the effects of policy instruments for reducing greenhouse gas emissions in the transport sector.
Less frequent in the literature are couplings with ABM. A hybrid modeling approach by soft-linking an ABM and a CGE model is developed in [28]. The goal of this research is to evaluate policy measures to mitigate climate change while accounting for individual behavioral changes in residential energy markets. In [29], the approach proposed by [28] is extended by means of a hard-link between an integrated assessment model (IAM), a CGE model and an ABM using a novel web service approach for linking climate–energy–economy models.
To the best of our knowledge, this paper is the first attempt to identify and quantify the efficiency gap in electricity systems by coupling a fundamental optimization model with an ABM. In this paper, the harmonization and coupling of a cost minimizing model (E2M2 [3,9]) and an ABM (AMIRIS [13,14,30]) was formulated and applied for the analysis of the efficiency gap induced by storage operators in the electricity market. The analyses were carried out by means of a greenfield approach with a planning horizon of one year, taking into account different degrees of VRE integration. The main contribution of this article to the existing literature is the establishment of a solid basis for the identification and quantification of the efficiency gap. This enables the analysis of the impact of market imperfections on the electricity market by quantifying the differences in the results obtained by means of a cost minimizing system optimization and an agent-based simulation. The consideration of the real market behavior by developing cost-effective regulatory frameworks is crucial in designing economically and sustainable transition paths for electricity systems with high shares of VRE.
This paper is structured as follows. Section 2 introduces the methodology applied for coupling the fundamental electricity market model E2M2 and the agent-based simulation model AMIRIS including the description of their mathematical approaches and the required adjustments in their configurations. Section 3 presents the common scenario framework. The results of the optimization and simulation runs performed with E2M2 and AMIRIS for the model harmonization and for the identification and quantification of the efficiency gap are shown and compared in Section 4. Finally, Section 5 discusses the obtained results, proposes further developments, and draws some conclusions.

2. Methods

In this section, the models applied in this study are briefly described and the methodology implemented for coupling the fundamental electricity market model E2M2 and the ABM AMIRIS is introduced including the description of the multistage optimization approach applied to E2M2 and the storage strategies employed by AMIRIS. The methods used in this paper stem from the project ERAFlex and are presented in detail in [31].

2.1. European Electricity Market Model (E2M2)

The European Electricity Market Model E2M2 is a fundamental analytical bottom-up model based on [3,9] and is actively developed at the Institute of Energy Economics and Rational Energy Use (IER) at the University of Stuttgart. It reflects the market situation on the European wholesale electricity market and follows the economic theory of perfect competition [32]. E2M2 enables the simultaneous optimization of unit commitment and investment planning by including a detailed representation of thermal power plants, renewable energies, and flexibility options such as demand side management, flexible storage, or power-to-heat. It is formulated as a linear programming (LP) problem with optional mixed integer constraints for a discrete representation of the generation fleet. Thus, restrictions such as minimum up- and down-time requirements and time-dependent start-up costs can be taken into account.
The objective function minimizes total system costs for meeting the demand in a solution space limited by technical and regulatory restrictions. The total system costs T S C o s t consist of annualized investment costs a I n v C o s t and annual fixed costs F i x O & M C o s t of invested capacities as well as variable costs of generation and flexibility units u . The annual fixed costs of existing capacities can be considered as sunk costs [33]. For calculating the variable costs, operation and maintenance (O&M) costs V a r O & M C o s t as well as fuel costs F u e l C o s t and CO2 certificate costs C O 2 C o s t are added up over the considered time steps t . The objective function used to minimize total system costs can be described mathematically by Equation (1):
min T S C o s t = u U I n v ( a I n v C o s t u + F i x O & M C o s t u ) + u U t T ( V a r O & M C o s t u , t + F u e l C o s t u , t + C O 2 C o s t u , t ) .
Key inputs of E2M2 are the electricity and heat demand, the installed and investable electricity generation capacities, the techno-economic parameters of the available technologies, the renewable deployment, and the economic and regulatory framework such as fuel prices or upper bounds for CO2 emissions. The demand and generation profiles are given exogenously to the model and, unlike the stochastic approach described in [3,9], the production of VRE such as wind and solar energy is calculated deterministically within this paper. Furthermore, E2M2 operates with feed-in management.
The main restriction in E2M2 is the balance between power supply and demand. For this purpose, existing and new capacities as well as flexibility options, which contribute to balance the fluctuations generated by VRE and thus smooth the residual load profile, can be applied under certain technical restrictions. In addition, the dual variable of the power balance equation can be interpreted as the bid price of the marginal power plant in a perfectly competitive market, which provides information about the day-ahead electricity prices. CO2 certificate prices can be determined analogously by solving the dual problem when defining CO2 upper bounds. The principles of LP and duality theorem are explained in detail in [34] for instance.

2.2. Agent-Based Model for the Integration of Renewables into Electricity Markets (AMIRIS)

In contrast to E2M2, the ABM AMIRIS developed at DLR [13,14,30] simulates the marketing of electricity from renewable energies under different regulatory conditions. In this simulation model, the relevant actors—e.g., direct marketers and operators of renewable energy plants—are prototypically represented as agents.
In AMIRIS, the socio-economic profiles of the plant operators are differentiated according to power classes and owner types. The power classes of the plants influence their electricity production costs, while the type of owner influences, among other things, the profit expectations of the actors. Owner types include private individuals, funds, and public utilities. The direct marketers (e.g., municipal utilities or green electricity traders), which are also typified, differ on the one hand in terms of marketing channels and premiums paid to contractually tied plant operators, and on the other hand in terms of their costs, experience, and forecast quality. These characteristics of direct marketers in turn influence their bidding strategies on the electricity exchange and thus their overall economic success. AMIRIS does not have a higher-level objective function. Instead, the simulation results are generated from the interplay of the actions of the individual actors depicted as agents under selected regulatory conditions.
Figure 1 depicts the communication of the agents in AMIRIS. Communication takes place in the same way for each simulated hour: All plant operators send expected electricity production quantities (possibly containing errors) to their contractual electricity traders (direct marketers or grid operators). Based on these expected electricity quantities and associated marginal costs, the traders generate bids which are transmitted to the day-ahead power exchange. The power exchange evaluates the bids of all electricity suppliers, electricity consumers, and storage operators; calculates the merit order and the equilibrium price; and then sends or requests the money for accepted bids. Subsequently, the network operators pay out the due feed-in tariff to their clients. The direct marketers grant their contractually linked plant operators an additional bonus. This bonus depends on the income from the market for negative minute reserve (control energy market), the claims of market premiums, and the costs for balancing energy. The storage operators have a special role in AMIRIS in so far as they can carry out arbitrage transactions as independent traders on the energy exchange on the one hand, but can also be used by direct marketers to reduce the balancing energy demand caused by forecasting errors on the other.

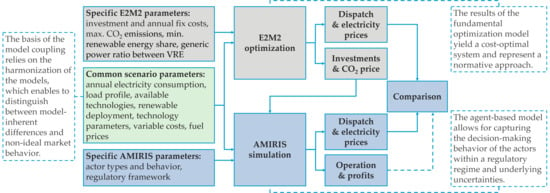
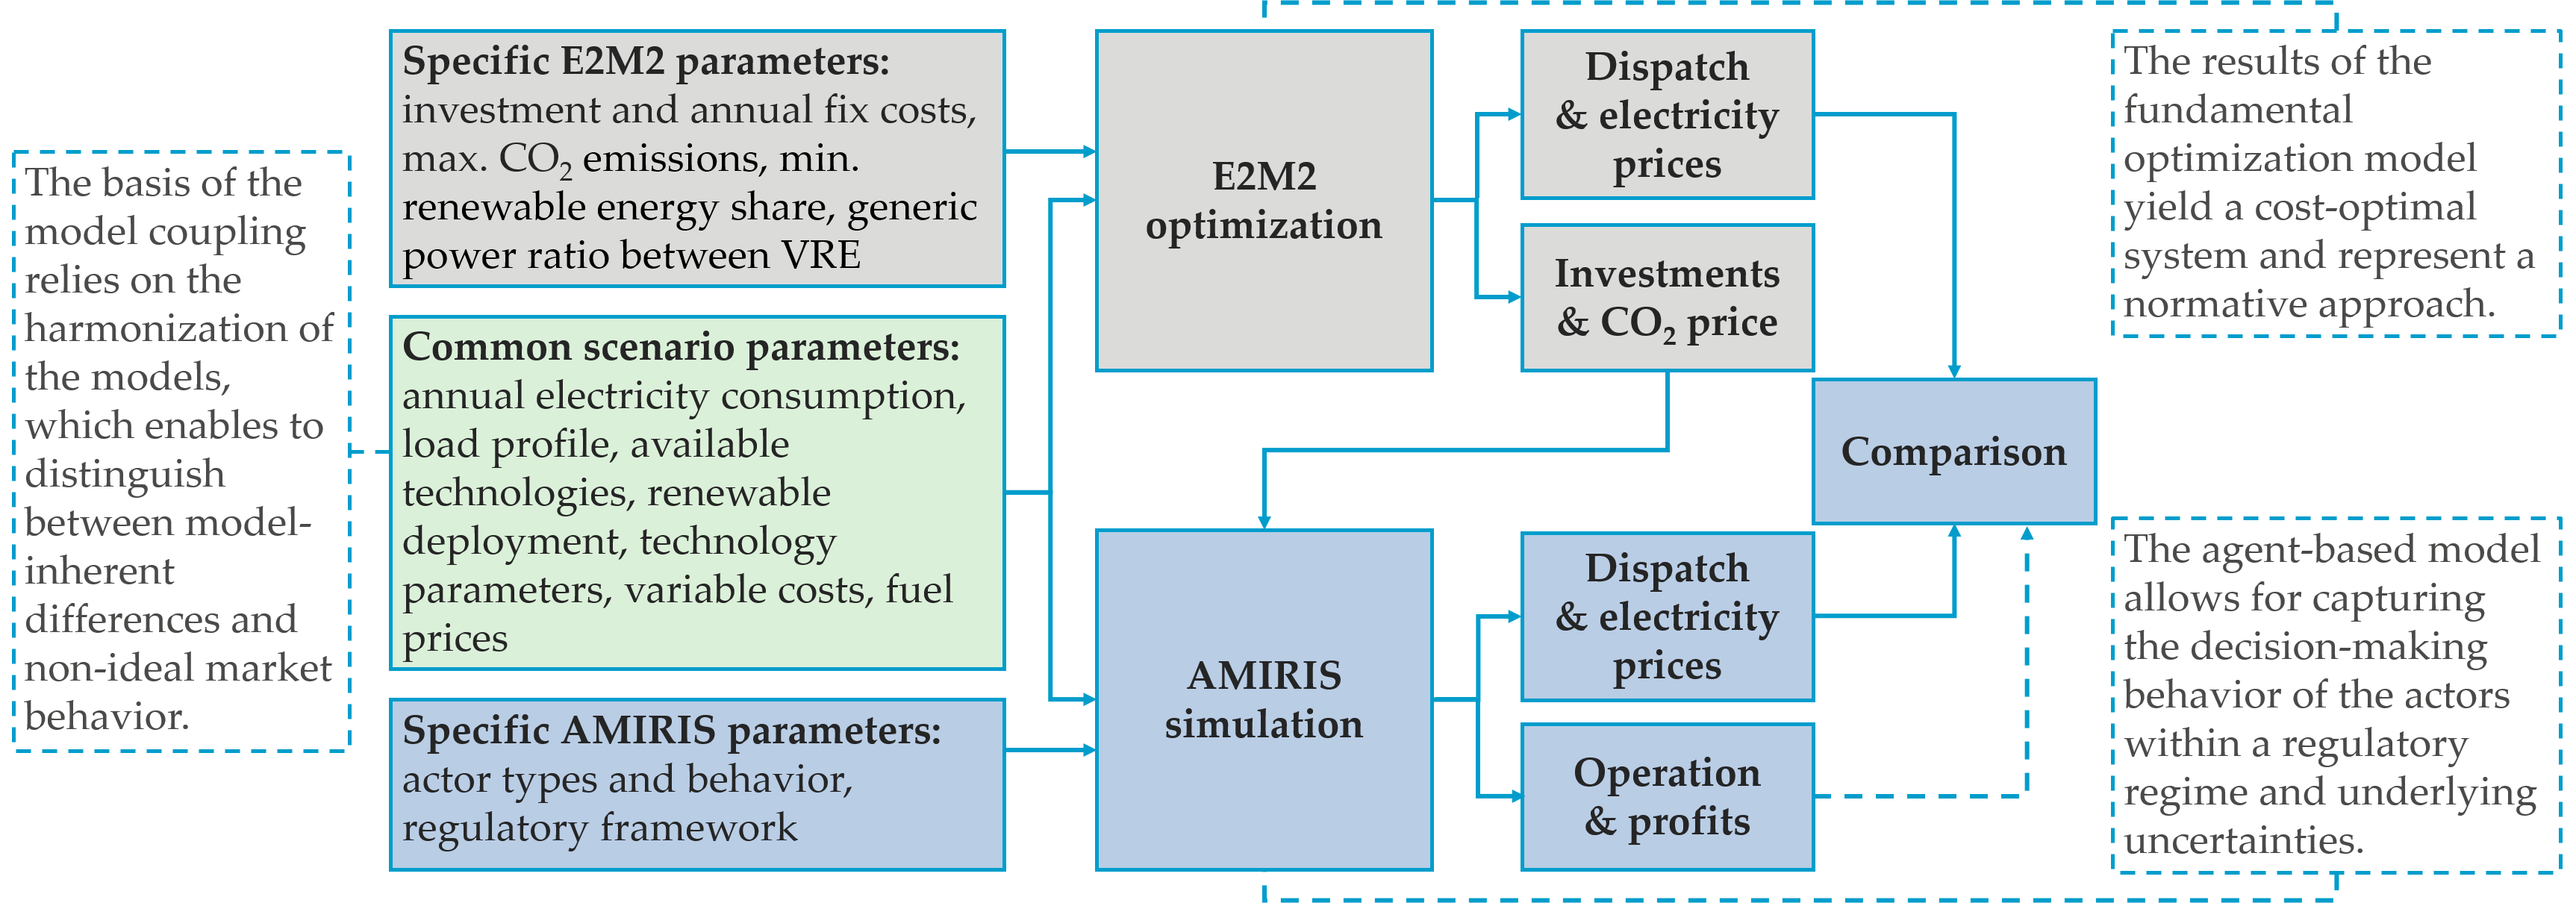
2.3. Model Coupling Methodology

The unidirectional soft-linking methodology for coupling the optimization model E2M2 and the ABM AMIRIS is shown in Figure 2. First, a scenario is defined and set up for both models. This includes demand-side inputs (e.g., electricity demand profile and annual electricity consumption) as well as supply-side inputs (e.g., techno-economic parameters of the available technologies and renewable deployment) and framework conditions (e.g., fuel prices and tariffs). E2M2 is configured to apply a multistage approach based on three successive optimization runs. In the first run, the cost-optimal power plant fleet necessary to satisfy the demand is calculated in compliance with regulatory framework conditions representing national energy policy goals. This cost-optimal portfolio is transferred as exogenous input to AMIRIS. During the second run, E2M2 determines the yearly CO2 certificate price by means of a dispatch-only optimization and delivers it to AMIRIS as well. In the third run, the unit commitment is calculated in E2M2 and AMIRIS on base of the same model inputs and the best possible alignment of model-inherent settings, which ensures the comparability of the model results. The details of the multistage optimization approach applied to E2M2 can be found in Section 2.3.1.
The harmonization of the models is the basis for the following comparative analysis of the model results. This includes the targeted adjustment of input parameters and model configurations aiming to identify and, if possible, remove deviations between model results. Such deviations can be caused by e.g., modeling differences regarding the technology representation. Any deviations that cannot be removed must be identified. For the model harmonization, a cost minimizing strategy (CM) is activated in AMIRIS (see Section 2.3.2) meaning that the market participants show ideal behavior. The results of this harmonizing step are reported in Section 4.1.
Once the results have been harmonized the deployment of power plants and flexibility options is simulated in AMIRIS with different settings on the decision-making behavior of individual market actors within a regulatory regime as well as underlying uncertainties regarding, e.g., electricity prices. The results obtained in AMIRIS are then compared with those of the cost minimizing optimization model E2M2. Any additional discrepancies arising between the model results can be attributed to the efficiency gap, which opens up between the normative theoretical achievement of the system optimum and the effects resulting from non-ideal behavior and regulation sets.

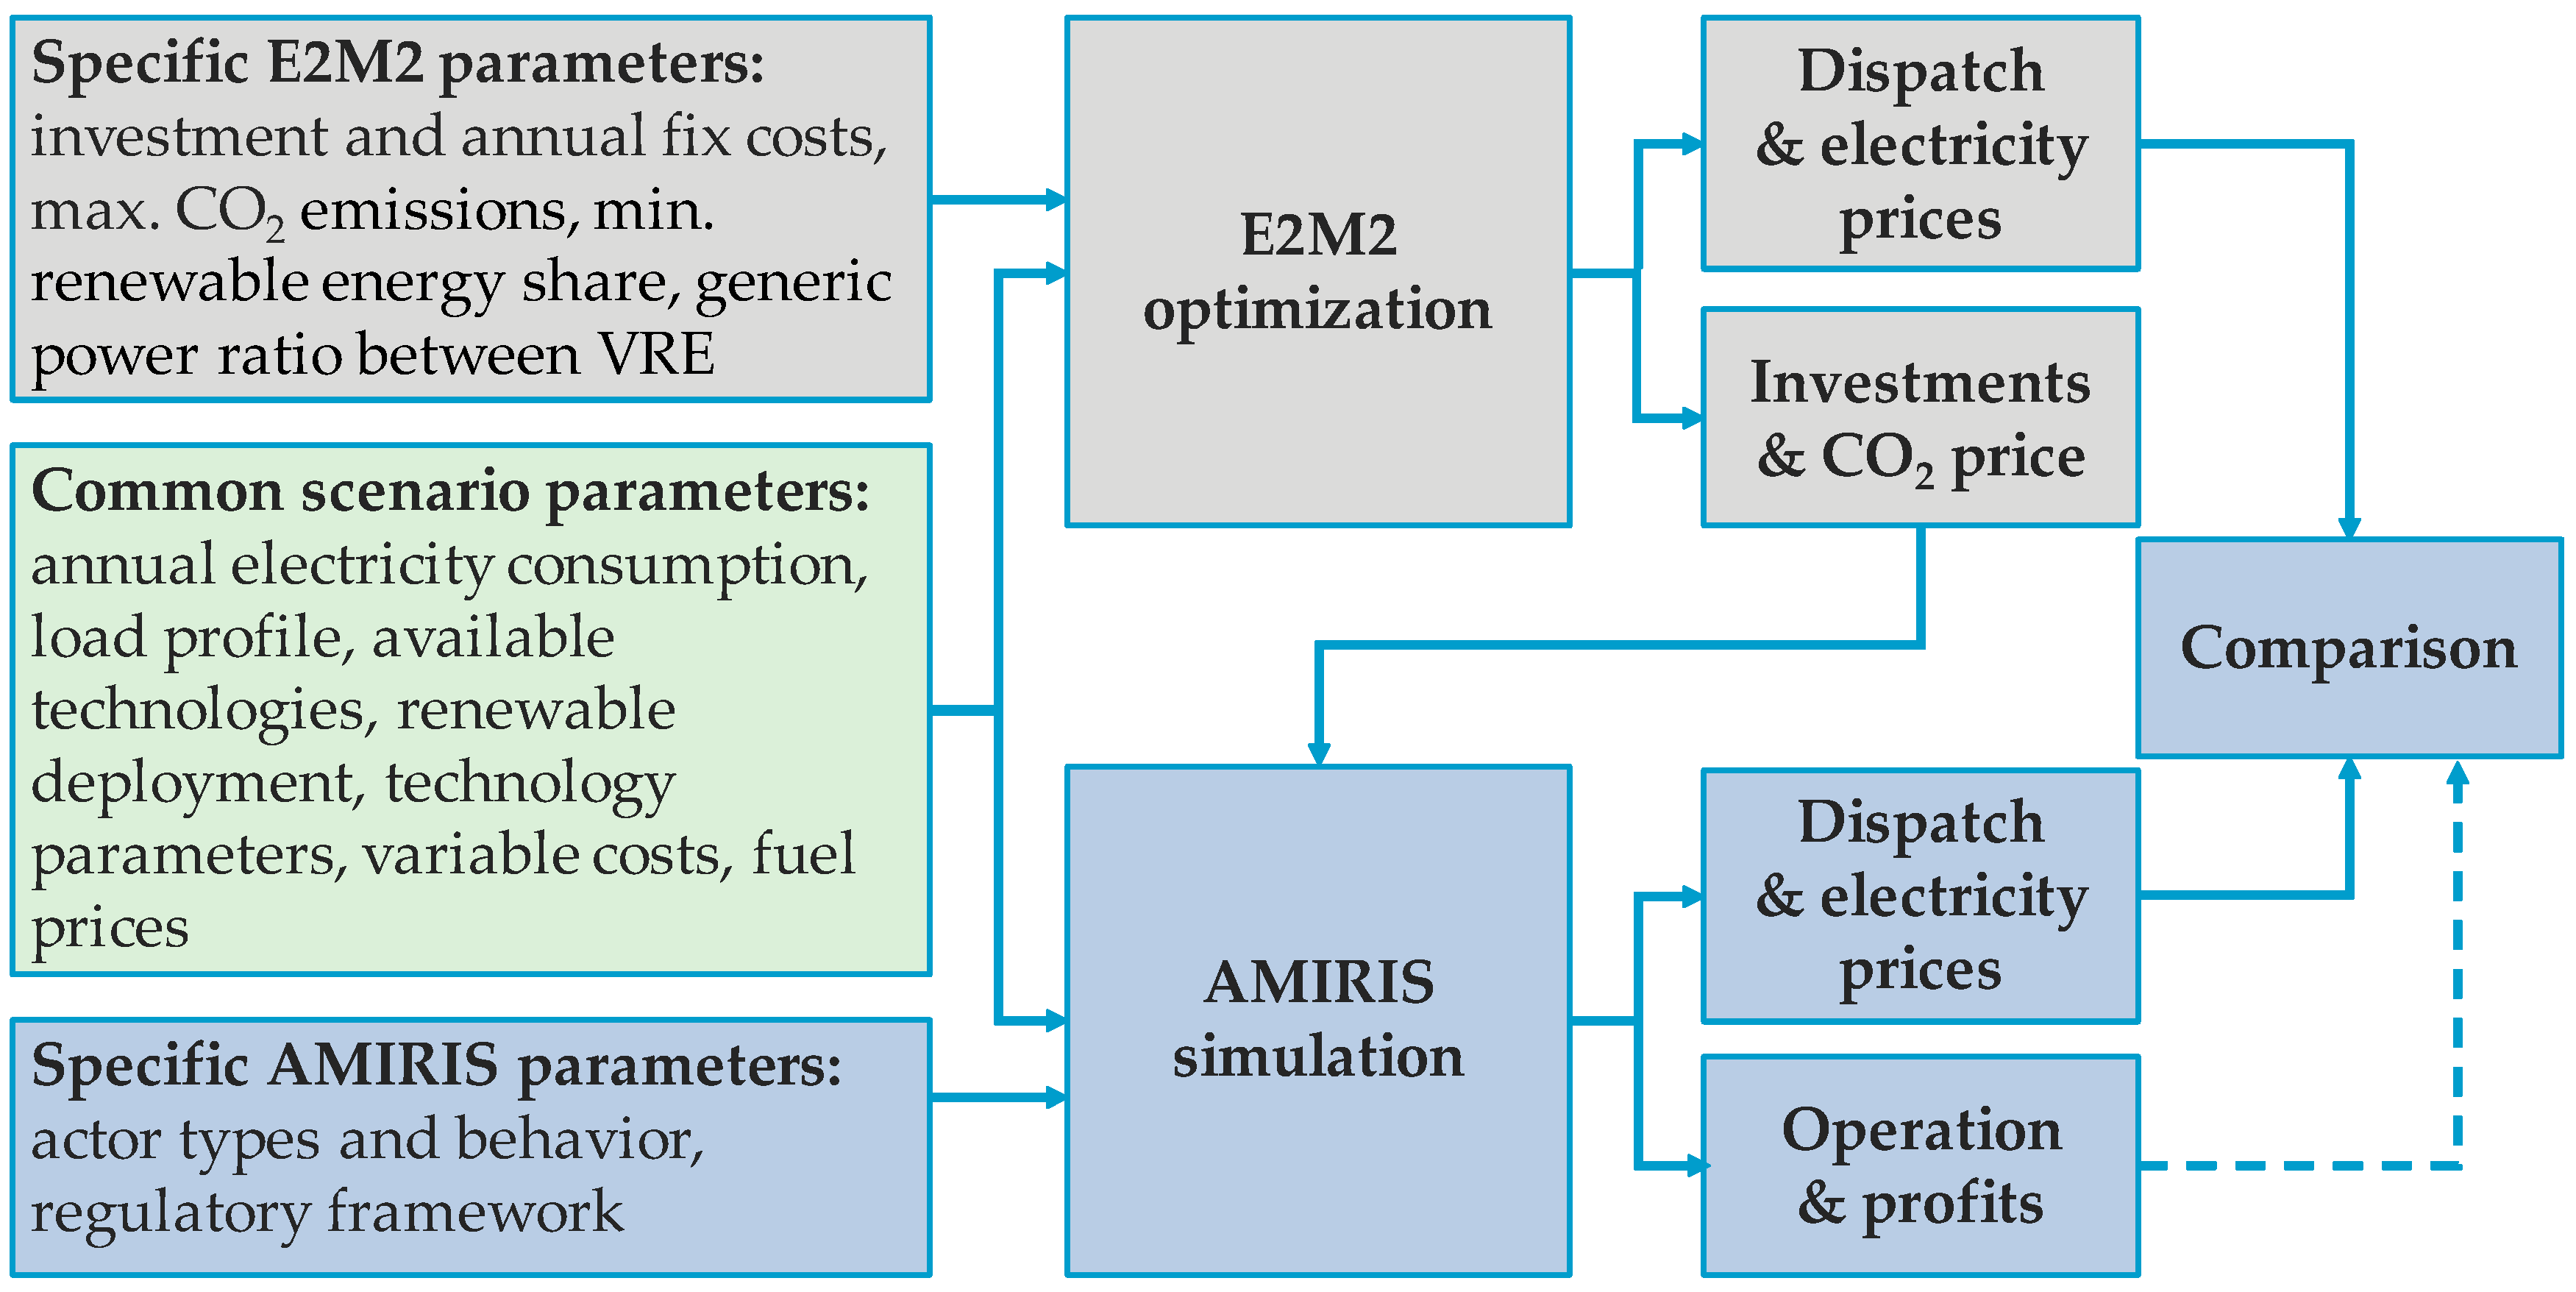
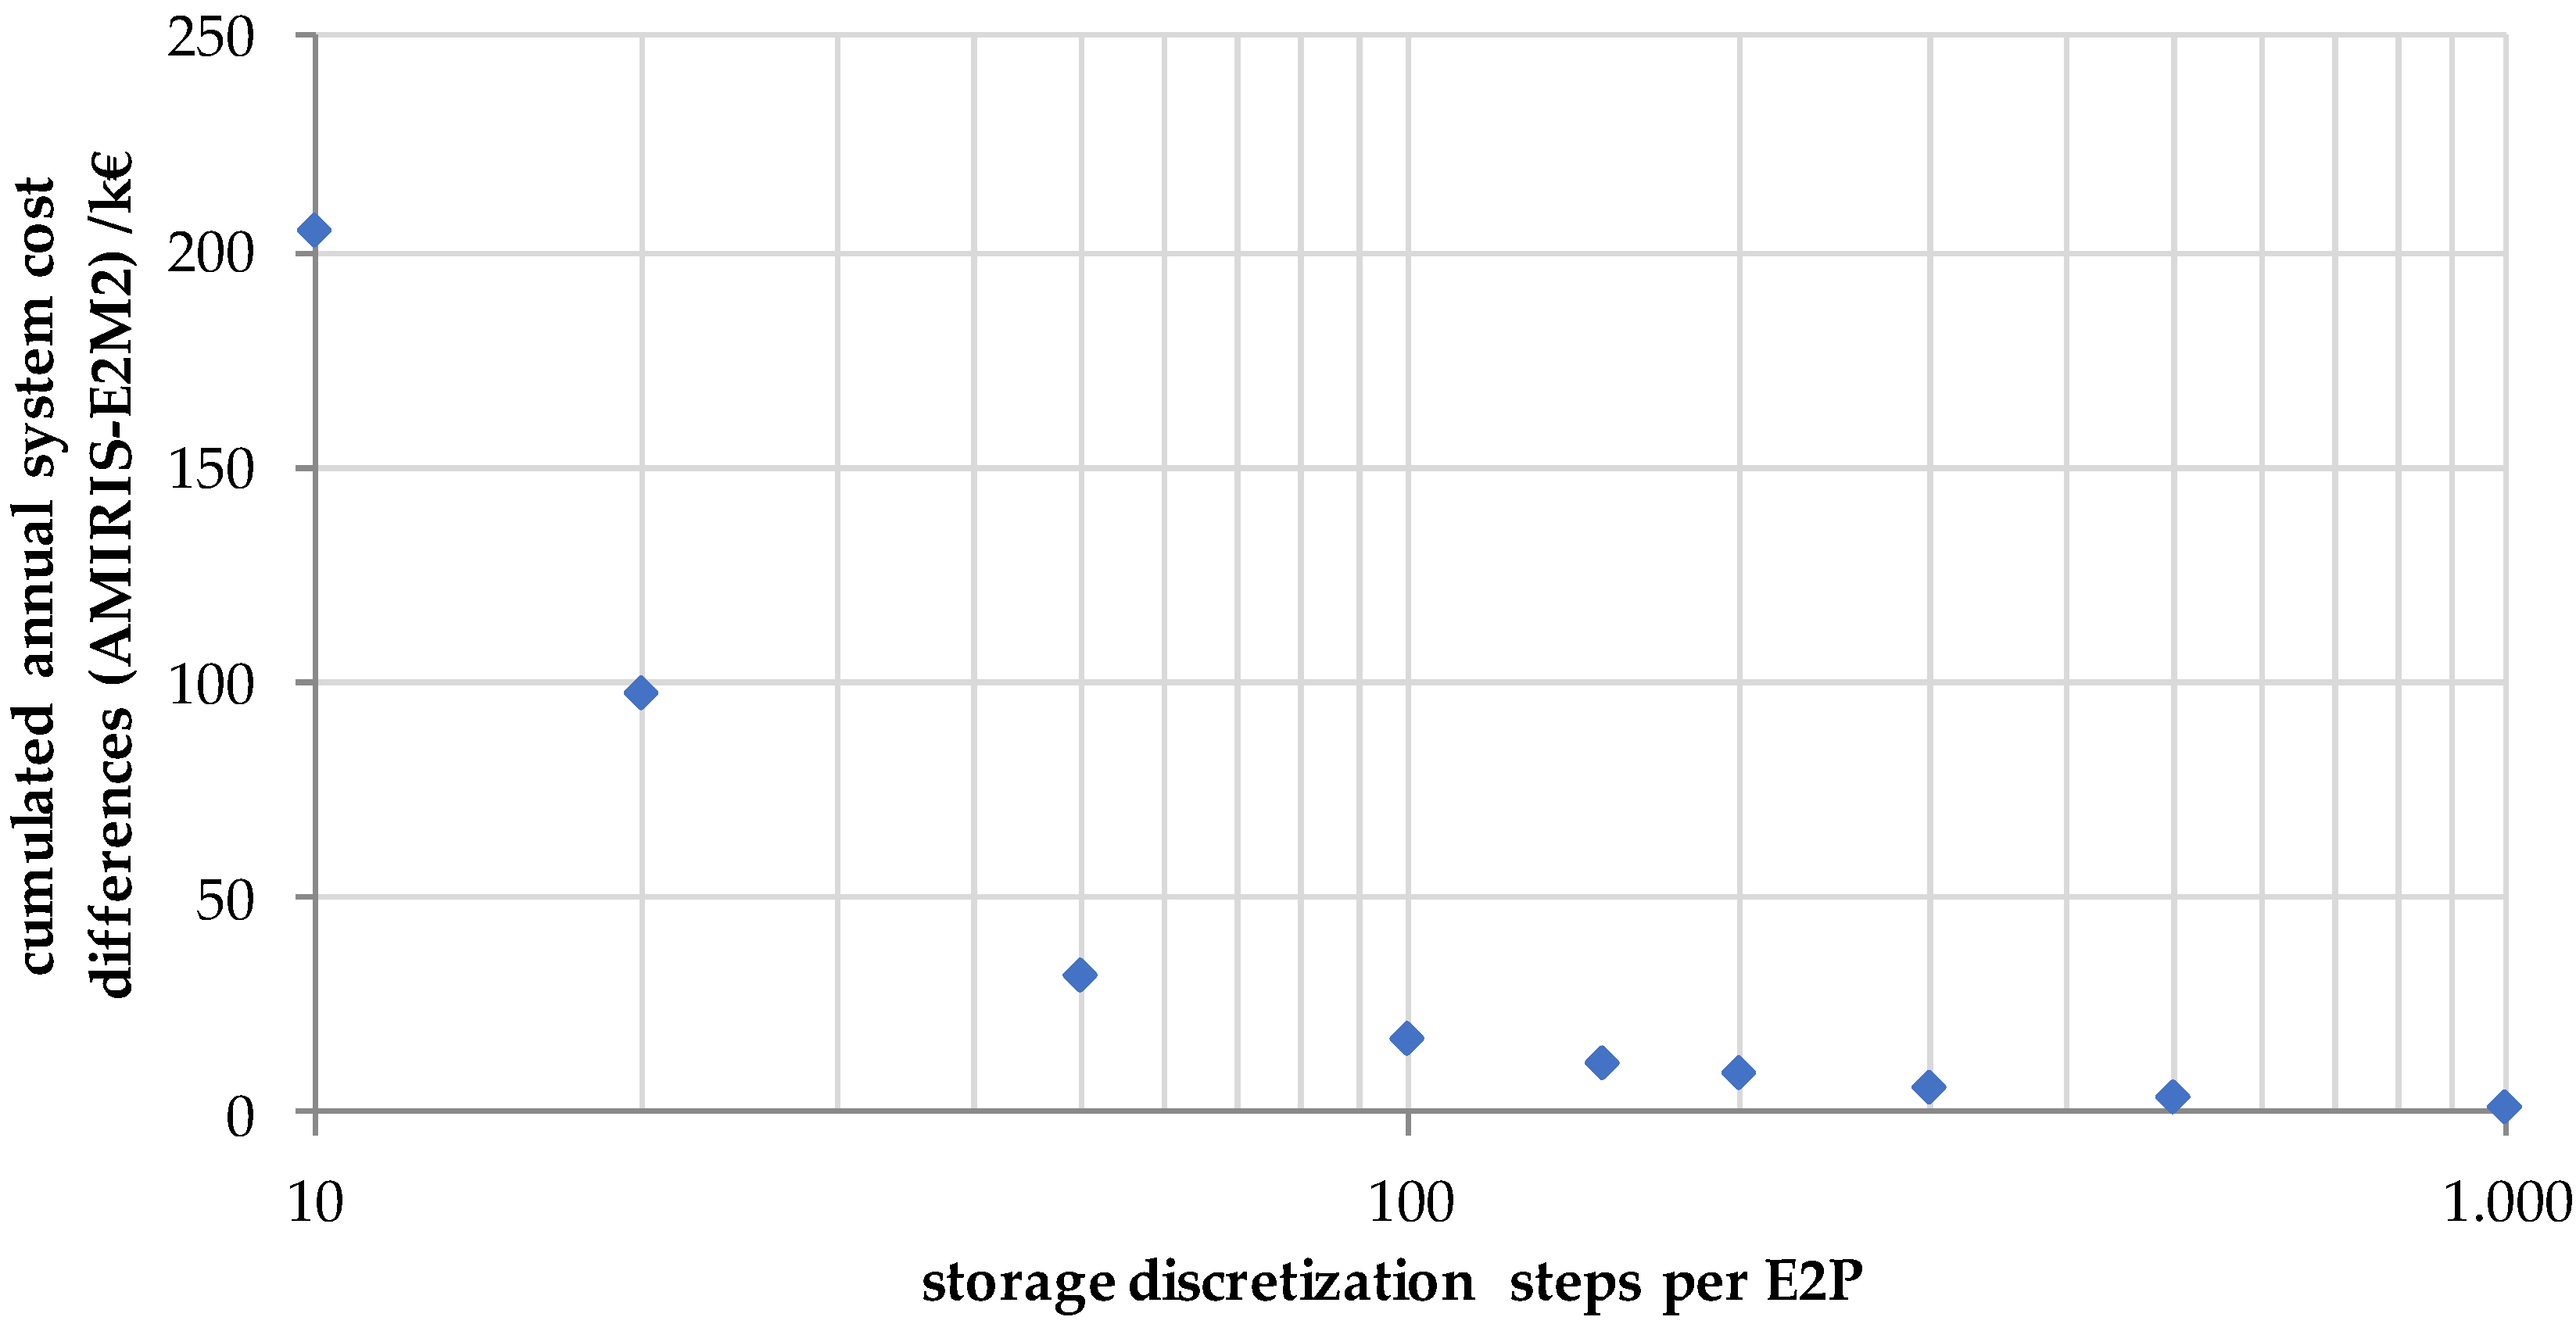
2.3.1. E2M2 Multistage Optimization

With the aim of ensuring comparability of the model results, a suitable configuration for E2M2, which allows the harmonization of model-specific differences between E2M2 and AMIRIS, was identified. These differences comprise the calculation of added capacities in E2M2, the disaggregation of the power plant fleet into smaller units and the unit commitment optimization considering a limited planning horizon.
The E2M2 configuration applied in this work is based on [5] and consists of a multistage modeling approach, whereby the power plant aggregation and the temporal resolution vary over hierarchical model runs. By using this approach, it is possible to model investment decisions and unit commitment simultaneously in E2M2 considering a high temporal and technological resolution within a reduced calculation time and without compromising the accuracy of the results. This approach consists of three successive optimization runs, which are described in more detail below.
1. Long-term expansion planning
Here, the aggregated cost-optimal generation and flexibility portfolio is determined by means of a greenfield approach, i.e., without existing capacities. The investment decision is made by optimizing the available expansion options in compliance with the regulatory framework conditions, which represent national energy policy goals, such as maximal CO2 emissions or minimal shares of VRE feed-in. The expansion options are aggregated according to primary energy sources and technical power plant characteristics. The power plant dispatch is optimized according to an LP relaxation approach and the investment decisions are calculated with hourly resolution within a planning horizon of one year. The demand profile and the annual electricity demand are given exogenously to the model. The storage level at the beginning of the planning horizon, the energy-to-power (E2P) ratio of the storage units as well as a generic capacity ratio between VRE are also defined in advance.
2. Unit commitment with integral planning horizon
Firstly, the thermal power plant capacities determined during the first stage are disaggregated into units of 200 MW each and their efficiencies are calculated by means of a linear interpolation within a predefined minimum and maximum. In this way, a more realistic representation of the conventional power plant fleet can be achieved, since each technology is no longer represented by a single unit with a single efficiency value, but several smaller units with different efficiencies and thus marginal costs. Secondly, the operational scheduling of the disaggregated power plants is optimized using an LP relaxation approach. The model run is carried out on a planning horizon of one year. By solving the dual problem, the CO2 certificate price can be calculated within this optimization and is then transferred to AMIRIS.
3. Unit commitment with limited planning horizon
The aim of this stage is to determine the unit commitment in E2M2 and AMIRIS on base of the same model inputs and the best possible alignment of model-inherent settings. The optimization in E2M2 is carried out by means of an LP relaxation approach and considering an hourly time resolution with a prediction horizon of one week and a control horizon of one day. CO2 emissions are penalized by an exogenous price, which was calculated in the second stage. The results obtained from the third stage are methodologically comparable with those calculated by AMIRIS.

2.3.2. AMIRIS Strategies for Market Actors

AMIRIS can be set up to reflect different aspects of market imperfections within its agents. In this work, three types of market imperfections are considered: market power, market distortions, and information deficits regarding competitors’ behavior and future aspects of the electricity system (e.g., potential renewable energy feed-in). All three above-mentioned imperfections are investigated independently from each other. This allows a detailed characterization of the efficiency gaps resulting from each of these effects separately.
Exercise of storage market power: In a fundamental power system model like E2M2, storage units are typically dispatched to minimize system costs. This type of behavior has also been implemented in AMIRIS for the harmonization of the two models and is called the “cost minimizing strategy” (CM). However, an additional strategy has been implemented that maximizes the profits of a storage agent utilizing its market power, called “profit maximizing strategy” (PM). This strategy uses all available information on the merit order and considers expected changes of the electricity price when calculating the most profitable storage dispatch.
Forecast uncertainties due to information deficits: In order to reflect forecast uncertainties for operators of flexibility options, a third dispatch strategy for storage operators was designed. This third strategy uses less information about the merit order and tolerates imperfect forecasts and competition with other flexibility providers. The amount of charged and discharged energy depends on the negative or positive difference to the median of the electricity price within the foresight horizon. This mode of operation is called “robust bidding” (RB). Due to the simplicity of this strategy, it is not as profitable as the profit maximizing strategy (PM).
Market distortions due to support schemes: Policy instruments such as the variable market premium (VMP) for renewable energies in the German electricity market [30,35] can create market distortions. In AMIRIS, the VMP impacts the bidding strategy of direct marketer agents, who sell renewable energy at the energy exchange. Instead of offering this energy at marginal costs, direct marketers offer the energy at lower prices to consider the expected market premium, which is awarded for feed-in electricity only. This leads to a different market driven curtailment of renewables in comparison to the results of a system-wide optimization.

3. Case Study

In this section, a common scenario framework is presented which enables the identification and quantification of the efficiency gap.

3.1. Scenario Assumptions

The focus of this work is the identification and understanding of the reasons as well as a first quantification of the efficiency gap. Therefore, we disregarded other issues that might be of political relevance but designed the scenarios to support the assessment of the efficiency gap by the influence of fundamental developments of the energy system transition instead. These fundamental developments are:
  • the rising share of renewable energies,
  • the expansion of flexibility options, and
  • influences of market design and support schemes.
For this purpose, a common scenario framework that can map these fundamental developments and allows for the analysis of the efficiency gap on different degrees of VRE integration was defined. Table 1 shows the variations between the considered scenarios.
In the scenario 40_CM1, the cost minimizing storage strategy (CM) is activated in AMIRIS, which enables the alignment of configurations and results with E2M2, and thus the harmonization of the models. The scenarios 40_PM1 and 40_RB1 evaluate the effects of market power and information deficits by activating the profit maximizing (PM) and the robust (RB) strategy in the ABM. The scenario 40_CM1_VMP allows for analyzing market distortions stemming from a VMP considered for VRE plants. The scenarios 40_RB10_VMP, 60_RB10_VMP, and 80_RB10_VMP show the impact of rising shares of VRE with activated VMP and multiple storage operators bidding by the robust strategy (RB).
The scenario parameters are presented in Appendix A. The set of technologies considered in this work is restricted to conventional power plants, VRE sources, and pumped hydro energy storage units. The considered dispatchable conventional technologies are lignite-fired plants, gas turbines (GT), combined cycle gas turbines (CCGT), and nuclear power plants. Note that discrete operation constraints and costs by, e.g., start-up and shut-down events, are not considered. The VRE sources included in the analysis are solar photovoltaic (PV) as well as onshore and offshore wind turbines. Moreover, must-run capacities, which can strongly reduce the system flexibility, are disregarded.
The production and flexibility portfolio is generated by E2M2 by means of a greenfield approach taking into account demand, as well as technical and regulatory restrictions. Maximal CO2 emissions and minimal shares of VRE feed-in are included in these calculations in order to represent national energy policy goals. This cost-optimal power plant fleet is transferred as exogenous input to AMIRIS and fixed for the following comparative analysis. That means that only discrepancies regarding operational but not investment decisions are evaluated for the quantification of the efficiency gap.

4. Results

This section presents and compares the results of the optimization and simulation runs performed with E2M2 and AMIRIS. The cumulative difference regarding system costs between the models is applied as the main indicator for the model harmonization as well as for the efficiency gap quantification. Within this analysis, only variable O&M, fuel, and CO2 allowance costs are considered. The discrepancies in storage dispatch, VRE curtailment, and electricity prices between both models are applied as additional auxiliary indicators. A comprehensive description of the analyses carried out within the ERAFlex project is given in [31].

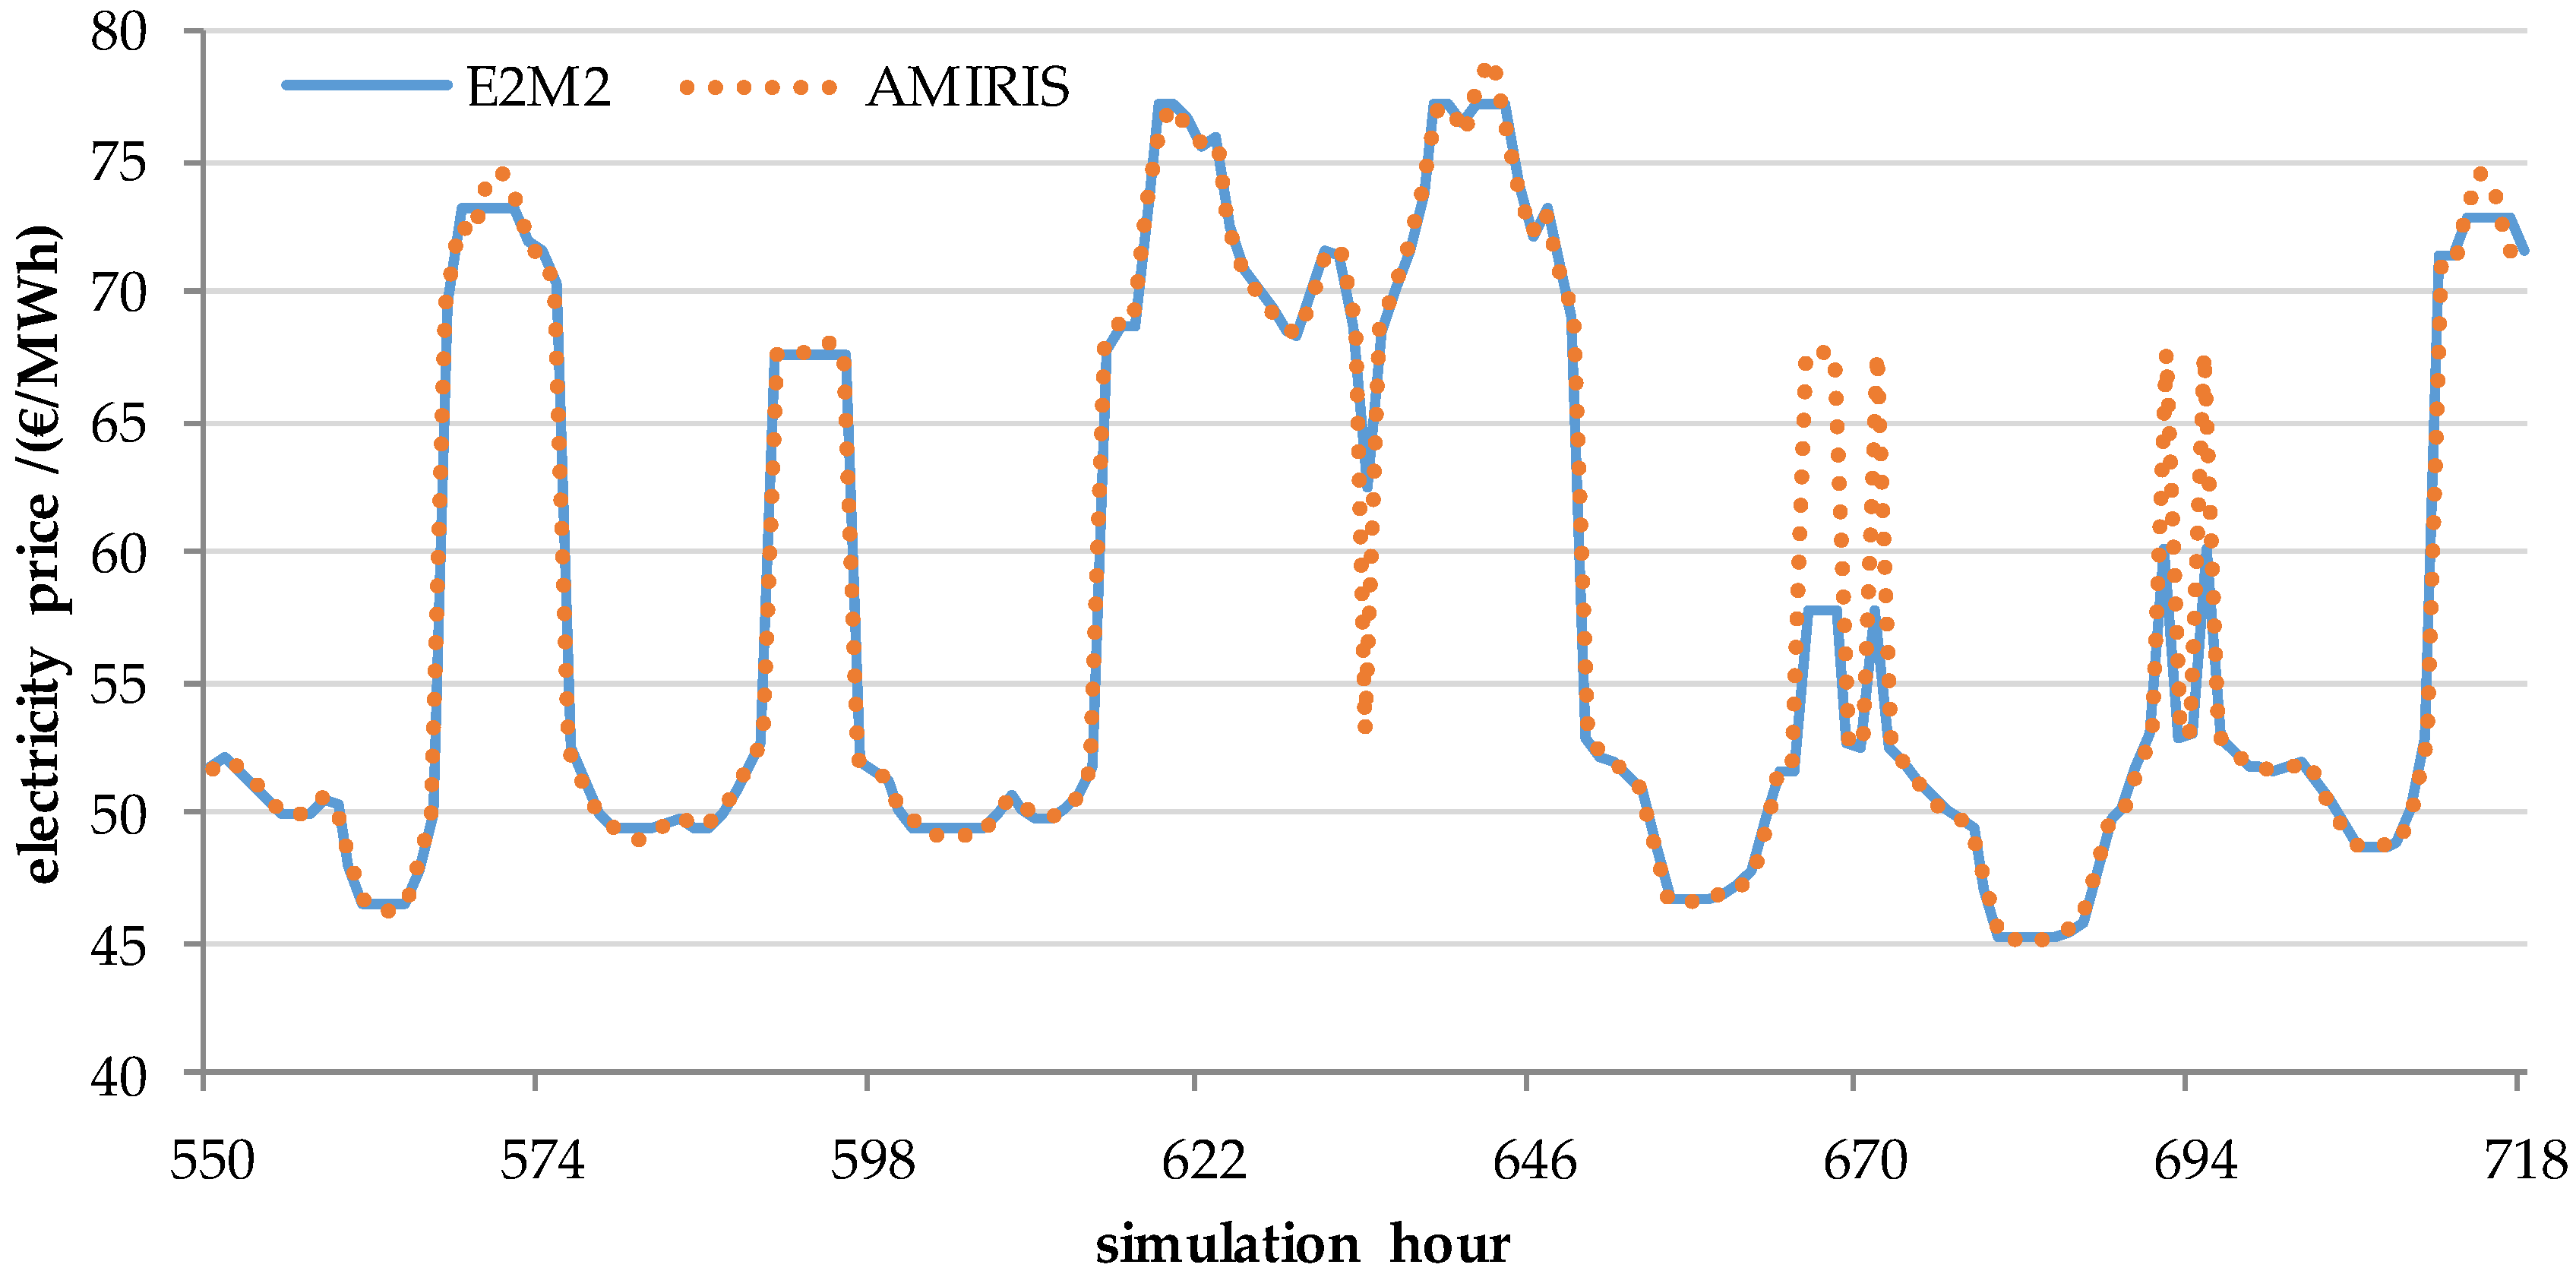
4.1. Model Harmonization

The term model harmonization refers to the alignment of input parameters and model configurations between E2M2 and AMIRIS. Since E2M2 applies a fundamental optimization approach to minimizing system costs, this can only be achieved by activating the cost minimizing storage strategy (CM) in AMIRIS.
We consider the harmonization process to be successful if the relative cumulative cost difference between both models is marginal, as this serves as our main indicator for the efficiency gap later on as well. Discrepancies regarding storage dispatch, VRE curtailment, and electricity prices may arise in individual hours in the harmonized runs nevertheless, but these lead to identical sums of system costs over several time steps. They are referred to as cost-neutral differences and are attributable to the fact that within a certain time interval, the same amount of energy can be stored or curtailed at different time steps resulting in identical overall costs. The remaining non-cost-neutral deviations represent the best possible approximation of model results that can be reached due to differences in the modeling technique. They provide a basis for the following differentiation between model-specific differences and the effects arising from non-ideal market assumptions, and thus for the quantification of the efficiency gap.
Figure 3 illustrates cumulative cost differences between AMIRIS and E2M2 for one simulated year in the 40_CM1 scenario. A single storage operator is implemented by applying the cost minimizing storage strategy (CM) in AMIRIS. There are deviations of up to about 120 k€ in single hours between both model results, but they are leveled out within the subsequent hours. These systems cost differences are thus considered to be cost-neutral. At the end of the simulated year, the sum of all cost discrepancies is only 1722 €. This corresponds to an increase of costs in AMIRIS compared to E2M2 (with system costs of about 17.82 billion €) of only 0.0001‰. This difference is considered to be marginal, and thus the harmonization process has been successful.
A thorough analysis of the remaining cost differences showed that these are caused by the discretization of storage levels within AMIRIS. The fill level of the storage units in AMIRIS is discretized in 1000 steps for each multiple of the E2P ratio of the storage system. A further increase of the number of discretization steps would lead to high computing times. Figure 4 shows the reduction of the cost deviation between AMIRIS and E2M2 with increasing number of discretization steps. In addition, this result shows clearly that the model harmonization was successful.

4.2. Efficiency Gap Quantification

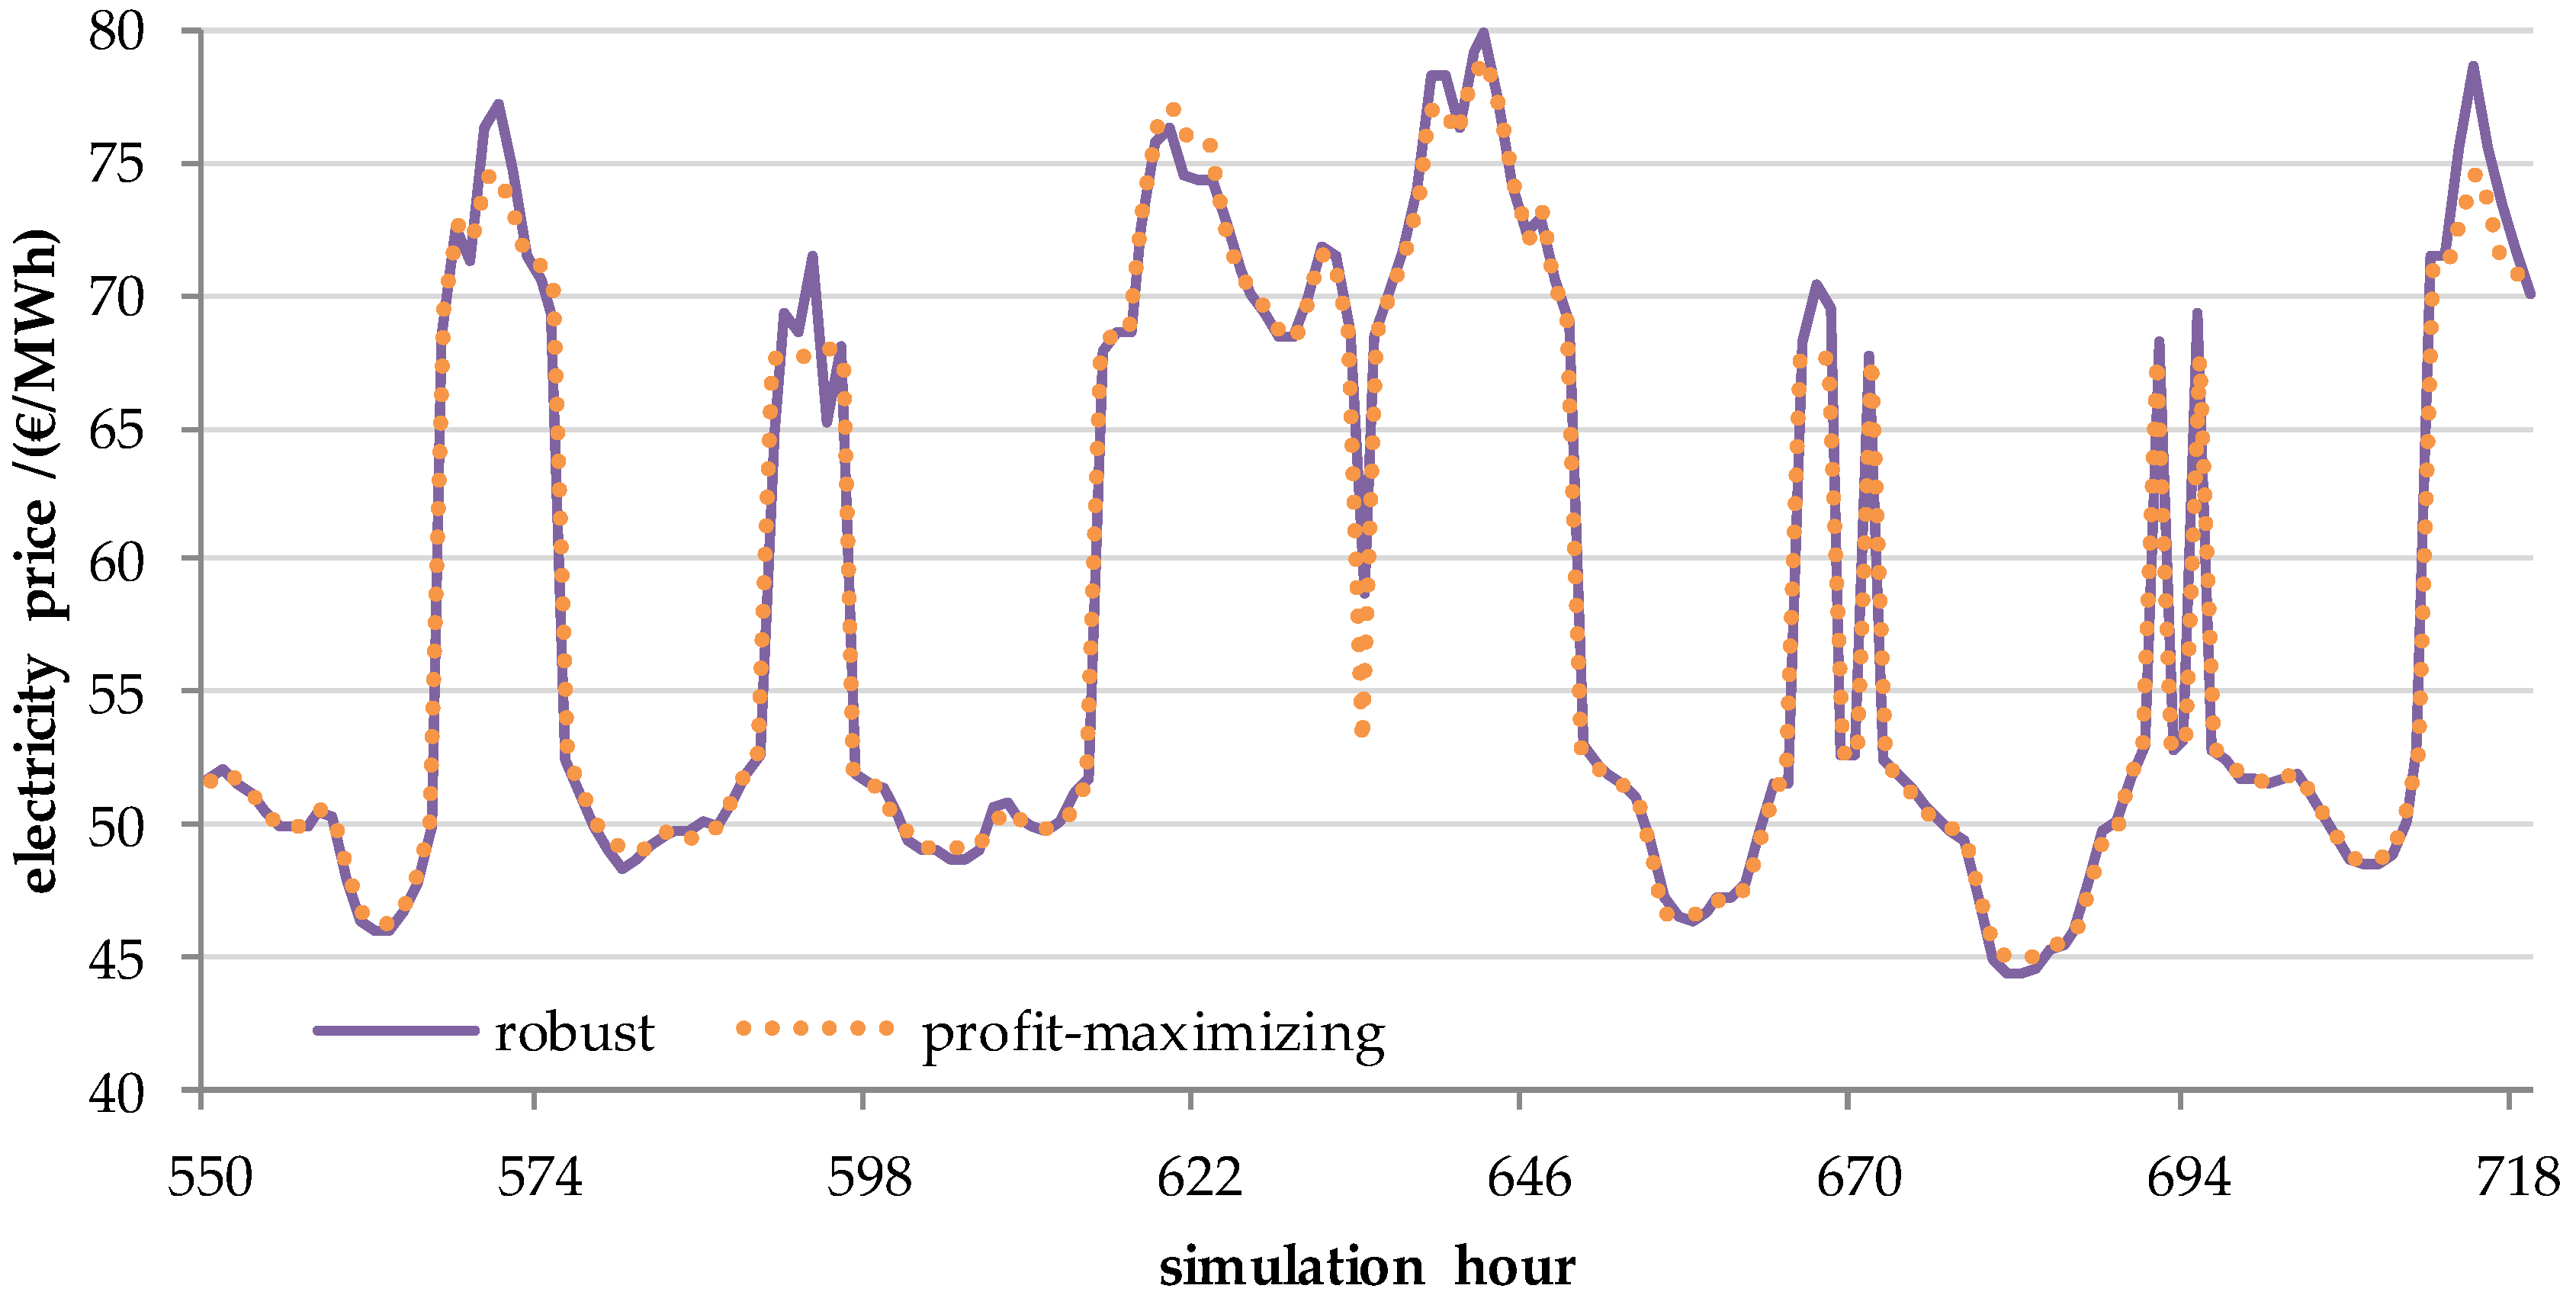
4.2.1. Effects of Market Imperfections

Once the models were harmonized, the market imperfections mentioned in Section 2.3.2 (i.e., market power, information deficits, and market distortions) were analyzed in detail by activating different storage strategies in AMIRIS, namely, the profit maximizing (PM) as well as the robust bidding (RB), and by means of a VMP applied to VRE operators. The impact of these imperfections on the system costs are depicted in Table 2.
The cumulative cost differences between the profit maximizing and the system optimal dispatch of the energy storage unit sum to about 600 k€ of higher costs in the profit maximizing case at the end of the year. This, however, is almost negligible compared to the system costs for dispatching the power plants in E2M2 of about 17.82 billion €. The system cost increase due to the profit maximizing dispatch of the storage unit was thus 0.03‰. By selecting the profit maximizing storage strategy (PM) in AMIRIS, the storage operator optimizes the storage dispatch according to its individual profit. Figure 5 shows the electricity prices for the normative system optimal (E2M2) and the profit maximizing (AMIRIS) dispatch of the storage unit. The operational schedule in the profit maximizing case differs from the normative system optimal dispatch and the price curve is no longer system optimally flattened, leading to increased system costs in AMIRIS. The system optimal price curve has several hours with a constant value, whereas the price curve resulting from the maximization of the storage operator’s profits has stronger pronounced minima and maxima. This is caused by the decision behavior of the storage operator exercising its market power to maintain a high price spread between hours of selling and purchasing energy.
In the case in which the robust storage strategy (RB) is applied within AMIRIS, the cumulative cost differences to the normative optimal approach sum up to about 18.9 million € at the end of the year. This corresponds to an increase of the system costs of roughly 0.11% compared to the normative optimal case. This can be explained by a lower storage turnover resulting from the application of the robust storage strategy (RB) in AMIRIS compared to the normative system optimal dispatch. The annual storage energy turnover after deduction of the losses incurred during the loading process was 502 GWh by the robust storage strategy (RB) and 2113 GWh in the normative case. The robust storage strategy (RB) represents a heuristic for the storage dispatching that can be applied by a storage operator if no perfect foresight information about future electricity prices is assumed and there is competition with other storage operators. Although the aim of this robust strategy (RB) is to maximize the storage operator profits, it does not perform as well as the profit maximization storage strategy (PM) with respect to generated profits due to the assumed information deficits. For the profit maximization strategy (PM), it was assumed that the storage operator has full information about the dispatching cost structure of the market in the future and therefore has perfect knowledge about future prices at its disposal, which are not available for the storage operator of the robust strategy (RB). Figure 6 depicts the electricity prices for one simulated week employing the profit maximizing (PM) and robust storage (RB) strategies. It can be seen that there are deviations between both strategies with respect to the resulting electricity prices. This is caused by the bidding heuristic used in the robust storage strategy (RB).
In order to evaluate the effects of the VMP on the efficiency gap, the power plant portfolio of the scenario 40_CM1_VMP was modified compared to the other scenarios with 40% share of VRE (see Appendix A). The reason for this change lies in the fact that the lowest marginal cost of the thermal plants considered in the latter scenarios (31.10 €/MWh for lignite-fired plants) was higher than the marginal cost of the most expensive VRE unit (30.4 €/MWh for offshore wind power). Under these circumstances, a reduction in the bid prices for VRE plants due to a VMP does neither change the merit order nor the system costs, and thus the VMP would not contribute to an efficiency gap. Therefore, 8 GW of nuclear power plants with low marginal costs (between 10.67 €/MWh and 13.94 €/MWh) were included in the optimization and simulation runs in the 40_CM1_VMP scenario. In addition, the fuel price for lignite was reduced from 4 to 2 €/MWhth resulting in marginal costs of between 26.65 €/MWh and 38.98 €/MWh for lignite-fired power plants.
Applying the scenario mentioned above, the VMP and a system cost minimizing storage strategy (CM), the annual system costs calculated by AMIRIS exceed those calculated by E2M2 by about 19.4 million € at the end of the year. This corresponds to an increase of the system costs of 0.13% due to the VMP and is due to the fact that the VMP influences the deployment of VRE by increasing the opportunity costs of power curtailment for the VRE plant operators. Thus, the amount of curtailed power in the system is reduced from 3.9 TWh to 1.1 TWh per year. This means that power plants with low marginal costs can be pushed out of the energy mix by VRE plants with higher marginal costs because the latter can offer electricity at lower prices than their actual technical marginal costs. If the VRE operators are price-setting, the VMP influences the operation of VRE plants by changing their bidding behavior when the wholesale power market leads to low or even negative prices. Figure 7 shows the electricity prices by AMIRIS with and without considering a VMP for one simulated week. The effect of the VMP occurs when the electricity prices fall below the marginal costs of VRE plants (in this case below 30.4 €/MWh).

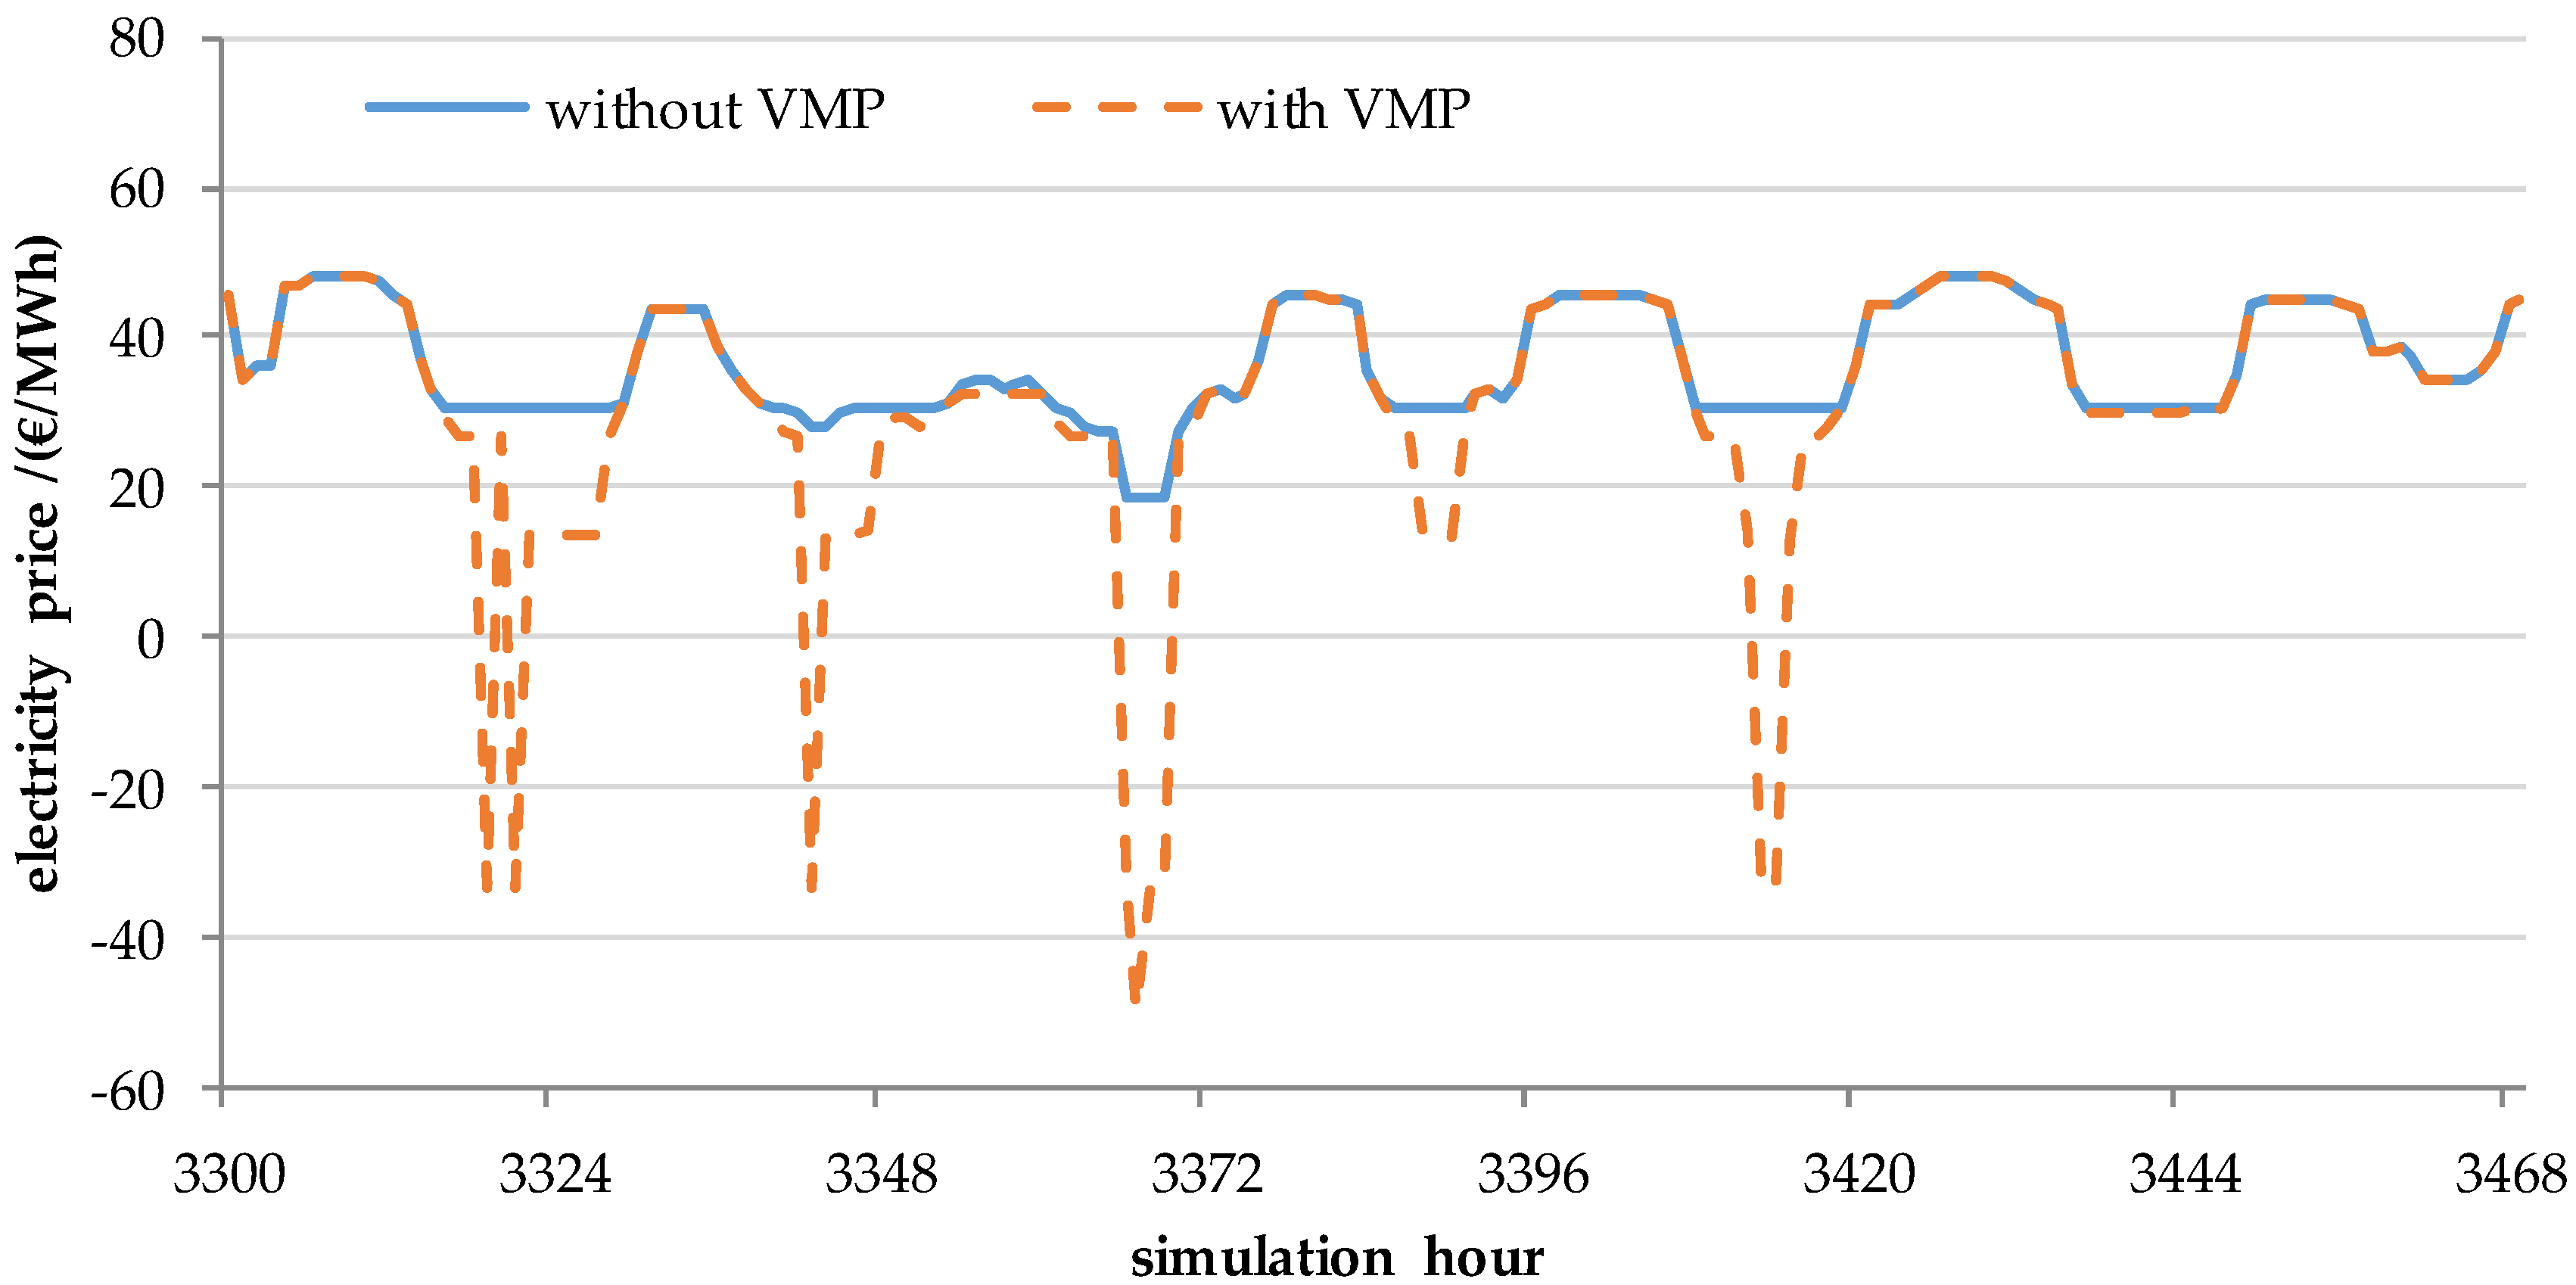
4.2.2. Impact of Higher Shares of VRE

After analyzing the effects of market imperfections in the electricity system, the efficiency gap is studied for increasing shares of VRE. For this purpose, the robust storage strategy (RB) is applied by AMIRIS under the assumption of imperfect electricity price forecasts and competition among storage operators as well as a VMP. Table 3 presents the additional system costs calculated by AMIRIS for the 40_RB10_VMP, 60_RB10_VMP, and 80_RB10_VMP scenarios in absolute and relative values with regard to the normative optimal system costs.
With rising shares of VRE, the efficiency gap increases in absolute and relative terms. While the efficiency gap in the 40_RB10_VMP scenario accounts for 21.2 million € (approx. 0.12% of the normative system costs), it rises to 120.2 million € (approx. 0.8%) for the 60_RB10_VMP scenario and even to 490.9 million € (approx. 4.1%) for the 80_RB10_VMP scenario. This is mainly caused by a rising capacity of storage units, which are required to balance higher shares of VRE, and thus leads to a growing discrepancy between a normative system optimal dispatch and one restricted by the lack of perfect foresight. The VMP has almost no impact on the system costs in these calculations, since no conventional power plants with marginal costs below those of the renewable plants were operated. Therefore, no changes occurred in the merit order due to the fact that VRE operators can offer electricity at lower prices than their actual technical marginal costs.

5. Discussion and Outlook

By harmonizing and soft-linking the cost minimizing fundamental electricity market model E2M2 (normative approach) and the agent-based simulation model AMIRIS, the efficiency gap induced by different decision strategies of storage operators and a variable market premium (VMP) was identified and quantified in an electricity market with rising shares of VRE.
Striving for the achievement of robust results, the two models were first harmonized rigorously (see Section 4.1). It has been shown that the deviations of the model results in this harmonization became marginal. The authors deem that this rigorous harmonization constitutes a fundamental prerequisite for quantifying the efficiency gap resulting from realistic conditions deviating from an idealized normative approach. The model harmonization allows for distinguishing deviations of model results stemming from market imperfections from those stemming from model-specific differences. By means of a precise alignment of input parameters and model configurations, the two models could be harmonized down to numerical precision and model-specific differences could be neglected. Once the models were harmonized, the efficiency gaps were quantified for different cases of deviations from the normative ideal market assumptions: information deficits, deviations of the decisions of storage operators from a perfect homo economicus approach and exercise of market power, and market distortions caused by a VMP. These effects were first examined in isolation from each other (see Section 4.2.1) and then combined with an increasing share of VRE (see Section 4.2.2).
For analyzing the impact of the exercise of market power on the efficiency gap, a profit maximizing storage strategy (PM) was selected by AMIRIS, which optimizes the dispatch of the storage operator according to its individual profit. By activating this strategy, the costs of the AMIRIS run increased by about 0.03‰ with regard to the normative case. Therefore, under the scenario considered in this analysis, it could be shown that the economic calculation of the storage operators reveals a limited influence on the system costs and the efficiency gap. Nevertheless, relevant differences in the electricity prices may arise due to the fact that the storage operator tries to keep the price spread between the sold and purchased energy as large as possible in order to increase its profits. These results, however, should be treated with caution since the scenario setup relies on just one single storage operator being not representative. Incorporating multiple independent storage operators, which can interact and maintain perfect foresight at the same time, would need the application of approaches of game theory, which is not within the scope of this work. In contrast, the robust strategy (RB) is set up in a way that multiple storage operators can be represented by the AMIRIS model and, therefore, competitive behavior for the storage operators is integrated.
Within this study, it was also demonstrated that the consideration of information deficits by activating the robust bidding strategy (RB) by AMIRIS leads to a suboptimal deployment of the storage facilities. This strategy reduced the storage operation of the AMIRIS run to about a quarter of the storage usage of the normative optimization model E2M2. As a result, the efficiency gap increased in this scenario approximately to 0.11% of the normative system costs. Thus, we were able to show that, considering uncertainties due to the lack of information, it influences the unit commitment, the resulting system costs, and the efficiency gap as other authors did for some of the aspects by different approaches as well [11]. As a first representation of the complex implementation of multi-agent strategies, the results of the robust bidding strategy (RB) may represent a more conservative storage operation. Further development of the implemented strategy might lead to a smaller efficiency gap. The obtained results nevertheless indicate the kind of impact on the efficiency gap resulting from information deficits on bidding strategies.
The assessment of market-distorting effects by means of the VMP of the Germany renewable feed-in law led to an efficiency gap of roughly 0.13% compared to normative system costs. The inclusion of a VMP thus has an impact on the resulting system costs and on the efficiency gap. However, the results in this case are mainly dependent on the assumptions regarding marginal costs of wind park operators and those of base load power sources such as nuclear and lignite-fired power plants. The marginal costs determine the sequence of the generation units in the merit order if no remuneration instrument is considered. Considering a VMP may change this sequence of generation units and can lead to a more frequent operation of VRE plants compared to the normative system optimal dispatch. Due to possible interactions between multiple policy instruments in more complex systems, these results provide a first hint and a deeper examination of the support regime is required to better understand its effect on the efficiency gap.
The analyses carried out with higher shares of VRE showed that the efficiency gap strongly increases with rising shares of VRE. While the efficiency gap takes into account imperfect electricity price forecasts and competition among storage operators as well as a VMP, it increases to 21.2 million € (approx. 0.12% of the system costs in E2M2) in the 40_RB10_VMP scenario, to 120.2 million € (approx. 0.8%) in the 60_RB10_VMP scenario, and quite significantly to 490.9 million € (approx. 4.1%) in the 80_RB10_VMP scenario. This can be explained by the different structure of the power plant fleet between the scenarios. The provision of flexibility in scenarios with low shares of VRE is strongly based on conventional power plants, whose representation in both models is equivalent. However, if high shares of VRE are assumed, storage technologies, which have different representations due to the influence of future energy prices and competitors’ behavior on today´s decisions (e.g., normative system optimizing vs. profit maximizing deployment or perfect foresight vs. information deficits), take over a significant share of the flexibility provision. The VMP has almost no impact on the system costs in these calculations since all conventional power plants were given marginal costs above those of the VRE plants.
The presented work aims to contribute to the understanding of fundamental causal relations and effects of the efficiency gap in an electricity market under transition towards a renewable energy-based system. Therefore, simplified exemplary scenarios were used. It was shown that market imperfections affect the dispatch decisions of flexibility option (storage) operators and thus increase the system costs. In order to draw conclusions for actual energy systems, further investigations must be carried out considering more realistic energy system configurations. These should include, for instance, must-run capacities given by combined heat and power generation plants or by the provision of ancillary services. These units reduce the system flexibility and thus reveal a strong influence on the merit order. Furthermore, start-up and shut-down costs of conventional generation plants should be taken into account. These costs change the bids of thermal power plant operators on the wholesale markets, which not only affects the merit order but also the system costs. Additionally, the imperfect foresight of the renewable feed-in due to forecasting errors has not yet been part of the analysis.
Moreover, the previous analyses covered only the short-term efficiency gap of the unit commitment problem, but they did not address possible discrepancies regarding investment decisions in generation and flexibility units. Investment decisions from investor agents are expected to deviate from a normative ideal approach, since investors lack a perfect foresight and need to consider further aspects, like a company-specific power plant portfolio or other investor-specific preferences. Thus, considering the investment behavior, it is expected, that this will lead to an increased efficiency gap. This long-term efficiency gap can create strong path dependencies and needs to be investigated further. However, with this work, we were able to create a basis for such further analysis.
Furthermore, the above analyses have shown that the dispatch strategies of storage operators influence the overall energy system performance. To allow more detailed evaluations of the efficiency gap, it is crucial to employ storage dispatch strategies that consider forecast errors and competition among flexibility options as realistic as possible.
Based on the methodology presented in this paper, future research should also investigate which conclusions for the design of energy systems and policy instruments can be drawn from the study of the efficiency gap. This could be achieved on the one hand by a bidirectional model coupling, extending the unidirectional soft-linking methodology presented in this paper. The driving factors of the efficiency gap identified in the ABM could thus be fed back to the optimization model for calculating normative near-optimal scenarios with lower efficiency gaps. On the other hand, stochastic effects concerning future power prices and VRE feed-ins should be included in the normative optimal modeling approach, to account for these effects not resulting from market or regulative inefficiencies.
The authors conclude that the efficiency gap can be interpreted as an indicator for the difficulty to implement the corresponding scenario in a real-world energy system. Therefore, the efficiency gap should be considered when choosing cost-optimal transformation paths towards a future decarbonized energy system.

Author Contributions

Research conceptualization and design, L.T.-D., C.S., M.R., G.S., M.D.-U., F.G., B.F., and K.H.; methodology, L.T.-D., C.S., M.R., B.F., and K.H.; software, L.T.-D., C.S., G.S., and B.F.; formal analysis, L.T.-D., C.S., and M.R.; investigation, L.T.-D., C.S., M.R., and G.S.; data curation, L.T.-D., M.R., G.S., and B.F.; writing—original draft preparation, L.T.-D. and C.S.; writing—review and editing, L.T.-D., C.S., M.R., G.S., M.D.-U., F.G., B.F., and K.H.; visualization, L.T.-D. and C.S.; supervision, K.H.; funding acquisition and project administration, B.F., M.R., G.S., M.D.-U., and K.H. All authors have read and agreed to the published version of the manuscript.

Funding

This research was funded by the German Federal Ministry for Economic Affairs and Energy, grant number 03ET4025A/03ET4025B.

Acknowledgments

This research was conducted through cooperation within the Stuttgart Research Initiative on Integrated Systems Analysis for Energy (STRise).

Conflicts of Interest

The authors declare no conflict of interest. The funders had no role in the design of the study; in the collection, analyses, or interpretation of data; in the writing of the manuscript; or in the decision to publish the results.

Nomenclature

Abbreviations
ABMAgent-Based Model
AMIRISAgent-based Model for the Integration of Renewables Into electricity marketS
CCGTCombined Cycle Gas Turbine
CGEComputable General Equilibrium
CMCost Minimizing
E2M2European Electricity Market Model
E2PEnergy-to-Power
GTGas Turbine
IAMIntegrated Assessment Model
LPLinear Programming
O&MOperation and Maintenance
PMProfit Maximizing
PVPhotovoltaic
RBRobust Bidding
VMPVariable Market Premium
VREVariable Renewable Energy
E2M2
Indices and sets
u U Index and set of units
u U I n v Index and set of invested units
t T Index and set of time steps
Parameters and Variables
T S C o s t Total system costs
a I n v C o s t Annualized investment costs
F i x O & M C o s t Annual fixed O&M costs
V a r O & M C o s t Variable O&M costs
F u e l C o s t Fuel costs
C O 2 C o s t CO2 certificate costs

Appendix A. Input Data

Table A1, Table A2, Table A3 and Table A4 include the scenario parameters and power plant characteristics for the scenarios defined in Section 3.1. Data assumptions are based on [14,36,37,38].
Table A1. Input data for the scenarios 40_CM1, 40_PM1, 40_RB1, and 40_RB10_VMP.
Max. CO2/MtElec. Demand/TWhWind Offshore/GWWind Onshore/GWPV/GWLignite/GWGas CCGT/GWGas GT
/GW
Storage
Total Power/GWTotal Capacity/GWh
201.354514.156.370.313.84218.67.314.5
Marginal costs/(€/MWh)30.418.5031.10–45.6543.78–53.0867.63–87.47--
Table A2. Input data for the scenario 40_CM1_VMP.
Max. CO2/MtElec. Demand/TWhWind Offshore/GWWind Onshore/GWPV/GWNuclear
/GW
Lignite/GWGas CCGT/GWGas GT
/GW
Storage
Total Power/GWTotal Capacity/GWh
201.354514.156.370.3813.84218.67.314.5
Marginal costs/(€/MWh)30.418.5010.67–
13.94
26.65–
38.98
43.78–
53.08
67.63–
87.47
--
Table A3. Input data for the scenario 60_RB10_VMP.
Max. CO2/MtElec. Demand/TWhWind Offshore/GWWind Onshore/GWPV/
GW
Lignite/
GW
Gas CCGT
/GW
Gas GT
/GW
Storage
Total Power/GWTotal Capacity/GWh
128.154521.586.2107.79.638.611.824142
Marginal costs/(€/MWh)30.418.5032.48–47.7244.29–53.7068.43–88.51--
Table A4. Input data for the scenario 80_RB10_VMP.
Max. CO2/MtElec. Demand/TWhWind Offshore/GWWind Onshore/GWPV/
GW
Lignite/
GW
Gas CCGT/GWGas GT
/GW
Storage
Total Power/GWTotal Capacity/GWh
54.954531123.9154.93.632.612.262494
Marginal costs/(€/MWh)30.418.5034.77–51.1645.15–54.7569.77–90.25--

References

  1. Savvidis, G.; Siala, K.; Weissbart, C.; Schmidt, L.; Borggrefe, F.; Kumar, S.; Pittel, K.; Madlener, R.; Hufendiek, K. The gap between energy policy challenges and model capabilities. Energy Policy 2019, 125, 503–520. [Google Scholar] [CrossRef]
  2. Herbst, A.; Toro, F.; Reitze, F.; Jochem, E. Introduction to Energy Systems Modelling. Swiss J. Econ. Stat. 2012, 148, 111–135. [Google Scholar] [CrossRef] [Green Version]
  3. Sun, N. Modellgestützte Untersuchung des Elektrizitätsmarktes: Kraftwerkseinsatzplanung und –Investitionen; Institute of Energy Economics and Rational Energy Use, University of Stuttgart: Stuttgart, Germany, 2013. [Google Scholar]
  4. Gillich, A.; Brodecki, L.; Hufendiek, K. Impacts of complementing goals besides emission targets on CO2 mitigation cost: A model-based analysis. Energy Strategy Rev. 2019, 26, 100395. [Google Scholar] [CrossRef]
  5. Fleischer, B. Systemeffekte von Bioenergie in der Elektrizitäts- und Fernwärmewirtschaft: Eine Modellgestützte Analyse Langfristiger Energiewendeszenarien in Deutschland; Institute of Energy Economics and Rational Energy Use, University of Stuttgart: Stuttgart, Germany, 2019. [Google Scholar]
  6. Steurer, M. Analyse von Demand Side Integration im Hinblick auf Eine Effiziente und Umweltfreundliche Energieversorgung; Institute of Energy Economics and Rational Energy Use, University of Stuttgart: Stuttgart, Germany, 2017. [Google Scholar]
  7. Gils, H.C. Economic potential for future demand response in Germany—Modeling approach and case study. Appl. Energy 2016, 162, 401–415. [Google Scholar] [CrossRef] [Green Version]
  8. Schill, W.-P.; Zerrahn, A. Long-run power storage requirements for high shares of renewables: Results and sensitivities. Renew. Sustain. Energy Rev. 2018, 83, 156–171. [Google Scholar] [CrossRef]
  9. Sun, N.; Ellersdorfer, I.; Swider, D.J. Model-based long-term electricity generation system planning under uncertainty. In Proceedings of the Third International Conference on Electric Utility Deregulation and Restructuring and Power Technologies, Nanjing, China, 6–9 April 2008; pp. 1298–1304. [Google Scholar]
  10. Meibom, P.; Barth, R.; Hasche, B.; Brand, H.; Weber, C.; O’Malley, M. Stochastic Optimization Model to Study the Operational Impacts of High Wind Penetrations in Ireland. IEEE Trans. Power Syst. 2011, 26, 1367–1379. [Google Scholar] [CrossRef]
  11. Scheben, H.; Klempp, N.; Hufendiek, K. Impact of Long-Term Water Inflow Uncertainty on Wholesale Electricity Prices in Markets with High Shares of Renewable Energies and Storages. Energies 2020, 13, 2347. [Google Scholar] [CrossRef]
  12. Trutnevyte, E. Does cost optimization approximate the real-world energy transition? Energy 2016, 106, 182–193. [Google Scholar] [CrossRef]
  13. Reeg, M.; Nienhaus, K.; Roloff, N.; Pfenning, U.; Deissenroth, M.; Wassermann, S.; Hauser, W.; Weimer-Jehle, W.; Klann, U.; Kast, T. AMIRIS—Weiterentwicklung Eines Agentenbasierten Simulationsmodells zur Untersuchung des Akteursverhaltens bei der Marktintegration von Strom aus Erneuerbaren Energien unter Verschiedenen Fördermechanismen; Deutsches Zentrum für Luft und Raumfahrt (DLR), Institut für ZukunftsEnergieSysteme (IZES), Thomas Kast Simulation Solutions, Zentrum für Interdisziplinäre Risiko- und Innovationsforschung der Universität Stuttgart (ZIRIUS): Stuttgart, Germany; Vilsholfen, Germany; Saarbrücken, Germany, 2013. [Google Scholar]
  14. Reeg, M. AMIRIS—Ein Agentenbasiertes Simulationsmodell zur Akteursspezifischen Analyse Techno-Ökonomischer und Soziotechnischer Effekte bei der Strommarktintegration und Refinanzierung Erneuerbarer Energien; Faculty of Mechanical Science and Engineering, University of Dresden: Dresden, Germany, 2019. [Google Scholar]
  15. Sensfuß, F.; Ragwitz, M.; Genoese, M.; Möst, D. Agent-based Simulation of Electricity Markets -A Literature Review. Energy Stud. Rev. 2007, 15. [Google Scholar] [CrossRef] [Green Version]
  16. Genoese, M. Energiewirtschaftliche Analysen des Deutschen Strommarkts Mit Agentenbasierter Simulation; Nomos Verlagsgesellschaft mbH &, Co. KG: Baden-Baden, Germany, 2010; ISBN 978-3-8452-2744-3. [Google Scholar]
  17. Bower, J.; Bunn, D. Experimental analysis of the efficiency of uniform-price versus discriminatory auctions in the England and Wales electricity market. J. Econ. Dyn. Control 2001, 25, 561–592. [Google Scholar] [CrossRef]
  18. Jaffe, A.B.; Stavins, R.N. The energy-efficiency gap—What does it mean? Energy Policy 1994, 22, 804–810. [Google Scholar] [CrossRef]
  19. Gillingham, K.; Newell, R.G.; Palmer, K. Energy Efficiency Economics and Policy. Annu. Rev. Resour. Econ. 2009, 1, 597–620. [Google Scholar] [CrossRef]
  20. Stoft, S. Power System Economics: Designing Markets for Electricity; IEEE Press Wiley Interscience: Piscataway, NJ, USA, 2002; ISBN 978-0-471-15040-4. [Google Scholar]
  21. Wene, C.-O. Energy-economy analysis: Linking the macroeconomic and systems engineering approaches. Energy 1996, 21, 809–824. [Google Scholar] [CrossRef] [Green Version]
  22. Helgesen, P.I.; Lind, A.; Ivanova, O.; Tomasgard, A. Using a hybrid hard-linked model to analyze reduced climate gas emissions from transport. Energy 2018, 156, 196–212. [Google Scholar] [CrossRef]
  23. Deane, J.P.; Chiodi, A.; Gargiulo, M.; Gallachóir, B.P.Ó. Soft-linking of a power systems model to an energy systems model. Energy 2012, 42, 303–312. [Google Scholar] [CrossRef]
  24. Poncelet, K.; Delarue, E.; Six, D.; Duerinck, J.; D’haeseleer, W. Impact of the level of temporal and operational detail in energy-system planning models. Appl. Energy 2016, 162, 631–643. [Google Scholar] [CrossRef] [Green Version]
  25. Pina, A.; Silva, C.A.; Ferrão, P. High-resolution modeling framework for planning electricity systems with high penetration of renewables. Appl. Energy 2013, 112, 215–223. [Google Scholar] [CrossRef]
  26. Belderbos, A.; Delarue, E. Accounting for flexibility in power system planning with renewables. Int. J. Electr. Power Energy Syst. 2015, 71, 33–41. [Google Scholar] [CrossRef] [Green Version]
  27. Korkmaz, P.; Cunha Montenegro, R.; Schmid, D.; Blesl, M.; Fahl, U. On the Way to a Sustainable European Energy System: Setting Up an Integrated Assessment Toolbox with TIMES PanEU as the Key Component. Energies 2020, 13, 707. [Google Scholar] [CrossRef] [Green Version]
  28. Niamir, L. Behavioural Climate Change Mitigation: From Individual Energy Choices to Demand-Side Potential; University of Twente: Enschede, The Netherlands, 2019. [Google Scholar]
  29. Belete, G.F.; Voinov, A.; Arto, I.; Dhavala, K.; Bulavskaya, T.; Niamir, L.; Moghayer, S.; Filatova, T. Exploring Low-Carbon Futures: A Web Service Approach to Linking Diverse Climate-Energy-Economy Models. Energies 2019, 12, 2880. [Google Scholar] [CrossRef] [Green Version]
  30. Deissenroth, M.; Klein, M.; Nienhaus, K.; Reeg, M. Assessing the Plurality of Actors and Policy Interactions: Agent-Based Modelling of Renewable Energy Market Integration. Complexity 2017, 2017, 1–24. [Google Scholar] [CrossRef]
  31. Torralba Díaz, L.; Deissenroth, M.; Fleischer, B.; Guthoff, F.; Hufendiek, K.; Reeg, M.; Savvidis, G.; Schimeczek, C. ERAFlex—Effektive Rahmenbedingungen für Einen Kostenoptimalen EE-Ausbau Mit Komplementären Dezentralen Flexibilitätsoptionen im Elektrizitätssektor; Institut für Energiewirtschaft und Rationelle Energieanwendung (IER), Deutsches Zentrum für Luft und Raumfahrt (DLR): Stuttgart, Germany, 2019. [Google Scholar]
  32. Jevons, W.S. The Theory of Political Economy, 5th ed.; Kelley & Millman, Inc.: New York, NY, USA, 1957. [Google Scholar]
  33. OECD PUBLISHING. OECD Glossary of Statistical Terms; Organisation for Economic Co-operation and Development: Paris, France, 2008. [Google Scholar]
  34. Williams, H.P. Model Building in Mathematical Programming, 5th ed.; John Wiley & Sons Ltd.: Hoboken, NJ, USA; London School of Economics: London, UK, 2013. [Google Scholar]
  35. Erneuerbare-Energien-Gesetz Vom 21. Juli 2014 (BGBl. I S. 1066). Available online: https://www.bgbl.de/xaver/bgbl/start.xav?start=%2F%2F*[%40attr_id%3D%27bgbl114s1066.pdf%27]#__bgbl__%2F%2F*%5B%40attr_id%3D%27bgbl114s1066.pdf%27%5D__1596178008635 (accessed on 1 July 2019).
  36. Icha, P.; Kuhs, G. Entwicklung der Spezifischen Kohlendioxid-Emissionen des Deutschen Strommix in den Jahren 1990–2017; Umweltbundesamt: Dessau-Roßlau, Germany, 2018. [Google Scholar]
  37. Adamnek, F.; Pluntke, H.; Rotering, N.; Sauer, D.U.; Sterner, M.; Wellßow, W.; Aundrup, T.; Glaunsinger, W.; Kleinmaier, M.; Landinger, H.; et al. Energiespeicher für die Energiewende: Speicherungsbedarf und Auswirkungen auf das Übertragungsnetz für Szenarien bis 2050; VDE Verband der Elektrotechnik Elektronik Informationstechnik e.V.: Frankfurt am Main, Germany, 2012. [Google Scholar]
  38. Fahl, U.; Welsch, J.; Eberl, T.; Vu, T.; Steurer, M.; Bothor, S. Systemanalyse Energiespeicher: Schlussbericht; Institute of Energy Economics and Rational Energy Use, University of Stuttgart: Stuttgart, Germany, 2015. [Google Scholar]
Figure 1. Schematic depiction of the agents in AMIRIS.
Energies 13 03920 g001
Figure 2. Flowchart of the model coupling methodology.
Energies 13 03920 g002
Figure 3. Cumulative cost differences between AMIRIS and E2M2 in the 40_CM1 scenario for one simulated year.
Energies 13 03920 g003
Figure 4. Annual cost differences between AMIRIS and E2M2 for different storage discretization steps in AMIRIS in the 40_CM1 scenario; discretization steps are given per E2P ratio of the storage system.
Energies 13 03920 g004
Figure 5. Electricity prices in AMIRIS with profit maximizing storage strategy (PM) and E2M2 with normative cost-optimal dispatch in the 40_PM1 scenario for one simulated week.
Energies 13 03920 g005
Figure 6. Electricity prices in AMIRIS with the profit maximizing (PM) and the robust storage (RB) strategies in the 40_RB1 scenario for one simulated week.
Energies 13 03920 g006
Figure 7. Electricity prices in AMIRIS using the system cost minimizing storage strategy (CM) with and without considering a VMP in the 40_CM1_VPM scenario for one simulated week.
Energies 13 03920 g007
Table 1. Variations between scenarios.
ScenarioShare of VRE/%Storage Strategy in AMIRISNumber of Storage OperatorsVMP
40_CM140Cost minimizing1no
40_PM140Profit maximizing1no
40_RB140Robust bidding1no
40_CM1_VMP40Cost minimizing1yes
40_RB10_VMP40Robust bidding10yes
60_RB10_VMP60Robust bidding10yes
80_RB10_VMP80Robust bidding10yes
Table 2. Absolute and relative annual cost differences between AMIRIS and E2M2 in the 40_PM1, 40_RB1, and 40_CM1_VPM scenarios; only variable O&M, fuel, and CO2 certificate costs are considered; relative values are calculated as a percent of costs in E2M2.
ScenarioAbsolute Cost Increase/(k€/a)Relative Cost Increase/(%/a)
40_PM16000.003
40_RB118,9950.11
40_CM1_VPM19,3740.13
Table 3. Absolute and relative annual cost differences between AMIRIS and E2M2 in the 40_RB10_VMP, 60_RB10_VMP, and 80_RB10_VMP scenarios; only variable O&M, fuel, and CO2 certificate costs are considered; relative values are calculated as a percent of the costs in E2M2.
ScenarioAbsolute Cost Increase/(k€/a)Relative Cost Increase/(%/a)
40_RB10_VMP21,1780.12
60_RB10_VMP120,1800.8
80_RB10_VMP490,9344.1

