Development of Small-Sized Lead Inserted Laminated Rubber Bearing for Nuclear Component Seismic Isolation


1
Korea Atomic Energy Research Institute, Daejeon 34057, Korea
2
Korea Electric Association, Seoul 05718, Korea
3
School of Mechanical, Automotive and Aeronautical Engineering, Korea National University of Transportation, Chungju 27469, Korea
4
Korea Conformity Laboratories, Seoul 08501, Korea
*
Author to whom correspondence should be addressed.
Energies 2020, 13(12), 3193; https://doi.org/10.3390/en13123193
Submission received: 18 May 2020
/
Revised: 12 June 2020
/
Accepted: 15 June 2020
/
Published: 19 June 2020
Abstract
:This paper presents a design specification of the small-sized lead inserted laminated rubber bearing (LRB) for application to nuclear component seismic isolation and describes the results of test verification on design performance parameters such as effective horizontal stiffness, equivalent viscous damping ratio, design seismic isolation frequency, and ultimate shear deformation. To do this, two types of LRB, having the same vertical design load of 10 kN but with different shape factors, are designed, fabricated, and tested by the quasi-static procedures. To determine the effective horizontal stiffness and the equivalent damping value from the test results, the new method is proposed and compared with the methods of the ASCE and ISO standards in case that the tangential stiffness curve is not linear in tests. From the comparison between tests and design specifications in the performance parameters, it was found that the design specifications developed in this paper are in a good agreement with the test results. Furthermore, the target design shear deformation limits are confirmed to have sufficient design margins in ultimate shear deformation tests.
1. Introduction
The efforts to enhance the seismic capacity of nuclear power plants (NPPs) have been done for a long time. After the Fukushima accident, concerns about safety have increased in beyond design basis earthquake events (BDBE). To resolve this, the adoption of a seismic isolation technology can be one of strategies to enhance the seismic capacity of NPPs.
There are two ways to enhance the seismic capacity by the seismic isolation. One is to isolate whole buildings, including the reactor building and auxiliary building, by using a common basement. The other one is to isolate the specific seismically fragile facilities, which are safety-related components, such as heat exchangers, tanks, electric control cabinets or console, batteries and racks, and emergency diesel generator. The latter approach may be more practical when considering economics and applicability to enhance the seismic capacity of NPPs in certain situations, but, this has not been widely utilized so far.
Among many kinds of seismic isolators, such as friction sliding pendulum bearings with SMA (Shape Memory Alloys)-based gap damper [1], adaptive elastomeric based-isolated structure using variable-orifice dampers [2], and low-friction curved surface sliders and hysteretic gap damper [3], the laminated rubber bearing (LRB) has been known to be very useful for the seismic isolation of a very heavy superstructure due to its primitive characteristics of laminating thin rubber and steel sheet. Therefore, LRB has been mainly used for whole building isolation at ground level, and, then, the research and development on LRBs have focused on the large sized bearings, which are over one meter in diameter. The first application of seismic isolation to a nuclear power plant was completed at Cruas in France where four pressurized water reactor (PWR) units were seismically isolated by using 900 neoprene rubber bearings, designed, for an earthquake of 0.3 g [4]. The Jules Horowitz Reactor was also constructed with the neoprene rubber bearings for seismic isolation of a whole reactor building [5]. Most generation IV reactors are under development with a seismic isolation design by several countries, such as PRSIM, EFR, 4S, STAR-LM, KALIMER, and JSFR [6,7,8]. These are all considering using the LRB as an isolation device because of its specific feature to be able to withstand the very heavy weight of super structures with a stable horizontal deformation.
On the other hand, special design conditions are required to use the LRB for the seismic isolation component since the nuclear facility components are relatively light and mainly installed at a high elevation from a ground. Especially, when applying to the components located at high elevations, the LRB should be designed to be horizontally flexible enough to make a frequency shift function, and to be stable enough to accommodate the large shear deformation by the amplified severe seismic loads at component supports.
There has been research on a test of small-sized LRB, which is not a prototype but the reduced scale of a prototype large LRB for NPP applications [9]. Actually, it is not easy to design the small-sized prototype LRB applicable for the facility components to meet the design goals, achieving both the seismic isolation performance and stability, due to the large seismic loads and limitations on fabrication of a thin rubber plate. In this paper, two types of design specifications of small-sized LRB, applicable to NPP facility components, are proposed and their design performance parameters are verified through the various quasi-static mechanical property tests. In determination of the key design parameters such as the effective horizontal stiffness and the equivalent viscous damping ratio value from the test results, the new method is proposed and compared with the methods of the ASCE [10] and ISO [11] standards in the case that the tangential stiffness curve is not linear in tests.
There have been studies to evaluate the ultimate shear deformation of the LRB by simulations [12], but not in case of the lead inserted prototype having a small-sized design. In this paper, the ultimate shear deformation behavior is also investigated by tests, and the stability of the proposed small-sized LRB while experiencing various vertical loads is confirmed in the region of beyond design shear deformation.
2. Design of Small-Sized LRB
In design of the LRB, the main input parameters should be the rubber material properties, the vertical design isolation weight, the design isolation frequency, the required LRB damping value, and design horizontal deformation for the design earthquake level.
In general, the large-sized LRB is designed for whole building seismic isolation against ground earthquakes. However, the small-sized LRB for the component isolation must be designed to accommodate severely amplified seismic input motions at the floor level, where the components are installed. Therefore, the required design horizontal strain levels of the LRB must be different for them.
Unlike the large-sized LRB for buildings, the small-sized LRB applicable to the components must be fundamentally designed to assure the horizontal deformation stability of the LRB rather than the seismic isolation performance due to the limitation of the total rubber height that can be made in a relatively small sized LRB. Since the total rubber height determines the maximum shear deformation performance of the LRB, an LRB design that adequately complements stability and seismic isolation performance must be implemented.
In this paper, two types of design option, OPT-1 and OPT-2, of a lead inserted LRB were designed. Here, OPT-1 design focuses on lowering the seismic isolation frequency but sacrifices the shape factors more than OPT-2 design. As such, it was expected that OPT-1 could reduce the acceleration seismic response but would result in much larger horizontal deformation of the LRB which was, inherently, a burden in the stability problem contained in a small-sized LRB design. On the other hand, the OPT-2 design focuses on the shape factors rather than the isolation frequency.
2.1. Design Parameters
What starts with the design of the LRB is what will determine the design conditions. The first thing to be selected was to determine the design vertical load and the horizontal and vertical periods that you want to design, and design the LRB that satisfies this by setting the amount of deformation and the margin of deformation during an earthquake.
The basic design target items required for two types of LRB are listed as follows:
- -
- Design vertical load
- -
- Design isolation frequency
- -
- Vertical natural frequency
- -
- Yield load
- -
- Design horizontal deformation
- -
- Beyond design basis deformation
In this paper, the design vertical loads are selected to be 10 kN (1 t) for both types of LRB, OPT-1 and OPT-2.
2.1.1. Rubber Properties and Lead Plug Size
Table 1 presents the material properties of rubber and lead plug size used in this study. As shown in the Table 1, the same materials were used both for OPT-1 and OPT-2. The used rubber had a shear modulus of 0.3 MPa.
The used lead plug had a pure lead property with an apparent shear yield stress of 8.33 MPa. The diameters of the lead plug for OPT-1 and OPT-2, which were inserted in the center of LRB, were 20.0 mm and 21.5 mm, respectively.
2.1.2. Dimensions of LRB
The designed dimensional specifications of OPT-1 and OPT-2 are presents in Table 2. As shown in the Table 2, a single rubber plate thickness was the same as 2.5 mm but the outer diameter of OPT-1 was 76 mm, which was much smaller than that of OPT-2, 100 mm.
Figure 1 shows the design configurations and dimensions including the end plates, adapter flanges, and shield rubbers enclosing outer surface.
As is well known for shape factor definitions for LRB, the shape factors representing the stabilization of LRB depends on the rubber plate thickness (tR), number of rubber plates (nR), and outer diameter (do). These are expressed for a circular sectional type as follows [13];
The shape factor, S1 represents the ratio of the area of the rubber plate where the surface pressure acts and the free surface area where the rubber plate can deform under the vertical surface pressure action. The larger the free surface area of the rubber plate, i.e., the larger the thickness of the rubber plate, the greater the deformation on the free surface due to the surface pressure, resulting in a significant reduction in the thickness of the rubber plate. Since shape factor, S1, affects the P-delta effect, it was necessary to design a LRB to have an appropriate value. In general, since the rubber material does not change in volume when deformed, the thinner the thickness of one layer of the laminated rubber plate, the less the effect of reducing the absolute thickness of the rubber plate on the vertical surface pressure, thereby reducing the influence of the shape factor, S1. The shape factor, S2, represents the ratio of the diameter and the total rubber height. The larger value of S2 increases the stability for the vertical load and the horizontal deformation. Therefore, this factor affects the stability of LRB. The shape factors for the small-sized LRB applicable to the facility components of the nuclear power plants are recommended as follows [14]:
Shape factor, S1 ≥ 25 or Rubber plate thickness (tR) ≤ 3.0 mm
Shape factor, S2 ≥ 4
As shown in Table 2, the shape factor of S1 was 7.6 for OPT-1 and 9.9 for OPT-2. However, the rubber plate thickness was 2.5 mm and satisfies the recommended criteria in Equation (3). The shape of S2 was 4.4 for OPT-1 and 5.0 for OPT-2, and all met the recommended criteria in Equation (4).
2.1.3. Design Performance Characteristics
Table 3 presents the summary of the LRB design performance characteristics developed in this paper. As shown in the Table 3, the target seismic isolation frequencies were selected to be 2.0 Hz for OPT-1 and 2.3 Hz for OPT-2, in conjunction with the design weight of 1 ton.
The target design shear deformation was set to be 35 mm for both. This deformation value was equivalent to a shear strain of 200% for OPT-1 and 175% for OPT-2 design. To cover the beyond design basis earthquake, the beyond design basis shear deformation was defined to be 70 mm (two times design value) for both designs, which was equivalent to a shear strain of 400% for OPT-1 and 350% for OPT-2.
The vertical frequencies are 23.9 Hz for OPT-1 and 36.9 Hz for OPT-2, which were determined in the design process to minimize the P-delta effects [9].
2.1.4. Design Damping Value
In general, the design damping values were defined with the effective viscous damping ratio determined from the typical bi-linear hysteresis curve as shown in Figure 2. From the figure, the effective viscous damping ratio, ζd can be expressed as follows:
where W, Keff, and D indicates the area of energy dissipation per cycle (EDC) of load, effective horizontal shear stiffness, and design shear deformation, respectively.
Actually, because natural rubber material was used in this study, the damping of LRB was dominantly dependent on the size of the lead plug inserted into the center. Therefore, if we can define the EDC required for the seismic isolation, we can design the lead plug size producing the design damping value by Equation (5). To do this, it was necessary to define the characteristic strength (Qd), tangential stiffness (Kt), and elastic stiffness (Ke) in Figure 2 as design parameters.
2.2. General Design Procedures
Figure 3 presents the general design procedures of LRB used in this paper. As shown in the figure, the preliminary design was performed at first to check the tentatively defined design parameters applicable to the target component isolation. Actually, in design of the small-sized LRB needed for the component seismic isolation, the design for a single LRB must be carried out with consideration of the dimension and the weight of the target component, especially with LRB arrangement and maintenance in space.
When the target design parameters were defined, the effective shear stiffness required for LRB could be determined from the vertical load and the target seismic isolation frequency with one degree of freedom system. From the calculated effective shear stiffness and the tentatively defined characteristic strength of the lead plug, the lead size and the equivalent viscous damping ratio could be determined.
In this paper, LRB size was determined with the basis that the total rubber height is designed to be 100% shear strain. This design was basically to ensure the stability of the LRB. After checking the adequacy of shape factors, target damping value, and the fabricability of the LRB, especially of the rubber plate thickness and the lead plug, the final confirmation of the rubber plate thickness, number of layers, diameters of LRB and lead plug, and so on must be carried out with comparison to the target design parameters.
3. Simulations for Seismic Isolation Performance
To investigate the seismic isolation characteristics for the design of LRB, the simulations with one degree of freedom inertia mass model using bilinear LRB model presented in Table 4 were carried out. The input motions used in the simulations were two independent horizontal earthquakes (North-South (NS), East-West (EW)). Figure 4a presents the used displacement input time histories, which were treated with second order baseline correction, at the floor elevation amplified for the safe shutdown earthquake (SSE) = 0.3 g, which are actual design data generated artificially from the design floor response at the elevation of 41.8 m in the auxiliary building of APR1400 nuclear power plant. Figure 4b presents the response spectrum (5% damping) corresponding to the artificial time histories, which envelope the design response spectrum. As shown in the Figure, the ZPA (Zero Period Acceleration) is 1.0 g amplified from the ground design earthquake level of 0.3 g.
3.1. For Design Earthquake Level
Figure 5 reveals the hysteretic responses of the shear deformation versus the restoring force for the design earthquake level of SSE = 0.3 g in NS and EW directions. As shown in the figure, the maximum responses of the shear deformation were all within the design shear deformation range of 35 mm. Figure 6 reveals the comparison between the response spectrum and the input spectrum. In this result, there were no amplifications of the ZPA, and they were slightly lower than those of input motions. However, it can be seen that the response reduction effect by the frequency shift to the seismic isolation frequency, which was a typical advantage of the seismic isolation design, was not large across the frequency range and there were also no typical clear amplified responses near the design seismic isolation frequencies of 2.0 Hz for OPT-1 and 2.3 Hz for OPT-2. These might be typical characteristics of the LRB that a large initial stiffness due to the lead plug significantly affects the acceleration seismic response at lower level of the input earthquake.
Comparing the responses of OPT-1 and OPT-2, it can be seen that OPT-1 had a smaller acceleration response and larger displacement response than OPT-2. This means that the LRB design should be made to achieve the target acceleration response reduction while properly suppressing the increase in the displacement response.
3.2. For Beyond Design Earthquake Level
Figure 7 reveals the hysteretic responses of the shear deformation versus the restoring force for the beyond design earthquake level of SSE = 0.5 g in NS and EW directions. As shown in the Figure, the maximum responses of the shear deformation of OPT-1 were 73 mm for NS and 89 mm for EW direction, which exceeded the design level of 70 mm. On the other hand, OPT-2 were all within the design shear deformation range of 35 mm. Figure 8 reveals the comparison between the response spectrum and the input spectrum. In this result, we can see that the amplification of the acceleration responses typically occurred near the design seismic isolation frequencies and the seismic acceleration responses were significantly reduced due to the frequency shift effect. These results indicated that the tangential stiffness governs the LRB characteristics for a larger earthquake level and the seismic isolation performance was getting greater as the earthquake load increases.
4. Design Verifications by Tests
To verify the design specifications proposed in this paper as shown in Table 1, Table 2, Table 3 and Table 4, the quasi-static mechanical property tests and the ultimate deformation tests were carried out. Figure 9 presents the schematics of the test machine used in this paper.
In order to comply with the draft standards of the Korea Electric Power Industry Code (KEPIC) [14] for the LRB performance verification, three LRB prototypes were fabricated for each OPT-1 and OPT-2 design. Table 5 shows the test matrix applied to the shear deformation tests with 10 kN design vertical loads. As shown in the Table 5, tests were carried out for six deformation ranges for three prototypes of each LRB type. The used test speed for quasi-static tests was 1 mm/s for all test IDs. As the used rubber in this paper was the almost natural rubber with shear modulus of 0.3 MPa. Therefore, the investigation of a rate effect was excluded in this paper. Then, the constant velocity of 1mm/s, which was required for a quasi-static test, was used for all tests. To minimize the cycling effect inducing the temperature rising in rubber, all test IDs were done with a resting interval time enough to cool down the expected rising temperature in rubber. The wave form used in tests was a triangular type.
4.1. Effective Horizontal Stiffness
Figure 10 presents the test results of the shear deformations versus the restoring forces for all six prototypes, which were the selected data for third cycle among cyclic test data complying with the KEPIC draft standards. As shown in the figure, the hysteretic mechanical behavior was very consistent for each LRB prototype of OPT-1 and OPT-2. This means that the fabrications of the LRB prototypes can be confirmed enough to assure the qualifications.
The determination of the effective horizontal stiffness of the LRB from the test results is important for a design verification because it controls the seismic isolation frequency and the estimation of a damping value by Equation (5).
In general, from the test results of the shear deformation versus restoring force curve, the effective horizontal stiffness can be determined by the simple method connecting the two points of the restoring force corresponding to the design shear deformation and finding the slope value according to the ASCE standards as follows [10];
where Fmax and Fmin are the maximum and the minimum restoring forces, respectively, corresponding to the maximum and the minimum design shear deformation as shown in Figure 2. This method is simple and effective only when the curve of a tangential stiffness is linear enough to represent the typical bi-linear curve.
However, most LRBs reveal a nonlinear in the tangential stiffness curve as the shear deformation increases. In this case, the tangential stiffness can be determined according to the ISO standards as follows [11];
where F1, F2, F3, and F4 are the restoring forces corresponding to the half design shear deformation values of LRB as shown in Figure 11. This method is available with an assumption that the tangential stiffness curve is almost linear within the range of half design shear deformation.
Actually, the tangential stiffness curves of LRB are nonlinear throughout the range of the shear deformation as shown in Figure 10. In this case, it was not easy to apply the above two methods because specifically connecting two points may not represent the slope as a tangential stiffness. Therefore, the approach to average each instantaneous slope within the range of half design shear deformation was proposed in this paper to determine the tangential stiffness of LRB as follows;
where (−D/2 ≤ Di ≤ D/2).
In the above Equation, the symbol of U and L indicate the upper and the lower part of the hysteresis curve and n is the number of segment divided within the half design shear deformation range as shown in Figure 12. The tangential stiffness is obtained by averaging the instantaneous tangential stiffness calculated for n segments for each upper and lower curve.
For the test data of the design shear deformation range (±35 mm) shown in Figure 13, Table 6 presents the results of comparing the target design values with the tangential stiffness values determined by the two methods of Equations (7) and (8). As shown in the Table 6, we can see that the proposed method of Equation (8) gave more close results than the method of Equation (7), especially for OPT-1. This result indicates that when the tangential stiffness curve was nonlinear, as shown in Figure 13, which was the actual test curve. The tangential stiffness, determined based on the half-position values of the design shear deformation, was highly volatile and was unreasonable to be a representative tangential stiffness. On the other hand, the proposed method gave consistent results both for OPT-1 and OPT-2 which had a less than 10% design error. Figure 14 presents the test results of the tangential stiffness values according to the shear deformation range for all test matrix. As shown in the figures, the tangential stiffness significantly decreased as the shear deformation ranges increased, especially for OPT-1, which had less values of shape factors than the OPT-2 design.
Based on the tangential stiffness, the effective stiffness, Keff can be determined in a bilinear model as follows:
where Qd and D is the characteristic strength and the design shear deformation respectively. For the method using Equation (7), the characteristic strength, Qd can be determined as follows;
For the proposed method using Equation (8), the characteristic strength, Qd can be determined as follows;
where
Above in Equation (11), W indicates the area of the bilinear hysteretic model representing the EDC and Ke is the elastic stiffness. As expressed in the Equation, the characteristic strength in the bilinear model was determined to have the same area of the EDC with the predetermined tangential stiffness by Equation (8).
For the test data of the design shear deformation range (±35 mm) shown in Figure 13, Table 7 presents the results of comparing the target design values of the characteristic strength values, Qd, and the effective stiffness, Keff, with those determined by the two methods of Equations (10) and (11), and the determined effective stiffness by Equation (9).
As shown in Table 7, we can see that the proposed method gives more close and consistent results for both OPT-1 and OPT-2 types than the simple method of Equation (10). Figure 15 presents the test results of the effective horizontal stiffness characteristics for each shear deformation range. As shown in the figures, the effective stiffness significantly decreased as the shear deformation range increased. At the design shear deformation of 35 mm, we can see that all test results of the effective stiffness are in a good agreement with the target values both for OPT-1 and OPT-2.
4.2. Design Damping Values
As expressed in Equation (5) for the typical bilinear hysteresis curve, the equivalent viscous damping ratio of the LRB can be determined by the parameters of the determined effective stiffness value, the corresponding shear deformation value, and the EDC.
Table 8 presents the test results of the damping values at the design shear deformation range of ±35 mm (Test ID: OPT-#$-S4). As shown in the Table 8, we can see that the determined damping values are in a good agreement with the design target value of 28.6% for OPT-1 and 25.4% for OPT-2. Especially, it can be seen that the proposed method calculating with Equations (5), (9), and (11) gives much closer and more consistent estimations for both OPT-1 and OPT-2 than other methods.
Figure 16 presents the test results of the EDC and Figure 17 presents the determined equivalent viscous damping ratio of each test ID for all six prototypes. As shown in the Figures, the calculated damping values were so small at very low shear deformation regions compared with the design target value of 28.6% for OPT-1 and 25.4% for OPT-2. On the other hands, the design damping value was still maintained almost beyond the design shear deformation. This means that the proposed LRB specifications might be more effective for large earthquake loads than small earthquakes.
4.3. Design Seismic Isolation Frequencies
The seismic isolation frequency can be determined from the effective horizontal stiffness obtained by Equation (9) and the design vertical load of LRB defined in a design stage with an assumption of a single degree of freedom system.
Table 9 presents the test results of the seismic isolation frequency values at the design shear deformation range of ±35 mm (Test ID: OPT-#$-S4). As shown in the Table 9, we can see that the determined frequency values were in a good agreement with the design target value of 2.0 Hz for OPT-1 and 2.3 Hz for OPT-2. Especially, it can be seen that the proposed method gives much closer and more consistent estimations for both OPT-1 and OPT-2 than other methods.
Figure 18 presents the seismic isolation frequencies evaluated for each test ID with all six prototypes by using the proposed method in this paper. As shown in the figures, the seismic isolation frequency significantly decreased as the shear deformation increased. This is a typical characteristic of the LRB having a strong initial stiffness due to the lead. Therefore, we need to be careful to use the LRB for a seismic isolation design in range of small earthquakes. In fact, since the LRB exhibits almost bilinear hysteresis behavior, in case of small earthquake loads, the actual seismic isolation frequency shifts to higher region than the design target frequency because the initial elastic stiffness was stronger than the effective stiffness of the LRB dominates the seismic response.
On the other hand, in case of large earthquake loads, the actual seismic isolation frequency shifts to lower region than the design target frequency because the tangential stiffness less than the effective stiffness of the LRB dominates the seismic response. Therefore, it is required to check the amplifying of the acceleration response of the super structure in case of small earthquake input loads and the increasing shear deformation of the LRB in case of large earthquake input loads.
5. Ultimate Shear Deformation Tests
To assure the stability of the designed LRB for the extremely strong input earthquakes, the ultimate shear deformation tests were carried out. Table 10 presents the test matrices for OPT-1 and OPT-2 design. As shown in the Table 10, tests were performed with the vertical loads of 5 kN (half design load), 10 kN (design load), and 20 kN (two times design load) for the test ID of OPT-#A, OPT-#B, and OPT-#C, respectively.
Figure 19 presents the test results for the ultimate shear deformation with three type vertical loads as presented in the test matrix of Table 10. As shown in the figure, the ultimate shear deformations for the vertical design load of 10 kN were 98 mm for the OPT-1 and 120 mm for the OPT-2, which corresponded to the shear strain of 560% for the OPT-1 and 600% for OPT-2, respectively. Figure 20 shows the photos of actual deformation shapes at 400% and 600% shear strain for the OPT-2. Therefore, both OPT-1 and OPT-2 design sufficiently meet the design target shear strain limits of 400% for the OPT-1 and 350% for the OPT-2. In these test results, we can see that the OPT-2 design, which has better shape factors than the OPT-1 as shown in Table 2, reveals higher limit shear deformation value than that of the OPT-1 and gives insensitive shear deformation limits for all three types of vertical loads.
6. Conclusions
In this paper, the design specifications for two types of a small-sized lead inserted laminated rubber bearing for application to nuclear component seismic isolation were proposed and the main design performance parameters, such as an effective horizontal stiffness, equivalent viscous damping ratio value, design seismic isolation frequency, and ultimate shear deformation, were verified through quasi-static mechanical property tests.
Through the comparison of the design performance parameters determined by tests based on ASCE, ISO, and KEPIC(draft) standards, we can see that the ASCE and ISO standards are very simple, to use, to calculate the effective stiffness and damping value but gives inconsistent results when tangential stiffness curve is non-linear. In the design of LRB, the assurance of the design seismic isolation frequency of the LRB is very important. Therefore, the reliable evaluation method should be used in determining the LRB stiffness from test data. As one of methods, it was found that the proposed method (KEPIC draft standards) determining the effective horizontal stiffness and the equivalent damping value are reasonable even when the tangential stiffness curves in tests are not linear.
From seismic response simulations and the mechanical property test results for two types of a small-sized LRB design, it can be seen that the proposed LRB design procedures used in this paper gives an assurance to confirm the design performance parameters and the proposed design specifications are applicable to the facility components installed at any elevation in NPPs. To assure the developed LRB performance, the shaking table tests will be carried out in a near future.
Author Contributions
Conceptualization, G.-H.K., T.-M.S.; data curation, J.-Y.J., J.-Y.P.; writing—original draft preparation, G.-H.K.; writing—review and editing, J.-Y.J., J.-H.L., T.-M.S., J.P; project administration, G.-H.K.; funding acquisition, G.-H.K. All authors have read and agreed to the published version of the manuscript.
Funding
This study was funded by the Ministry of Trade, Industry and Energy through KETEP (Korea Institute of Energy Technology Evaluation Planning). (No. 20181510102380)
Acknowledgments
This study was supported by the Ministry of Trade, Industry and Energy through KETEP (Korea Institute of Energy Technology Evaluation Planning). (No. 20181510102380)
Conflicts of Interest
The authors declare no conflict of interest.
References
- De Domenico, D.; Gandelli, E.; Quaglini, V. Adaptive isolation system combining low-friction sliding pendulum bearings and SMA-based gap dampers. Eng. Struct. 2020, 212, 110536. [Google Scholar] [CrossRef]
- Wongprasert, N.; Symans, M.D. Experimental evaluation of adaptive elastomeric base-isolated structures using variable-orifice fluid dampers. J. Struct. Eng. 2005, 131, 867–877. [Google Scholar] [CrossRef]
- De Domenico, D.; Gandelli, E.; Quaglini, V. Effective base isolation combining low-friction curved surface sliders and hysteretic gap dampers. Soil Dyn. Earthq. Eng. 2020, 130, 105989. [Google Scholar] [CrossRef]
- Labbe, P. Pioneering Actual use of Seismic Isolation for Nuclear Facilities. In Proceedings of the 1st Kashiwasaki International Symposium on Seismic Safety of Nuclear Installation, Kashiwasaki, Niigata, Japan, 26 November 2010. [Google Scholar]
- Germane, L. Seismic Isolation of the Jules Horowitz Reactor. In Proceedings of the 1st Kashiwasaki International Symposium on Seismic Safety of Nuclear Installation, Kashiwasaki, Niigata, Japan, 26 November 2010. [Google Scholar]
- Tajirian, F.F.; Schrag, M.R. Conceptual design of seismic isolation for the PRISM liquid metal reactor. In Proceedings of the Transactions of the 9th International Conference on Structural Mechanics in Reactor Technology, Lausanne, Switzerland, 17 August 1987; pp. 705–710. [Google Scholar]
- Forni, M.; Poggianti, A.; Dusi, A. Seismic Isolation of Nuclear Power Plants. In Proceedings of the 15 WCEE, Lisbon, Portugal, 24–28 September 2012. [Google Scholar]
- Okamura, S.; Kamishima, Y.; Negishi, K.; Sakamoto, Y.; Kitamura, S.; Kotake, S. Seismic isolation design for JSFR. J. Nucl. Sci. Technol. 2011, 48, 688–692. [Google Scholar] [CrossRef]
- Koo, G.H.; Lee, J.H.; Yoo, B. Mechanical characteristics of laminated rubber bearings for seismic isolation (in Korean). Earthq. Eng. Soc. Korea 1997, 1, 79–89. [Google Scholar]
- Seismic Analysis of Safety-Related Nuclear Structures; ASCE/SEI 4-16; American Society of Civil Engineers: Reston, VA, USA, 2017. [CrossRef]
- Elastomeric Seismic-Protection Isolators-Part 1: Test Methods; ISO 22762-1; International Organization for Standardization: Geneva, Switzerland, 2018.
- Koo, G.H.; Lee, J.H.; Yoo, B.; Ohtori, Y. Evaluation of laminated rubber bearings for seismic isolation using modified macro-model with parameter equations of instantaneous apparent shear modulus. Eng. Struct. 1999, 21, 594–602. [Google Scholar] [CrossRef]
- Recommendation for the Design of Base Isolated Buildings; Architectural Institute of Japan: Tokyo, Japan, 1993.
- Seismic Isolation Guideline for Nuclear Facilities using LRB (Laminated Rubber Bearing): Draft-Rev 7; Korea Electric Power Industry Code: Seoul, Korea, 2018.
Figure 1.
Dimensions and configurations of the proposed LRB: (a) OPT-1; (b) OPT-2.

Figure 2.
Concept of bilinear model of LRB.

Figure 3.
General procedures of LRB design.
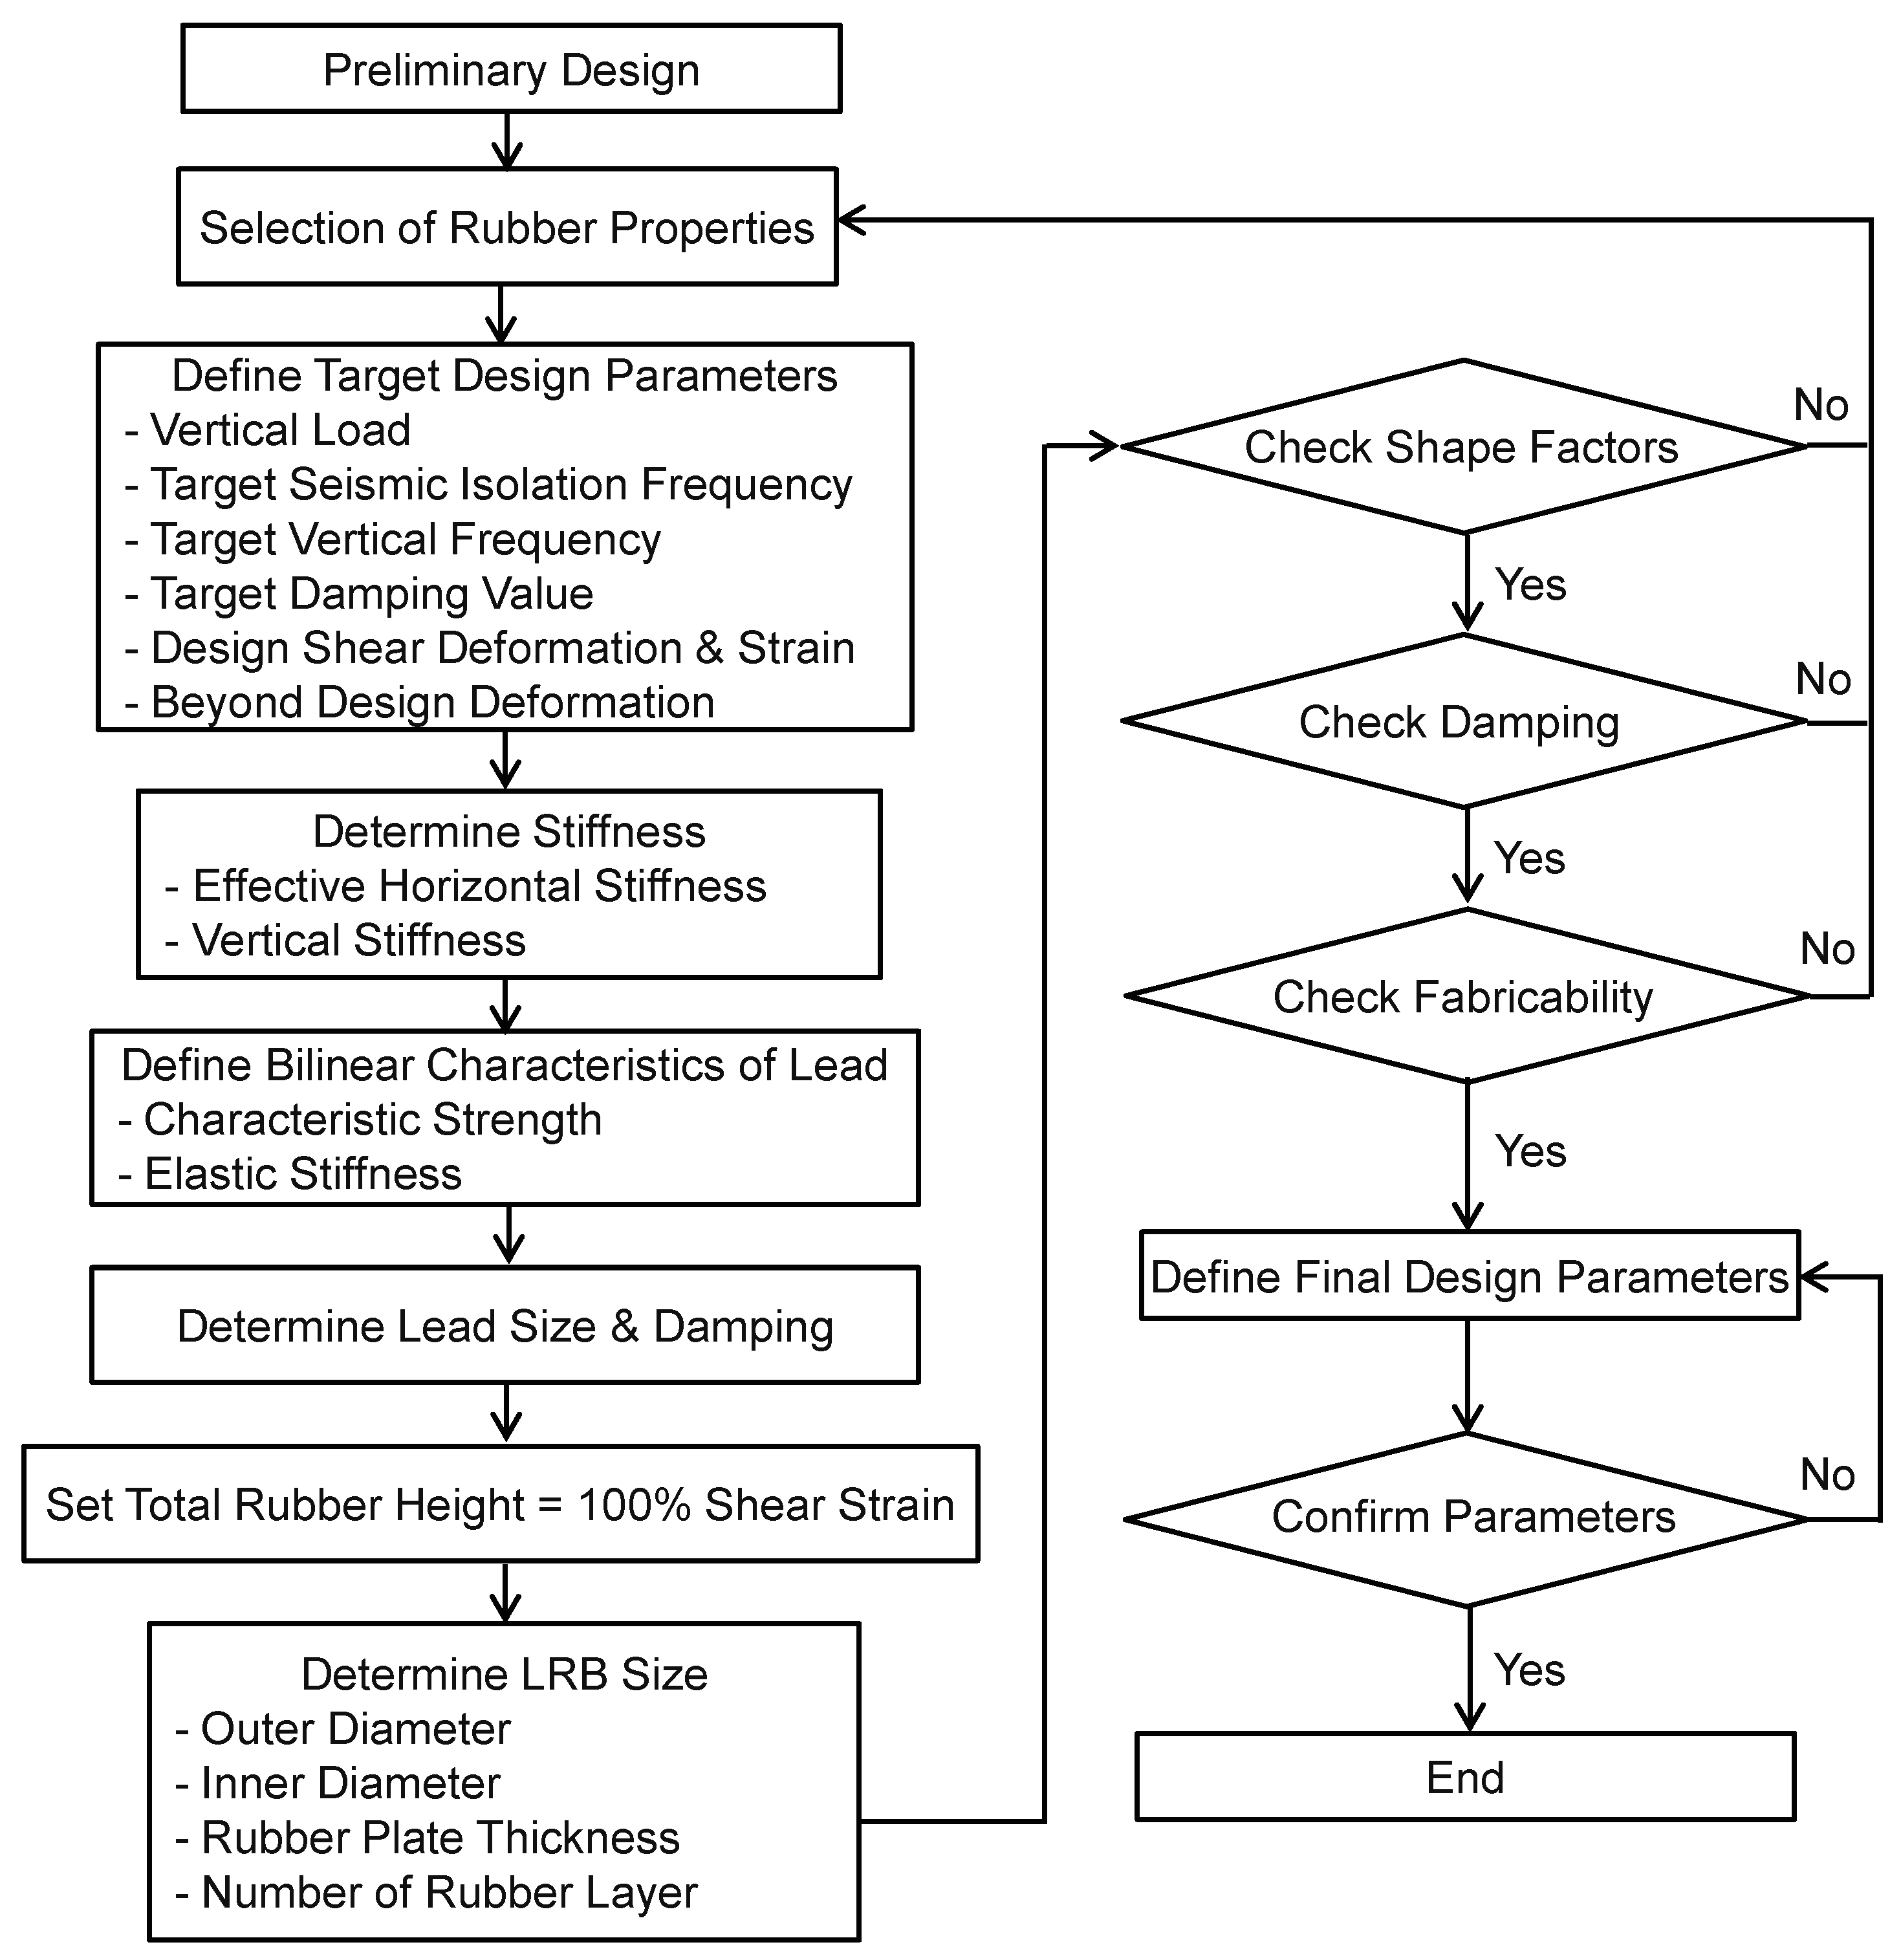
Figure 4.
Used seismic input motion PGA (Peak Ground Acceleration) = 0.3 g: (a) displacement; (b) floor response spectrum.
Figure 4.
Used seismic input motion PGA (Peak Ground Acceleration) = 0.3 g: (a) displacement; (b) floor response spectrum.

Figure 5.
Hysteresis responses for PGA = 0.3 g: (a) OPT-1 (EW); (b) OPT-2 (EW); (c) OPT-1 (NS); and (d) OPT-2 (NS).
Figure 5.
Hysteresis responses for PGA = 0.3 g: (a) OPT-1 (EW); (b) OPT-2 (EW); (c) OPT-1 (NS); and (d) OPT-2 (NS).

Figure 6.
Response spectrum for PGA = 0.3 g: (a) EW direction; (b) NS direction.

Figure 7.
Hysteresis responses for PGA = 0.5g: (a) OPT-1 (EW); (b) OPT-2 (EW); (c) OPT-1 (NS); and (d) OPT-2 (NS).
Figure 7.
Hysteresis responses for PGA = 0.5g: (a) OPT-1 (EW); (b) OPT-2 (EW); (c) OPT-1 (NS); and (d) OPT-2 (NS).

Figure 8.
Response spectrum for PGA = 0.5g: (a) EW direction; (b) NS direction.

Figure 9.
Schematics of quasi-static test facility.

Figure 10.
Test results of hysteretic characteristics for all test matrix: (a) OPT-1A; (b) OPT-1B; (c) OPT-1C; (d) OPT-2A; (e) OPT-2B; and (f) OPT-2C.
Figure 10.
Test results of hysteretic characteristics for all test matrix: (a) OPT-1A; (b) OPT-1B; (c) OPT-1C; (d) OPT-2A; (e) OPT-2B; and (f) OPT-2C.

Figure 11.
Illustration of the ASCE method for determination of tangential stiffness and characteristic strength.
Figure 11.
Illustration of the ASCE method for determination of tangential stiffness and characteristic strength.

Figure 12.
Illustration of the proposed method for determination of tangential stiffness and effective stiffness.
Figure 12.
Illustration of the proposed method for determination of tangential stiffness and effective stiffness.

Figure 13.
Test results for design shear deformation range (±35 mm): (a) OPT-1; (b) OPT-2.

Figure 14.
Determined tangential stiffness from test data: (a) OPT-1; (b) OPT-2.

Figure 15.
Determined effective horizontal stiffness from test data: (a) OPT-1; (b) OPT-2.

Figure 16.
Test results for energy dissipated per cycle (EDC): (a) OPT-1; (b) OPT-2.

Figure 17.
Determined equivalent viscous damping ratio: (a) OPT-1; (b) OPT-2.

Figure 18.
Determined horizontal seismic isolation frequency: (a) OPT-1; (b) OPT-2.

Figure 19.
Test results for ultimate shear deformation: (a) OPT-1; (b) OPT-2.

Figure 20.
Photos of shear deformation for OPT-2: (a) 400%; (b) 600%.


Table 1.
Rubber properties and lead size.
| Properties | OPT-1 | OPT-2 | |
|---|---|---|---|
| Rubber Properties | Shear Modulus (MPa) | 0.3 | 0.3 |
| Young’s Modulus (MPa) | 0.9 | 0.9 | |
| Bulk Modulus (GPa) | 1.96 | 1.96 | |
| Hardness Factor | 0.85 | 0.85 | |
| Lead Properties and Size | Apparent Shear Yield Stress (MPa) | 8.33 | 8.33 |
| Sectional Area (mm2) | 3.0 × 10⁻⁴ | 3.6 × 10⁻⁴ | |
| Diameter (mm) | 20 | 21.5 | |
Table 2.
Dimensional specifications of laminated rubber bearing (LRB) and shape factors.
| Specifications | OPT-1 | OPT-2 |
|---|---|---|
| Outer Diameter, do (mm) | 76 | 100 |
| Inner Diameter, di (mm) | 20 | 21.5 |
| Rubber Plate Thickness, tR (mm) | 2.5 | 2.5 |
| Number of Rubber Layer, nR | 7 | 8 |
| Total Rubber Height, TR (mm) | 17.5 | 20 |
| Steel Plate Thickness, tS (mm) | 2.0 | 2.0 |
| Total LRB Height, T (mm) | 29.5 | 34.0 |
| Shape Factor, S1 | 7.6 | 9.9 |
| Shape Factor, S2 | 4.4 | 5.0 |
Table 3.
Design performance characteristics.
| Parameters | OPT-1 | OPT-2 |
|---|---|---|
| Design Vertical Load, Pd (kN) | 10 | 10 |
| Horizontal Stiffness, Keff (kN/m) | 158 | 208.6 |
| Vertical Stiffness, Kv (MN/m) | 22.5 | 53.8 |
| Horizontal Seismic Isolation Frequency (Hz) | 2.0 | 2.3 |
| Vertical Frequency (Hz) | 23.9 | 36.9 |
| Design Shear Deformation, D (mm) | 35 | 35 |
| Design Shear Strain (%) | 200 | 175 |
| Beyond Design Shear Deformation (mm) | 70 | 70 |
| Beyond Design Shear Strain (%) | 400 | 350 |
Table 4.
Design bilinear characteristics and damping values.
| Parameters | OPT-1 | OPT-2 |
|---|---|---|
| Elastic Stiffness, Ke (MN/m) | 10 | 3 |
| Tangential Stiffness, Kt (kN/m) | 86.325 | 122.915 |
| Characteristic Strength, Qd (kN) | 2.5 | 3.0 |
| Equivalent Viscous Damping Ratio, ζd (%) | 28.6 | 25.4 |
Table 5.
Test matrix for shear deformation test.
| Test ID | Shear Deformation (mm) | |
|---|---|---|
| OPT-#$-S1 | ±0.05 Dd | 1.8 |
| OPT-#$-S2 | ±0.20 Dd | 7.0 |
| OPT-#$-S3 | ±0.50 Dd | 17.5 |
| OPT-#$-S4 | ±1.00 Dd | 35.0 |
| OPT-#$-S5 | ±1.50 Dd | 52.5 |
| OPT-#$-S6 | ±2.00 Dd | 70.0 |
Note: (# = 1, 2: LRB type); ($ = A, B, C: Prototypes); and Dd = 35 mm.
Table 6.
Results of tangential stiffness (D = ±35 mm).
| Test ID | ISO | Proposed | Design | ||
|---|---|---|---|---|---|
| Kt (kN/mm) | Error (%) | Kt (kN/mm) | Error (%) | Kt (kN/mm) | |
| OPT-1A-S4 | 0.076 | 11.628 | 0.080 | 7.169 | 0.086 |
| OPT-1B-S4 | 0.079 | 8.140 | 0.082 | 4.091 | 0.086 |
| OPT-1C-S4 | 0.080 | 6.977 | 0.083 | 2.933 | 0.086 |
| OPT-2A-S4 | 0.124 | 0.813 | 0.125 | 1.849 | 0.123 |
| OPT-2B-S4 | 0.122 | 0.813 | 0.122 | 0.567 | 0.123 |
| OPT-2C-S4 | 0.117 | 4.878 | 0.119 | 3.596 | 0.123 |
Table 7.
Results of characteristic strength and effective stiffness (D = ±35mm).
| Test ID | Qd (kN) | Keff (kN/mm) | |||||
|---|---|---|---|---|---|---|---|
| ISO | Proposed | Design | ASCE | ISO | Proposed | Design | |
| OPT-1A-S4 | 2.937 | 2.633 | 2.500 | 0.130 | 0.160 | 0.155 | 0.158 |
| OPT-1B-S4 | 3.091 | 2.883 | 2.500 | 0.139 | 0.167 | 0.165 | 0.158 |
| OPT-1C-S4 | 3.026 | 2.786 | 2.500 | 0.130 | 0.166 | 0.163 | 0.158 |
| OPT-2A-S4 | 2.937 | 2.762 | 3.000 | 0.180 | 0.208 | 0.204 | 0.209 |
| OPT-2B-S4 | 3.031 | 2.700 | 3.000 | 0.185 | 0.209 | 0.199 | 0.209 |
| OPT-2C-S4 | 2.961 | 2.691 | 3.000 | 0.185 | 0.202 | 0.195 | 0.209 |
Table 8.
Results of equivalent viscous damping ratio (D = ±35 mm).
| Test ID | EDC (kN⋅mm) | Damping (%) | |||
|---|---|---|---|---|---|
| TESTS | ASCE | ISO | Proposed | Design | |
| OPT-1A-S4 | 365.841 | 36.557 | 29.7 | 30.7 | 28.6 |
| OPT-1B-S4 | 400.223 | 37.511 | 31.1 | 31.6 | 28.6 |
| OPT-1C-S4 | 386.947 | 38.699 | 30.2 | 30.8 | 28.6 |
| OPT-2A-S4 | 376.071 | 27.138 | 23.5 | 23.9 | 25.4 |
| OPT-2B-S4 | 367.896 | 25.851 | 22.9 | 24.0 | 25.4 |
| OPT-2C-S4 | 366.663 | 25.787 | 23.6 | 24.4 | 25.4 |
Table 9.
Results of seismic isolation frequency (D = ±35 mm).
| Test ID | Isolation Frequency (Hz) | |||
|---|---|---|---|---|
| ASCE | ISO | Proposed | Design | |
| OPT-1A-S4 | 1.82 | 2.01 | 1.98 | 2.0 |
| OPT-1B-S4 | 1.88 | 2.06 | 2.04 | 2.0 |
| OPT-1C-S4 | 1.82 | 2.05 | 2.03 | 2.0 |
| OPT-2A-S4 | 2.14 | 2.30 | 2.28 | 2.3 |
| OPT-2B-S4 | 2.17 | 2.30 | 2.25 | 2.3 |
| OPT-2C-S4 | 2.16 | 2.26 | 2.23 | 2.3 |
Table 10.
Test matrix for ultimate shear deformation test.
| Test ID | Vertical Loads (kN) | Shear Deformation (mm) | |||
|---|---|---|---|---|---|
| OPT-#A-U@ | 0.5 Pd | 5.0 | @ | 1 | ±4.00 TR |
| 2 | ±5.00 TR | ||||
| OPT-#B-U@ | 1.0 Pd | 10.0 | |||
| 3 | ±6.00 TR | ||||
| OPT-#C-U@ | 2.0 Pd | 20.0 | |||
| 4 | ±7.00 TR | ||||
Note: (# = 1, 2); Pd = 10 kN; TR = 17.5 mm for OPT-1, 20 mm for OPT-2.
© 2020 by the authors. Licensee MDPI, Basel, Switzerland. This article is an open access article distributed under the terms and conditions of the Creative Commons Attribution (CC BY) license (http://creativecommons.org/licenses/by/4.0/).
Share and Cite
MDPI and ACS Style
Koo, G.-H.; Jung, J.-Y.; Lee, J.-H.; Shin, T.-M.; Park, J.-Y. Development of Small-Sized Lead Inserted Laminated Rubber Bearing for Nuclear Component Seismic Isolation. Energies 2020, 13, 3193. https://doi.org/10.3390/en13123193
AMA Style
Koo G-H, Jung J-Y, Lee J-H, Shin T-M, Park J-Y. Development of Small-Sized Lead Inserted Laminated Rubber Bearing for Nuclear Component Seismic Isolation. Energies. 2020; 13(12):3193. https://doi.org/10.3390/en13123193
Chicago/Turabian StyleKoo, Gyeong-Hoi, Jin-Young Jung, Jin-Hyeong Lee, Tae-Myung Shin, and Jin-Young Park. 2020. "Development of Small-Sized Lead Inserted Laminated Rubber Bearing for Nuclear Component Seismic Isolation" Energies 13, no. 12: 3193. https://doi.org/10.3390/en13123193
Note that from the first issue of 2016, this journal uses article numbers instead of page numbers. See further details here.