Article

Verification of Utility-Scale Solar Photovoltaic Plant Models for Dynamic Studies of Transmission Networks

1
The Andrew and Erna Viterbi Faculty of Electrical Engineering, Technion—Israel Institute of Technology, Haifa 3200003, Israel
2
Israel Electric Corporation and the Department of Electrical Engineering, Ariel University, Ariel 40700, Israel
3
First Solar, Inc., Tempe, AZ 85281, USA
4
Department of Software Science, Tallinn University of Technology, Akadeemia tee 15a, 12618 Tallinn, Estonia
*
Author to whom correspondence should be addressed.
Energies 2020, 13(12), 3191; https://doi.org/10.3390/en13123191
Submission received: 13 May 2020 / Revised: 10 June 2020 / Accepted: 17 June 2020 / Published: 19 June 2020

Abstract

:
In recent years, there has been a growing need for accurate models that describe the dynamics of renewable energy sources, especially photovoltaic sources and wind turbines. In light of this gap, this work focuses on the validation of standard dynamic models developed by the Western Electricity Coordinating Council (WECC), using actual measurements from the Western Texas and Southern California transmission networks. The tests are based on the North American Electric Reliability Corporation compliance standards and include dynamic stability tests for volt-varcontrol and primary frequency response. Through an extensive set of field tests, we show that the WECC generic models can be used to simulate real dynamic phenomena in large-scale solar photovoltaic power plants, and we propose guidelines for correct usage of these models. The results show that the WECC models are especially accurate when the photovoltaic system is connected with a low impedance to the main network. We also show that the tested WECC models successfully predict the frequency response of an actual grid event that occurred in the Electric Reliability Council of Texas and which resulted in a loss of nearly 1.365 GW. This result supports the use of these models in the study of large-scale dynamic phenomena that include renewable energy sources.

1. Introduction

In recent years, the integration of renewable energy sources into power grids may lead to frequency instability and undesired transients [1,2,3,4]. A central challenge is to regulate the grid’s frequency under high penetration levels of renewable sources. In large interconnected areas, such as the Continental European system, many efforts have been made by ENTSO-E (European Network of Transmission System Operators for Electricity) to deal with stability problems [5]. In addition, control methods that promote stability are recently being implemented in isolated systems [6].
In this light, there is a growing need for accurate models that describe the behavior of renewable energy sources, especially photovoltaic (PV) sources and wind turbines. Such models have been recently recognized to be crucial for the planning and operation of modern grids [7,8,9,10]. Due to this need, several entities like the Western Electricity Coordinating Council (WECC) in the U.S. and the International Electro-technical Commission (IEC) in Europe have been developing generic dynamic models for wind and solar PV. For example, Ellis et al. [11] reported a generic model for a PV system, which was defined and developed by WECC. In [12], a report written by the Electric Power Research Institute (EPRI) suggested generic and public models for renewable energy systems. In addition, the work in [13] investigated the compatibility of IEC and WECC wind turbine models, and the work in [14] presented models of battery energy storage systems alongside specific applications.
Models for solar PV are typically represented by algebraic and differential equations and have been implemented in commercially available software such as PLSF [15], PSSE [16], PowerWorld [17], and PowerFactory [18]. In most cases, including this work, these models are based on the fundamental positive-sequence in the time domain [19,20], but in some cases, electromagnetic transient simulations (EMT) are also used [21,22].
Since WECC models for renewable plants have become commonly used in the last few years, several works focus on validation of these models. For example, some of the works are dedicated to wind turbine power plants such as [23], which showed how to use WECC models of wind turbine power plants to study large-scale power systems. This study also demonstrated that the IEC and WECC models may successfully simulate the primary frequency response of wind power plants. The verification of the primary frequency response modeling was done by comparing simulation results to measured wind power plant response for frequency events. Furthermore, the paper [24] presented field tests designed to validate standard generic stability and power flow models for several large wind power plants. Recently, the work [25] explored WECC wind-turbine models within the Spanish grid. Other works are devoted to validation of WECC models for PV power plants. As an example, work [26] focused on model validation during and shortly after a fault. The simulation results, simulated with PSS/E, showed that the generic model successfully reproduced the measured values immediately after the fault. Another example is [27], which used DIgSILENT PowerFactory to validate the WECC generic PV system models, focusing on large-scale PV plants connected to the distribution or transmission networks. The implemented PV models were tested and validated against the EPRI tool, which represents the WECC specifications. Recently, work [28] used the DIgSILENT tool to analyze control methods of PV systems on the IEEE voltage stability test system for improving short-term voltage stability. All the mentioned works, alongside our proposed paper, are summarized in Table 1.
In this work, we focus on the validation of the standard WECC dynamic PV system models, using actual measurements from the Western Texas and Southern California transmission networks. The results of the model are evaluated based on the North American Electric Reliability Corporation (NERC) compliance standards [29]. Through an extensive set of field tests, we show that the WECC generic models can be used to simulate real dynamic phenomena in large-scale solar PV power plants and propose guidelines for correct usage of these models. The reported tests are conducted on different solar PV plants in coordination with the plant owners and the transmission system operators. The tests are based on the NERC compliance standards and include dynamic stability tests for volt-var control and primary frequency response. We compare the simulation results to real measured data and show that the average normalized mean square error is 0.4% and the average normalized maximum error is smaller than 7.5%. Based on these comparisons, we show that the WECC models are especially accurate when the photovoltaic system is connected with a low impedance to the main network and that they successfully predict the frequency dynamics following a large disturbance. However, we show that these standard models cannot simulate fast transients, for instance transients that may appear following capacitor switching.
The paper is organized as follows. Section 2 outlines the evolution of solar PV plant dynamic models in the WECC. Section 3 introduces the method we used for verification, and Section 4 and Section 5 demonstrate the capabilities of the WECC models. Section 6 concludes the paper.

2. Models for Solar PV: Outline

2.1. WECC Generic Model Development: Overview

In this section, we review the roadmap that has led to the development of generic positive sequence models for PV sources. Historically, the development of generic models had been stalled for a long time due to non-negotiable proprietary information held by the manufacturers. As a result, the WECC Renewable Energy Modeling Task Force (REMTF) took the initiative to develop generic models that are free from proprietary information and adequately represent the typical dynamics and steady-state behavior of PV inverters [11,23]. Today, these generic models are implemented in commercial software platforms such as General Electric GE-PSLF® [15,30], Siemens PTI PSSE® [16], PowerWorld simulator, and PowerTech Labs TSAT [17]. For compatibility reasons, throughout this paper, we use the terms “converter” and “inverter” interchangeably.

2.2. Plant Load Flow Modeling

One of the first models of PV plants is the so-called “aggregated model”, which includes N identical inverters connected in parallel [31]. Such a model is shown in Figure 1. The PV plant shown on the right is connected to the grid through a step-up transformer, optionally including a shunt compensation device. The main limitation of such a model is the assumption that all inverters are the same. However, due to their simplicity, such models are still being used.

2.3. First-Generation Solar PV Plant Models

In order to improve upon these first models, the WECC Renewable Energy Modeling Task Force has developed generic solar PV plants models. The first-generation of these models and the associated control models mainly represented General-Electric’s converters for wind and solar applications. These models, which were fully explained in [30], include two sub-models: (a) generator converter model (“PV1g”) and (b) converter electrical control model (PV1e). The main task of the PV1g sub-model is to interface the power source to the external network, and a block diagram is shown in Figure 2. This model is based on algebraic controlled current source that injects active and reactive currents into the external network. The active and reactive current commands are taken from the electric control block. Three limiters are used to bound the command signal under abnormal conditions, e.g., voltage rise or drop. The main task of the PVe1 sub-model is to generate the real and reactive current commands, and a block diagram is shown in Figure 3.

2.4. Second-Generation Solar PV Plant Models

The second-generation solar PV models evolved naturally from the first-generation models and are based on recommendations and feedback from major inverter vendors, transmission planners, developers, and others [11]. The models consist of three separate sub-models, as shown in Figure 4.

2.4.1. Renewable Plant Controller Model

This is a supervisory controller that monitors the voltage and frequency at the point of interconnection (POI) and communicates active and reactive power commands to the electric controller [11]. The block diagram for the REPC-A model is shown in Figure 5. It includes two independent feedback loops: Volt/VAR control, which generates the signal Q e x t , and the primary frequency control, which generates the signal P r e f . Both variables serve as input commands for the inverter electrical controller. The Volt/VAR controller can be operated in either voltage control mode or constant Q-control mode, by appropriately setting “RefFlag”. A frequency droop controller can be activated in case of both over- and under-frequency conditions by assigning proper droop values to D u p and D d n .

2.4.2. Renewable Electrical Controller Model

The REEC-A’s main task is to generate the real and reactive current commands [12], as shown in Figure 6. There are several other versions of REEC, such as the REEC-B model, which is no longer recommended after the release of the latest NERC recommendations [29], and the REEC-C model, which describes battery energy storage systems [32]. The REEC-A model is divided into three subsystems: active/reactive power control subsystems and the current limit logic subsystem.

2.4.3. Renewable Generator Converter Model

This subsystem interfaces the power source to the external network [11], as shown in Figure 7. Currently, there is only one version of this model, which is similar to the first-generation model (PV1g). The REGC model is not designed for studying PV plants that are connected to weak grids with low short-circuit ratios (e.g., SCR < 3.5). As explained in [33], such usage of this model may lead to numeric instability. In this paper, we mainly test this subsystem in relatively strong grids with SCR > 4.

3. Dynamic Model Verification: Methodology

The WECC second generation solar PV plant generic models were validated in this work based on actual field tests. The tests were performed in large utility PV plants connected to the transmission network in Western Texas and Southern California. The measurements were compared to PSS/E simulation data, in order to learn the relative advantages and disadvantages of these generic models. The measurements were taken from either high-speed power system monitoring devices such as phasor measurement units, digital fault recorders, or slower second-level resolution SCADA systems. The facility model parameters were provided by the equipment manufacturers and can be found in [12].
The tests were designed in accordance with NERC standards [34] and focused on dynamic phenomena [35,36]. The most commonly used test is the “staged test” [24,37,
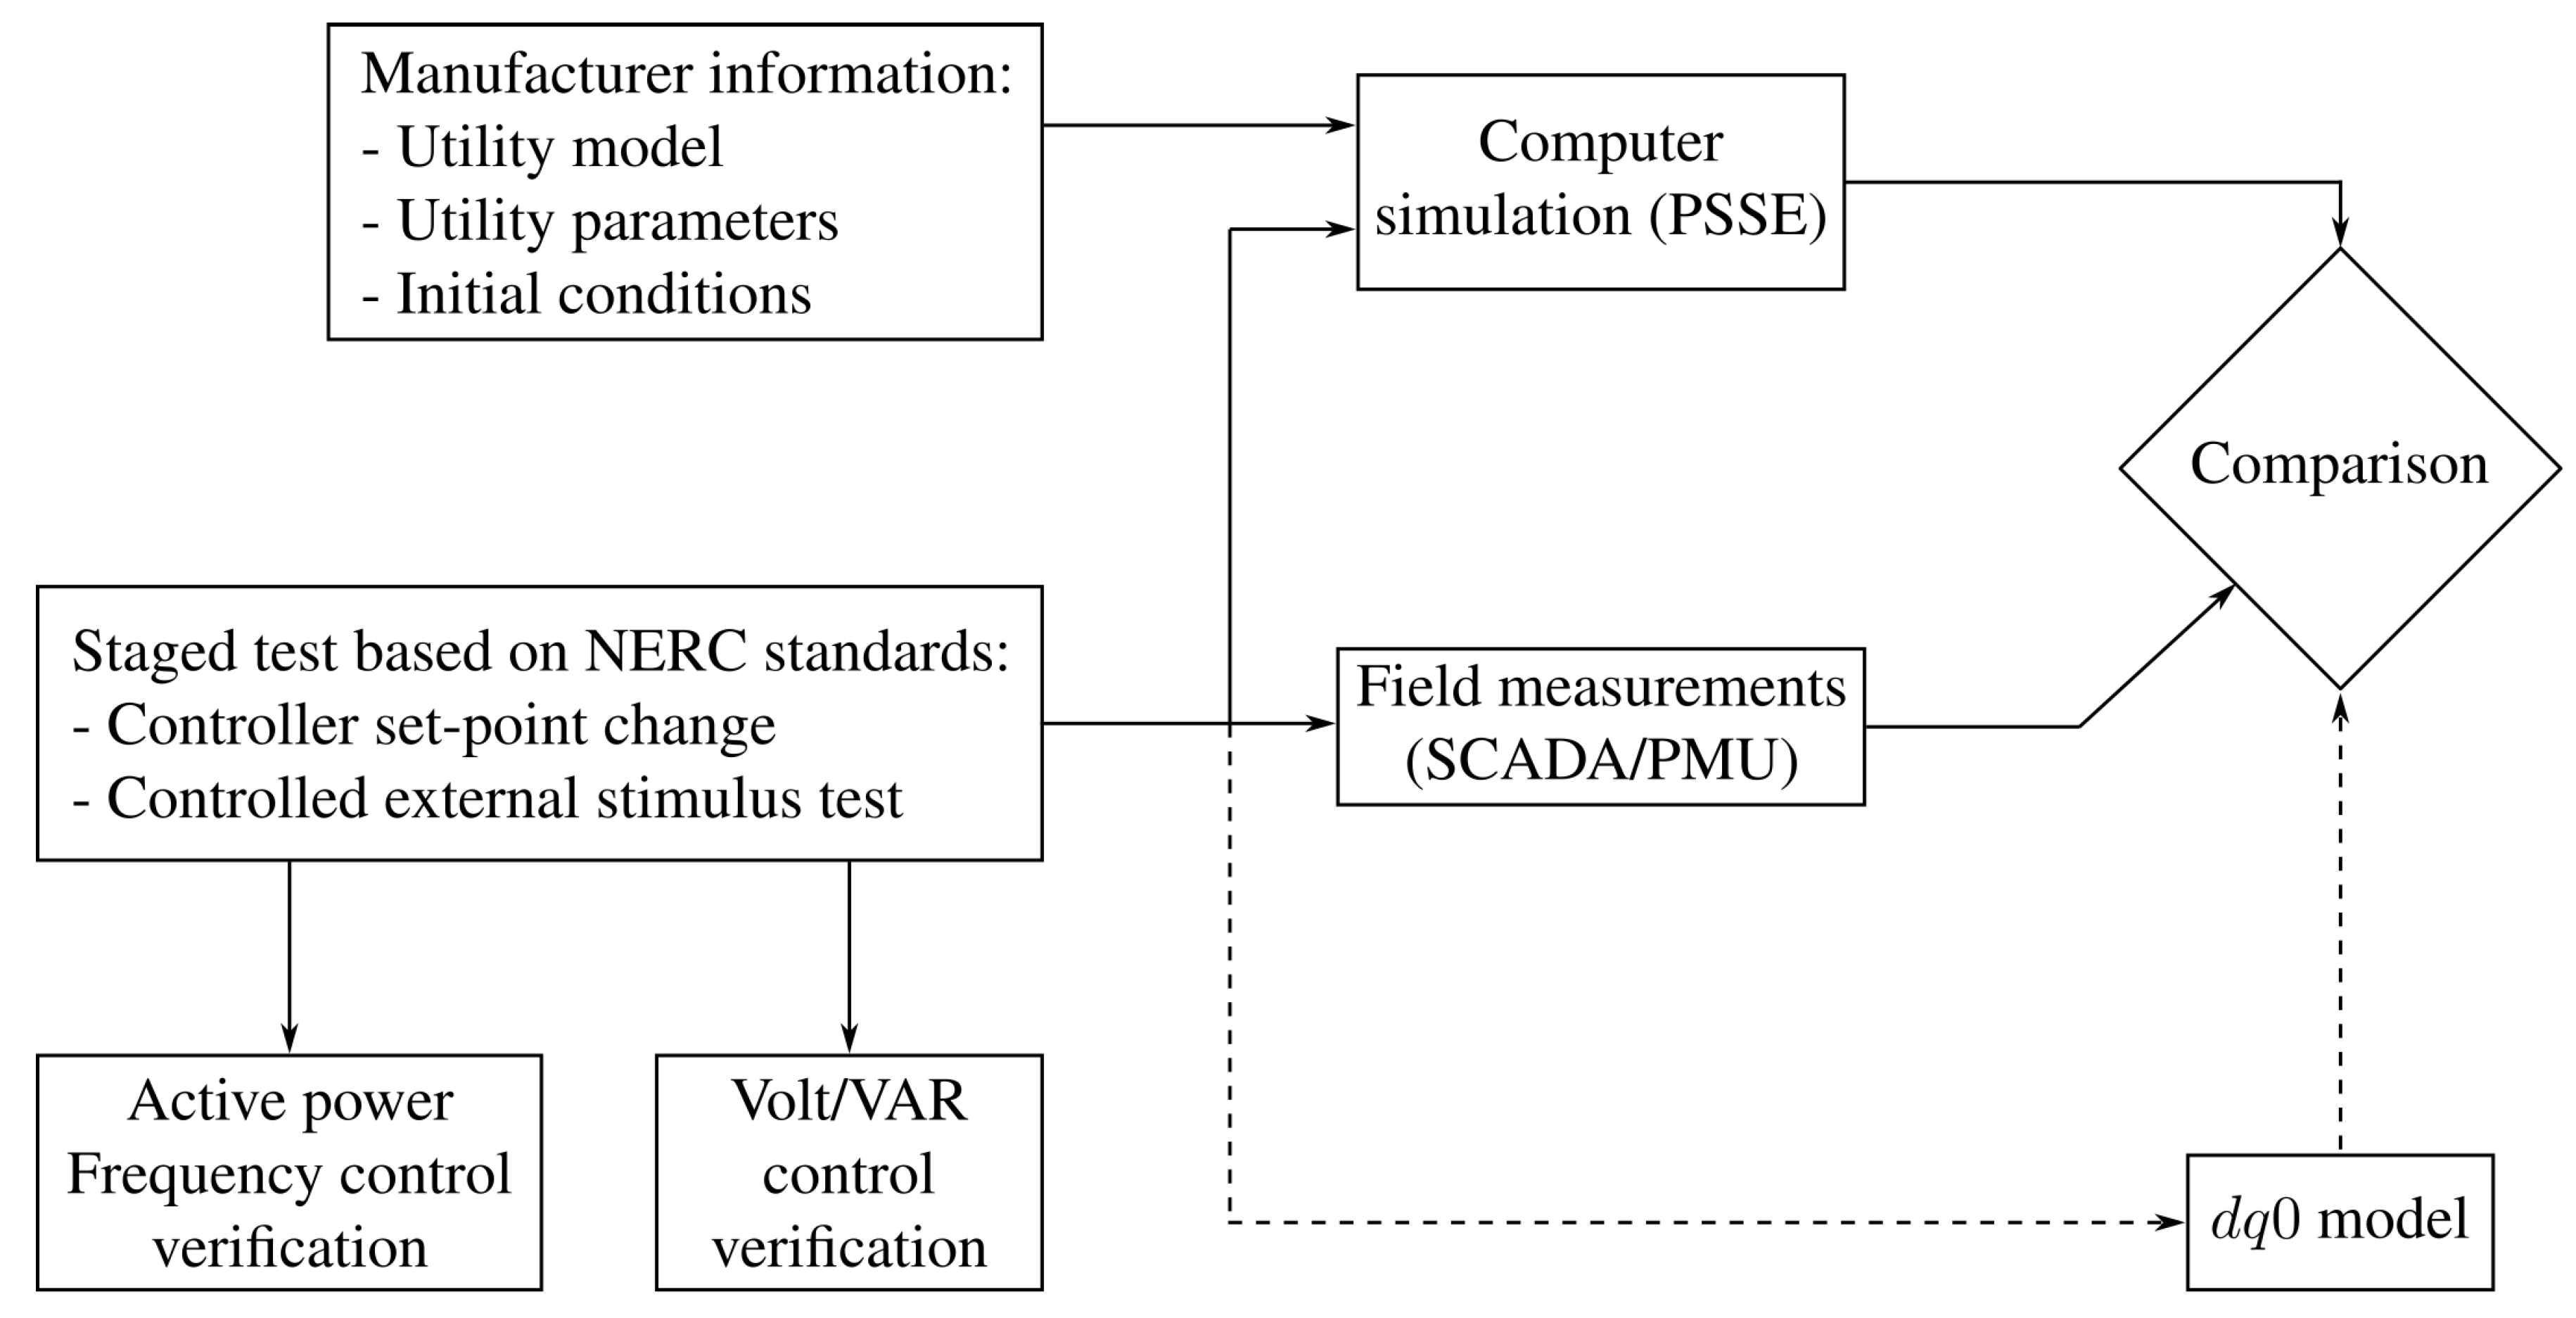
38], which is used extensively for dynamic model verification due to its simplicity and easy customization of the testing procedures. It should be noted that the purpose of the test was to validate the dynamic performance of an entire plant, not just a single inverter unit. The plant was connected and synchronized to the grid during the entire test. A flowchart that shows the overall process of the validation methodology is presented in Figure 8. First, computer simulation based on the manufacturer information was designed in PSSE. Then, different “staged tests” were configured for both simulation and measured data. Finally, a comparison between the simulations results and field measurements was done. In addition, several tests included a comparison to a d q 0 model, which was used to describe fast dynamic behavior and rapid amplitude and phase variations. A detailed review of simulation techniques based on d q 0 transformation can be found in [39,40]. Here, the d q 0 simulation was attained using MATLAB with the d q 0 toolbox [41].

Evaluation Metrics

In order to compare the simulation results to the measured data, we used two familiar measures: the normalized mean squared error (NMSE) and the normalized maximum estimation error (NMEE). The first measure (NMSE) is defined as:
NMSE = 1 n i n y i ^ f i ^ 2 ,
where y i ^ is the normalized real measured data vector and f i ^ is the normalized simulated model vector. Both vectors are normalized with respect to their maximum values. The second measure (NMEE) is defined as the maximal difference between the normalized real measured data vector and the normalized simulated model vector:
NMEE = max | y i ^ f i ^ | .
In addition, the standard error was calculated for measurements’ uncertainty to make sure that the influence on accuracy was minimal. The standard error function is defined as:
SE = s N ,
where N is the number of observations and s is the normalized standard deviation.

4. Volt/VAR Control Verification

The Volt/VAR verification test included two optional methods: the controller set-point change test and the controlled external stimulus test. All parameters and configurations of the inverters were based on guidelines from the NERC Inverter-Based Resource Performance Task Force, which developed recommended performance specifications for inverter-based resources connected to the electrical grid in North America [42]. Recommendations for steady-state and dynamic reactive power-voltage performance characteristics were taken from this report and influenced the results of the next tests.

4.1. Controller Set-Point Change Test

The first test was the voltage reference step test, which was done by changing the reference voltage set-point ( V r e f ) in the volt/Var control block, in order to emulate a step input to the plant controller. The second test was the reactive power reference step test, which was done by changing the reactive power reference ( Q r e f ).

4.1.1. Voltage Reference Step Test

In this test, the “RefFlag” in the plant controller REPC-A model (see Figure 5) was set to one, to enable the voltage control mode. In the first experiment, the voltage set-point was changed from 1.0 p.u. to 0.997 p.u. in both the plant model and the plant supervisory controller (PPC). The expected response was a decrease in the reactive power output, which should occur in order to maintain the desired voltage set-point. A comparison of simulation results and actual measurements is shown in Figure 9. The results showed high correlation between the simulated waveforms and the measurements, with NMSE = 0.09 % and NMEE = 7.2 % . Comparing the results of the d q 0 model to the measured data showed good correlation, with NMSE = 0.1899 % and NMEE = 18.87 % . The WECC dynamic model was more accurate than the d q 0 model for this scenario.
In another experiment, a 290 MW solar PV plant (see Appendix A for the inverter configurations) was connected to a 500 kV transmission line (operated at 525 kV). A nuclear power plant was also connected to the same line, creating a connection with low impedance. Due to this low impedance, changing the voltage set-point at the controller had little effect on the line voltage, and therefore, the voltage step used in this experiment was relatively low. A comparison of simulation results and actual measurements is shown in Figure 10. The results showed high correlation between the simulated waveforms and the measurements, with NMSE = 0.11 % and NMEE = 10.13 % .

4.1.2. Reactive Power Reference Step Test

For this kind of test, the “RefFlag” in the plant controller REPC-A model (see Figure 5) was set to zero, to enable the reactive power control mode. In the following experiment, the reactive power reference test was performed on a 290 MW solar PV plant by gradually changing the reactive power set-point (for inverter configurations, see Appendix A). First, this signal was changed from 0 MVAR to the highest operating point of 50 MVAR, then this signal was decreased to the lowest operating point of −50 MVAR, and finally, it was increased again up to 0 MVAR. The expected response was, at first, an increase in the voltage, then a decrease in the voltage, and finally, an increase back to the nominal voltage. A comparison of the simulation results and actual measurements for the reactive power change is shown in Figure 11. The results showed high correlation between the simulated waveforms and the measurements with NMSE = 0.06 % and NMEE = 9.3 % . In addition, comparison of the d q 0 model to the measured data for the voltage change test showed good correlation. The WECC dynamic model results were more accurate than the d q 0 model.
In the fourth experiment, a 250 MW solar PV plant was connected to a 230 kV transmission line (for the inverter configurations, see Appendix A). The PV plant was operated in over-excited power factor mode, since the active power was 75% of the rated capacity. For this mode, the reactive power set-point was changed gradually in steps of 18 MVAR from 55 MVAR to 73 MVAR and then back to 37 MVAR. A comparison of the simulation results and actual measurements is shown in Figure 12. The results showed high correlation between the simulated waveforms and the measurements with NMSE = 0.004 % and NMEE = 3.4 % .

4.2. Controlled External Stimulus Test

Another method to verify the model performance is to apply an external stimulus. In the fifth experiment, a capacitor bank of 3 MVAR, which was remotely controlled by the PPC, was switched automatically based on the reactive power set-point. In this test, the target reactive power at the point of interconnection (POI) was set to 5 MVAR, while the total reactive power from all inverters was 4.75 MVAR. When the reactive power set-point was switched to its target value, the inverters started to respond, but could not meet the desired set-point. Thus, the capacitor bank was automatically engaged at around 43 s. Then, the inverters ramped down their reactive power injection to maintain the desired set-point of 5 MVAR. A comparison of the simulation results and actual measurements is shown in Figure 13. Since the activation of the capacitor bank was an electromagnetic transient, which is hard to simulate, the results showed lower correlation between the simulated waveforms and the measurements with NMSE = 0.01 % and NMEE = 81.7 % .

4.3. Results’ Summary

The NMSE and NMEE measures reported in the experiments can be found in Table 2. The simulation results were identical to the field test measurements, except for the case where an electromagnetic transient occurred during capacitor switching. The average NMSE value was 0.098%, and the average NMEE was 7.5%, when the electromagnetic transient was not taken into account. The standard error of the measurements for all the experiments was small and did not affect the accuracy, with a maximum value of SE = ± 0.0032 % . Furthermore, since the third and fourth experiments were similar except for the PV plant size, it could be concluded that the size of the PV plant may affect the accuracy of the model. The third experiment included a 290 MW PV plant, while the fourth experiment, which was more accurate, included a 250 MW PV plant. In addition, the first and third experiments were compared to the d q 0 model, and it was shown that the WECC simulation model was more accurate.

5. Active Power/Frequency Control Verification

The active power/frequency control verification test was executed in accordance with the U.S. grid codes, which meant that generation units must respond to frequency deviations outside a dead-band of 0.036 Hz with a predefined droop value. In order to react to a change in the interconnection frequency, the plant’s active power should be changed as follows:
Δ P = P n o m f 0 f D B droop 100 f 0 ,
P = P 0 + Δ P ,
where Δ P is the change in the active power output, P n o m is the nominal maximum active power, P 0 is the active power before the change at steady-state, P is the active power after the change at steady-state, f 0 = 60 Hz is the frequency before the change, f is the frequency after the change at steady-state, D B = 0.036 Hz is the dead-band, and droop is the active power regulation coefficient normalized to the frequency change. All parameters and configurations of the inverters were based on guidelines from NERC Inverter-Based Resource Performance Task Force, which recommends specifications for inverter-based resources connected to the electrical grid in North America [42]. The calculation of the frequency and dynamic performance characteristics for active power-frequency control of inverter-based resources were taken from this report.
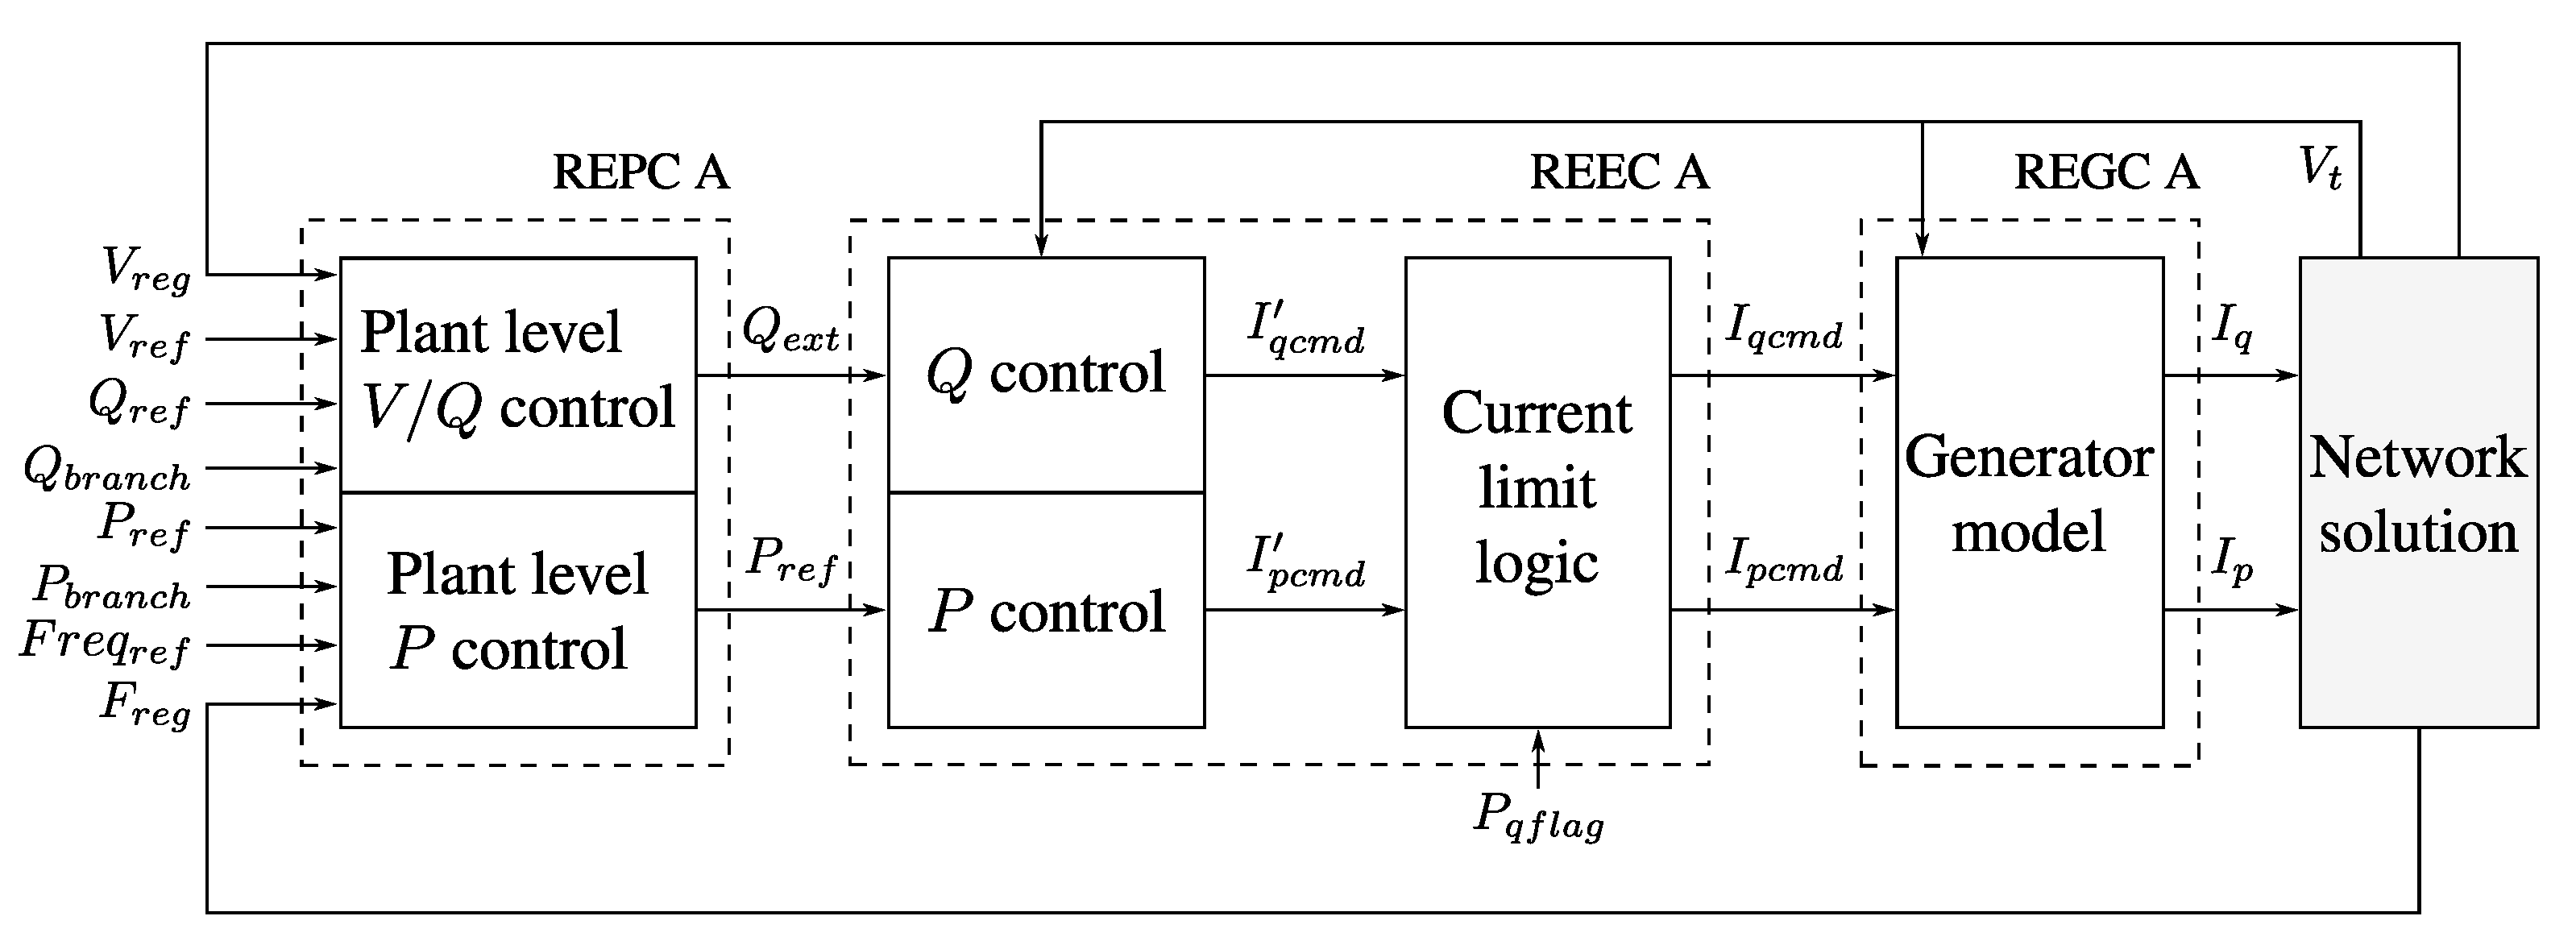
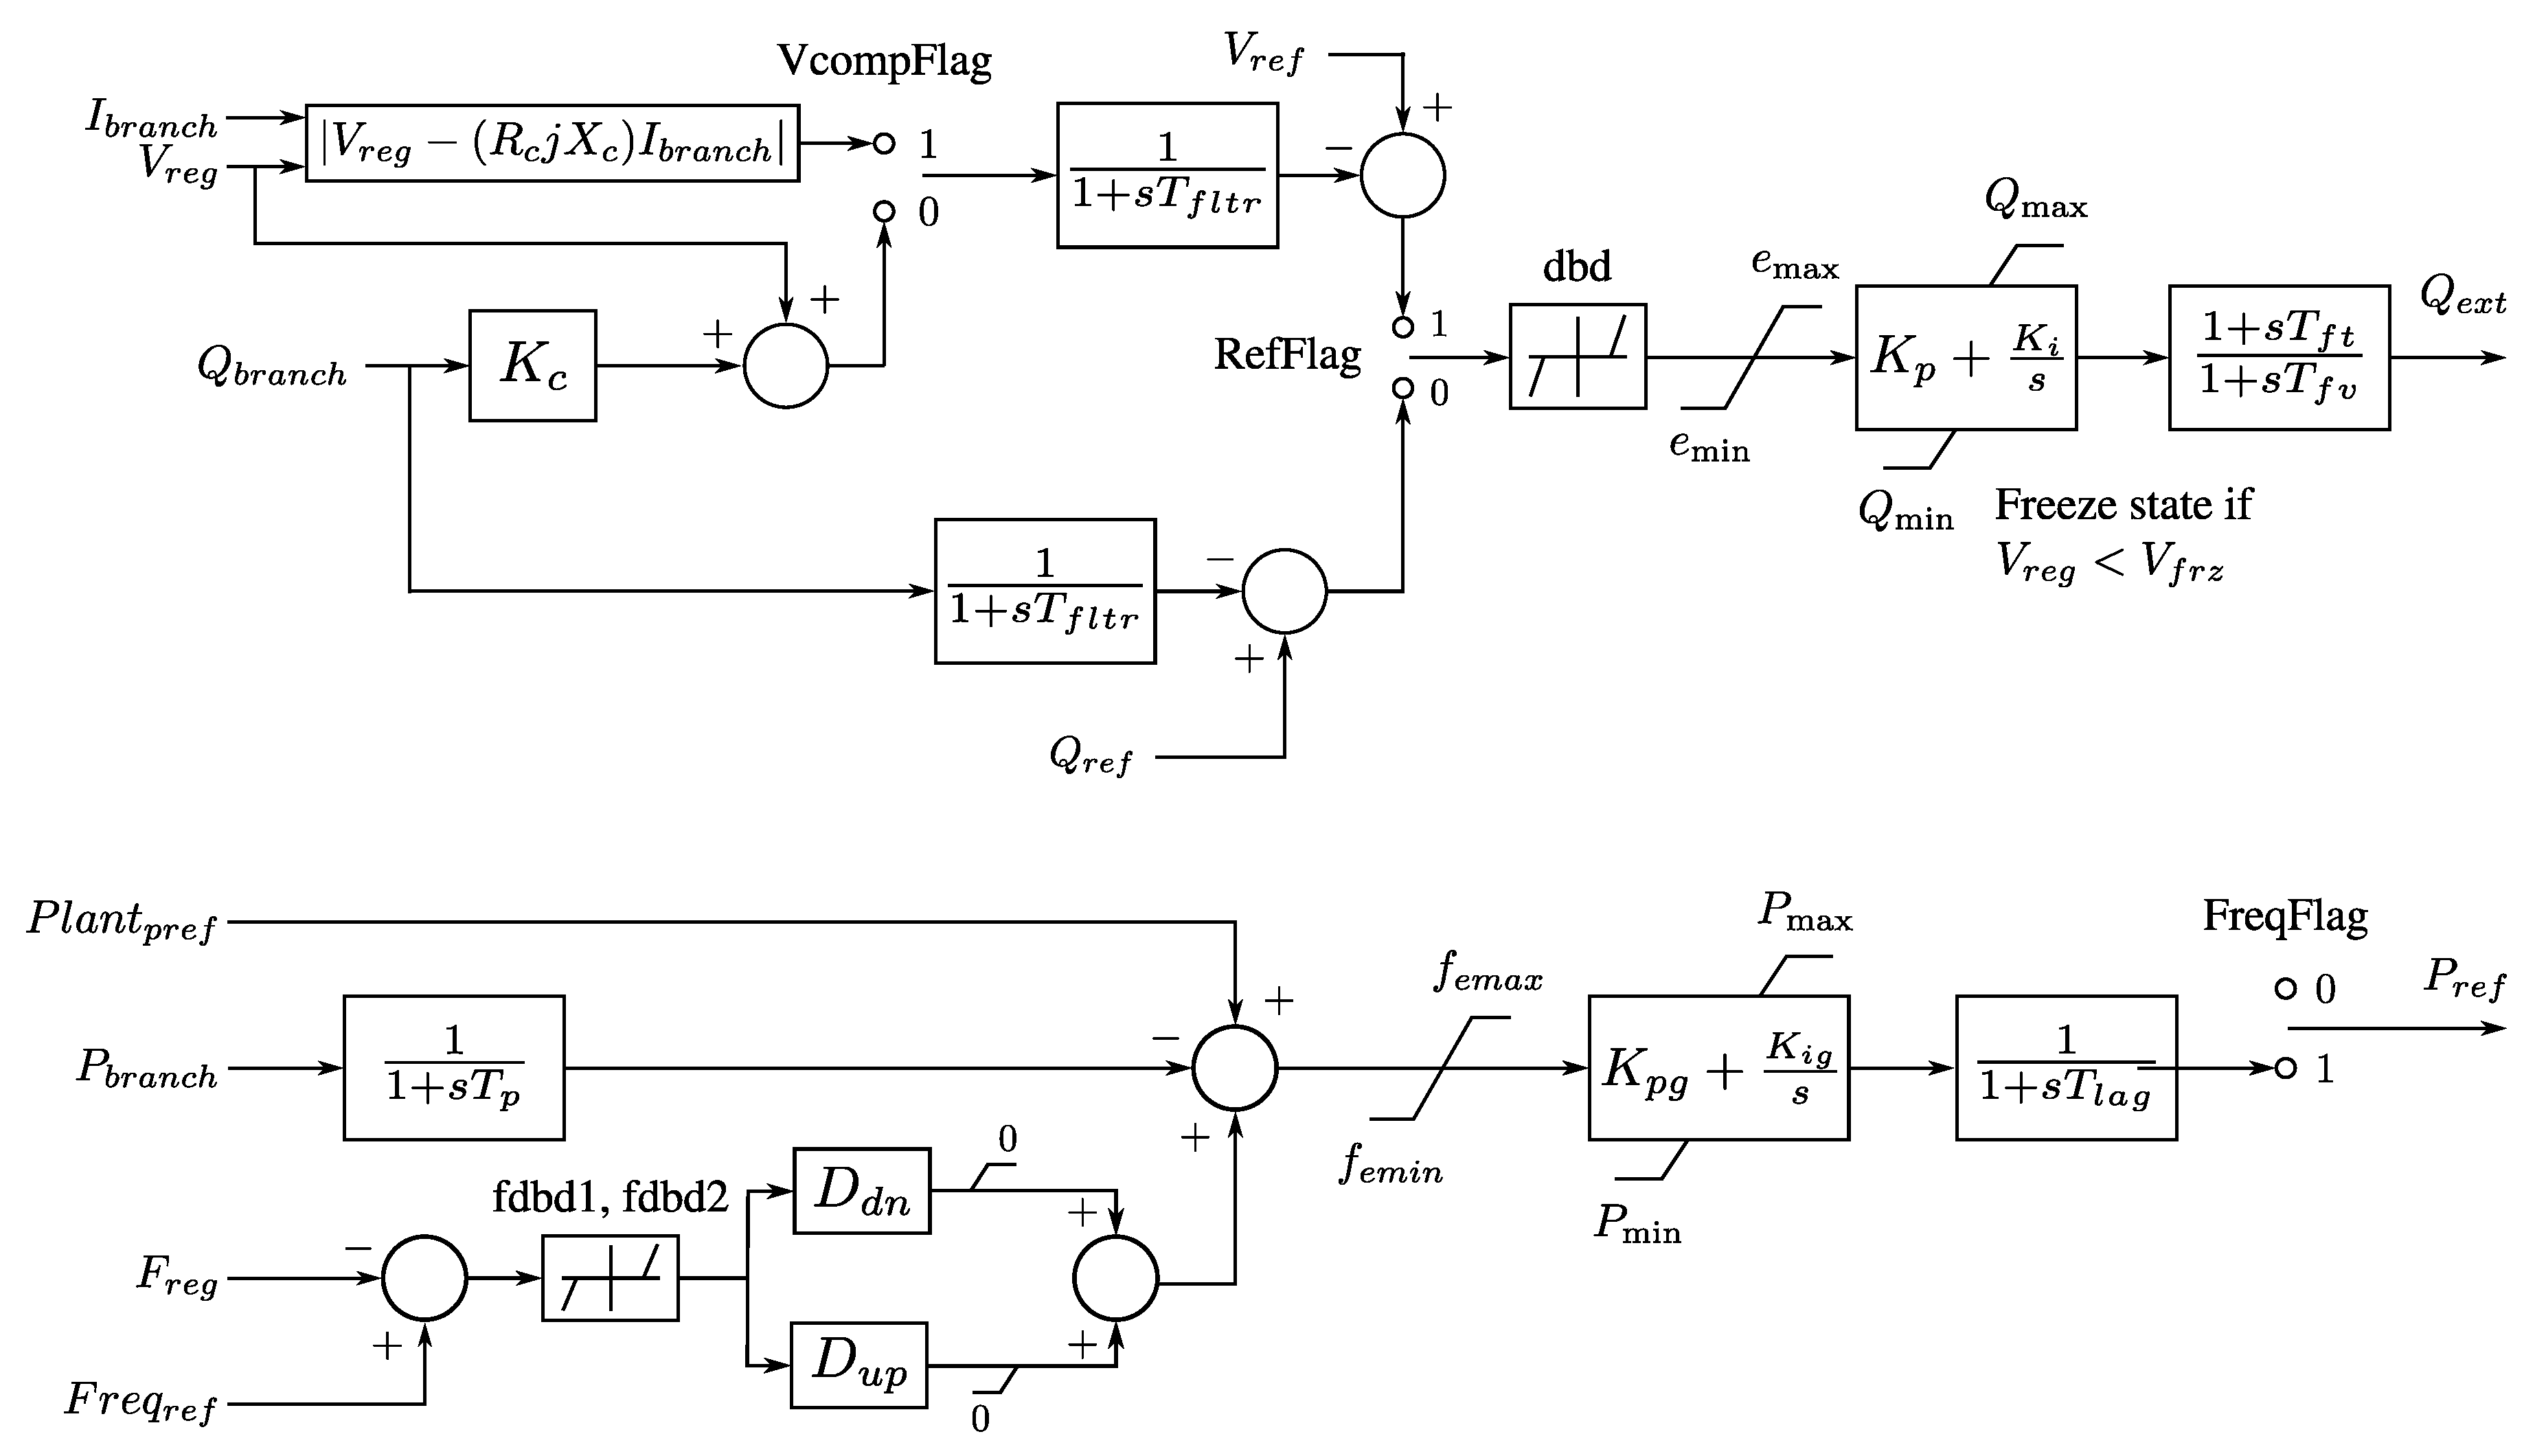
In the following tests, “FreqFlag” in the plant controller REPC-A model (see Figure 5) was set to one, to enable the frequency control mode [43]. The tests were done by changing the reference frequency set-point ( F r e g ) in the primary frequency control block, in order to emulate a step input to the plant controller. The emulated step could be a recorded frequency event or a synthetic frequency step. Note that for over-frequency events, the plant could easily reduce its active power. However, for under-frequency events, additional active power is needed for reserve; therefore, PV resources can provide frequency control services only if the plant is operating at a lower than maximum active power level.

5.1. Verification Using a Synthetic Frequency Signal

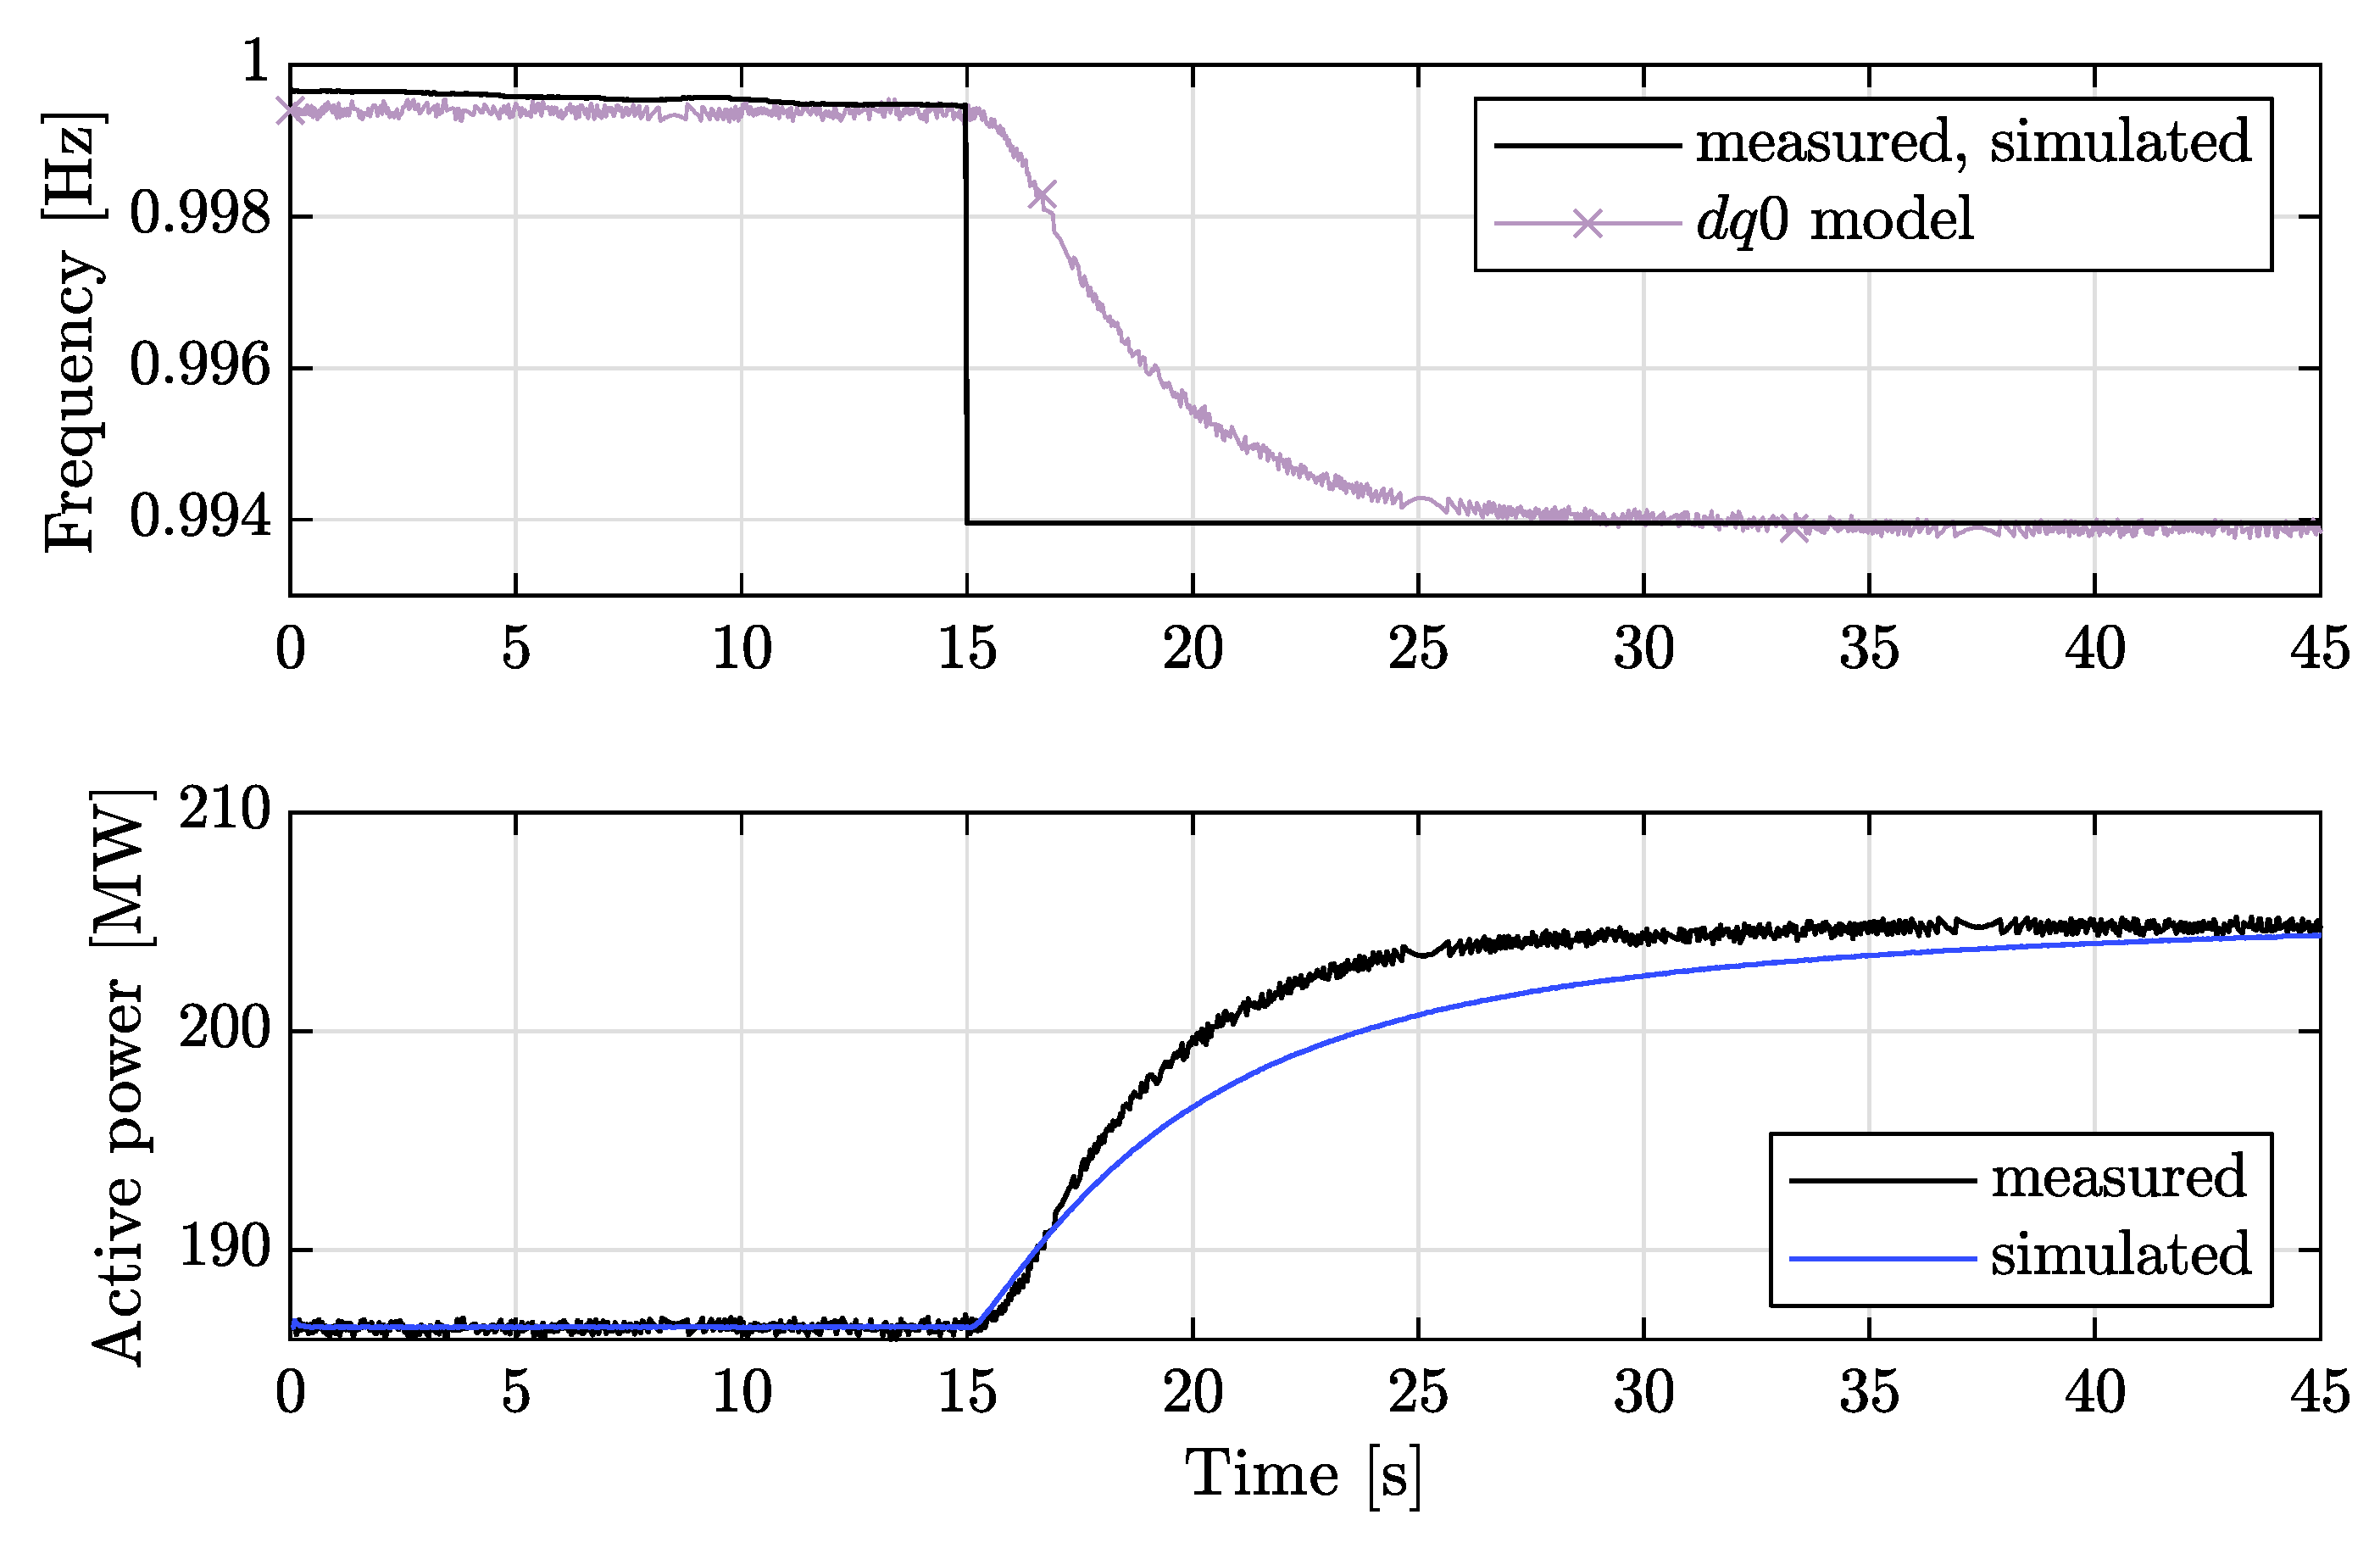
In this test, a frequency response test was performed on a 250 MW solar PV plant by emulating a synthetic frequency signal step, which served as an input to the plant-level controller (for inverter configurations, see Appendix A). Two frequency signal steps were emulated for two different experiments: under-frequency and over-frequency response. In the under-frequency experiment, the synthetic frequency signal was changed from 60 Hz to 59.62 Hz, which caused the inverters to increase their active power in an effort to restore the nominal frequency. During the under-frequency test, the solar PV plant was operated in a curtailed condition at 186 MW, such that there was a reserve of active power. A comparison of simulation results and actual measurements is shown in Figure 14. The results of the active power showed high correlation between the simulated waveforms and the measurements with NMSE = 0.0016 % and NMEE = 1.4 % .
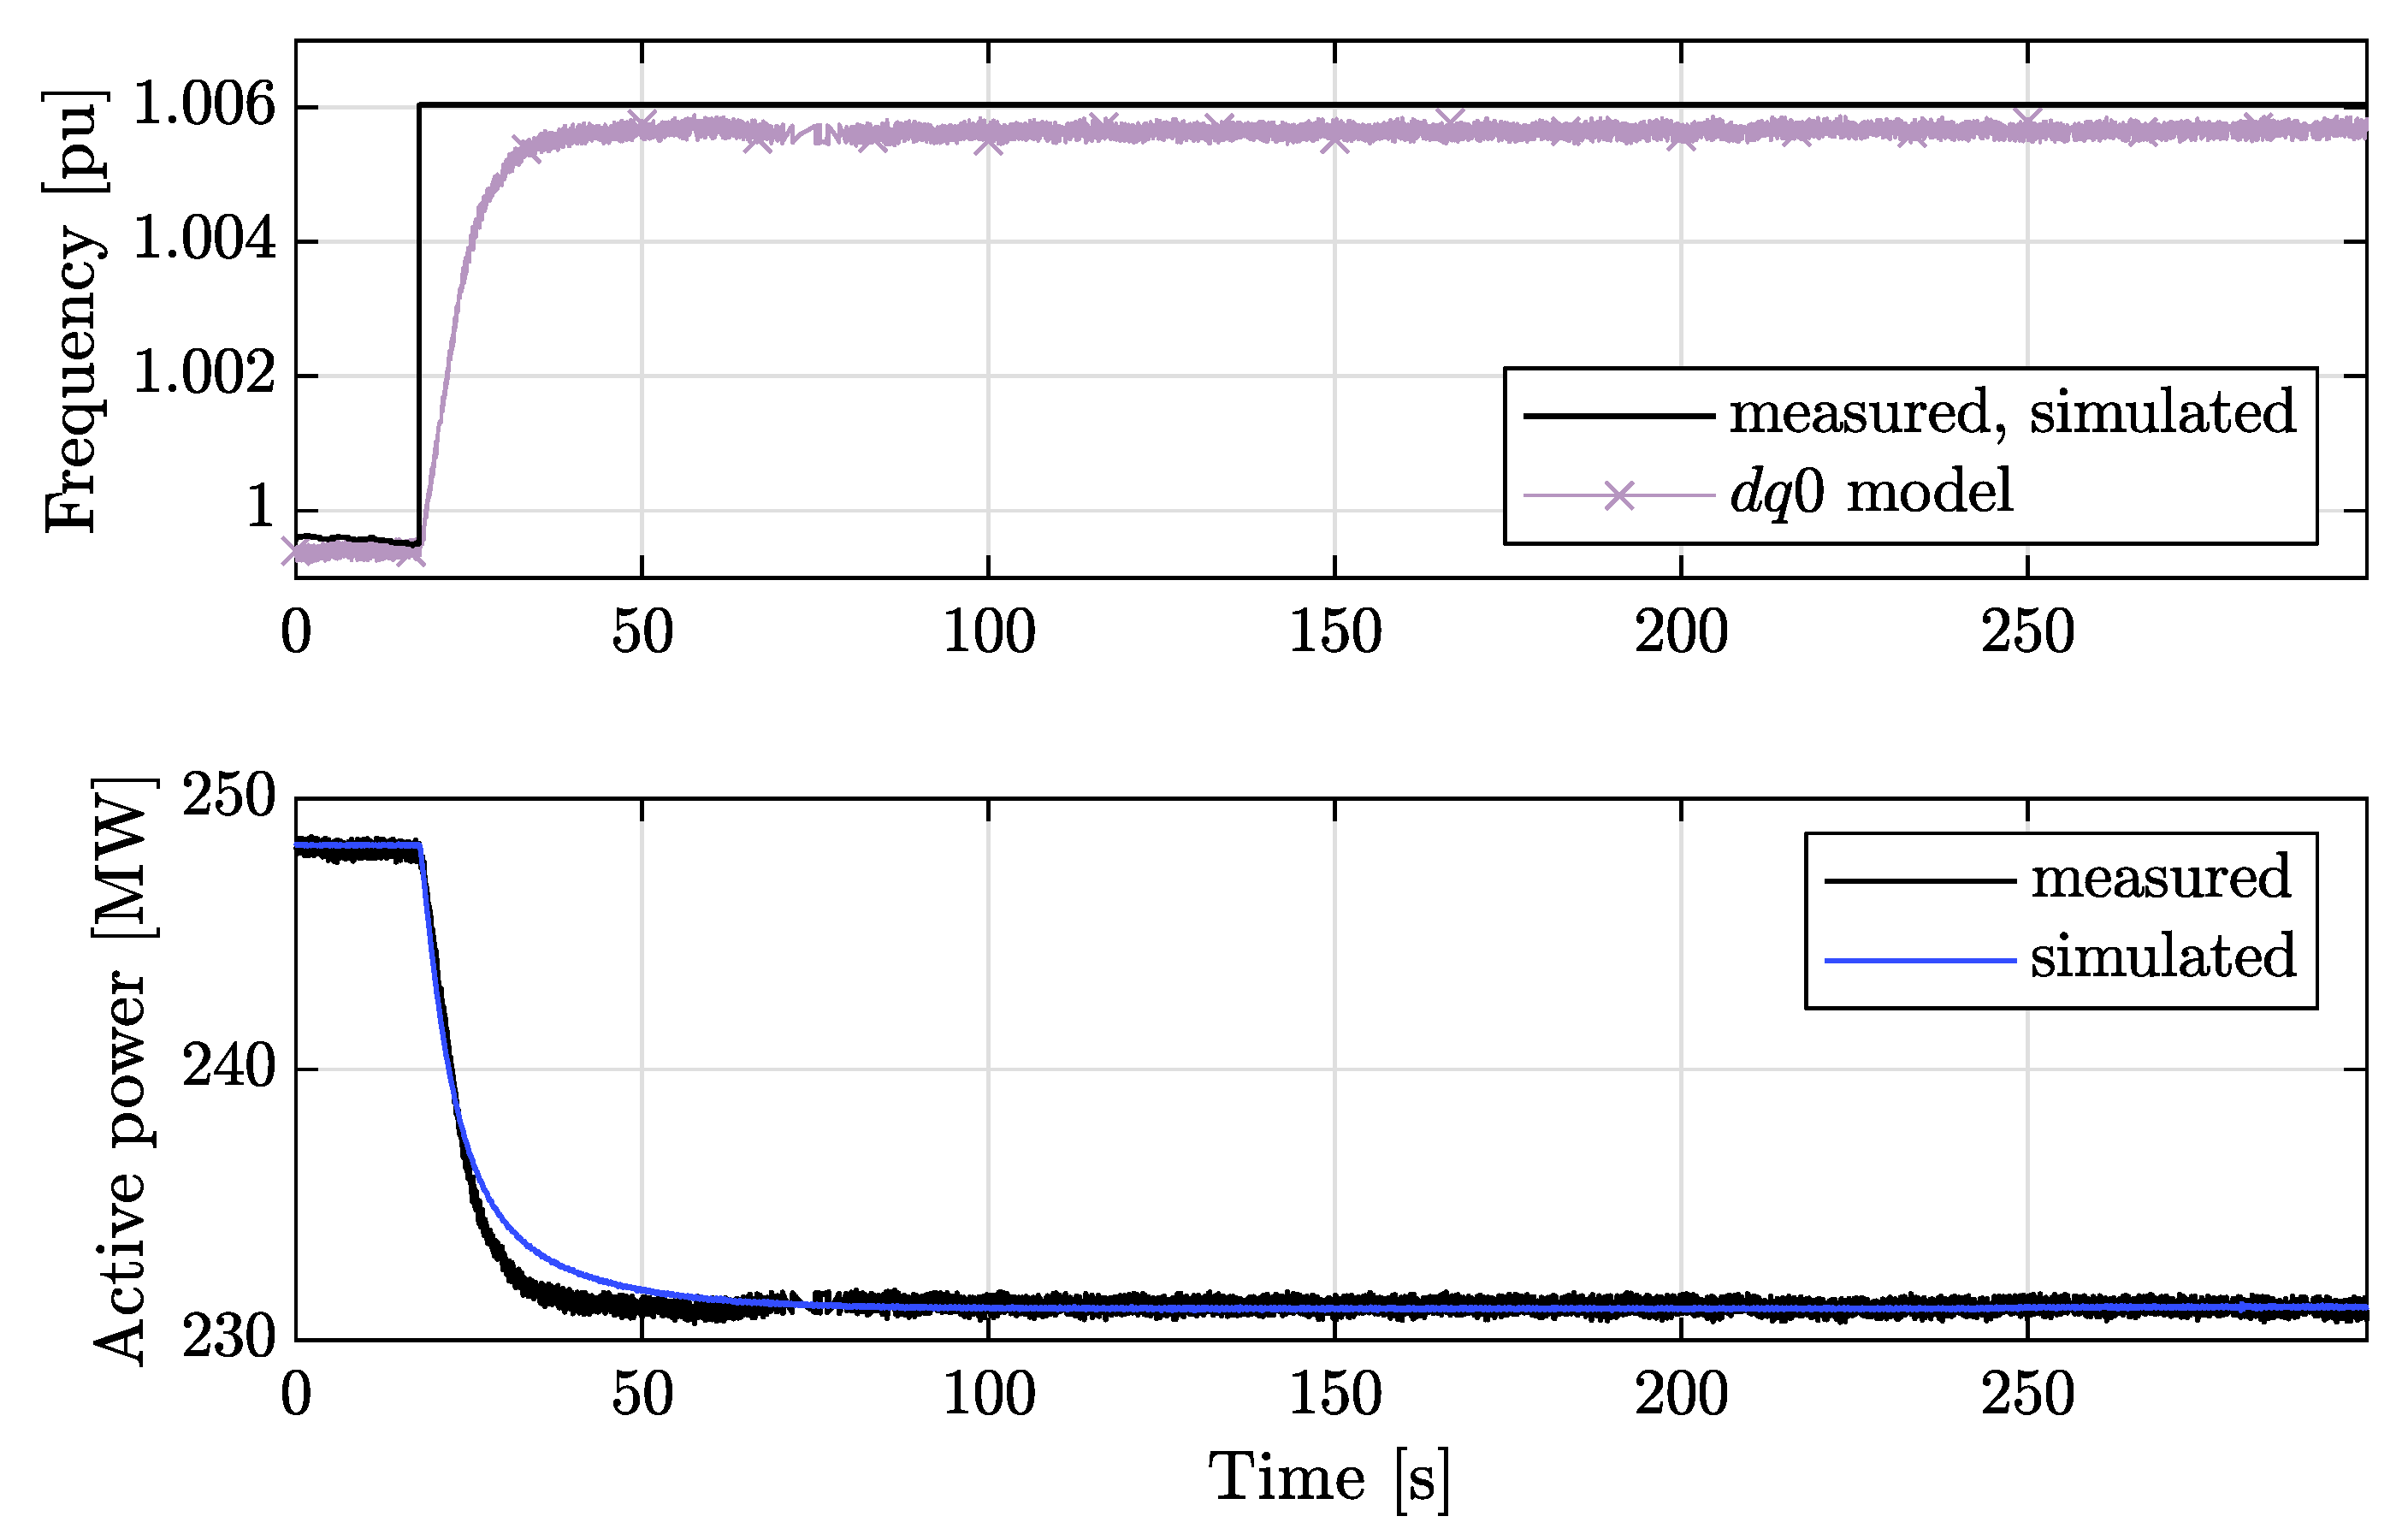
In the over-frequency experiment, the synthetic frequency signal was changed from 60 Hz to 60.36 Hz, which caused the inverters to decrease the active power in an effort to restore the nominal frequency. A comparison of the simulation results and actual measurements is shown in Figure 15. The results of the active power showed high correlation between the simulated waveforms and the measurements with NMSE = 0.0005 % and NMEE = 0.5 % .
Furthermore, for both experiments, the change in the active power output ( Δ P ) was in accordance with (4) and (5), which showed that the WECC model was accurate when predicting such dynamic phenomena. When comparing the results of the d q 0 model to the measured data for the frequency change, good correlation may be observed. Again, the WECC dynamic model results were almost equal to the measurements; thus, the WECC model was more accurate than the d q 0 model.

5.2. Disturbance-Based Model Verification

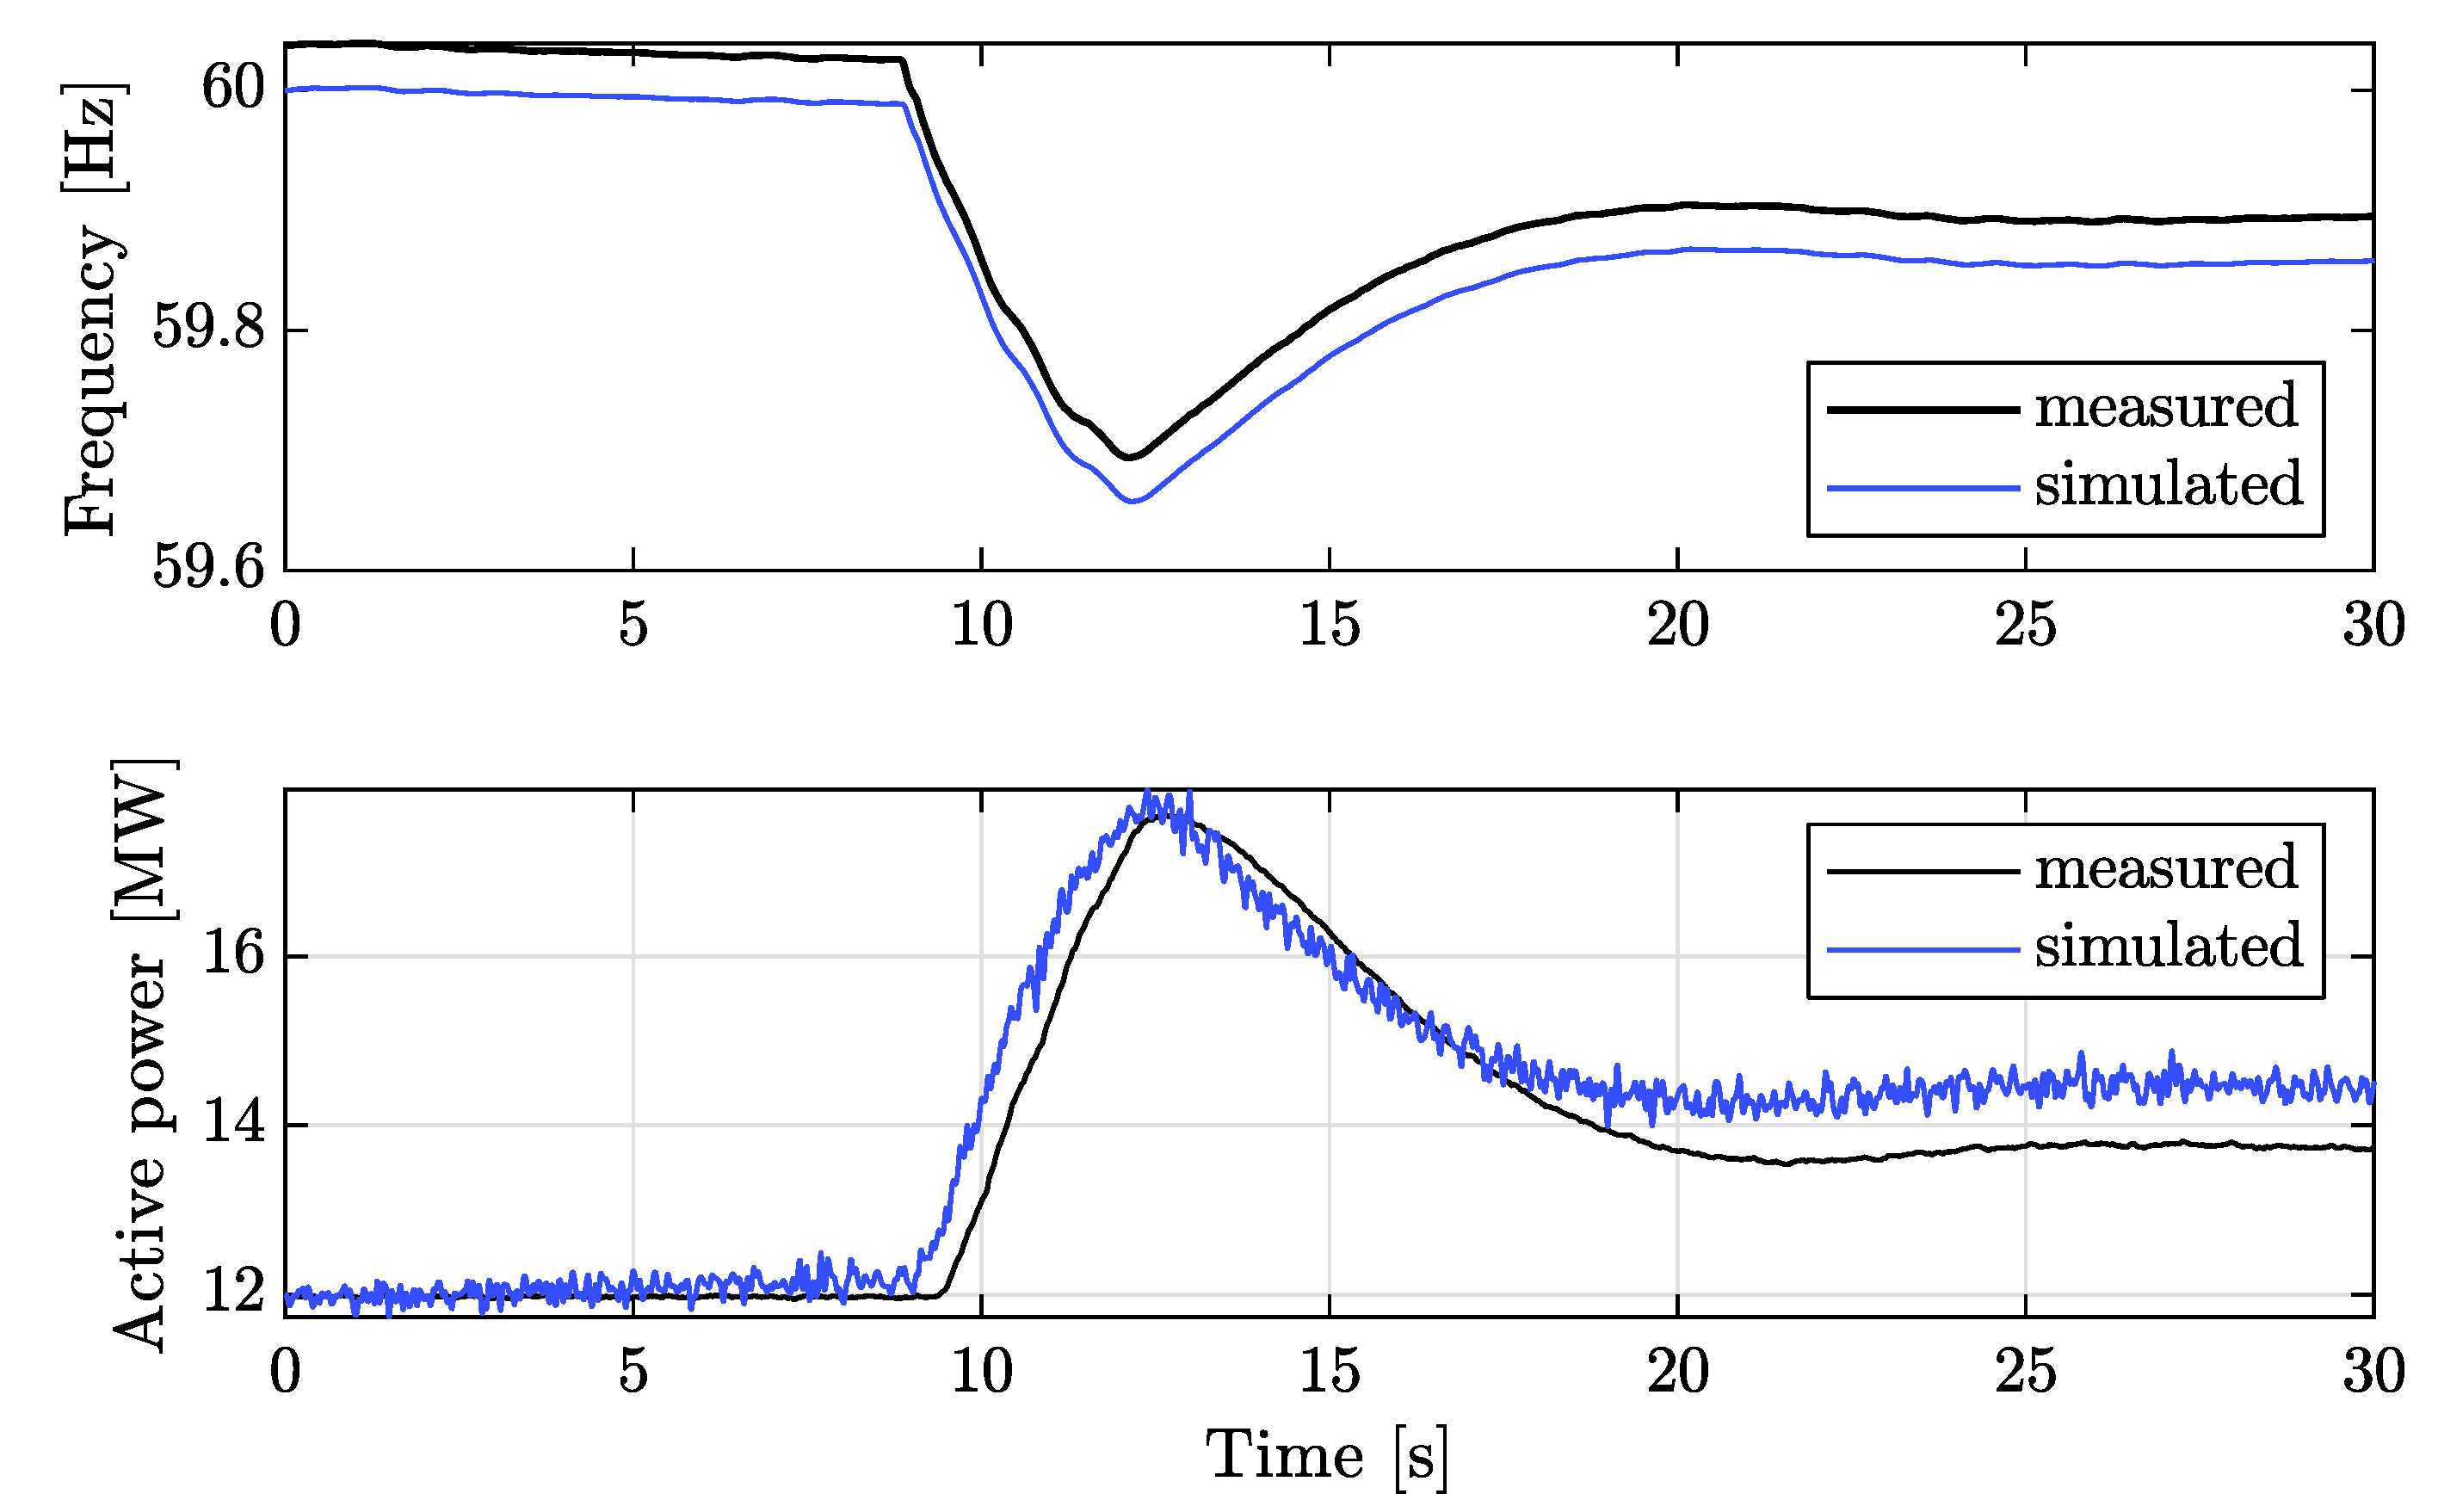
Another method to verify the model performance is to use a recorded frequency signal from an actual grid event (for the inverter configuration, see Appendix A). This recorded frequency signal was injected into the PPC model in order to monitor the dynamic behavior of the PV plant, in response to the emulated event. In this experiment, the frequency signal was taken from an actual grid event that occurred on 29 November 2011, in the Electric Reliability Council of Texas. This event resulted in a loss of nearly 1.365 GW. For this test, the plant was set to operate with a 1.67% droop coefficient and was operated in curtailed mode at 12 MW when the event started. In response to the emulated frequency decline, the solar PV plant increased its active power based on the droop characteristic. A comparison of the simulation results and actual measurements is shown in Figure 16. The change in active power output ( Δ P ) was in accordance with (4) and (5). Since in the simulation f 0 = 60 Hz and in the real event f 0 = 60.037 Hz , there was a gap between the signal respective values of NMSE = 2.5 % , NMEE = 5.3 % , which was considerably higher than the previous tests. However, the simulated signals, both frequency and active power, followed the measured signal gradient, regardless of this constant gap.

5.3. Results’ Summary

The NMSE and NMEE measures reported in the experiments can be found in Table 3, and the active power calculations can be found in Table 4. For the under- and over-frequency response experiments, the simulations and real measurements were equal. For the reproduced grid event, since the initial frequency was different between the simulation and real measurements, the calculations were done separately for each case. The average NMSE value was 0.85%, and the average NMEE was 2.4%. The standard error of the active power measurements for all the experiments was small and did not significantly affect the accuracy SE = ± 0.0057 % . Furthermore, the under- and over-frequency response experiments were compared to the d q 0 model, and it was shown that the WECC simulation model was more accurate.

6. Conclusions

In recent years, there has been a growing need for accurate models that describe the dynamic behavior of renewable energy sources, especially PV sources and wind turbines. In light of this gap, this work focused on validation of the standard WECC dynamic PV system models, using actual measurements from the Western Texas and Southern California transmission networks. The field tests were based on the North American Electric Reliability Corporation compliance standards. Through this extensive set of field tests that included dynamic stability tests for volt-var control and primary frequency response, we showed that the WECC generic models could be used to simulate real dynamic phenomena in large-scale solar PV power plants and proposed guidelines for correct usage of these models. The results showed that the WECC models were especially accurate when the photovoltaic system was connected with a low impedance to the main network and that they successfully predicted the frequency dynamics following a large disturbance. The accuracy of the models in such cases was confirmed by low average normalized mean squared error (0.4%) and low average normalized maximum error (7.5%). However, the results also showed that these standard models did not simulate fast transients well, for instance transients that may appear following capacitor switching (see Section 4). We also showed that the tested WECC models successfully predicted the frequency response of an actual grid event that occurred in the Electric Reliability Council of Texas, which resulted in a loss of nearly 1.365 GW. This result supported the use of these models in the study of large-scale dynamic phenomena that include renewable energy sources. For future research, we suggest to test the effects of PV plant size and location on the WECC model performance; specifically, it would be interesting to test the impact of the PV plant size in the case of failures. In addition, we propose to test the performance of additional dynamic models of renewable energy sources, such as wind turbine generators and energy storage devices, against the NERC compliance standards.

Author Contributions

All authors worked on this research together and approved the paper. All authors read and agreed to the published version of the manuscript. Conceptualization, S.S. and V.C.; Investigation, R.M., S.S. and Z.B.; Methodology, R.M., S.S. and Z.B.; Software, R.M., S.S. and J.B.; Validation, R.M., Z.B. and J.B.; Analysis of the results, R.M., J.B. and Y.L.; Writing of the manuscript, R.M., Z.B., S.S., J.B. and Y.L.; Supervision, V.C. and Y.L.; Project administration, R.M.; Visualization, J.B.

Funding

Y. Levron was partly supported by Israel Science Foundation Grant No. 2//7221.

Conflicts of Interest

The authors declare no conflict of interest.

Abbreviations

The following abbreviations are used in this manuscript:
EMTElectromagnetic transient simulations
EPRIElectric Power Research Institute
IECInternational Electro-technical Commission
NERCNorth American Electric Reliability Corporation
NMEENormalized maximum estimation error
NMSENormalized mean squared error
POIPoint of interconnection
PPCPlant supervisory controller
PVPhotovoltaic
REECRenewable electrical controller
REGCRenewable generator converter
REMTFRenewable Energy Modeling Task Force
REPCRenewable plant controller
WECCWestern Electricity Coordinating Council

Appendix A. Inverter Configurations

The inverter configurations used in the dynamic tests are presented in Table A1, Table A2 and Table A3. Table A1 contains the parameters of the REGC-A model. Table A2 contains the parameters of the REEC-A model. Table A3 contains the parameters of the REPC-A model.
Table A1. REGC-A model: parameters of the solar PV plant.
Param.290 MW250 MW20 MW
lvplsw1.001.001.00
rrpwr1.4010.001.40
brkpt0.900.900.90
zerox0.500.400.50
lvpl11.101.221.10
vtmax1.102.001.10
lvpnt10.500.800.50
lvpnt00.010.400.01
qmin−1.10−1.30−1.10
accel2.000.702.00
tg0.020.020.02
tfltr0.010.020.01
iqrmax20.000.00520.00
iqrmin−20.00−0.005−20.00
Xe0.000.000.00
Table A2. REEC-A model: parameters of the solar PV plant.
Param.290 MW250 MW20 MW
vdip0.90−99.000.90
vup1.1099.001.10
trv0.020.0200.02
dbd1−0.10−0.05−0.10
dbd20.100.0500.10
kqv2.000.002.00
iqh11.101.251.10
iql1−1.10−1.05−1.10
vref00.000.000.00
tp0.020.050.02
qmax0.4360.3130.33
qmin−0.436−0.313−0.33
vmax1.151.101.15
vmin0.850.900.85
kqp1.001.001.00
kqi1.001.001.00
kvp1.001.001.00
kvi1.001.001.00
tiq0.020.020.02
dpmax1.0099.001.00
dpmin−1.00−99.00−1.00
pmax1.001.001.00
pmin0.000.000.00
imax1.101.201.10
tpord0.020.020.02
pfflag0.000.000.00
vflag0.000.000.00
qflag0.000.000.00
pqflag0.000.000.00
Table A3. REPC-A model: parameters of the solar PV plant.
Param.290 MW250 MW20 MW
tfltr0.050.050.05
kp0.050.450.029
ki0.0450.0250.01
tft0.000.000.00
tfv0.050.050.05
refflg1.001.001.00
vfrz0.900.900.90
rc0.000.000.00
xc0.000.000.00
kc0.000.000.05
vcmpflg1.001.001.00
emax0.050.050.05
emin−0.05−0.05−0.05
dbd0.000.000.00
qmax0.4360.3130.330
qmin−0.436−0.313−0.330
kpg0.300.104.50
kig0.3000.0500.005
tp0.250.250.25
fdbd1−0.0006−0.0006−0.0006
fdbd20.00060.00060.0006
femax999.00999.00999.00
femin−999.00−999.00−999.00
pmax1.001.001.00
pmin0.000.000.00
tlag0.700.100.70
ddn28.5020.0020.00
dup−28.500.0020.00
frqflg0.000.001.00
outflag0.000.000.00

References

  1. Ulbig, A.; Borsche, T.S.; Andersson, G. Impact of low rotational inertia on power system stability and operation. In IFAC Proceedings Volumes; Elsevier: London, UK, 2014; Volume 47, pp. 7290–7297. [Google Scholar]
  2. Shah, R.; Mithulananthan, N.; Bansal, R.C.; Ramachandaramurthy, V.K. A review of key power system stability challenges for large-scale PV integration. Renew. Sustain. Energy Rev. 2015, 41, 1423–1436. [Google Scholar] [CrossRef]
  3. Dreidy, M.; Mokhlis, H.; Mekhilef, S. Inertia response and frequency control techniques for renewable energy sources: A review. Renew. Sustain. Energy Rev. 2017, 69, 144–155. [Google Scholar] [CrossRef]
  4. Milano, F.; Dörfler, F.; Hug, G.; Hill, D.J.; Verbic, G. Foundations and challenges of low-inertia systems. In Proceedings of the Power Systems Computation Conference, Dublin, Ireland, 11–15 June 2018. [Google Scholar]
  5. Tielens, P.; Henneaux, P.; Cole, S. Penetration of Renewables and Reduction of Synchronous Inertia in the European Power System—Analysis and Solutions. Techreport, ASSET. 2018. Available online: https://asset-ec.eu/ (accessed on 23 October 2019).
  6. Israel Government Report. Implementation of the Sustainable Development Goals. Available online: https://mfa.gov.il/MFA/PressRoom/2019/Documents/Israel%20SDG%20national%20review.pdf (accessed on 23 October 2019).
  7. Kroutikova, N.; Hernandez-Aramburo, C.A.; Green, T.C. State-space model of grid-connected inverters under current control mode. IET Electr. Power Appl. 2007, 1, 329. [Google Scholar] [CrossRef] [Green Version]
  8. Wang, H.; Tang, Y.; Chen, J.; Hou, J. Modeling and equivalence of integrated power generation system of wind, photovoltaic and energy storage. In Proceedings of the Asia-Pacific Power and Energy Engineering Conference, Shanghai, China, 27–29 March 2012. [Google Scholar]
  9. Zhu, S.; Piper, D.; Ramasubramanian, D.; Quint, R.; Isaacs, A.; Bauer, R. Modeling inverter-based resources in stability studies. In Proceedings of the Power & Energy Society General Meeting, Portland, OR, USA, 5–9 August 2018. [Google Scholar]
  10. Yamashita, K.; Renner, H.; Villanueva, S.M.; Lammert, G.; Aristidou, P.; Martins, J.C.; Zhu, L.; Ospina, L.D.P.; Van Cutsem, T. Industrial recommendation of modeling of inverter-based generators for power system dynamic studies with focus on photovoltaic. IEEE Power Energy Technol. Syst. J. 2018, 5, 1–10. [Google Scholar] [CrossRef] [Green Version]
  11. Ellis, A.; Behnke, M.; Elliot, R. Generic Solar Photovoltaic System Dynamic Simulation Model Specification. TechReport SAND2013-8876, WECC Renewable Energy Modeling Task Force. 2013. Available online: https://prod-ng.sandia.gov/techlib-noauth/access-control.cgi/2013/138876.pdf (accessed on 23 October 2019).
  12. Pourbeik, P. Model User Guide for Generic Renewable Energy System Models. TechReport 30020114083. Electric Power Research Institute. 2018. Available online: https://www.epri.com/#/pages/product/3002006525/ (accessed on 23 October 2019).
  13. Göksu, O.; Sorensen, P.; Fortmann, J.; Morales, A.; Weigel, S.; Pourbeik, P. Compatibility of IEC 61400-27-1 Ed 1 and WECC 2nd generation wind turbine models. In Proceedings of the International Workshop on Large-Scale Integration of Wind Power into Power Systems as well as on Transmission Networks for Offshore Wind Power Plants, Vienna, Austria, 15–17 November 2016. [Google Scholar]
  14. Xu, X.; Bishop, M.; Oikarinen, D.G.; Hao, C. Application and modeling of battery energy storage in power systems. CSEE J. Power Energy Syst. 2016, 2, 82–90. [Google Scholar] [CrossRef]
  15. General Electric. PSLF. 2017. Available online: www.geenergyconsulting.com/practice-area/software-products/pslf (accessed on 23 October 2019).
  16. Siemens. PSSE—Power System Simulation and Modeling Software. 2019. Available online: https://new.siemens.com/global/en/products/energy/services/transmission-distribution-smart-grid/consulting-and-planning/pss-software.html (accessed on 23 October 2019).
  17. PowerWorld Corporation. PowerWorld. 2019. Available online: https://www.powerworld.com/ (accessed on 23 October 2019).
  18. DIgSILENT. PowerFactory. Available online: https://www.digsilent.de/en/powerfactory.html (accessed on 5 February 2020).
  19. Nanou, S.I.; Papathanassiou, S.A. Modeling of a PV system with grid code compatibility. Electr. Power Syst. Res. 2014, 116, 301–310. [Google Scholar] [CrossRef]
  20. Ramasubramanian, D.; Vittal, V. Small signal stability analysis of controlled voltage source converter model for positive sequence time domain simulations. In Proceedings of the North American Power Symposium, Denver, CO, USA, 18–20 September 2016. [Google Scholar]
  21. Mahseredjian, J.; Dinavahi, V.; Martinez, J.A. Simulation tools for electromagnetic transients in power systems: Overview and challenges. IEEE Trans. Power Deliv. 2009, 24, 1657–1669. [Google Scholar] [CrossRef]
  22. Hariri, A.; Faruque, M.O. A hybrid simulation tool for the study of PV integration impacts on distribution networks. IEEE Trans. Sustain. Energy 2017, 8, 648–657. [Google Scholar] [CrossRef]
  23. Pourbeik, P.; Sanchez-Gasca, J.J.; Senthil, J.; Weber, J.D.; Zadehkhost, P.S.; Kazachkov, Y.; Tacke, S.; Wen, J.; Ellis, A. Generic dynamic models for modeling wind power plants and other renewable technologies in large-scale power system studies. IEEE Trans. Energy Convers. 2017, 32, 1108–1116. [Google Scholar] [CrossRef]
  24. Pourbeik, P.; Etzel, N.; Wang, S. Model validation of large wind power plants through field testing. IEEE Trans. Sustain. Energy 2018, 9, 1212–1219. [Google Scholar] [CrossRef]
  25. Jiménez-Buendía, F.; Villena-Ruiz, R.; Honrubia-Escribano, A.; Molina-García, Á.; Gómez-Lázaro, E. Submission of a WECC DFIG Wind Turbine Model to Spanish Operation Procedure 12.3. Energies 2019, 12, 3749. [Google Scholar] [CrossRef] [Green Version]
  26. Eguia, P.; Etxegarai, A.; Torres, E.; Martin, J.I.S.; Albizu, I. Modeling and validation of photovoltaic plants using generic dynamic models. In Proceedings of the International Conference on Clean Electrical Power, Taormina, Italy, 16–18 June 2015. [Google Scholar]
  27. Lammert, G.; Ospina, L.D.P.; Pourbeik, P.; Fetzer, D.; Braun, M. Implementation and validation of WECC generic photovoltaic system models in DIgSILENT PowerFactory. In Proceedings of the Power and Energy Society General Meeting, Boston, MA, USA, 17–21 July 2016. [Google Scholar]
  28. Lammert, G.; Premm, D.; Ospina, L.D.P.; Boemer, J.C.; Braun, M.; Van Cutsem, T. Control of photovoltaic systems for enhanced short-term voltage stability and recovery. IEEE Trans. Energy Convers. 2019, 34, 243–254. [Google Scholar] [CrossRef] [Green Version]
  29. North American Electric Reliability Corporation. Modeling Notification—Recommended Practices for Modeling Momentary Cessation. 2019. Available online: https://www.nerc.com/pa/Stand/Pages/default.aspx (accessed on 23 October 2019).
  30. Clark, K.; Walling, R.A.; Miller, N.W. Solar photovoltaic (PV) plant models in PSLF. In Proceedings of the Power and Energy Society General Meeting, Detroit, MI, USA, 24–28 July 2011. [Google Scholar]
  31. Soni, S.; Karady, G.G.; Morjaria, M.; Chadliev, V. Comparison of full and reduced scale solar PV plant models in multi-machine power systems. In Proceedings of the PES T&D Conference and Exposition, Chicago, IL, USA, 14–17 April 2014. [Google Scholar]
  32. Pourbeik, P.; Petter, J.K. Modeling and validation of battery energy storage systems using simple generic models for power system stability studies. CIGRE Sci. Eng. 2017, 9, 63–72. [Google Scholar]
  33. Wang, W.; Huang, G.M.; Kansal, P.; Anderson, L.E.; OrKeefe, R.J.; Ramasubramanian, D.; Mitra, P.; Farantatos, E. Instability of PLL-synchronized converter-based generators in low short-circuit systems and the limitations of positive sequence modeling. In Proceedings of the North American Power Symposium, Fargo, ND, USA, 9–11 September 2018. [Google Scholar]
  34. North American Electric Reliability Corporation. NERC Standards. Available online: https://www.nerc.com/ (accessed on 23 October 2019).
  35. North American Electric Reliability Corporation. MOD0261—Verification of Models and Data for Generator Excitation Control System or Plant Volt/Var Control Functions For Requirement R1. 2009. Available online: https://www.nerc.com/pa/Stand/Pages/MOD0261RI.aspx (accessed on 23 October 2019).
  36. North American Electric Reliability Corporation. MOD0271—Verification of Models and Data for Turbine/Governor and Load Control or Active Power/Frequency Control Functions for Requirement R1. 2009. Available online: https://www.nerc.com/pa/Stand/Pages/MOD0271RI.aspx (accessed on 23 October 2019).
  37. Lima, L.T.G. Dynamic model validation for compliance with NERC standards. In Proceedings of the Power & Energy Society General Meeting, Calgary, AB, Canada, 26–30 July 2009. [Google Scholar]
  38. Piwko, R.J.; Miller, N.W.; MacDowell, J.M. Field testing and model validation of wind plants. In Proceedings of the Power and Energy Society General Meeting—Conversion and Delivery of Electrical Energy in the 21st Century, Pittsburgh, PA, USA, 20–24 July 2008. [Google Scholar]
  39. Baimel, D.; Belikov, J.; Guerrero, J.M.; Levron, Y. Dynamic Modeling of Networks, Microgrids, and Renewable Sources in the dq0 Reference Frame: A Survey. IEEE Access 2017, 5, 21323–21335. [Google Scholar] [CrossRef]
  40. Baimel, D. Implementation of DQ0 control methods in high power electronics devices for renewable energy sources, energy storage and FACTS. Sustain. Energy Grids Netw. 2019, 18, 100218. [Google Scholar] [CrossRef]
  41. Levron, Y.; Belikov, J. Open-source software for modeling and analysis of power networks in the dq0 reference frame. In Proceedings of the 2017 IEEE Manchester PowerTech, Manchester, UK, 18–22 June 2017; IEEE: Piscataway, NJ, USA, 2017. [Google Scholar] [CrossRef]
  42. Force, N.I.B.R.P.T. Reliability Guideline: BPS-Connected Inverter-Based Resource Performance; Technical Report; North American Electric Reliability Corporation: Atlanta, GA, USA, 2018. [Google Scholar]
  43. Pourbeik, P.; Soni, S.; Gaikwad, A.; Chadliev, V. Providing primary frequency response from photovoltaic power plants. In Proceedings of the CIGRE Symposium, Dublin, Ireland, 31 May 2017. [Google Scholar]
Figure 1. Single machine representation of a solar PV plant.
Energies 13 03191 g001
Figure 2. First-generation PV model: generator converter.
Energies 13 03191 g002
Figure 3. First-generation PV model: converter electrical control.
Energies 13 03191 g003
Figure 4. Second-generation solar PV plant models.
Energies 13 03191 g004
Figure 5. Second-generation PV model: plant controller model.
Energies 13 03191 g005
Figure 6. Second-generation PV model: electrical controller model.
Energies 13 03191 g006
Figure 7. Second-generation PV model: generator converter model.
Energies 13 03191 g007
Figure 8. Flowchart of the validation process.
Energies 13 03191 g008
Figure 9. Volt/VAR Control Experiment 1: voltage reference step test. Comparison of simulations and experimental results. The voltage set-point was changed from 1.0 p.u. to 0.997 p.u.
Energies 13 03191 g009
Figure 10. Volt/VAR Control Experiment 2 (low impedance connection to a nuclear plant): voltage reference step test. Comparison of the simulations and experimental results.
Energies 13 03191 g010
Figure 11. Volt/VAR Control Experiment 3: Reactive power reference step test. Comparison of simulations and experimental results. The reactive power set-point was changed as follows: 0 MVAR 50 MVAR 50 MVAR 0 MVAR .
Energies 13 03191 g011
Figure 12. Volt/VAR Control Experiment 4 (over-excited power factor mode): reactive power reference step test. Comparison of simulations and experimental results.
Energies 13 03191 g012
Figure 13. Volt/VAR Control Experiment 5: controlled external stimulus test (switching a capacitor bank). Comparison of simulations and experimental results.
Energies 13 03191 g013
Figure 14. Frequency Control Experiment 1: under-frequency response test. Comparison of simulations and experimental results. The frequency signal is changed from 60 Hz to 59.62 Hz.
Energies 13 03191 g014
Figure 15. Frequency Control Experiment 2: over-frequency response test. Comparison of simulations and experimental results. The frequency signal is changed from 60 Hz to 60.36 Hz.
Energies 13 03191 g015
Figure 16. Frequency Control Experiment 3: reproduction of an actual grid event.
Energies 13 03191 g016
Table 1. Summary of the works focusing on WECC model validation.
Ref.ApplicationValidation Process
Wind plant[23]Dynamic models for modeling wind power plants.Comparing simulations to measured dynamic events.
[24]Model validation through field testing.Comparing simulations to measured dynamic events.
[25]WECC wind-turbine models within the Spanish grid.Comparing simulations to measured dynamic events.
PV plant[26]Model validation during a voltage fault.Comparing simulation to a single measured event.
[27]Validate WECC generic PV system models.Comparing simulations to the EPRI tool.
[28]Control of photovoltaic systems for voltage stability and recovery.Simulations on the IEEE voltage stability test system.
This workValidate WECC PV model performance against the NERC compliance standards using transmission network field tests.Comparing simulations to measured dynamic events.
Table 2. Volt/VAR control verification experiments: comparison of simulation and experimental results.
#Experiment DescriptionNMSE (%)NMEE (%)SE (%)
1Voltage reference step test: 1 0 . 997  p.u.0.097.20.00035
2Voltage reference step test: low impedance connection to nuclear plant0.1110.130.00087
3Reactive power reference step test: 0 50 50 0  MVAR0.069.30.0032
4Reactive power reference step test: 55 73 55 37  MVAR0.0043.40.00014
5Controlled external stimulus test: switching a capacitor bank0.0181.70.00097
Table 3. Power/frequency control verification experiment: comparison of simulation and experimental results.
#Experiment DescriptionNMSE (%)NMEE (%)SE (%)
1under-frequency response0.00161.40.0057
2over-frequency response0.00050.50.00439
3actual grid event response2.55.30.0044
Table 4. Power change calculations for frequency control.
ExperimentUnder Frequency ResponseOver Frequency ResponseActual Grid Event (Simulated/Measured)
D B (Hz)0.036
f 0 (Hz)6060/60.037
f (Hz)59.6260.3659.858/59.89
droop (%)7.59.251.67
P n o m (MW)25025024
P 0 (MW)186.525012
Δ P (MW)18.6−16.52.54/1.77
P (MW) measured205.323214.55/13.74
P (MW) based on (4), (5)205.1232.1614.54/13.77

