Article

Maximizing Solar PV Dissemination under Differential Subsidy Policy across Regions

1
Department of Global Commerce, Soongsil University, Seoul 06978, Korea
2
Department of Electrical Engineering, Soongsil University, Seoul 06978, Korea
*
Author to whom correspondence should be addressed.
These authors contributed equally to this work.
Energies 2020, 13(11), 2763; https://doi.org/10.3390/en13112763
Submission received: 6 May 2020 / Revised: 26 May 2020 / Accepted: 27 May 2020 / Published: 1 June 2020

Abstract

:
This study investigates the effect of a renewable energy dissemination policy on investment decisions regarding solar photovoltaic (PV) installation. We present a theoretical model and conduct a simulation analysis to estimate the total capacity of solar PV generators according to a given subsidy policy. We show how the capacity maximizing subsidy policy depends on the total amount of subsidy budget, interest rate, the expected amount of solar resource and land price in each region. We particularly focus on the improvements of solar PV capacities under the same subsidy budget when the subsidy policy is changed from uniform (equal for all regions) to differential (varying over regional characteristics). This improvement is shown through a case study using Korean data.

1. Introduction

To promote renewable energy, many governments have adopted various support policies such as feed-in-tariff (FIT), renewable portfolio standards (RPS), reduction in taxes, and subsidized capital costs for installments [1,2,3,4,5,6]. However, dissemination of renewable energy requires significant financial support as long as the electricity generated from renewable energy is more expensive than that generated from fossil fuels. According to the International Energy Agency’s (IEA) World Energy Outlook 2013, these subsidies amounted to USD 82 billion in 2012. In many countries, it is a declared political goal to raise the market share of renewables further, and hence, it is expected that the total amount of subsidies will also rise accordingly. In the New Policies Scenario projection, which assumes that the governments will adhere to their plans and which serves as the baseline scenario, the IEA expects subsidies to reach almost USD 180 billion per year in 2035 [7].
Owing to these support policies, the generation capacity of renewables has increased rapidly. In 2018, the annual capacity addition of renewables in the world was approximately 181 GW, which is greater than that of fossil fuel-based generators [8]. Consequently, the price of electricity generated from renewables has reached that of electricity obtained from conventional generators in some major countries, i.e., grid parity, resulting in a reduction of renewable energy subsidies. For example, China, the country with the largest investment in renewable energy in the world, has abolished the subsidy for newly installed solar photovoltaic (PV) since 2018. However, a renewable energy subsidy is still required to achieve an aggressive target for the dissemination of renewable energy, e.g., 100% renewable energy.
Germany, one of the leading countries in renewables, produced approximately 40% of its electricity from renewable resources in 2018, and set its target shares of renewable energy to 65% by 2030 [9]. German environment minister said that approximately one trillion euros will be required to achieve this target by the end of the 2030s. In the United States, the state of California established a new senate bill (SB 100) that set a target of 100% carbon-free electricity by 2045 and the state has committed an investment of USD 35 million per year [10]. In South Korea, the government aimed to install new renewable generators of capacity 48.7 GW during 2018–2030 (cumulative capacity 63.8 GW) to achieve 20% share of renewable energy generation in 2030, an increase from 7.0% in 2016. The budget allocated for renewable energy dissemination projects in 2019 was KRW 267 billion (about USD 223 million), an increase of KRW 40.3 billion (about USD 33.6 million) from the previous year, and the amount of support increased by 2.67 times over the last three years.
In this article, we address how to achieve the renewable dissemination target with minimum support budget spending. We focus on a subsidy policy for solar PV generators. Solar PV, one of the most widely used renewable energies, accounted for approximately 100 GW of the total renewable capacity of 181 GW installed in 2018 [8]. Moreover, solar PV can be installed over any area because of its flexible size. For example, solar PV can be installed in a very small area such as on a rooftop or balcony in a residential home with a capacity of a couple of watts or in a large-scale generation site with a capacity of hundreds of MW. Other renewable generators such as wind, hydro, and geothermal are normally implemented on a large scale.
To achieve the aforementioned ambitious renewable targets, small-scale solar PV, as well as utility-scale solar PV, is important because it can be easily installed in urban areas [11]. According to German statistics in 2017, generators of capacity less than 100 kW account for more than half the total capacity of solar PV generators [12]. Particularly, generators of capacity less than 10 kW account for approximately 14.2% of the total solar PV capacity. Furthermore, residential PV installation capacity increased by approximately 76% in the first quarter of 2015 [13]. Unlike utility-scale solar PV, in many countries, small-scale solar PV has not become sufficiently price competitive yet. Therefore, a relevant subsidy policy is still required. Because the owner of a small-scale solar PV system mainly consumes most of the electricity generated by it, the main promotion policies are installation cost subsidies provided to the owner as tax refund or direct subsidy. Therefore, in this study, a direct subsidy policy for small-scale solar PV generators is considered. These small-scale solar PV generators are normally connected to distribution networks [14]. With a high penetration of renewable generation, distribution networks may have some problems such as reverse power flow, voltage fluctuations, power quality issues, and dynamic stability [15]. To solve them, the system operator uses several control entities and strategies including on-load tap changer (OLTP), voltage regulator, and batteries [16,17,18,19]. In this study, we assume that these technical issues raised by installing solar PV in the distribution network can be properly solved through these strategies.
We investigate how to allocate a given subsidy budget economically to achieve a renewable power capacity goal. Accordingly, we provide a theoretical model regarding the decision-making approach for each region’s investment in solar PV installations at the regional-level according to the given subsidy policy. In addition, considering regional investment decisions under these subsidy policies, we theoretically describe the issue of where and how much the central government should allocate subsidy to minimize the budget. We examine the characteristics of the optimal policy through comparative static analysis, and by using real data for obtaining the results of the theoretical analysis, we estimate the additional expected capacity of solar PV installations from the change in the subsidy policy with the same budget.
The novelty of this study is as follows. First, we clearly focus on the objective of the government to maximize installed capacity through subsidy policies. Although there are several studies on the promotion of renewable energy, only a few studies explicitly consider an optimal subsidy policy to maximize renewable power capacity [20,21,22,23]. For example, Bläsi and Requate [20], and Reichenbach and Requate [21] considered studying the spillover effects of capacity production and examined how to optimize the output subsidies for renewable energy producers. However, in these models, “capacity” is simply described as the number of firms, and hence, the installation capacity of each subject is not considered. Andora and Voss comprehensively studied the properties of an optimal renewable energy subsidy policy by using the framework of a competitive peak-load pricing model [22]. According to these authors, the objective of a policy is not to maximize installed capacity, but to maximize the social welfare, which consists of consumer surplus and producer surplus. Second, to the best of our knowledge, this is the first study to allow heterogeneity in regions and examine how an optimal subsidy policy should be region-specific (referred to as differential subsidy) in the context of solar PV dissemination.
As a main result, we show how the optimal subsidy policy should reflect the heterogeneous characteristics of each region in terms of different installation costs and power generation efficiencies. Based on our simple theoretical model, we also present a case study using Korean data to show the additional PV installation capacity expected with the same subsidy budget (or the amount of budget that can be saved to achieve the same installation target) by simply switching from the uniform to differential subsidy policy. This case study confirms that the differential subsidy policy raises the total installed capacity of solar PV generators. In addition, we discuss the difference between capacity and energy maximization policies using the same Korean data.
The rest of this paper is organized as follows. Section 2 describes the theoretical model and then examines the characteristics of regionally differentiated subsidies to economize renewable energy budgets. In Section 3, numerical and case study results are presented. For the case study, we introduce the relevant data of Korea’s metropolitan cities and provinces used; explain the relevant assumptions; and estimate the additional supply capacity expected under the same budget if the previous theoretical analysis results are applied. Section 4 discusses the difference between capacity and energy maximization policies. Finally, in Section 5, the paper is summarized and the implications drawn are presented.

2. Analytical Model

In this section, we present a theoretical model regarding the effect of government subsidies on the investment decisions on solar PV installation in each region. It is assumed that solar PV potentials in each region are properly estimated [24,25,26]. We adopt a two-stage decision-making approach. At the first stage, the government chooses its subsidy policy to maximize the nationwide capacity of solar PV. At the second stage, given the policy, each region makes its regional investment decisions on the amount of solar PV generators. Because backward induction will be used to obtain a solution, we first consider how to model the regional-level decision-making at the second stage.

2.1. Regional-Level Optimization: Investment Decisions

Under a given subsidy policy, the decisions at each regional-level can be described in another two sub-stages: in sub-stage 1, decisions are made regarding long-term investments, such as whether to invest and how much to invest in solar PV generators. Given the power capacity determined in sub-stage 1, in sub-stage 2, a decision is made regarding short-term operation to determine how much electricity is required from the main grid. The objective of each region is to minimize the sum of costs from these two sub-stages. In this study, we assume an operational period of 30 years according to the average lifespan of a solar panel, and I is the set of candidate regions for the installation of solar PV.
In sub-stage 1, i.e., the long-term investment cost of the region i, C i I , can be determined as
C i I ( z i , G i ; s i ) = z i · ( F i + a i G i 2 + b i G i s i G i ) , i I
where z i is a binary variable representing the investment decision of the region i (1 and 0 indicate investment and no investment, respectively.), F i is the fixed cost of investment (USD), G i is the capacity of the solar PV generators to be installed in region i (kW), and s i denotes the subsidy in region i per capacity ($/kW). The investment cost coefficients of region i are represented by a i and b i . For simplicity, we set the constant F i to be zero. Moreover, we assume that the long-term investment cost function follows a convex quadratic function. This reflects the land price component of the solar PV installation cost. With greater solar PV capacity, land having higher price per unit tends to be used. The intuitive meaning of each coefficient is as follows. The coefficient b i can be understood as the average land price in the region i whereas a i is its variance within the region. That is, a region with high a i indicates the one where the investment cost is rising steeply as more capacity is installed. The subsidy s i is paid for each installed capacity G i , and hence, it is expressed linearly in (1).
In the sub-stage 2, the short-term operation cost of region i, C i O , is determined. To this end, we need to define the daily operational power supply and demand. On the supply side, the supply of electricity at each time t consists of the amount of electricity purchased from the main grid q i t and the amount of electricity generated by the region’s own solar PV g i t . The amount of electricity generated by the region i’s own generators is limited by the installed capacity at stage 1 G i and the generation efficiency η i t . That is,
g i t G i η i t , t , i I .
On the demand side, we assume that the regional power demand in each period t, d i t , is exogenously given. Therefore, to satisfy the local electricity demand in region i at time t, the amount of electricity to be purchased can be obtained by
q i t = d i t g i t . t , i I
Accordingly, we can determine the daily operation cost C i O . As the amount of locally generated electricity g i t is determined by the installed capacity G i , the cost at the sub-stage 2 consists only of the buying cost of electricity from the main grid. It can be expressed as the sum of the product of the purchased amount of electricity { q i t } t and its price { p i t } t over the entire period. Therefore, the daily cost of electricity at the sub-stage 2 is defined as
C i O ( { q i t } t ) = t p t q i t .
The total cost of region i, C i T , consists of the sum of the long-term investment costs and the short-term operating costs. In this study, we assume that the entire period of sub-stage 2 is a day and the operating cost at the investment decision stage can be evaluated by the time discount δ . We may consider δ k = 1 K 1 ( 1 + r k ) k where K is the lifespan of 30 years and r k is the interest rate in period k. The total cost of region i can be expressed as
C i T ( z i , G i , { q i t } t ) = C i I ( z i , G i ) + δ · C i O ( { q i t } t ) .
Finally, we can define the cost minimization problem of a region i as follows:
min G i , { q i t } t C i T s . t . ( 2 ) and ( 3 )
For the decision whether to invest or not, we may consider that the investment is made only if the total cost of installing solar PV is lower than the total cost of not installing it. Note that the total cost for a region under no investment is equal to the buying cost from the main grid to satisfy its demand without local power supply. Thus, the investment decision can be expressed as
z i = 1 , if C i T δ t p t d i t 0 , otherwise .
To solve the above regional-level decision-making, the cost minimization problem under investment can be expressed as a Lagrange function for the cost minimization problem (6) as
L = a i G i 2 + ( b i s i ) G i + δ t p t q i t + β i t i d i t q i t G i η i t ,
where β i t is the Lagrangian multiplier for constraint (2). The first order conditions (FOC) of an optimal investment size G i and an optimal amount of electricity purchased from the main grid q i t are as follows:
F O C G i : 2 a i G i + ( b i s i ) = δ t β i t η i t F O C q i t : p t = β i t , t
F O C G i indicates that the optimal installation capacity G i should be determined at the level where the marginal cost of the investment coincides with the marginal benefit from electricity generation realized by this investment. F O C q i t indicates that q i t should be determined when the electricity price of the main grid p i coincides with the marginal benefit of this purchase, that is, the shadow price of investment cost saving owing to this electricity buying β i t . Summarizing these FOCs and Equation (3), we can obtain G i and q i t as
G i = 1 2 a i δ t p i η i t ( b i s i )
q i t = d i t η i t G i , t
Note that, in reality, there are more factors that affects the investment of solar PV generators such as law and policies. In this work, however, we focus on the economic part to obtain the most economical solution.
Based on Equations (9) and (10), a condition for investment, i.e., Equation (7), can be summarized as follows:
Proposition 1.
z i = 1 i f δ t p i η i t > b i s i .
This means that region i decides to install solar PV generators when the savings from the investment of the generators δ t p i η i t is greater than the net investment cost minus subsidies b i s i . In addition, it shows how the investment choice is related to the subsidy s i , which is the main variable in this study. Thus, we are ready to answer what subsidy policy can maximize solar PV dissemination with a given subsidy budget? in the following sections. Conversely, what subsidy policy can minimize the subsidy budget to achieve a given dissemination target?

2.2. Social-Level Optimization: Maximizing the Dissemination of Solar PV Capacity with a Budget Constraint

Now, let us consider the government’s choice in the subsidy allocation problem at the first stage. Suppose that the objective of the government is to maximize the solar PV capacity with a given subsidy budget S ¯ .
max { s i } i i G i
s . t . i s i G i S ¯
s i 0 , i I
As the optimal installation capacity of each region is determined under a given subsidy policy, it can be understood that the subsidy policies are decided by policy makers in anticipation of these regional investment decisions. Therefore, we can substitute Equation (9) into Equation (11) and express G i as a function of s i . The Lagrangian equation for Equation (11) to solve the optimal subsidy problem is
L = i 1 2 a i δ t p t η i t + s i b i + λ S ¯ i s i 2 a i δ t p t η i t + s i b i + i μ i s i ,
where λ and μ i are Lagrangian multipliers for (12) and (13). Hereafter, for convenience, the market value per unit of solar PV capacity in region i δ t p t η i t will be denoted by e i , and is referred to as the marginal benefit of investment. The solution can be summarized as follow. Note that a solution to the above problem is also a solution for minimizing the subsidy expenditure to achieve the dissemination target according to the duality.
Proposition 2.
The optimal differential subsidy policy for each region i s i will be
s i S ¯ , { a j } j , { b j } j , { e j } j = max 0 , 1 2 S ¯ + j j + e j b j 2 8 a j j j + 1 4 a j 1 2 1 2 ( e i b i ) ,
where j + is a set of subsidized regions which can be formally defined as
j + = i I | ( e i b i ) 2 < 2 S ¯ + j j + e j b j 2 8 a j j j + 1 4 a j .
For detailed proof, see Appendix A.
Proposition 2 means that once a subsidy is provided, its optimal size equals the non-zero term in Equation (15). The criteria which region will receive a non-zero subsidy can be determined from Equation (16), and it is referred to as call it the eligibility condition. To get an intuition of the optimal subsidy and the eligibility condition, let us consider a special case of ( a i , b i , e i ) = ( a , b , e ) , i I where all the regions are under the same condition. Then, the eligibility condition becomes S ¯ > 0 which is always satisfied. Furthermore, the optimal subsidy for each region becomes
s = 1 2 4 a S ¯ N + ( e b ) 2 2 1 2 1 2 ( e b ) .
From Equation (17), we can obtain some useful comparative static results. (1) The subsidy per unit increases as the subsidy budget increases ( s i S ¯ > 0 ), and (2) the subsidy per unit decrease as the number of subsidized regions N + increases ( s i N + < 0 ). Subsequently, to further explore the intuition of the eligibility condition from another aspect, consider the situation where n 1 subsidized regions have the same variable values but one region i has different value. Then, the eligibility condition is simplified as follows.
( e i b i ) 2 ( e b ) 2 4 a < S ¯ n 1
This indicates that a region whose marginal net benefit ( e i b i ) is nearly smaller than that of subsidized regions ( e b ) by as much as the amount of average subsidy ( S ¯ n 1 ) is also eligible to be subsidized. Finally, we can summarize how optimal subsidies per unit solar PV capacity should be designed according to the variables related to the marginal investment cost { a i } i , { b i } i and marginal investment benefit { e i } i as Corollary 1.
Corollary 1.
For a region i∈ j + , s i a i > 0 , s i b i > 0 , and s i e i < 0 .
Among the subsidized regions, the larger the marginal investment cost ( a i , b i ) or the lower the marginal investment benefit e i , the greater should be the subsidy s i to be provided. At first glance, the opposite may be desirable, but this is a well-known public goods provision result in economics (e.g., emission trading studies), which is the optimality achieved when the marginal costs across regions are equal. In our context, a region where the net benefit of ’per-unit’ investment of solar PV generator is low will install only small or no solar PV generators, and hence, the marginal cost of investment of the region remains low. This allows greater room for the region to invest until its marginal cost reaches the average marginal costs in the subsidized regions.
In addition, we can observe how the optimal subsidy needs to be adjusted according to the changes in the other variables of the market value per unit of solar PV capacity in region i e i : they are the market interest rate δ , power purchase price p t , and the amount of solar resources by region η i t ; s i δ < 0 , s i p t < 0 , and s i η i t < 0 .
From these results, we can design how subsidy provision should be customized for each region to maximize the solar PV capacity with limited budgets. In the following section, we will consider how to estimate the amount of solar PV capacity that can be additionally expanded when our differential subsidy policy is applied by using real data.

3. Evaluations

In this section, we first evaluate the proposed differential subsidy policy numerically, and then demonstrate its superior performance compared with that of the the uniform policy through two case studies. One case study uses artificial parameters to show the gain of the proposed policy, while the other case study uses real data from Korea.

3.1. Numerical Result

Figure 1 plots the optimal capacity of solar PV G for the cost minimization problem (6). The capacity of solar PV linearly decreases as b s increases, and it decreases with an increase in a in a 1 / x form. Furthermore, according to Proposition 1, when b s is lower than δ t p t η t , this region does not install solar PV generators. Note that, in this numerical result, we use δ t p t η t = 900 .
The numerical results under the differential subsidy policy are shown in Figure 2. In this case, it is assumed that all the regions are under the same condition, that is, Figure 2 is a graph of (17). Intuitively, the amount of subsidy increases with an increase in S ¯ and decreases with an increase in N as shown in Figure 2a. Figure 2b shows s versus a and e b with S ¯ = 10 , 000 , 000 and N = 10 . The amount of subsidy increases with an increase in a and b because the initial capacity of solar PV is low when the investment cost is high. Owing to the same reason, s decreases with an increase in e.

3.2. Case Study 1

We investigate two case studies for the differential subsidy policy. The first case is a simple and artificial case to observe the effect of the parameters clearly. There are three regions and three subsidy policies: no subsidy, uniform subsidy, and differential subsidy policies. The total amount of subsidy S ¯ is USD 100,000. Table 1 shows the basic parameters and results of this case study. The three regions have different characteristics: Because a and b are parameters of the investment cost C I in Equation (1), great values of them means high investment cost in the region, i.e., regions A and B. Futhermore, because e stands for the market value per unit of solar PV capacity, a region that has high value of e means a good solar resource region, i.e., region C.
In regions A and B, e i b i s i , and hence, they do not install solar PV with s i = 0 according to Proposition 1. This indicates that only region C is suitable to invest solar PV because of an abundance of solar resource and low investment cost. Under the uniform subsidy policy, region A installs some solar PV generators as it now satisfies Proposition 1 while region B still does not invest in solar PV. Futhermore, the capacity of solar PV in region C slightly increases due to the subsidy. The total increase of the capacity of solar PV is 4.56% compared with that under no subsidy. On the other hand, the capacity of solar PV in region C remains the same under the differential subsidy policy. In this case, only region A receives a meaningful subsidy, and hence, the capacity in the region increases significantly, and the other regions experience no additional installation. The capacity increase gain is 7.74% in comparison with that of the uniform subsidy policy.
This result may seem counter-intuitive at first glance because providing higher subsidies to an economically viable region may appear to be the optimal policy to maximize solar PV capacity. However, the optimal subsidy is allocating a subsidy of USD 0 to a region with abundant solar resources in this example. The reason for this is as follows. First, economically viable regions invest in solar PV regardless of subsidies, whereas subsidies for non-viable regions convert non-installed regions into installed ones. That is, an extensive margin effect is created. Second, economically viable regions have a greater incentive to invest in more installations, and thus require greater amounts of subsidy than non-viable ones. Notice that the viable regions reach higher marginal costs because the investment cost is strictly convex. Note that, to achieve greater installation capacity with a limited subsidy budget, it is optimal to equalize the marginal costs (which include subsidies) across all the regions. That is, the optimal subsidy policy is to provide lower subsidy to more economically viable regions to dampen their marginal costs while providing higher subsidies to less viable regions to boost their marginal costs. The intuition behind this optimality condition which is to equalize marginal costs across regions, is similar to the one in the Emission Trading Scheme. For the detail, see [27], p. 215.

3.3. Case Study 2

In the second case study, we investigate the proposed differential subsidy policy using real data from Korea. Korea consists of 17 first-tier administrative divisions in terms of metropolitan cities and provinces. We assume that the total budget to promote solar PV generators is ten million dollars, i.e., S ¯ = 10,000,000 .

3.3.1. Parameter Settings

Generation Efficiency for Solar PV Generators η : We use solar resource data of a 20-years average value for Korea (1988–2007) based on a report published by the Korea Meteorological Administration (KMA) [28]. The average annual solar radiation was the highest at Mokpo at 5110.39 MJ/m 2 and the lowest at Seoul at 4143.82 MJ/m 2 . The average yearly duration of sunshine is 2122.5 h, that is, the average daily duration of sunshine is 5.8 h. We assume that the power output of the solar PV generator is directly proportional to the solar radiation. In addition, the annual utilization rate of solar PV generators was 15.3% in 2018 according to the Ministry of Trade, Industry and Energy. The definition of the utilization rate in this work is the ratio between the actual generated amount of electricity from solar PV generators and the maximum amount of electricity from them. For example, a solar PV whose capacity is 10 kW generated 40 kWh in a day. Then, the utilization rate is 40 kWh/(10 kW × 24 h) = 16.7%. The utilization rate of 15.3% is an average value of all solar PV generators in Korea in 2018.
Using these data, we set the hourly generation efficiency η i t .
Installation Cost for Solar PV Generators a and b: Solar generator installation costs can be classified into fixed and variable costs. Examples of fixed costs are costs of solar panels, junction boxes, and inverters. On the other hand, variable costs heavily depend on the regions. If the land price is high [low], variable costs are also high [low]. To estimate the variable costs in each region, we use the official land price announced by the Ministry of Land, Infrastructure and Transport. (Public Data Portal, Standard Bulletin, https://www.data.go.kr/dataset/15004246/fileData.do) From the average value of the official land price in each region, the coefficient values of investment cost a i and b i are obtained.
Economic Benefits from Solar PV Generation p t and δ : In this case study, it is assumed that there is no reverse power flow beyond substations. That is, all the electricity generated by solar PV is consumed in the substation area. Therefore, the economic benefit from the solar PV originates from reducing electricity bills by self-consumption, i.e., the buying price of electricity. We use a time of use (TOU) price offered by Korea Electric Power Corporation (KEPCO). The electricity price is set as USD 0.051/kWh, USD 0.07/kWh, and USD 0.096/kWh during off-peak, shoulder, and peak period, respectively. More detailed information on electricity price is given in KEPCO web site at https://home.kepco.co.kr/kepco/EN/F/htmlView/ENFBHP00102.do?menuCd=EN060201. In addition, we set the time discount δ to be 5.5% per year.
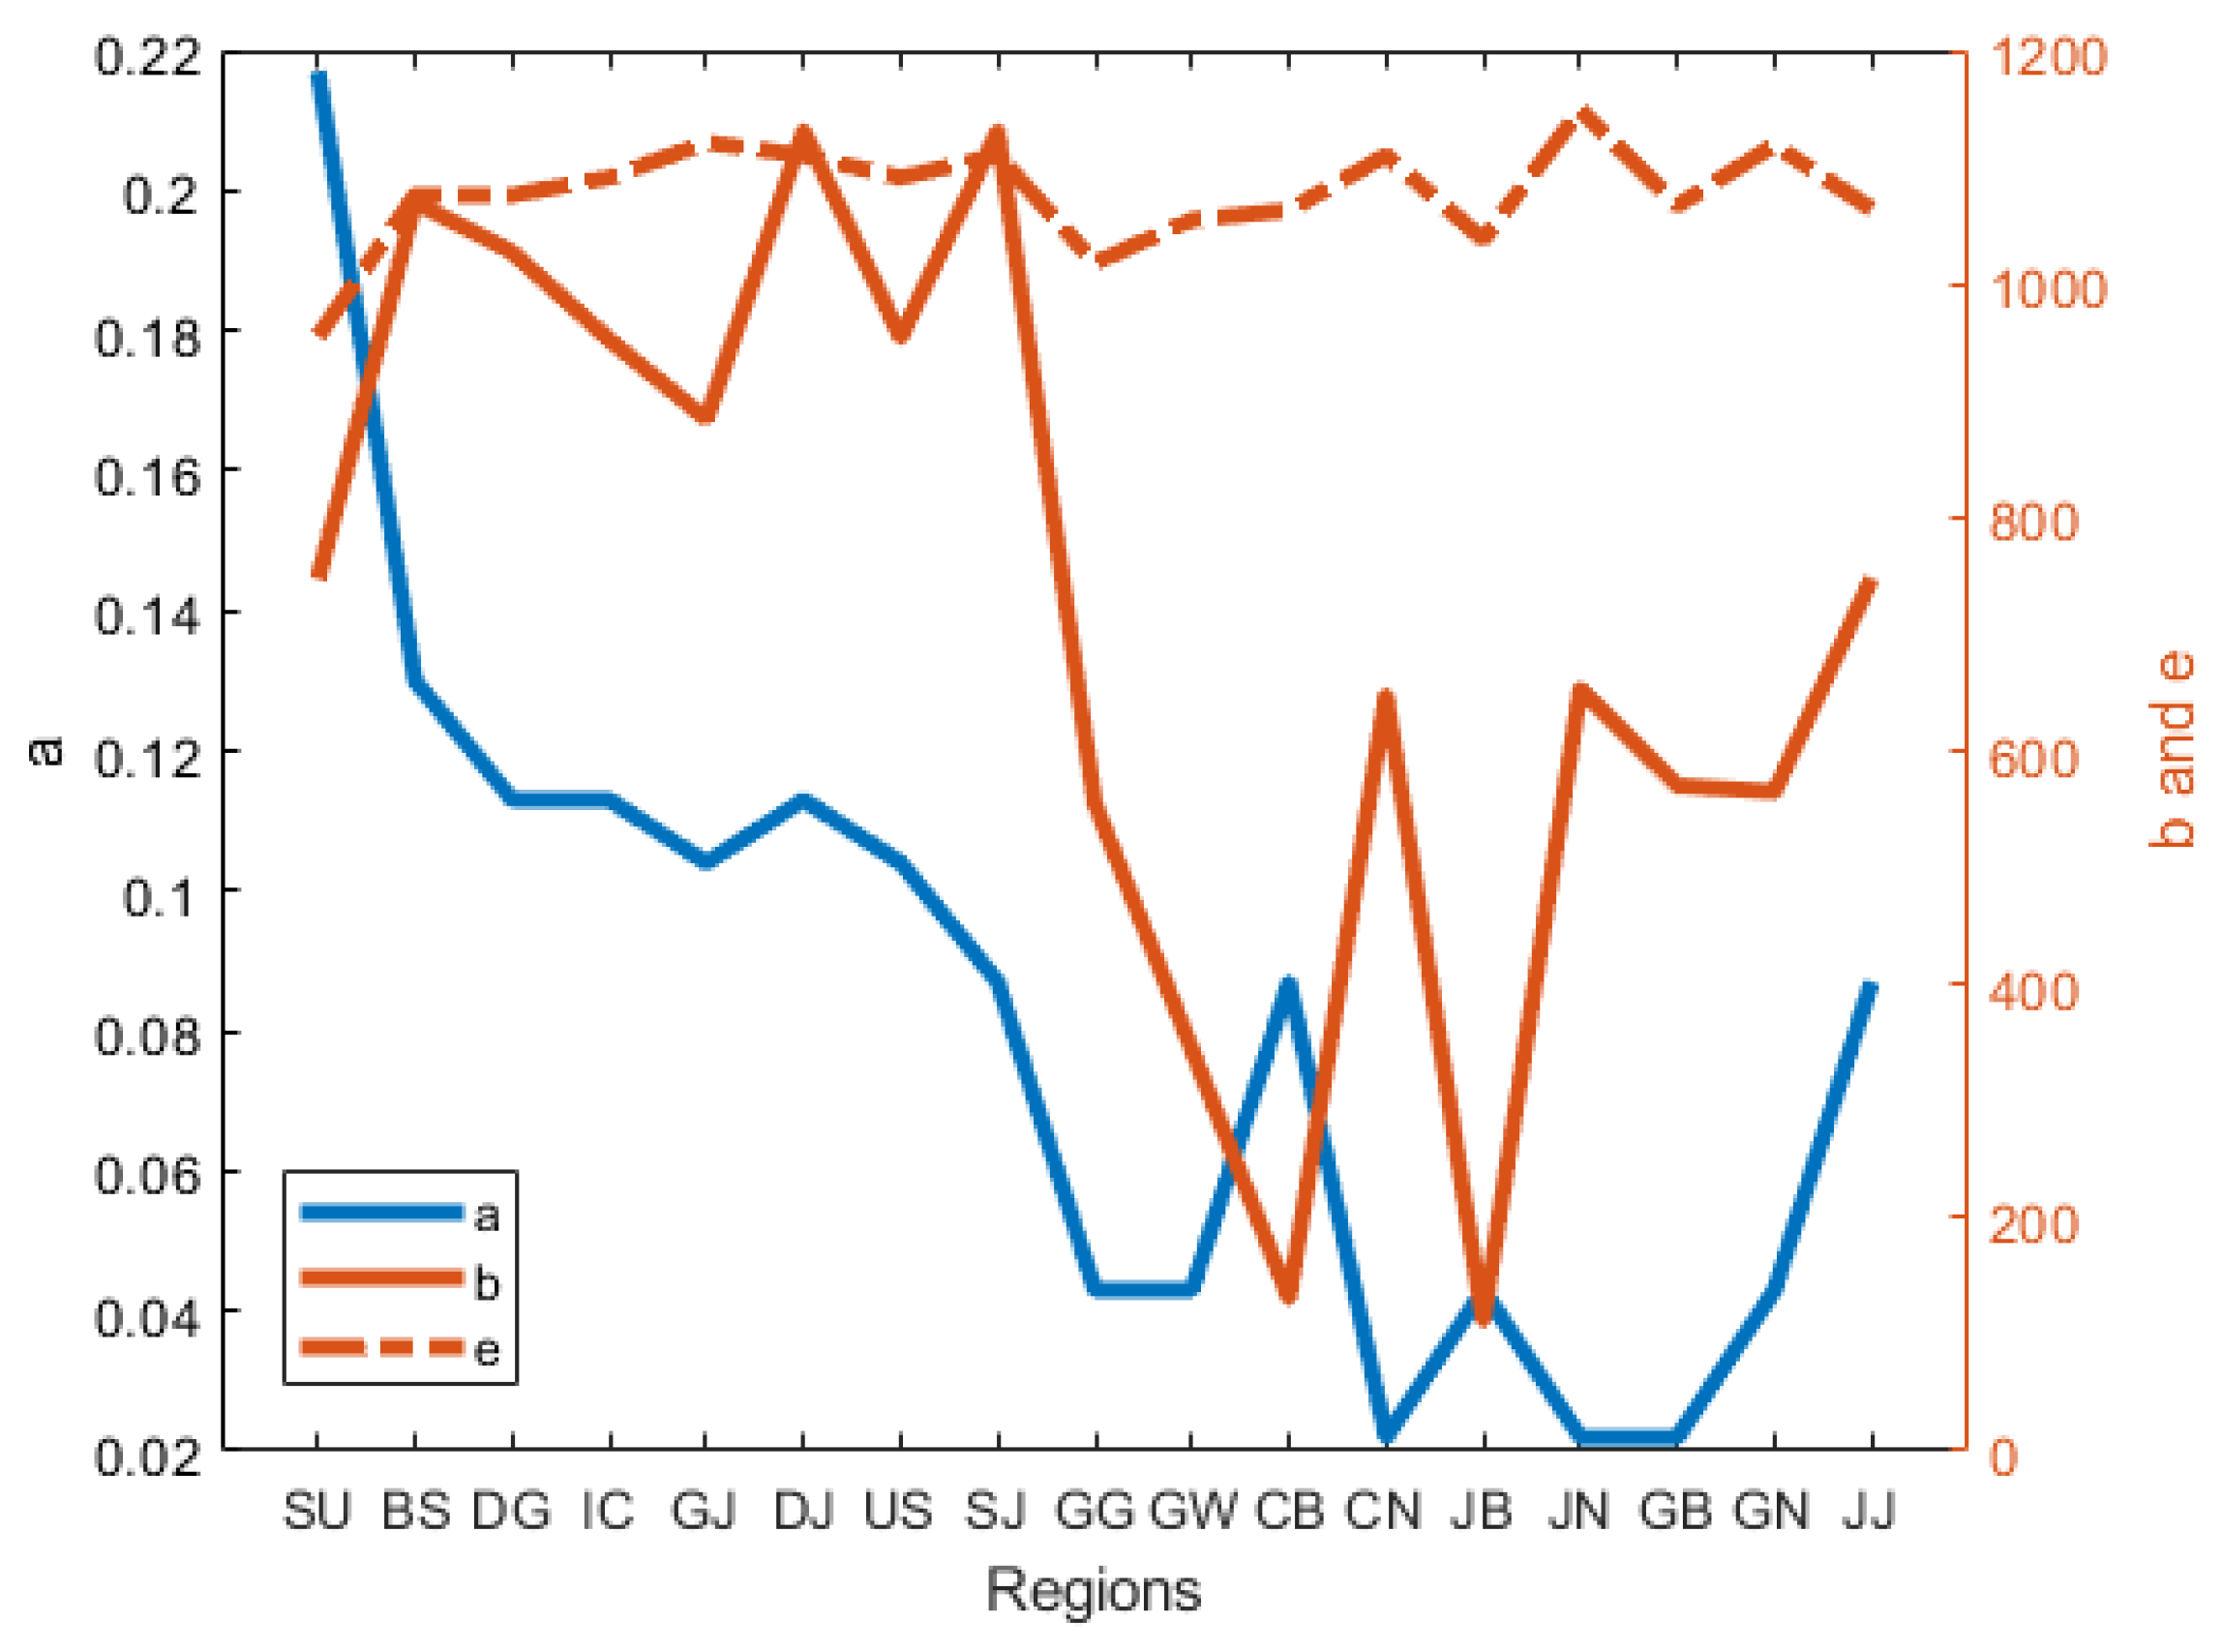
Using the above assumptions and data, we set a i , b i , and e i = δ t p t η i t . These parameter settings for case study 2 are shown in Figure 3. In this graph, a i follows the left y-axis, and b i and e i follow the right y-axis. Regions SU to SJ are metropolitan cities, and hence, the investment costs are higher than those in other regions resulting in high a i and b i . Regions SU and JN have the least e S U = 955 and most e J N = 1149 solar resources, respectively.
Note that the simulation analysis results in this case study suggest the basic direction for the practical application of the theoretical model. For practical applications, more realistic delimitation of relevant coefficients and the estimation of key coefficients need to be further studied.

3.3.2. Simulation Results

The result of case study 2 is shown in Figure 4. The proposed differential subsidy policies are compared with the no subsidy and uniform subsidy policies. Figure 4a shows the capacities of installed solar PV for different subsidy polices. Because of the high land price, the metropolitan cities (regions from SU to SJ) do not install a considerable number of solar PV generators. In contrast, the other regions, i.e., provinces, install a considerable number of solar PV generators. Without subsidy, regions DJ and SJ do not install solar PV at all according to Proposition 1, and the total capacity of solar PV generators is 74,580 kW. With the total subsidy of USD 10,000,000, the capacity increases by approximately 23%. Under the uniform subsidy policy, all the regions receive the same subsidy of USD 108 per kW, resulting in a total capacity of 91,851 kW of solar PV generators. In addition, the differential subsidy policy increases the total capacity further to 95,271 kW, i.e., a 3.72% increase compared with the uniform subsidy policy.
To maximize the total capacity of solar PV generators, the government needs to provide a more aggressive subsidy to regions with relatively scarce solar resources such as regions SU to SJ as shown in Figure 4b. Particularly, the two regions (DJ and SJ) that installed zero capacity under the uniform subsidy policy receive the greatest subsidies under the differential scheme. According to Proposition 2, the amount of subsidy for each region i heavily depends on e i b i (the marginal net benefit). This is confirmed by the simulation result of this case study. As the regions DJ and SJ have the least e i b i , they receive the greatest subsidies. In contrast, the three regions GW, CB, and JB that have the greatest e i b i receive zero subsidies.
Note that the lifespan of solar panels can be changed according to maturity of the PV panel manufacture. When the lifespan increases, the time discount δ also increases resulting in an increase of e i . Because e i stands for the market value per unit of solar PV capacity in region i, i.e., e i = δ t p t η i t , an increase of lifespan promotes more installation of solar PV generators G i . Therefore, the subsidy per capacity s i decreases because the installation capacity of solar PV generators increases.

4. Discussion

So far, we have considered that the objective of a dissemination policy is to maximize the total capacity of solar PV generators. Although such an assumption is a typical observation in many countries, there may be several other possible objectives of a dissemination policy such as energy generation maximization and CO 2 emission minimization. To consider how different objectives may affect our result, in this section, we focus on a case when the dissemination objective is to maximize the energy generation itself rather than its capacity. For an energy generation maximization problem, we need to convert Equation (11) into
max { s i } i i t G i η i t s . t . i s i G i S ¯ s i 0 i I
Although we do not provide a closed-form solution here, it is expected that the results are similar to the capacity maximization problem in that the energy maximization problem is a variation of it. The only difference is that the energy maximization policy places more weight on e i , that is, it focuses more on the solar resources in the region. Thus, we can expect that it will lead to a more favorable subsidy provision to energy-efficient regions than capacity maximization does.
Figure 5 shows the difference G i and s i between the capacity maximization and energy maximization policies with the Korean data in Section 3.3. The differences G i and s i follow the left y-axis, and e i follows the right y-axis. The difference value is defined as G i or s i under the energy maximization policy minus that under the capacity maximization policy. That is, a positive value indicates that the energy maximization policy installs more generators. As shown in Figure 5, e i and the difference are highly correlated. The most abundant and scarce solar areas in case study 2 are regions SU and JN, respectively. Therefore, this policy provides higher and lower subsidies to different regions compared with the capacity maximization policy. In regions GW, CB, and JB, there is no difference between the two policies because they do not receive any subsidy under the both subsidy policies. Except the three regions, when a region i has an e i value less [greater] than 1100, the region will install less [more] solar PV generators. The total installed capacities of solar PV generators are 95,238 kW and 95,271 kW for the energy and capacity maximization policies, respectively. However, their yearly energy outputs from the solar PV generators are 120,471 MWh and 120,430 MWh, respectively. Note that the energy output under the uniform subsidy policy is 115,972 MWh. The gain of the energy maximization policy is 3.88%.
The simulation result confirms that the energy efficiency e i is more effective to determine the amount of subsidy. However, the difference between capacity max or energy max may not be critical in terms of the total results (i.e., total energy and total capacity) although it may depend on the solar resource distribution in each country.

5. Conclusions

We considered how a regionally differentiated subsidy policy can improve the total capacity of solar PV generators in a society under a limited subsidy budget. We showed that a simple rule of an optimal subsidy policy is to allocate subsidies to equalize regional marginal net benefits of all the eligible regions. According to this rule, it is desirable to provide higher subsidy per unit capacity to regions where investments are not made without subsidy or only small investments are expected. We also used this model to estimate the maximum possible capacity of solar PV generators under the given budget. By using the actual data, we showed the improvement of dissemination that can be achieved by a policy change from uniform to differential subsidization under the same budget. The specific subsidy rate for each region could be calculated using the total subsidy budget size, interest rate, solar resource, and land price in each region.
The limitation of the study is that our results are based on somewhat strong assumptions such as convex investment cost function and monotonically increasing marginal net benefits. As mentioned above, to apply our method to an actual policy, it would be necessary to conduct a full-scale estimation of the cost and benefit function. Nevertheless, our findings are not necessarily confined to the national level. They may also be applicable at the local municipal or even international level, such as renewable energy dissemination projects in developing countries by international organization funds.

Author Contributions

Conceptualization, J.S. and S.-G.Y.; Methodology, J.S.; Software, S.-G.Y.; Validation, J.S. and S.-G.Y.; Formal Analysis, J.S.; Investigation, J.S.; Resources, S.-G.Y.; Data Curation, S.-G.Y.; Writing—Original Draft Preparation, J.S. and S.-G.Y. All authors have read and agreed to the published version of the manuscript.

Funding

This research was supported in part by Soongsil University Research Fund (Convergence Research) of 2017, and in part by the Korea Electric Power Corporation (Grant number: R18XA04).

Conflicts of Interest

The authors declare no conflict of interest.

Appendix A. Analytic Solution for Social-Level Optimization

The Lagrangian equation for maximizing solar PV capacity with a budget constraint is
L = i 1 2 a i e i + s i b i + λ S ¯ i s i 2 a i e i + s i b i + i μ i s i .
The Karush–Kuhn–Tucker (KKT) conditions for this optimization problem are
μ i s i = 0 , i I
μ i 0 , i I
s i 0 , i I
λ 0
L s i = 1 2 a i λ 1 2 a i e i + 2 s i b i + μ i , i I
λ S ¯ i s i 2 a i e i + s i b i = 0
To find a solution, let us use (A5) first. If λ = 0 , μ i = 1 2 a i < 0 which is not possible. Therefore, we observe that λ > 0 , subsequently the budget constraint is binding by (A7). That is,
i s i 2 a i e i + s i b i = S ¯ .
For region i with μ i > 0 , the optimal subsidy s i = 0 , thus μ i = 1 2 a i λ e i b i 1 by (A6). For region i with μ i = 0 , s i > 0 . Thus, the following condition should be satisfied by (A6):
λ = 1 e i + 2 s i b i .
By using (A8) and (A9), we can determine λ . We have
λ = 1 2 j j + 1 4 a j S ¯ + j j + e j b j 2 8 a j 1 2
As s i = 1 2 1 λ e i b i for i j + , the optimal subsidy of region i can be obtained as
s i = 1 2 S ¯ + j j + e j b j 2 8 a j j j + 1 4 a j 1 2 e i b i for i j +
= 0 , otherwise .

References

  1. Renewable Energy Target—An Australian Government Scheme. Available online: http://www.cleanenergyregulator.gov.au/RET/ (accessed on 6 May 2020).
  2. RES LEGAL 2019. EEG Feed-in Tariff in Germany. European Commission. 2019. Available online: http://www.res-legal.eu/search-by-country/germany/single/s/res-e/t/promotion/aid/feed-in-tariff-eeg-feed-in-tariff/lastp/135/ (accessed on 6 May 2020).
  3. Ministry of New and Renewable Energy Government of India. National Solar Mission—Gentral Financial Assistance (CFA). Available online: https://mnre.gov.in/img/documents/uploads/file_f-1585710569965.pdf (accessed on 6 May 2020).
  4. International Institute for Sustainable Development. India’s Energy Transition: Mapping Subsidies to Fossil Fuels and Clean Energy in India GSI Report; International Institute for Sustainable Development: Winnipeg, MB, Canada, 2017; Available online: https://www.iisd.org/sites/default/files/publications/india-energytransition.pdf (accessed on 6 May 2020).
  5. Tanzania’s SE4ALL Action Agenda; Ministry of Energy & Minerals: Dar es Salaam, Tanzania, 2015. Available online: https://www.seforall.org/sites/default/files/TANZANIA_AA-Final.pdf (accessed on 6 May 2020).
  6. Kwon, T.H. Policy Synergy or Conflict for Renewable Energy Support: Case of RPS and Auction in South Korea. Energy Policy 2018, 123, 443–449. [Google Scholar] [CrossRef]
  7. International Energy Agency. World Energy Outlook 2013; International Energy Agency: Paris, France, 2013; Available online: https://webstore.iea.org/world-energy-outlook-2013 (accessed on 6 May 2020).
  8. REN21. Renewables 2019 Global Status Report 2019; REN21 Secretariat: Paris, France. Available online: https://www.ren21.net/gsr-2019/ (accessed on 6 May 2020).
  9. IEA. Germany 2020; IEA: Paris, France, 2020; Available online: https://www.iea.org/reports/germany-2020 (accessed on 6 May 2020).
  10. Senate Bill (SB) 100. 10 September 2018. Available online: https://www.energy.ca.gov/sb100 (accessed on 6 May 2020).
  11. Rodrìguez, L.R.; Duminil, E.; Ramos, J.S.; Eicker, U. Assessment of the photovoltaic potential at urban level based on 3D city models: A case study and new methodological approach. Sol. Energy 2017, 146, 264–275. [Google Scholar] [CrossRef]
  12. Lettner, G.; Auer, H.; Fleischhacker, A.; Schwabeneder, D.; Dallinger, B.; Moisl, F.; Roman, E.; Velte, D.; Ana, H. Existing and future PV prosumer concepts. Technische Universitaet Wien, Fundacion Tecnalia Research & Innovation, with the Collaboration of PVP4Grid Consortium. Available online: https://www.pvp4grid.eu/wp-content/uploads/2018/08/D2.1_Existing-future-prosumer-concepts_PVP4Grid_FV.pdf (accessed on 6 May 2020).
  13. Palmintier, B.; Broderick, R.; Mather, B.; Coddington, M.; Baker, K.; Ding, F.; Reno, M.; Lave, M.; Bharatkumar, A. On the Path to SunShot: Emerging Issues and Challenges in Integrating Solar with the Distribution System; Nrel/Tp-5D00-6533, Sand2016-2524 R; U.S. Department of Energy: Washington, DC, USA, 2016.
  14. Appen, J.V.; Braun, M.; Stetz, T.; Diwold, K.; Geibel, D. Time in the Sun: The Challenge of High PV Penetration in the German Electric Grid. IEEE Power Energy Mag. 2013, 11, 55–64. [Google Scholar] [CrossRef]
  15. Olowu, T.O.; Sundararajan, A.; Moghaddami, M. Sarwat, A.I. Future Challenges and Mitigation Methods for High Photovoltaic Penetration: A Survey. Energies 2018, 11, 1782. [Google Scholar] [CrossRef] [Green Version]
  16. Aleem, A.A.; Hussain, S.M.S.; Ustun, T.S. A Review of Strategies to Increase PV penetration Level in Smart Grids. Energies 2020, 13, 636. [Google Scholar] [CrossRef] [Green Version]
  17. Martins, V.F.; Borges, C.L.T. Active distribution network integrated planning incorporating distributed generation and load response uncertainties. IEEE Trans. Power Syst. 2011, 26, 2164–2172. [Google Scholar] [CrossRef]
  18. Mehmood, K.K.; Khan, S.U.; Lee, S.J.; Haider, Z.M.; Rafique, M.K.; Kim, C.H. A real-time optimal coordination scheme for the voltage regulation of a distribution network including an OLTC, capacitor banks, and multiple distributed energy resources. Electr. Power Energy Syst. 2018, 94, 1–14. [Google Scholar] [CrossRef]
  19. Capitanescu, F.; Ochoa, L.F.; Margossian, H.; Hatziargyriou, N.D. Assessing the potential of network reconfiguration to improve distributed generation hosting capacity in active distribution systems. IEEE Trans. Power Syst. 2014, 30, 346–356. [Google Scholar] [CrossRef]
  20. Bläsi, A.; Requate, T. Feed-in-tariffs for electricity from renewable energy resources to move down the learning curve? Public Finan. Manag. 2010, 10, 213–250. [Google Scholar]
  21. Reichenbach, J.; Requate, T. Subsidies for renewable energies in the presence of learning effects and market power. Resour. Energy Econ. 2012, 34, 236–254. [Google Scholar] [CrossRef] [Green Version]
  22. Andora, M.; Voss, A. Optimal renewable-energy promotion: Capacity subsidies vs generation subsidies. Resour. Energy Econ. 2016, 45, 144–158. [Google Scholar] [CrossRef]
  23. Kalkuhl, M.; Edenhofer, O.; Lessmann, K. Renewable energy subsidies: Second-best policy or fatal aberration for mitigation? Resour. Energy Econ. 2013, 35, 217–234. [Google Scholar] [CrossRef] [Green Version]
  24. Mavsar, P.; Sredenšek, K.; Štumberger, B.; Hadžiselimović , M.; Seme, S. Simplified Method for Analyzing the Availability of Rooftop Photovoltaic Potential. Energies 2019, 12, 4233. [Google Scholar] [CrossRef] [Green Version]
  25. Melius, J.; Margolis, R.; Ong, S. Estimating Rooftop Suitability for PV: A Review of Methods, Patents, and Validation Techniques; Technical Report NREL/TP-6A20-60593; National Renewable Energy Lab.: Golden, CO, USA, 2013.
  26. Lee, M.; Hong, T.; Jeong, K.; Kim, J. A Bottom-up Approach for Estimating the Economic Potential of the Rooftop Solar Photovoltaic System Considering the Spatial and Temporal Diversity. Appl. Energy 2018, 232, 640–656. [Google Scholar] [CrossRef]
  27. Endres, A. Environmental Economics: Theory and Policy; Cambridge University Press: Cambridge, UK, 2010; ISBN 9780521173926. [Google Scholar]
  28. Korea Meteorological Administration. Analysis Report of Weather Resource to Fully Utilize Solar Energy in Korea, 2008 (Wrriten in Korean). Available online: http://www.kma.go.kr/download_01/climate_energy.pdf (accessed on 6 May 2020).
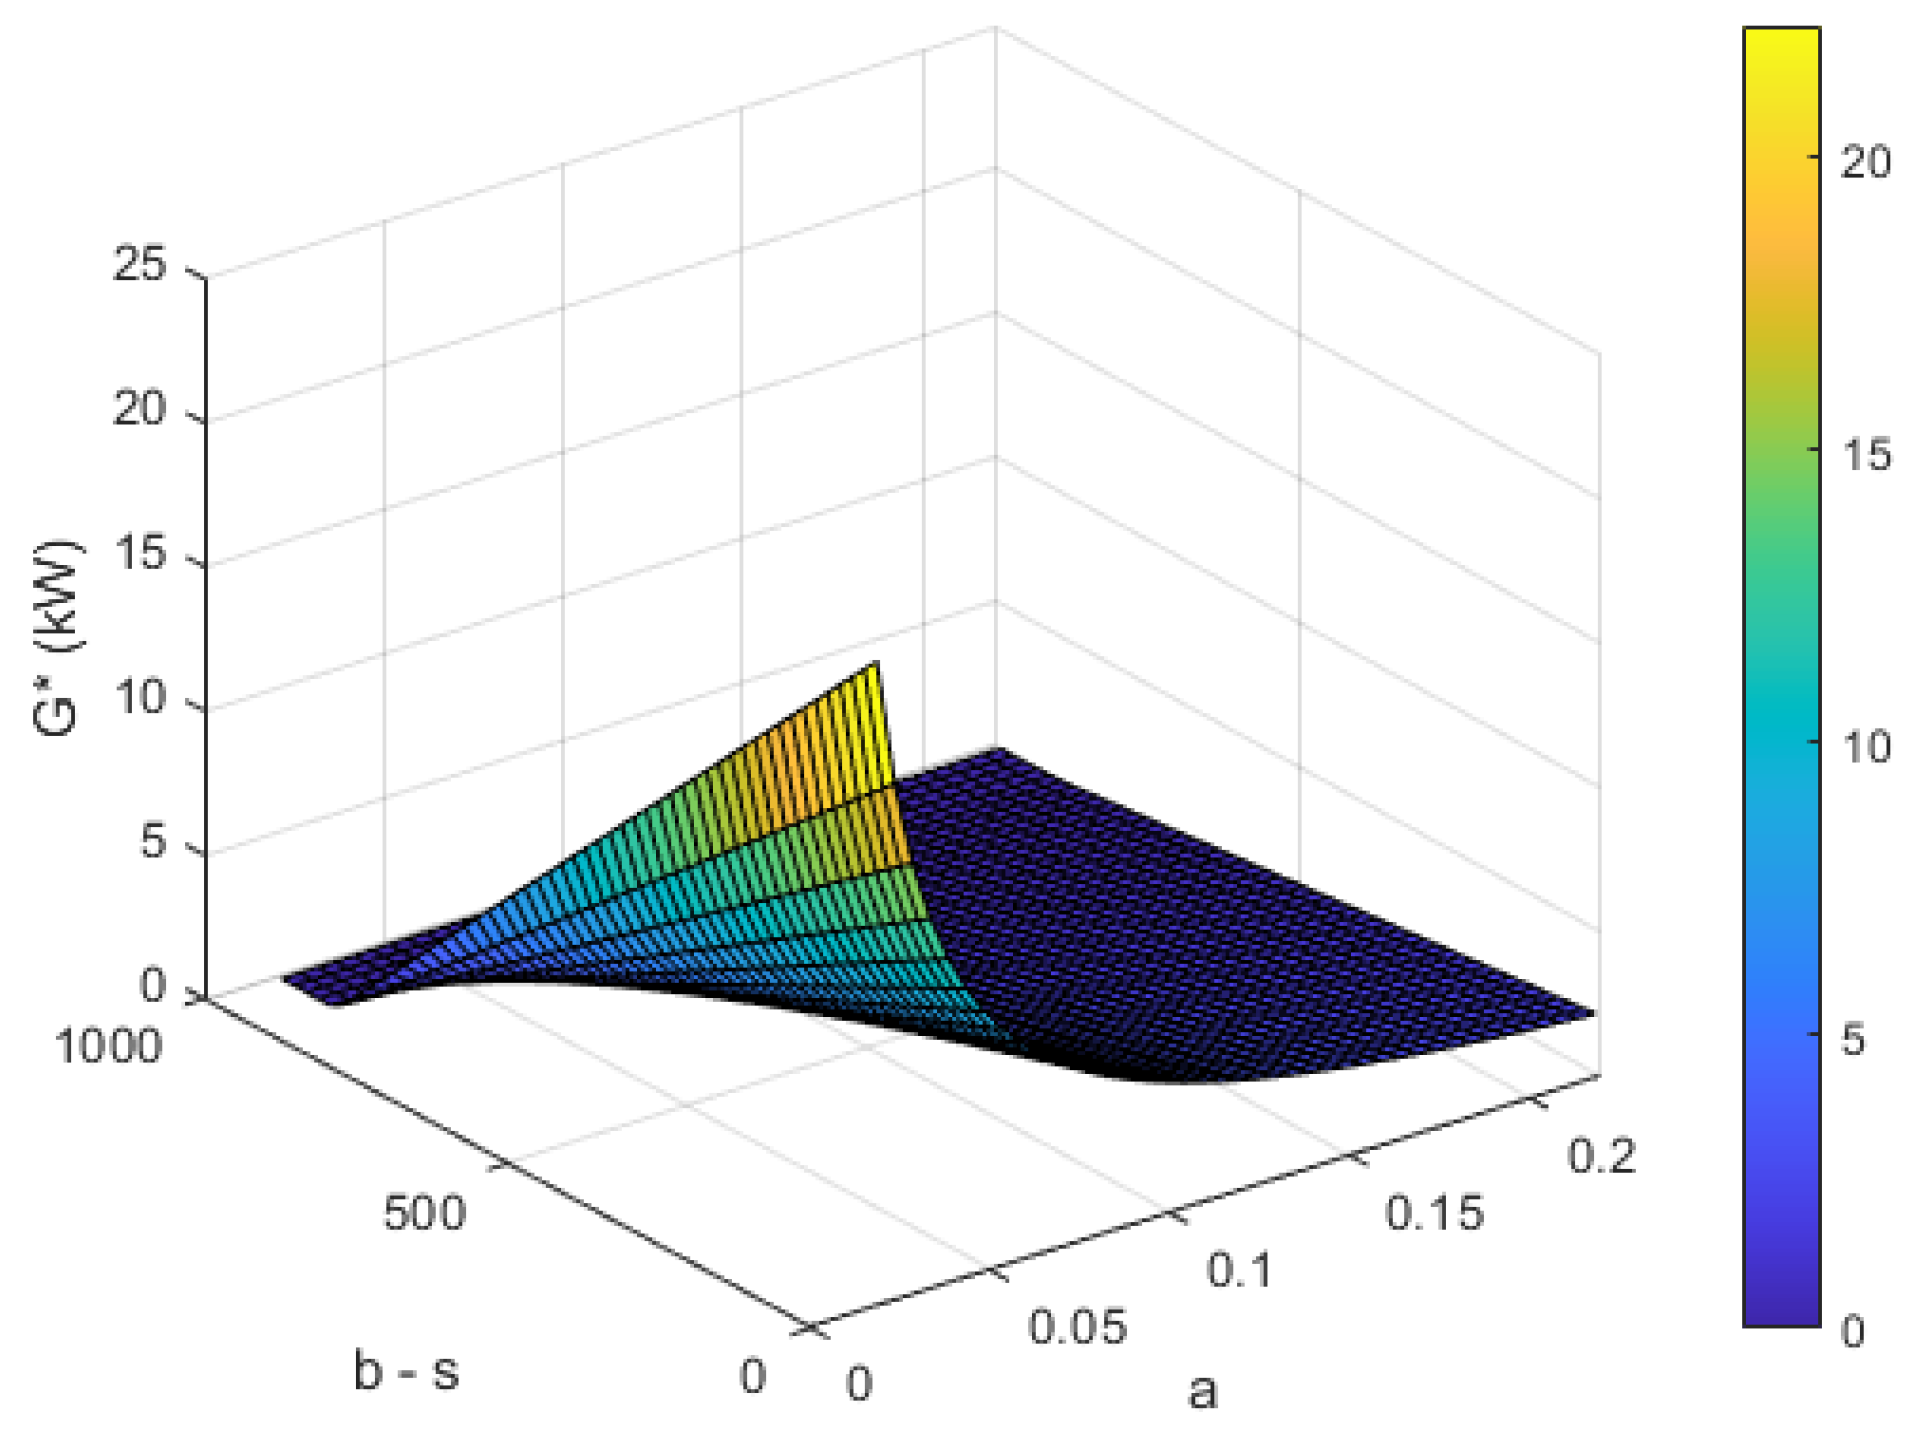
Figure 1. Installing capacity of solar PV for regional-level optimization.
Energies 13 02763 g001
Figure 2. Subsidy per unit capacity for social-level optimization.
Energies 13 02763 g002
Figure 3. Parameters for case study 2.
Energies 13 02763 g003
Figure 4. Solar PV capacity and subsidy results under different subsidy policies.
Energies 13 02763 g004
Figure 5. G i and s i comparison between capacity maximization and energy maximization policies.
Energies 13 02763 g005
Table 1. Solar PV capacity G s under three subsidy policies: no subsidy ( w / o s ), uniform subsidy ( e q ), differential subsidy ( d i ) policies.
abe G s w/o s s un G s w/ s un s di G s w/ s di
A22500250007619632158
B150002500076025000
C125005000125076128801250