Development and Verification of a Simulation Model for 120 kW Class Electric AWD (All-Wheel-Drive) Tractor during Driving Operation

 ,
,  , and
, and
Abstract
:1. Introduction
2. Materials and Methods
2.1. Concept of Electric AWD Tractor
2.2. Development of Electric AWD Tractor
2.3. Simulation Model
2.3.1. Mechanical Model
2.3.2. Electrical Model
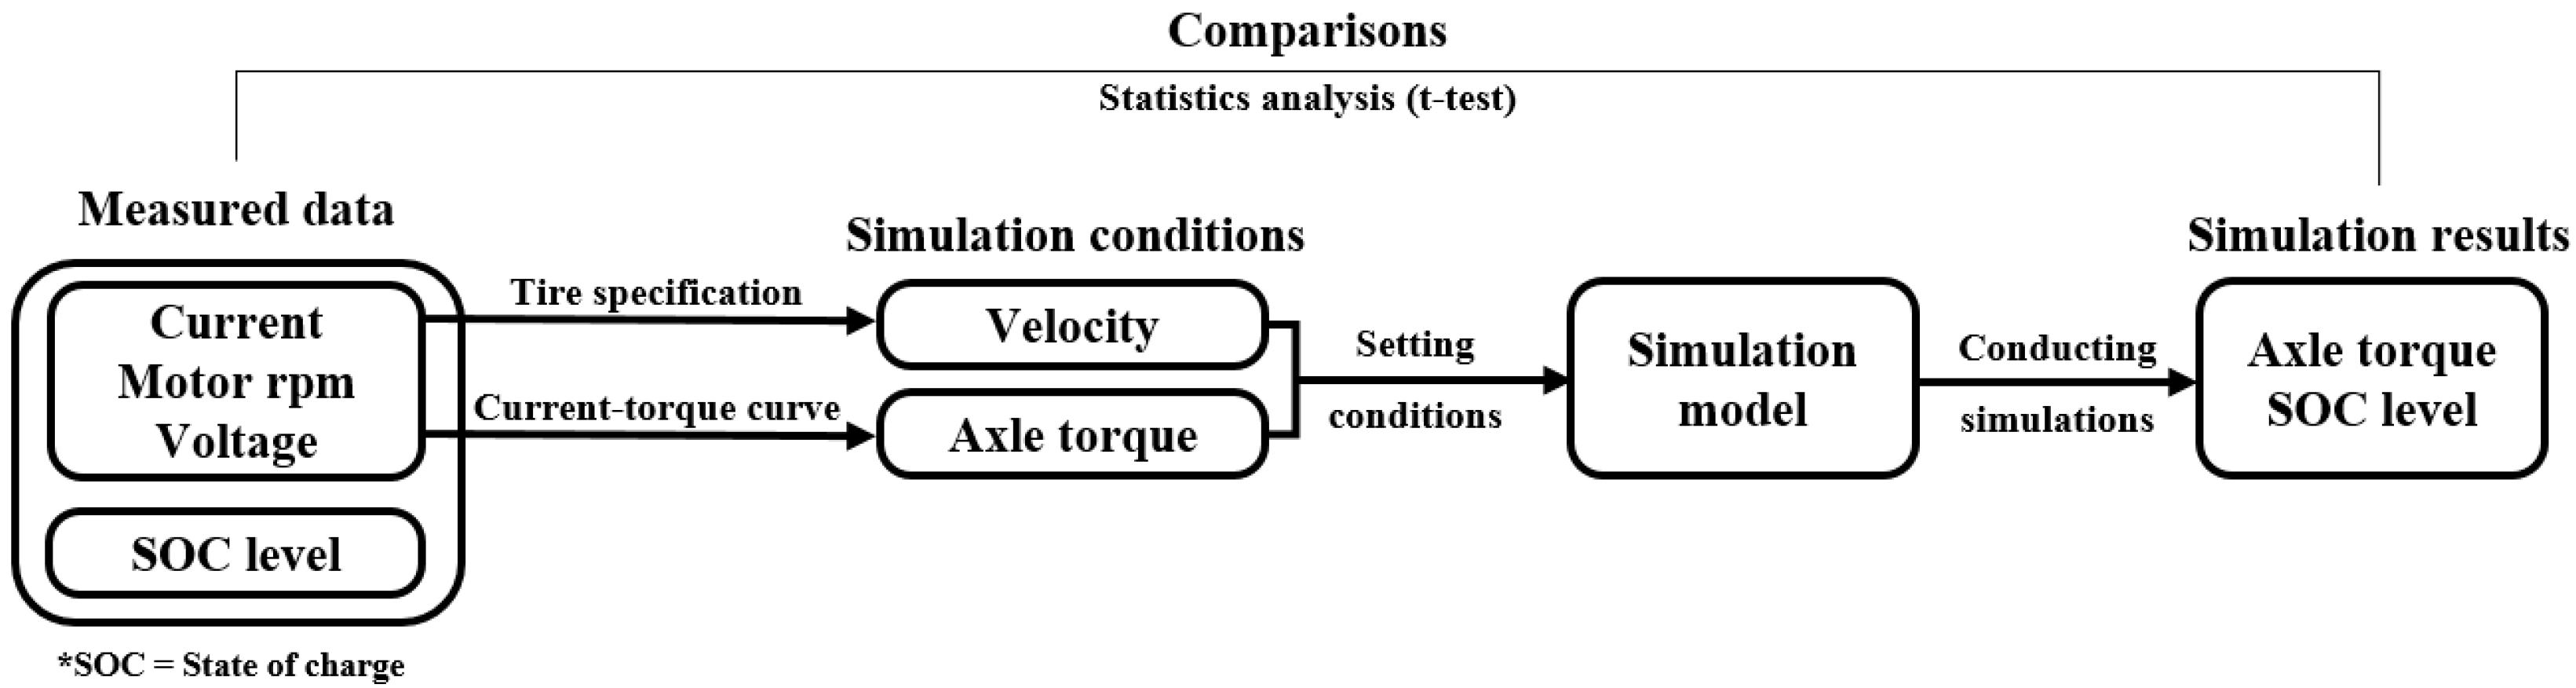
2.3.3. Simulation Condition
2.4. Verification of Electric AWD Tractor
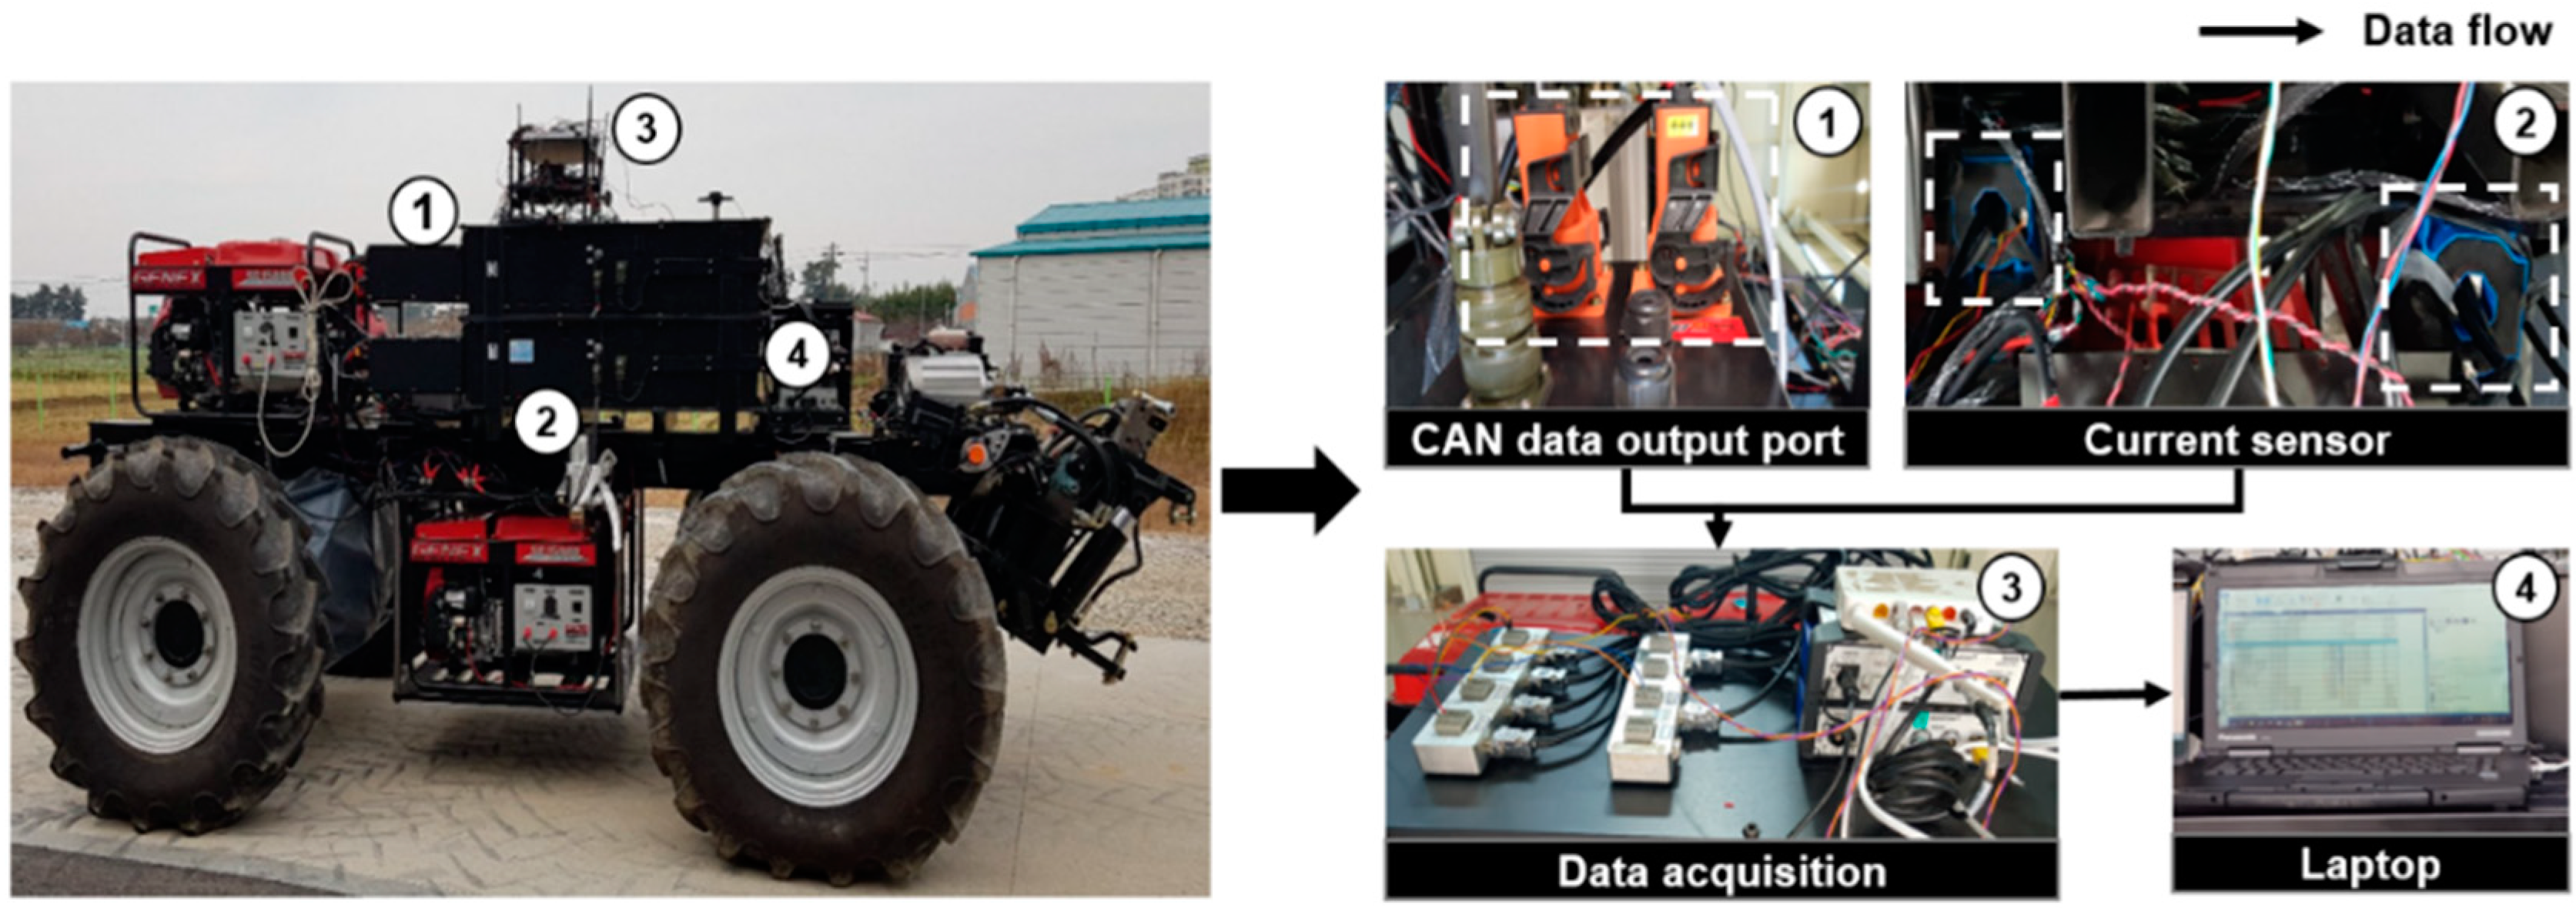
2.4.1. Load Measurement System
2.4.2. Test Procedure
3. Results
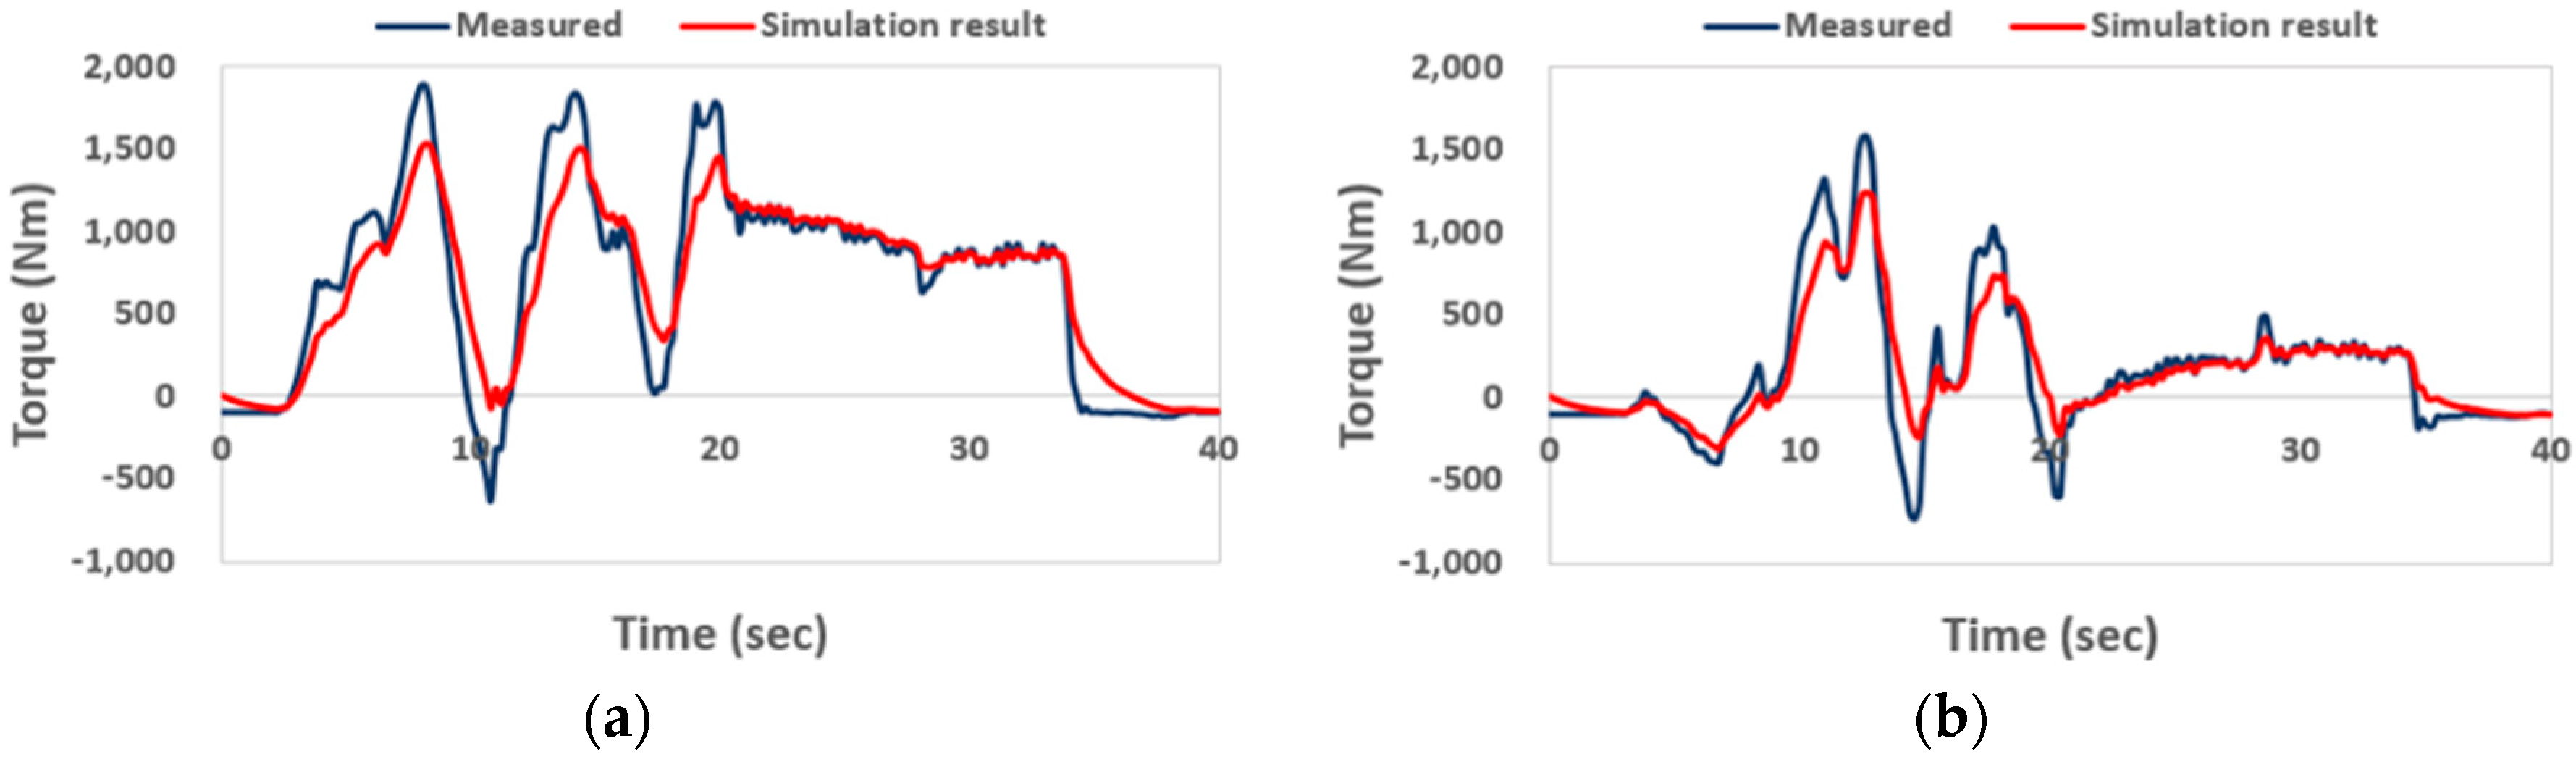
3.1. Axle Torque
3.2. SOC Level of Battery
4. Discussion
5. Conclusions
Author Contributions
Funding
Conflicts of Interest
References
- Lee, D.H.; Choi, C.H.; Chung, S.O.; Kim, Y.J.; Inoue, E.; Okayasu, T. Evaluation of tractor fuel efficiency using dynamometer and baler operation cycle. J. Fac. Agric. Kyushu Univ. 2016, 61, 173–182. [Google Scholar]
- Chen, Y.; Xie, B.; Mao, E. Electric Tractor Motor Drive Control Based on FPGA. IFAC-PapersOnLine 2016, 49, 271–276. [Google Scholar] [CrossRef]
- Lee, D.H.; Kim, Y.J.; Choi, C.H.; Chung, S.O.; Inoue, E.; Okayasu, T. Development of a parallel hybrid system for agricultural tractors. J. Fac. Agric. Kyushu Univ. 2017, 62, 137–144. [Google Scholar]
- Kang, E.; Pratama, P.S.; Byun, J.; Supeno, D.; Chung, S.; Choi, W. Development of Super-capacitor Battery Charger System based on Photovoltaic Module for Agricultural Electric Carriers. J. Biosyst. Eng. 2018, 43, 94–102. [Google Scholar]
- Azwan, M.B.; Norasikin, A.L.; Sopian, K.; Abd Rahim, S.; Norman, K.; Ramdhan, K.; Solah, D. Assessment of electric vehicle and photovoltaic integration for oil palm mechanisation practise. J. Clean. Prod. 2017, 140, 1365–1375. [Google Scholar] [CrossRef]
- Moreda, G.P.; Muñoz-García, M.A.; Barreiro, P. High voltage electrification of tractor and agricultural machinery—A review. Energy Convers. Manag. 2016, 115, 117–131. [Google Scholar] [CrossRef]
- Baek, S.Y.; Kim, W.S.; Kim, Y.S.; Kim, Y.J.; Park, C.G.; An, S.C.; Moon, H.C.; Kim, B.S. Development of a Simulation Model for an 80 kW-class Electric All-Wheel-Drive (AWD) Tractor using Agricultural Workload. J. Drive Control 2020, 17, 27–36. [Google Scholar]
- Ko, J.W.; Ko, S.; Park, Y.C. A Study on Battery Performance of a Motor Driven Local Transportation Vehicle. J. Korean Soc. Mar. Eng. 2012, 36, 430–436. [Google Scholar] [CrossRef]
- Liu, W.; He, H.; Wang, Z. A Comparison Study of Energy Management for A Plug-in Serial Hybrid Electric Vehicle. Energy Procedia 2016, 88, 854–859. [Google Scholar] [CrossRef] [Green Version]
- Park, J.K. Design of Parallel Hybrid Tractor and Evaluation of Charge/Discharge Performance; Sungkyunkwan University: Seoul, Korea, 2013. [Google Scholar]
- Zhao, W.; Wu, G.; Wang, C.; Yu, L.; Li, Y. Energy transfer and utilization efficiency of regenerative braking with hybrid energy storage system. J. Power Sources 2019, 427, 174–183. [Google Scholar] [CrossRef]
- Liu, M.; Xu, L.; Zhou, Z. Design of a Load Torque Based Control Strategy for Improving Electric Tractor Motor Energy Conversion Efficiency. Math. Probl. Eng. 2016, 2016, 2548967. [Google Scholar] [CrossRef] [Green Version]
- Park, Y., II; Kim, Y.J. Technology for the Agricultural Hybrid Tractor. Auto J. 2014, 36, 30–34. [Google Scholar]
- Mousazadeh, H.; Keyhani, A.; Javadi, A.; Mobli, H.; Abrinia, K.; Sharifi, A. Evaluation of alternative battery technologies for a solar assist plug-in hybrid electric tractor. Transp. Res. Part D Transp. Environ. 2010, 15, 507–512. [Google Scholar] [CrossRef]
- Kim, W.S.; Baek, S.Y.; Kim, T.J.; Kim, Y.S.; Park, S.U.; Choi, C.H.; Hong, S.J.; Kim, Y.J. Work load analysis for determination of the reduction gear ratio for a 78 kW all wheel drive electric tractor design. Korean J. Agric. Sci. 2019, 46, 613–627. [Google Scholar]
- Kim, B.S. Slip Detection and Control Algorithm to Improve Path Tracking Performance of Four-Wheel Independently Actuated Vehicles; Hongik University: Seoul, Korea, 2019. [Google Scholar]
- Song, H.W. A Study on the Improvement of Energy Efficiency and Cornering Stability Performance for 4WD in-Wheel Electric Vehicle; Sungkyunkwan University: Seoul, Korea, 2013. [Google Scholar]
- Jeon, D.S. Study about Skid Steer of Independent 4 Wheel Drive Vehicle; Kookmin University: Seoul, Korea, 2008. [Google Scholar]
- Song, C.H. Development of Motor Control Algorithm of an All-Wheel Drive In-Wheel Electric Vehicle to Improve Ride Comfort; Sungkyunkwan University: Seoul, Korea, 2015. [Google Scholar]
- Klein, S.; Xia, F.; Etzold, K.; Andert, J.; Amringer, N.; Walter, S.; Blochwitz, T.; Bellanger, C. Electric-Motor-in-the-Loop: Efficient Testing and Calibration of Hybrid Power Trains. IFAC-PapersOnLine 2018, 51, 240–245. [Google Scholar] [CrossRef]
- Zhang, D.X.; Zeng, X.H.; Wang, P.Y.; Wang, Q.N. Co-simulation with AMESim and MATLAB for differential dynamic coupling of hybrid electric vehicle. In Proceedings of the IEEE Intelligent Vehicles Symposium, Xi’an, China, 3–5 June 2009; pp. 761–765. [Google Scholar]
- Hong, J.; Kim, S.; Min, B. Drivability development based on CoSimulation of AMESim vehicle model and simulink HCU model for parallel hybrid electric vehicle. SAE Technical Papers. In Proceedings of the SAE World Congress & Exhibition, Detroit, MI, USA, 20–23 April 2009. [Google Scholar]
- Hwang, H.S.; Yang, D.H.; Choi, H.K.; Kim, H.S.; Hwang, S.H. Torque control of engine clutch to improve the driving quality of hybrid electric vehicles. Int. J. Automot. Technol. 2011, 12, 763–768. [Google Scholar] [CrossRef]
- Cao, X.; Du, C.; Yan, F.; Xu, H.; He, B.; Sui, Y. Parameter Optimization of Dual Clutch Transmission for an Axle-split Hybrid Electric Vehicle. In Proceedings of the IFAC-PapersOnLine, Vienna, Austria, 4–6 December 2019; Elsevier B.V.: Amsterdam, The Netherlands, 2019; Volume 52, pp. 423–430. [Google Scholar]
- Zeng, X.; Yang, N.; Wang, J.; Song, D.; Zhang, N.; Shang, M.; Liu, J. Predictive-model-based dynamic coordination control strategy for power-split hybrid electric bus. Mech. Syst. Signal Process. 2015, 60, 785–798. [Google Scholar] [CrossRef]
- Wenyong, L.; Abel, A.; Todtermuschke, K.; Tong, Z. Hybrid vehicle power transmission modeling and simulation with SimulationX. In Proceedings of the 2007 IEEE International Conference on Mechatronics and Automation, ICMA 2007, Heilongjiang, China, 5–9 August 2007; pp. 1710–1717. [Google Scholar]
- Tiantian, Z.; Sihong, Z.; Xiaoting, D. Research of Dynamic Characteristics on Power Coupling Equipment of Hybrid Electric Tractor. Tract. Farm Transp. 2013, 4, 7. [Google Scholar]
- Korea Agricultural Machinery Industry Cooperative (KAMICO); Korean Society for Agricultural Machinery (KSAM). Agricultural Machinery Yearbook in Korea; Korea Agricultural Machinery Industry Cooperative and Korean Society for Agricultural Machinery: Suwon, Korea, 2019. [Google Scholar]
- Jayaram, P.; Bharath, N.; Ahmed, R. A Novel Design for an all Terrain Custom-Built Vehicle Dynamics. Int. J. Adv. Sci. Res. Eng. 2018, 4, 186–194. [Google Scholar] [CrossRef]
- Zhang, R.; Xia, B.; Li, B.; Cao, L.; Lai, Y.; Zheng, W.; Wang, H.; Wang, W. State of the art of lithium-ion battery SOC estimation for electrical vehicles. Energies 2018, 11, 1820. [Google Scholar] [CrossRef] [Green Version]
- Kim, Y.S.; Lee, S.D.; Kim, Y.J.; Kim, Y.J.; Choi, C.H. Effect of tractor travelling speed on a tire slip. Korean J. Agric. Sci. 2018, 45, 120–127. [Google Scholar]
- Wohnhaas, A.; Hötzer, D.; Sailer, U. Modulares Simulationsmodell eines KFZ-Antriebstrangs unter Berücksichtigung von Nichtlinearitäten und Kupplungsvorgängen.pdf. VDI Ber. 1995, 1220, 97–117. [Google Scholar]
- Zhang, C.; Li, K.; Pei, L.; Zhu, C. An integrated approach for real-time model-based state-of-charge estimation of lithium-ion batteries. J. Power Sources 2015, 283, 24–36. [Google Scholar] [CrossRef] [Green Version]
- Lee, N.G.; Kim, Y.J.; Kim, W.S.; Kim, Y.S.; Kim, T.J.; Baek, S.M.; Choi, Y.; Kim, Y.K.; Choi, I.S. Study on the Improvement of Transmission Error and Tooth Load Distribution using Micro-geometry of Compound Planetary Gear Reducer for Tractor Final Driving Shaft. J. Drive Control 2020, 17, 1–12. [Google Scholar]
- Park, S.U. Fatigue Life Evaluation of Spiral Bevel Gear of Transmission Using Agricultural Workload of Tractor; Chungnam National University: Daejeon, Korea, 2019. [Google Scholar]
- Xu, G.; Li, W.; Xu, K.; Song, Z. An Intelligent Regenerative Braking Strategy for Electric Vehicles. Energies 2011, 4, 1461–1477. [Google Scholar] [CrossRef] [Green Version]
- Kim, Y.-J.; Chung, S.-O.; Choi, C.-H.; Lee, D.-H. Evaluation of Tractor PTO Severeness during Rotary Tillage Operation. J. Biosyst. Eng. 2011, 36, 163–170. [Google Scholar] [CrossRef] [Green Version]
- Lee, D.H.; Kim, Y.J.; Chung, S.O.; Choi, C.H.; Lee, K.H.; Shin, B.S. Analysis of the PTO load of a 75 kW agricultural tractor during rotary tillage and baler operation in Korean upland fields. J. Terramech. 2015, 60, 75–83. [Google Scholar] [CrossRef]
- Kim, D.C.; Ryu, I.H.; Kim, K.U. Analysis of tractor transmission and driving axle loads. Trans. Am. Soc. Agric. Eng. 2001, 44, 751–757. [Google Scholar]
- Reddy, G.S.; Narsaiah, J.; Shashikala, G. Dynamic Analysis on Tillage Equipment Used in Agriculture Using Ansys Software. Int. J. Sci. Res. Sci. Technol. 2017, 3, 890–897. [Google Scholar]
- Kim, W.S.; Kim, Y.S.; Kim, T.J.; Park, S.U.; Choi, Y.; Choi, I.S.; Kim, Y.K.; Kim, Y.J. Analysis of power requirement of 78 kW class agricultural tractor according to the major field operation. Trans. Korean Soc. Mech. Eng. A 2019, 43, 911–922. [Google Scholar] [CrossRef]


| Item | Specification | ||
|---|---|---|---|
| Electric AWD tractor | Length × Width × Height (mm) | 5500 × 2500 × 1950 | |
| Weight (kg) | 7429 | ||
| Electric motor | Max. torque (Nm) | 119.7 | |
| Max. rotational speed (rpm) | 8000 | ||
| Max. power (kW) | 37 | ||
| Battery | Capacity (kWh) | 14.6 | |
| Type | LiFePO4 | ||
| Voltage (V)/C-Rate (C) | 70.4/2 | ||
| Reducer | Planetary gear ratio | 12.05 | |
| Helical gear ratio | 4.3 | ||
| Tire | 380/85R24 | ||
| Charging system | Generator | Rated power (kW) | 13.5 |
| Converter | Rated power (kW) | 15 | |
| Charger | Max. output current (A) | 50 | |
| Field Conditions | Electric Motor | Measured Axle Torque (Nm) | Simulated Axle Torque (Nm) | p-Value |
|---|---|---|---|---|
| Off-road | Left | 2490.8 ± 2005.3 1 | 2497.4 ± 1865.5 | 0.846 |
| Right | 1702.6 ± 1596.4 | 1705.3 ± 1402.5 | 0.941 | |
| On-road | Left | 689.1 ± 601.1 | 687.8 ± 484.9 | 0.934 |
| Right | 161.7 ± 413.0 | 166.3 ± 310.1 | 0.696 |
| Field Conditions | Battery | t-Test | ||||
|---|---|---|---|---|---|---|
| SOC Level (%) | ||||||
| Measured | Simulated | p-Value | Measured | Simulated | ||
| Off-road | Left | 96.20 ± 0.08 1 | 96.23 ± 0.06 | 0.400 | 0.20 2 | 0.18 |
| Right | 79.95 ± 0.05 | 79.96 ± 0.03 | 2 × 10⁻⁹ * | 0.10 | 0.10 | |
| On-road | Left | 97.12 ± 0.06 | 97.12 ± 0.06 | 0.719 | 0.20 | 0.21 |
| Right | 79.95 ± 0.05 | 79.95 ± 0.03 | 0.326 | 0.10 | 0.11 | |
| Agricultural Operation | Torque Ratio | Estimated Torque (Nm) | Estimated Time (Hours) |
|---|---|---|---|
| Plow tillage | 2.5 1 | 3221.5 2 | 2.4 |
© 2020 by the authors. Licensee MDPI, Basel, Switzerland. This article is an open access article distributed under the terms and conditions of the Creative Commons Attribution (CC BY) license (http://creativecommons.org/licenses/by/4.0/).
Share and Cite
Baek, S.-Y.; Kim, Y.-S.; Kim, W.-S.; Baek, S.-M.; Kim, Y.-J. Development and Verification of a Simulation Model for 120 kW Class Electric AWD (All-Wheel-Drive) Tractor during Driving Operation. Energies 2020, 13, 2422. https://doi.org/10.3390/en13102422
Baek S-Y, Kim Y-S, Kim W-S, Baek S-M, Kim Y-J. Development and Verification of a Simulation Model for 120 kW Class Electric AWD (All-Wheel-Drive) Tractor during Driving Operation. Energies. 2020; 13(10):2422. https://doi.org/10.3390/en13102422
Chicago/Turabian StyleBaek, Seung-Yun, Yeon-Soo Kim, Wan-Soo Kim, Seung-Min Baek, and Yong-Joo Kim. 2020. "Development and Verification of a Simulation Model for 120 kW Class Electric AWD (All-Wheel-Drive) Tractor during Driving Operation" Energies 13, no. 10: 2422. https://doi.org/10.3390/en13102422