Electric Vehicle Battery Lifetime Extension through an Intelligent Double-Layer Control Scheme
by
 , ,
, ,
Omid Rahbari
1,2,* ,
,
Noshin Omar
1,2,
Joeri Van Mierlo
1,2, 
Marc A. Rosen
3,
Thierry Coosemans
1,2 and
Maitane Berecibar
1,2 1
MOBI Research Group, ETEC Department, Vrije Universiteit Brussel (VUB), Pleinlaan 2, 1050 Brussels, Belgium
2
Flanders Make, 3001 Heverlee, Belgium
3
Faculty of Engineering and Applied Science, University of Ontario Institute of Technology, Oshawa, ON L1G 0C5, Canada
*
Author to whom correspondence should be addressed.
Energies 2019, 12(8), 1525; https://doi.org/10.3390/en12081525
Submission received: 22 January 2019
/
Revised: 9 April 2019
/
Accepted: 17 April 2019
/
Published: 23 April 2019
(This article belongs to the Section E: Electric Vehicles)
Abstract
:Electric vehicles (EVs) are recognized as promising options, not only for the decarbonization of urban areas and greening of the transportation sector, but also for increasing power system flexibility through demand-side management. Large-scale uncoordinated charging of EVs can impose negative impacts on the existing power system infrastructure regarding stability and security of power system operation. One solution to the severe grid overload issues derived from high penetration of EVs is to integrate local renewable power generation units as distributed generation units to the power system or to the charging infrastructure. To reduce the uncertainties associated with renewable power generation and load as well as to improve the process of tracking Pareto front in each time sequence, a predictive double-layer optimal power flow based on support vector regression and one-step prediction is presented in this study. The results demonstrate that, through the proposed control approach, the rate of battery degradation is reduced by lowering the number of cycles in which EVs contribute to the services that can be offered to the grid via EVs. Moreover, vehicle to grid services are found to be profitable for electricity providers but not for plug-in electric vehicle owners, with the existing battery technology and its normal degradation.
1. Introduction
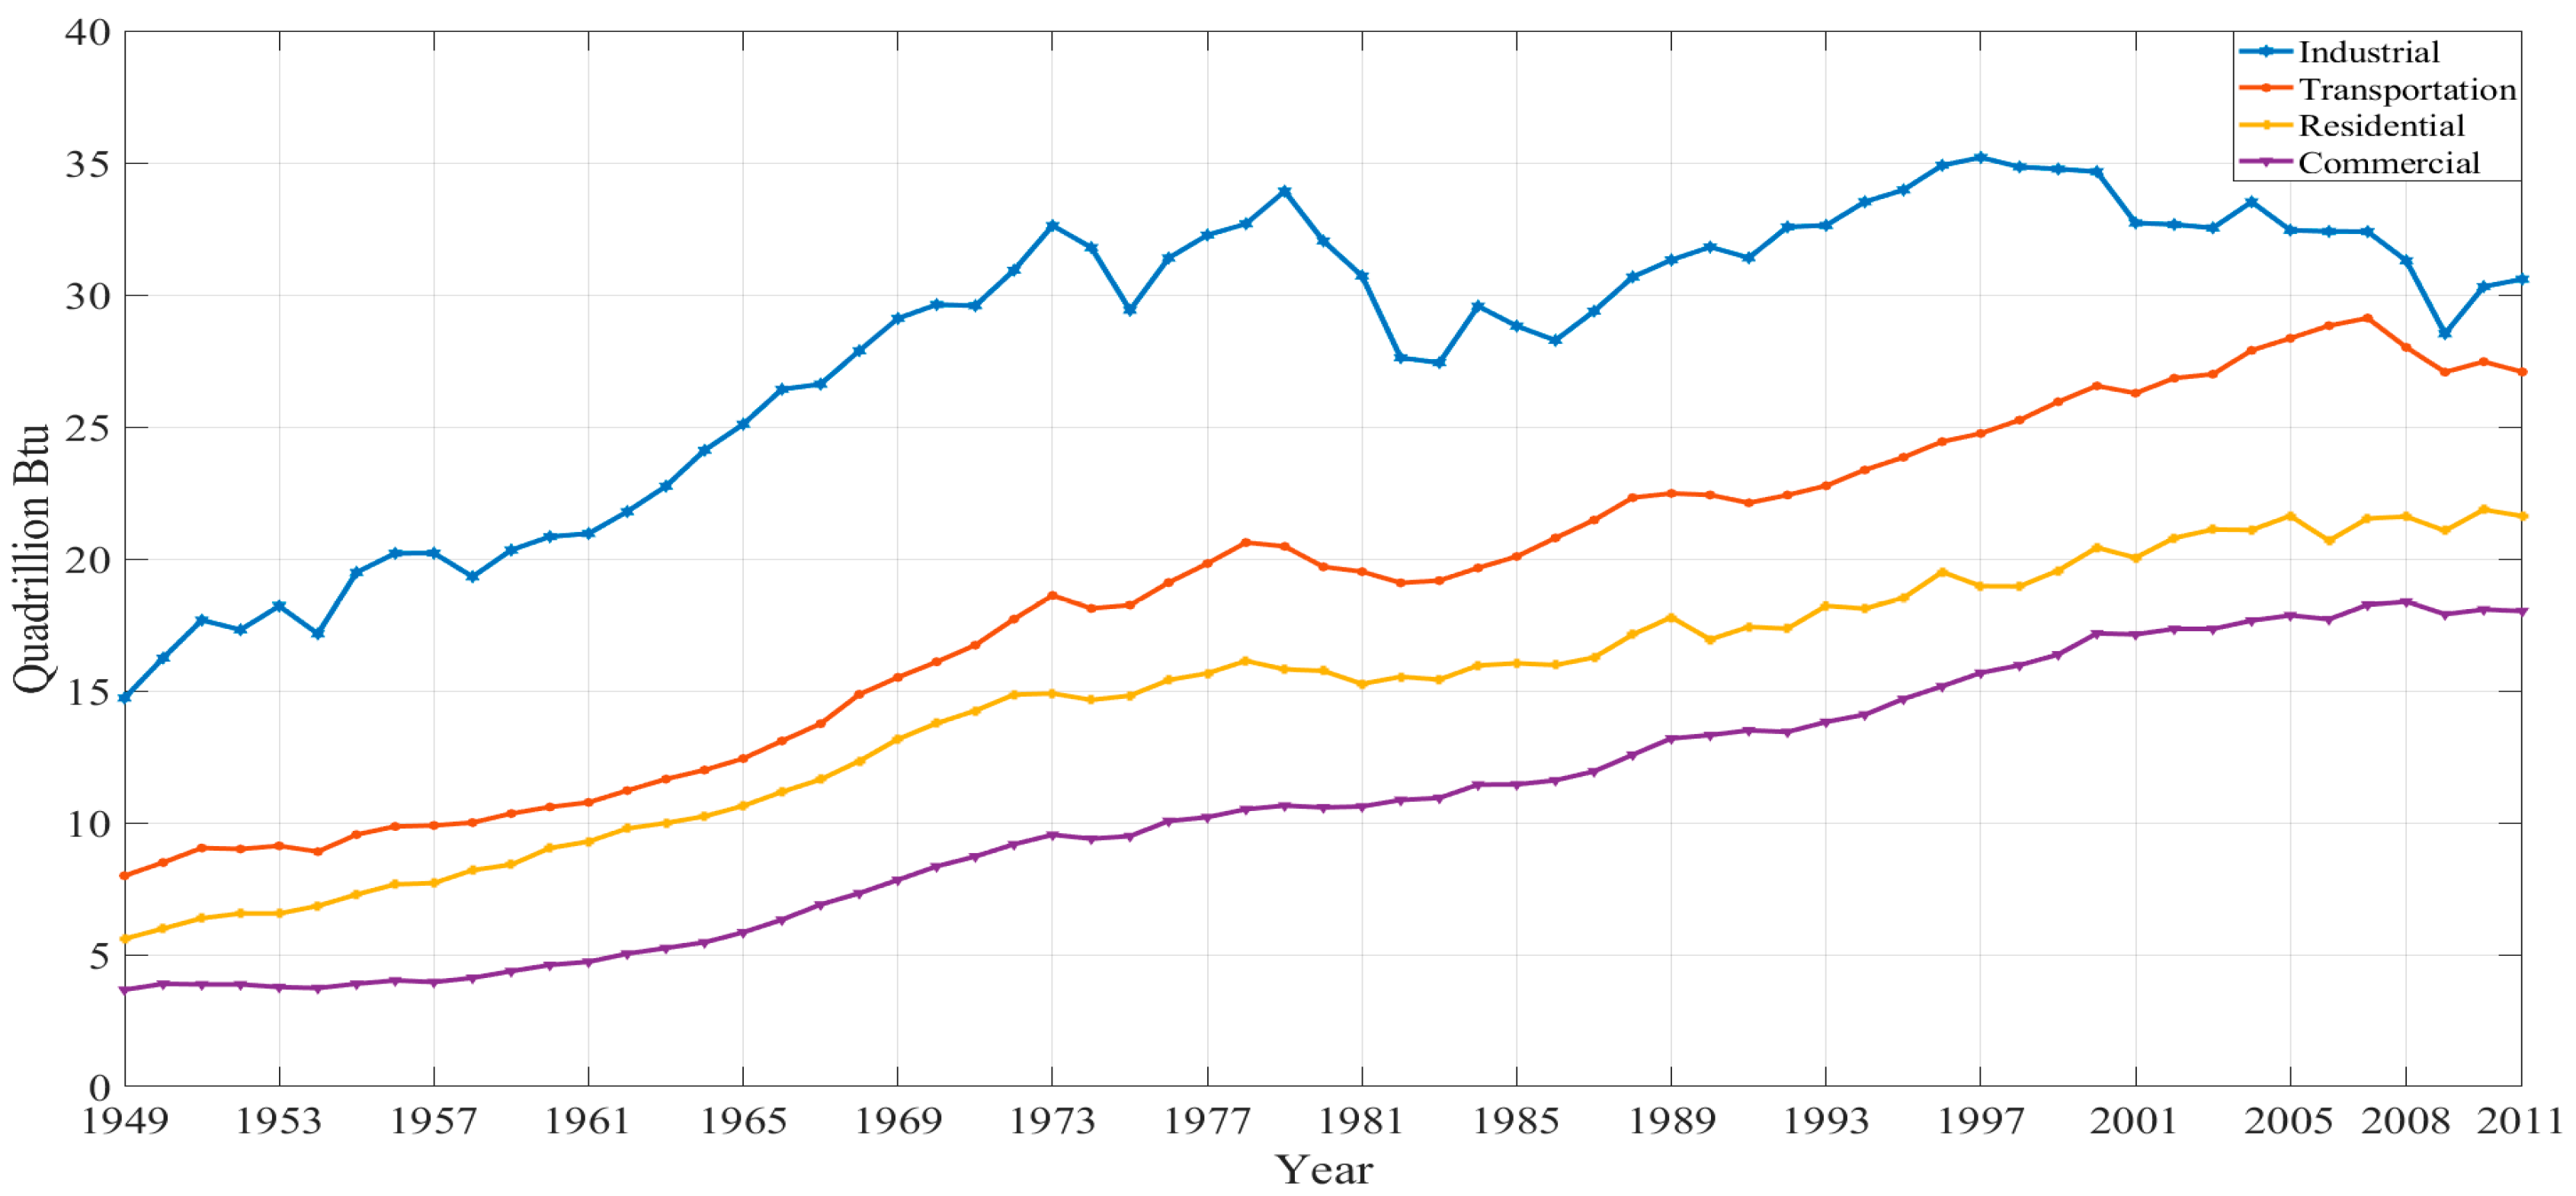
Despite the Paris Agreement, pursuing efforts to limit the global temperature rise to less than 2 °C through a technological transition from a hydrocarbon-based economy to a post-petroleum era, there is little tangible evidence of the success such efforts. Recent studies indicate that energy demand will increase to 736 from 663 quadrillion Btus between 2015 and 2040, and that annual carbon dioxide (CO2) emissions will increase to 45.5 billion metric tons in 2040 [1]. As seen in Figure 1, the energy use of the US transportation sector has risen significantly since 1950.
The global combined contribution of the transportation and power generation sectors to the increasing demand is expected to grow by 56% from 2011 to 2035 [3]. Furthermore, it is estimated that a significant proportion of hydrocarbon resources is consumed by transportation machinery [4]. As a consequence of increasing energy demand and CO2 emissions, interest in renewable energy sources (RESs) has increased, as a means for reducing the dependency on fossil fuels. However, the technological evolution and a smooth transition from a hydrocarbon-based economy to a post-petroleum era is challenged by the inherent variability and intermittency of renewable energy sources [5]. In this regard, energy storage systems, such as stationary battery systems, can improve and facilitate the integration of viable renewable energy sources into the power system. Supplying battery electric vehicles (BEVs) or pure electric vehicles and plug-in hybrid electric vehicles (PHEVs) with renewable energy sources is recognized as a promising and effective option for reducing carbon dioxide emissions. This is due to the use of an environmentally friendly power source and the low fossil fuel consumption in PHEVs. The internal combustion engine in PHEVs is downsized, which enables a higher operating efficiency compared to the pure internal combustion engine.
Renewable power generation units can also play a prominent role in power sector de-carbonization. Due to the uncertainty and intermittency of renewable energy sources, stationary energy storage systems are required to reduce the fluctuation of RESs. This typically leads to extra infrastructure costs. Hence, the rise in penetration of EVs as an alternative option to stationary energy storage systems has been attracting much attention in both academia and industry due to the stabilization of the electric grid and de-carbonization of urban areas that EVs can offer through vehicle-to-grid (G2V) and grid-to-vehicle (G2V) technologies. Therefore, the primary driver for most of the research on the integration of electric vehicles and renewable power generation units with power systems (PSs) can provide multiple benefits: facilitating ancillary services, and reducing infrastructure cost and environmental concerns through V2G and G2V technologies [3,6]. This integration requires a bi-directional power flow controller as a decision-making mechanism to adapt the power systems to different power source structures and improve the acceptability of intermittent renewable energy generation units. Yet the flexibility of V2G concept is entirely dependent on the state of the renewable power generation units and the state of charge (SoC) of each EV. As the energy content of batteries is limited to their state of charge and power generation from renewable sources is limited to the weather condition.
Due to the challenges of intermittent energy source integration into the grid, robust scheduling and control strategies have become indispensable to enhance electric grid stability [7]. Moreover, due to the expected uptake of EVs into the power system in the near-future, modeling of this new load is vital to power system planning [8]. Thus, new directions are required to manage, control, and estimate or predict the available amount of electrical power that is generated from renewable energy over time. Such systems can play an important role in the successful integration of EVs, RESs, and PSs [3]. For instance, estimation and prediction of RES supply and SoC in a fleet of EVs can determine how much power can be injected or drawn from the controllable sources such as stationary energy storage systems or EVs. For instance, Rekioua et al. [9] pursued the objective of producing electricity without interruption when the grid architecture consists of a hybrid power generation unit: photovoltaic-fuel cell (PV-FC). The result demonstrate how the control strategy can affect the optimal sizing of the hybrid components. A successful integrated design procedure requires both cost minimization and a proper control logic design, representing a highly reliable and cost-effective framework. For example, a PV generation unit was connected to a feeder, supported by a fleet of EVs [10]. The results show that the integration can reduce load fluctuation in the urban grid and that EVs can stabilize the electric grid when the load reaches the maximum amount of power.
Recent EV research revolves around EV charging optimization, EV service provision quantifications, and owner-cost-benefits. For instance, a decision algorithm has been proposed to explore costs of different electrification technology alternatives in Ghana [11]. Peterson et al. modeled economic losses associated with battery capacity degradation for feeding EVs from the generated power at off-peak hours, referred to as a peak-shaving strategy [12]. The results showed that EV owners are not likely to receive proper incentives from the power system. Note that stability corresponding to the frequency and voltage deviations was not taken into consideration regardless the high proportion of EVs possible in the near future. In [13], two algorithms were proposed to address the uncoordinated large scale of EVs. The first algorithm optimized EV charging based on owner-requirements and ancillary services, and was included in the second algorithm. The results demonstrated that smart charging reduces daily electricity costs for driving from $0.43 to $0.2. Moreover, it has been demonstrated that the battery is the best alternative to the quick-response services corresponding to different kinds of deviations rather than baseload power [13]. For instance, a study on operational implications of the integration of EVs and variable RESs at the city level has been conducted [8]. The results showed that EV charging strategies have significant cost implications, while decentralization and renewable energy have profound effects on managing GHG emissions.
The effect of intermittent RESs in conjunction with EVs on the distribution system has been discussed [14]. Different EV fleets augmented with a RES were employed to maximize the share of electricity generated from RES through the defined EV fleets. The results demonstrated that stochastic programming that is supported by the prediction of the generated power from PV leads to a cost reduction. In Ref. [15], a mixed-integer optimization problem was proposed to minimize the power generation of conventional power plants by employing variable RESs (e.g., solar and wind generation units) and a fleet of EVs. The study demonstrated that a coordinated charging strategy can double the usage of RESs in comparison to an uncoordinated charging strategy. Further, a smart parking lot was considered as an aggregation of PEVs equipped with RESs to control fluctuations in the RES power generation by optimal charging of PEVs [16]. The results showed that the proposed infrastructure can benefit PEV owners financially. In [17], a cost-emission framework was proposed to schedule power flow in an aggregation of PEVs with broad travel patterns. A significant reduction in power losses of the system was observed via employing the proposed PEV scheduling method, as were reductions in operating costs of DG resources.
The present authors proposed an intelligent optimization framework in an EV aggregation to optimize the charge allocation of EVs and to stabilize the electric grid through reducing the power losses and voltage deviation [18,19]. They also proposed an optimal versatile control approach to regulate the voltage profile and reduce the power losses through V2G and G2V systems [3]. But the computational effort and response time for severe operating conditions remained challenging with such control strategies. For instance, as the proposed controller (ANFIS) is updated and retuned by an optimal power flow algorithm according to the new observation, the controller keeps EVs connected to the grid on standby for 45 s to retune the modifiable ANFIS parameters. This gap can be addressed by predictor algorithms. To achieve successful coordination, a bi-directional communication was suggested. This means that the architecture consists of a data collective section, collecting data on the state of power sources, including renewable distributed generation options and EV aggregation, and a predicting and optimizing section [20]. Indeed, an energy management system can utilize forecasted renewable power generation and demand information to schedule in advance the power flow of controllable resources such as PHEVs and/or EVs. Hence forecasting renewable energy sources such as solar energy (SE) and/or wind energy (WE), as well as demand characteristics, can be an important tool in activities of energy managers and electricity traders to overcome the risks related to energy planning and energy storage policies and to address economic dispatch or technical aspects. Furthermore, these steps provide valuable information regarding the time of operation, repair, and replacement of the system’s generators and conversion lines, which can be utilized to shift towards optimum electricity production.
Three real-time control approaches with V2G and G2V functionalities and fed with renewable power generation units were introduced by the present authors [3,18,19]. In those, demand and power generation information was provided to the energy management system in real-time, which can reduce their capability to optimize the bi-directional power flow for a short-time period if the variable space changes suddenly according to the dynamic environment. Indeed, the optimum power flow is a non-linear and non-convex problem, having multiple optimal points. This can cause the algorithm to find a feasible solution in the immediate neighborhood of the obtained value [21]. This leads the present authors to employ a predictive optimal power flow algorithm to deal with the computational requirement of the real-time control strategy and to ensure a global solution for each time sequence. In this regard, the PV power supply and the demand must be known in advance. Through considering grid and battery characteristics in V2G and G2V technologies, the primary objective of the present article is to enhance understanding of EV charging optimization throughout the predictor optimal power flow problem and its effect on battery capacity degradation. In this regard, a robust predictive algorithm is essential. By utilizing a support vector regression (SVR), programmed in the environment of MATLAB® software, the present article seeks to predict solar power generation by forecasting solar irradiance and predicting demand one-step ahead to optimize power flow among non-dispatchable and dispatchable sources.
The remainder of the article is organized as follows: Section 2 describes the proposed technique, introducing the support vector machine and the optimal bi-directional power flow algorithm, in Section 2.1, and Section 2.2, respectively. Section 3 provides the results of applying the proposed technique, and conclusions are given in Section 4.
2. Materials and Methods
In real-world application areas, problems such as constrained optimization and planning can be classified under dynamic multi-objective optimization problems, because such problems whose objective space and/or variable space can vary widely according to changes in the environment over the time [22]. Therefore, several challenges need to be addressed for the successful integration of EVs into the electric grid since the power production of renewable energy sources is directly dependent on weather conditions and each EV’s SoC and SoH. As discussed in [23], the benefits of V2G services are outweighed if the degradation mechanism of the battery can be reduced through cycling, recognized as stress factors contributing to battery degradation. Generally, demand-side management strategies can be classified into two categories: (1) decision making on charging and discharging of controllable resources based on the real-time state of the PS, and (2) decision making on charging and discharging of controllable resources based on the forecasted estimation of the future power generation and the future state of the PS. The latter is important as the primary objective is to maintain the normal operation of the PS or nano-grid.
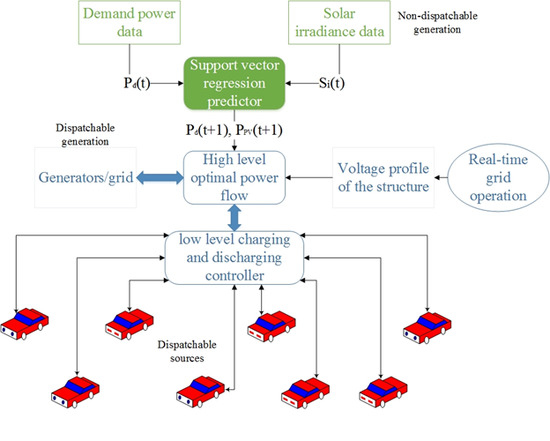
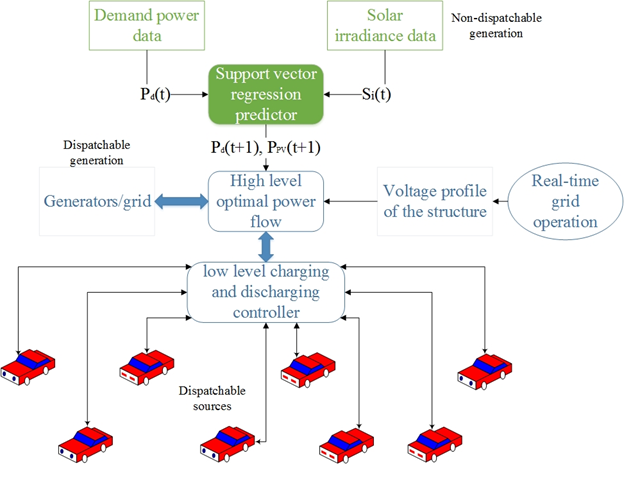
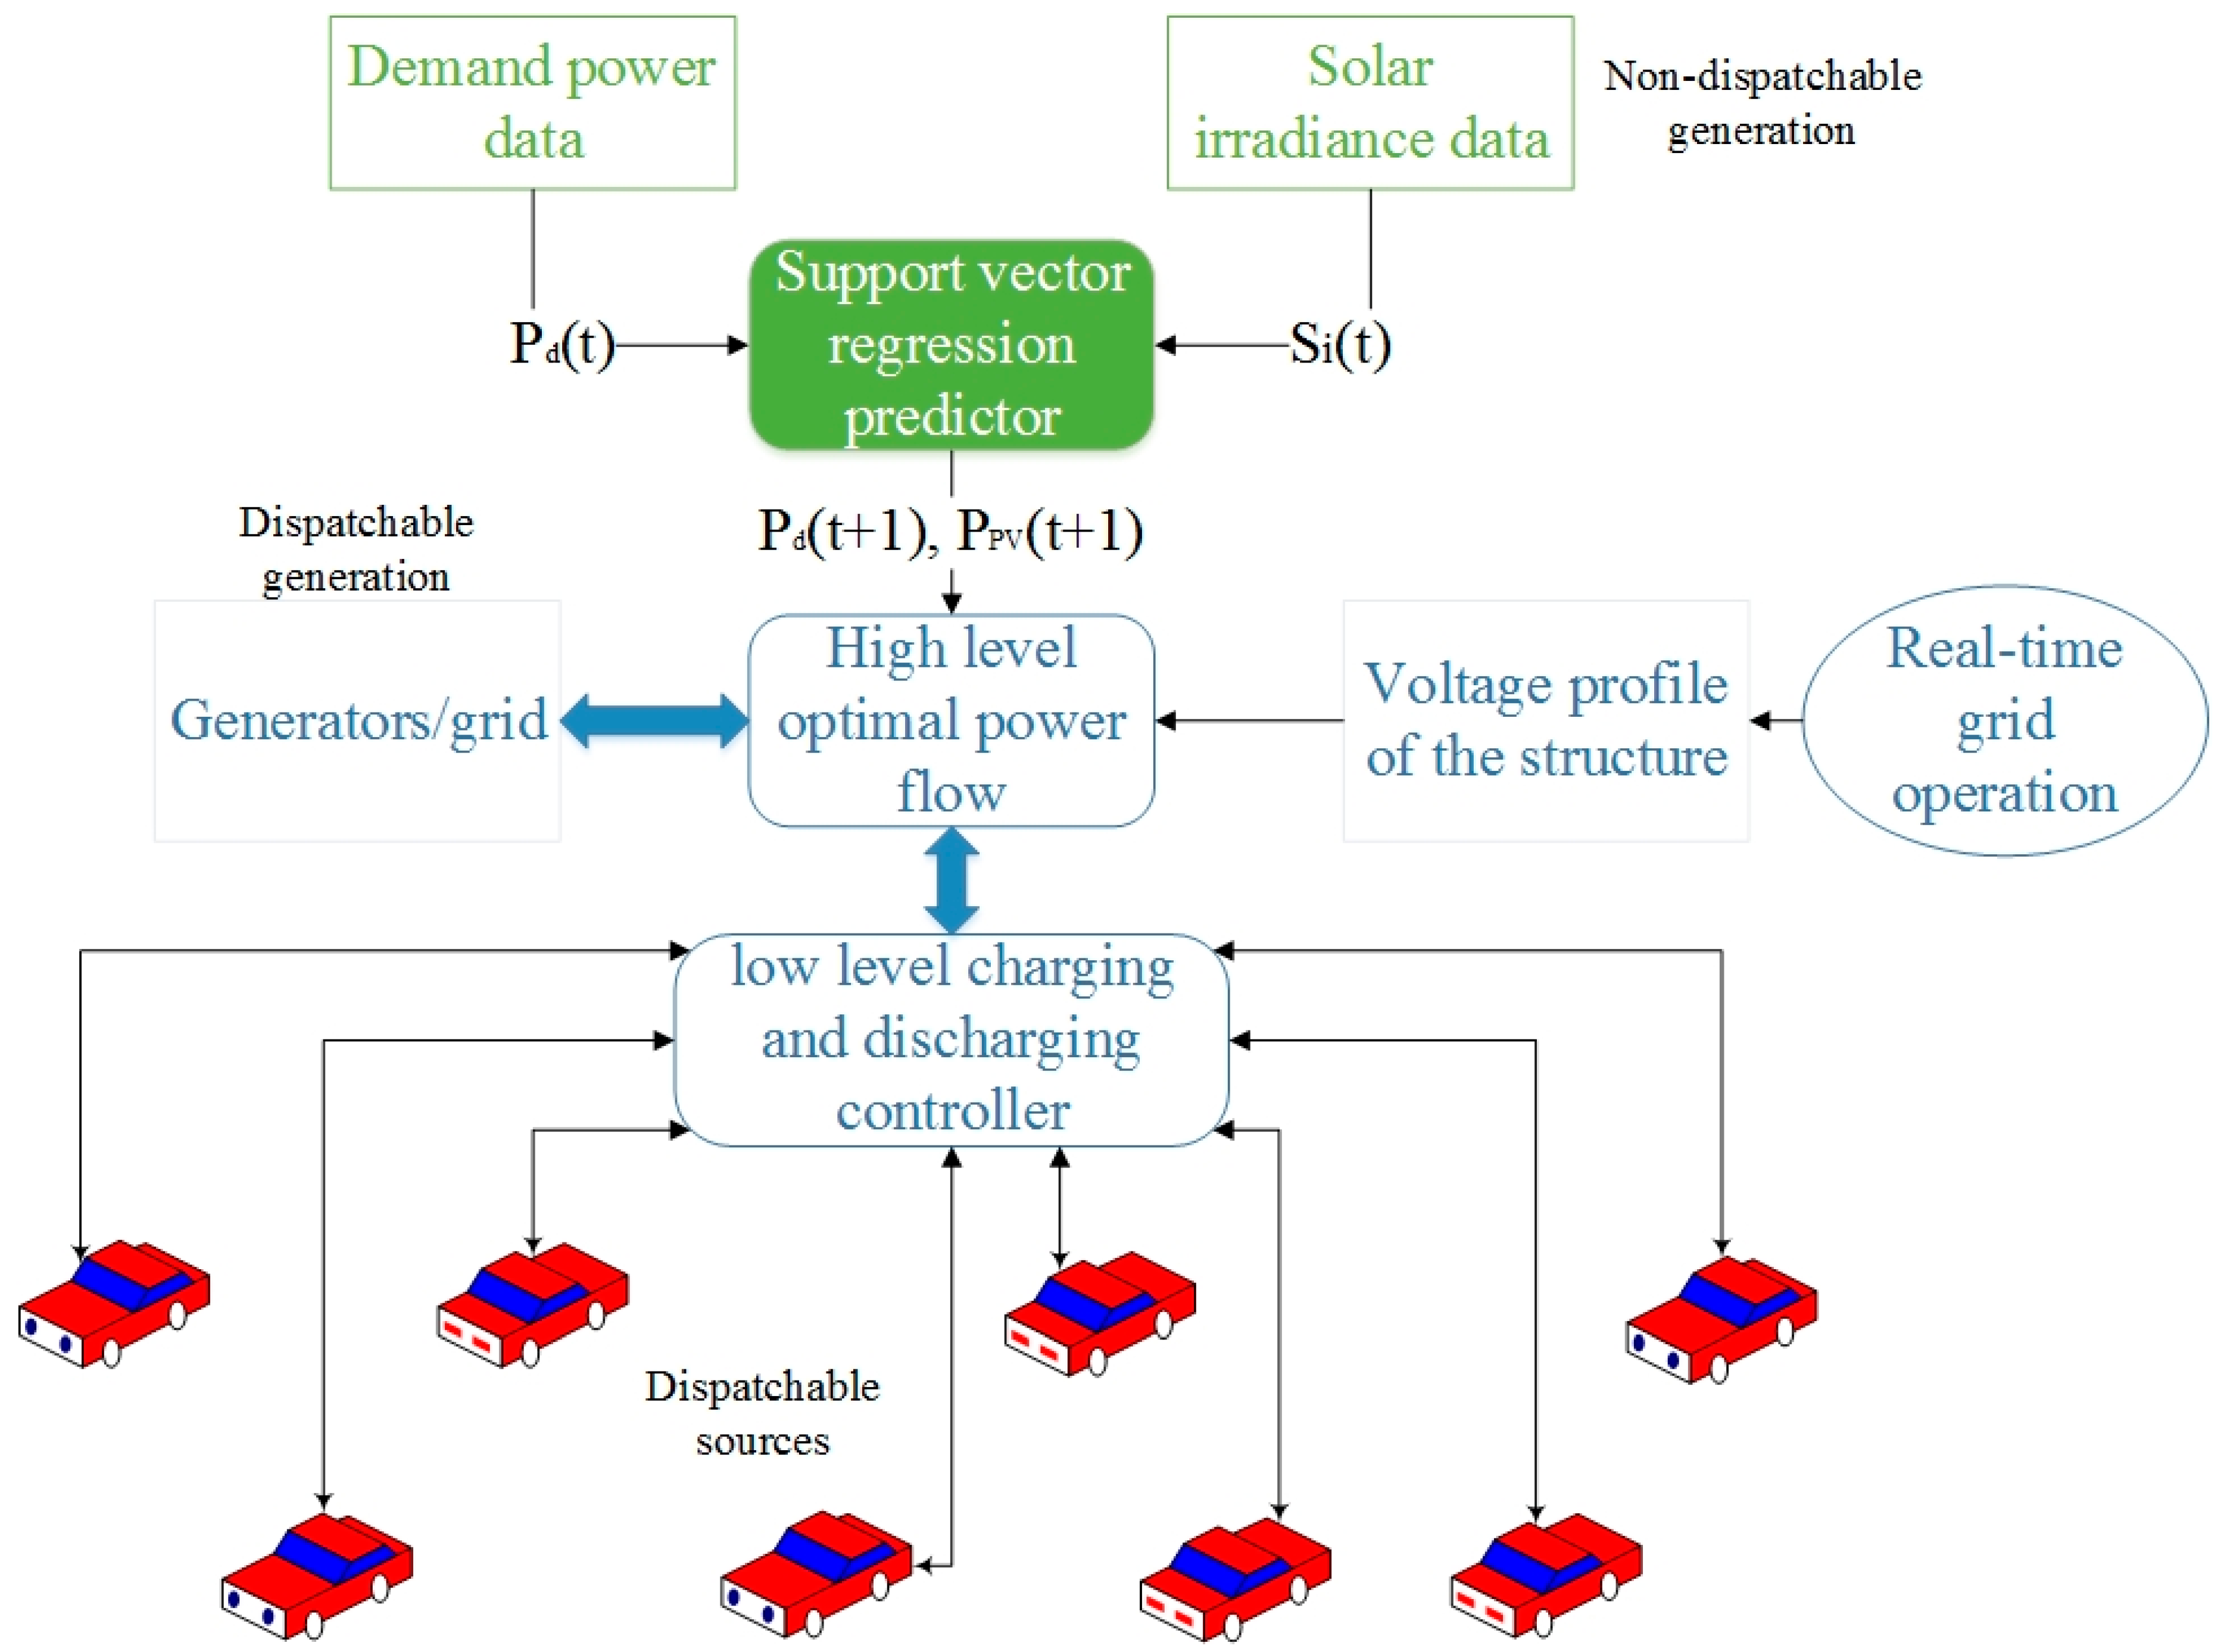
To deal with such challenges, one-step prediction can ensure that the optimal power flow algorithm responds effectively and quickly to severe operation time when the environment or search space changes, thereby tracking the correct Pareto front for each time sequence as a centralized control. Then the optimal bi-directional power flow is shared among EVs by a decentralized control or low level control based on SoC and the capacity of each EV. Figure 2 describes the proposed hierarchical control structure, which consists of two layers.
The upper or high level layer defines the required energy from dispatchable sources such as EVs as well as the electric grid and non-dispatchable sources. Renewable power generation units are known as the non-dispatchable cluster. By predicting characteristics of both non-controllable demand and non-dispatchable sources, the top-level optimal power flow estimates the required energy that should be supplied by the aggregator and grid to non-controllable loads at each long sampling time, or the injected energy from non-dispatchable sources to the aggregator. The low-level control algorithm allocates the required energy, optimized by the top-level control, to non-controllable loads to maintain normal operation of the nano-grid. In the low-layer, EVs are individually controlled according to their SoC and capacity.
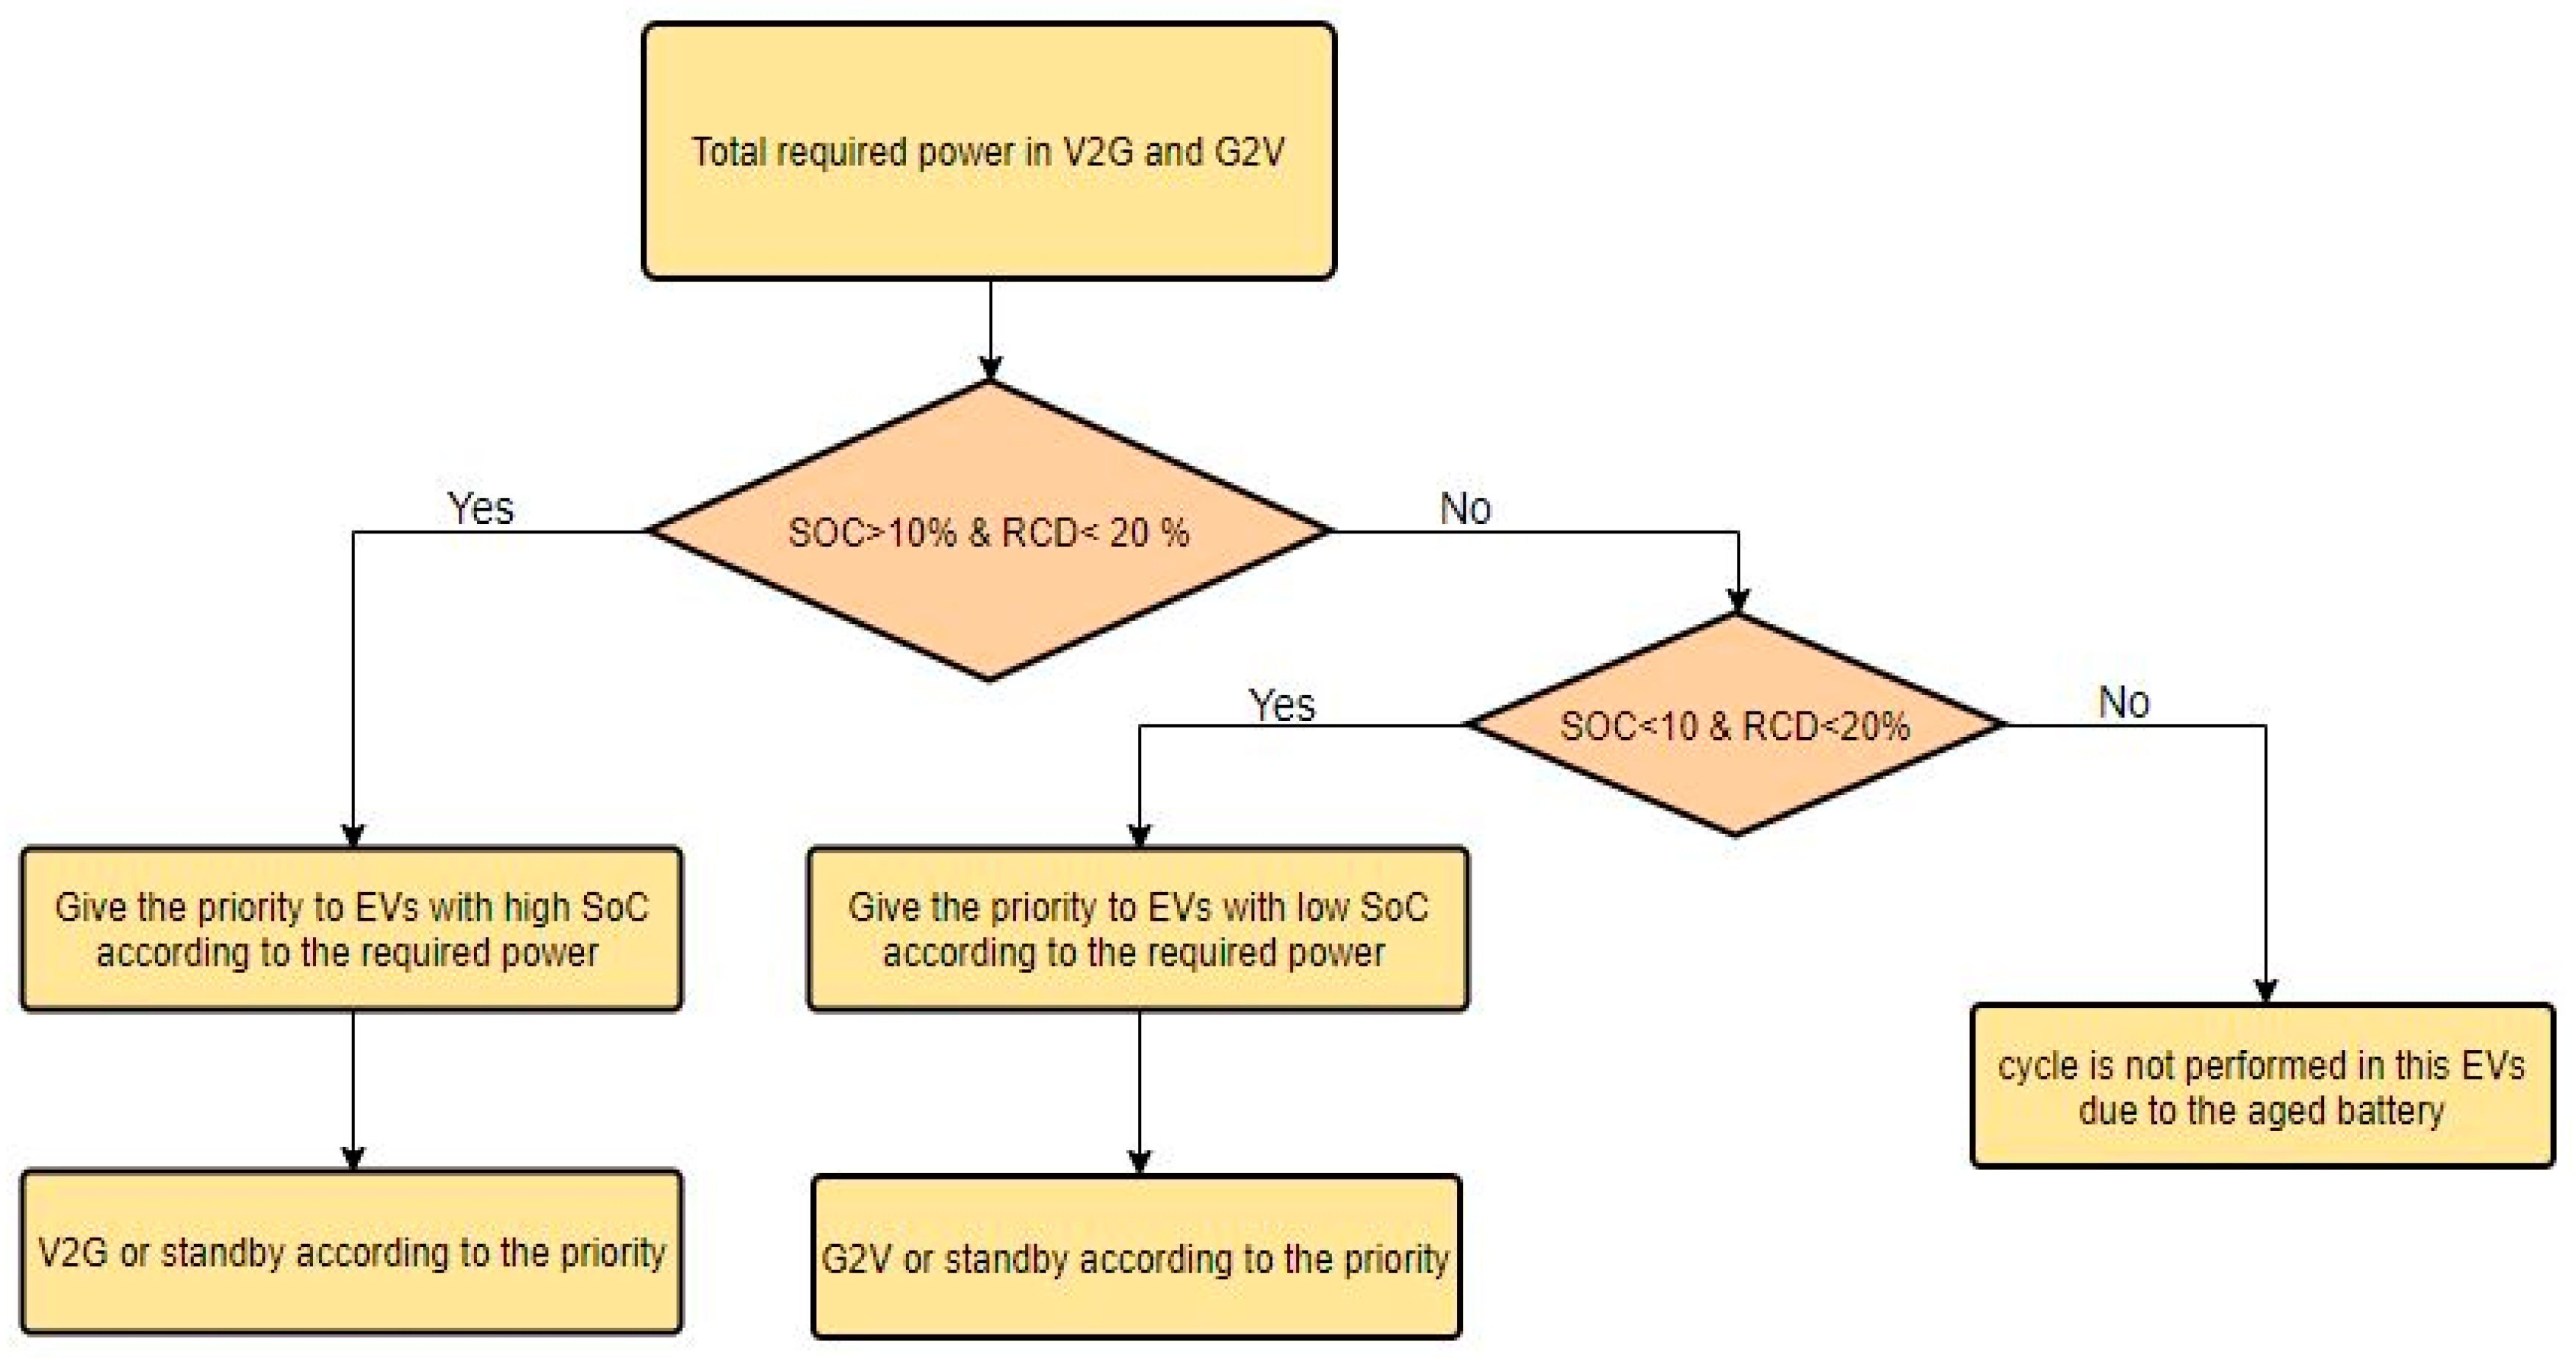
Figure 3 shows how the EVs are controlled individually by the low-layer of the controller. For instance, if an EV has a high SoC compared to other vehicles, it has the priority for V2G service if its relative capacity degradation is less than 20% of nominal capacity. Hence, a robust technique-based predictor is combined with an optimal power flow problem to estimate the required energy needed for grid stabilization. Then in the bottom layer, a controller schedules charging and discharging of a fleet of EVs based on the energy requested by the top-layer.
2.1. Support Vector Machine
Support vector machines (SVMs) have gained the attention of researchers owning to their excellent empirical successes and strong theoretical foundations. Further, the SVM is capable of being applied to a wide variety of tasks from financial time series to bioinformatics [24]. The technique has also been widely used for classification and regression problems. A support vector machine is able to model effectively non-linear systems by means of mapping the input vector space into a higher dimensional feature space [25]. The idea behind the SVM technique is to map a low-dimensional space of the historical time series data into a higher dimensional feature space through a nonlinear mapping ; then the high-dimensional feature space, still describing the behavior of the system, is solved via liner regression to predict the defined horizon. This procedure, mapping low-dimensional feature space to high-dimensional feature space, is equivalent to a nonlinear regression problem with a low-dimensional space [26]. In SVMs, the target value, which is known as the class label, usually consists of (−1 or 1). The support vector regression (SVR) is the SVM utilization for function approximation and regression. SVR employed to estimate a function, where xi, and yi represent the input vector and the target value. The total number of data sets is n. in this regard, the linear regression function can be as follows:
The effort then focuses on finding a function f(x), returning the true output yi. Note that the above equation is the function for a linear case. is the high-dimensional feature spaces, is weight coefficient, x is a set of training parameter, and b is the deviation value. As mentioned before, to obtain , Equation (2) should be minimized as follows:
where are the positive slack variables, and C is the error penalty. A kernel function can be employed for mapping nonlinearly separable data into a higher dimensional feature space, with low computational cost. However, different kernel functions can be implemented, and the Gaussian Radial Basis Function (GRBF) kernel has proven to be reliable. It is described in detail elsewhere [27].
2.2. Optimal Power Flow Problem
Optimum power flow (OPF) algorithms are widely used in operation and planning of active distribution networks. Generally, the OPF is recognized as a non-convex and non-linear problem, consisting of objective functions (OFs) that should be minimized or maximized by considering a set of equality or inequality constraints. Indeed, an OPF algorithm is a technique for optimizing the given OF by determining optimal settings for the controllable variables while satisfying the constraints and without violating operational limits [21]. With the increasing penetration of EVs and renewable power generation units, an OPF algorithm is indispensable for successful coordination between non-dispatchable and dispatchable sources and PSs. The OPF algorithm can be used in controlling and ensuring secure operation of a fleet of EVs and renewable energy sources. Indeed, the OPF problem is a tool for taking into consideration constraints and objective functions. To solve the OPF problem, wide linear convex relaxations and metaheuristic algorithms have been introduced in the literature [28], including particle swarm optimization, bacterial foraging methods [29] and artificial bee colony algorithms [30]. Nevertheless, metaheuristic algorithms generally have a substantial calculation burden, creating a problem for the real-time management of power flow in power systems. In other words, this computational requirement leads metaheuristic algorithms to be used in small networks, e.g., micro-grid or nano-grid [29].
The three-phase optimal power flow (TOPF) is similar to the single-phase optimal power flow problem. The single-phase OPF model is formed based on the use of the sole positive sequence component model, while three-phase optimal power flow can adopt both multiphase models and sequences. The OF of the TOPF can be formulated as follows:
Here, f is the objective function, and u and x are the control and state variable vectors, respectively. The vector u consists of a set of optimal required powers that should be injected or drawn from the grid to maintain the normal operating condition, which can be defined as u = [PV2G1, PG2V1…, Pgrid, Qgrid]. Also, h, and g are a set of inequality constraints, and may consist of voltage boundaries, capacity and thermal limits, maximum injected power, or other factors, and equality constraints, respectively. In addition to inequality constraints, equality constraints include a set of load-flow equations. To smooth and guarantee the feasibility of the solution for each sequence, inequality constraints can be defined in the OF, acting as soft constraints. Nevertheless, some inequalities such as voltage profile boundaries should be defined as hard constraints. In this regard, Equation (3) can be rewritten as follows:
Here, hi is the ith penalty function and f is the overall OF. In this article, the overall objective function is to maintain the normal operation of the nano-grid when its stability is challenged by the inherent dependency of PV on weather conditions and by a fleet of EVs. In this regard, the first objective function can be expressed as follows:
where Ph is the total hours of the simulation, N is the number of buses, and Vik and Vik, space are voltage magnitude at the ith of the jth time and specific voltage magnitude, respectively. The second OF is the line losses, linked to the current of system topology. The total active power loss can be represented as follows:
Here, Zij and Rij are the impedance of the line between the ith and jth nodes or buses. Also, and are the deference phase-angle between the ith and jth nodes, and the voltage magnitude at bus ith. The equality and inequality constraints can be written as follows:
where PPV,t, Pdisch,t and PGrid,t are the active powers extracted from the PV farm, the aggregator consisting a fleet of EVs in the discharge mode, and the main grid, respectively. Also, Pch,t, and PLoad,t are respectively the active powers gained from the system by the aggregator and the load. Besides, the introduced TOPF problem formulation, the PSO algorithm is described in a previous article by the present authors [3], implemented and adapted to the introduced architecture to solve a TOPF problem.
2.3. Battery Pack Model
As stated before, price reduction of energy storage devices is needed to increase the penetration of electrified vehicles in the marketplace. Due to the economics of the charging and cycling operations that vehicle manufacturers need to take into consideration, aging models are important in research and development. Modeling the capacity fade evolution over time can help provide effective strategies to enhance battery durability and properly manage the warranty. In this regard, several practical alternative explanatory methodologies for EV battery degradation modeling considering key aspects have been introduced in the literature. They can be classified into three model groups: fatigue approach [31], semi-empirical [32], and electrochemical [33].
Fatigue approach models are based on the Palmgren-Miner theory, which is generally applied to mechanical components. Although the merit of the approach is compatible with the cumulative degradation technique, the approach is not able to describe the calendar aging part due to its inconsistency when stress factors are constant [34]. Contrary to the fatigue approach, modeling of the aging mechanism based on electrochemical reaction represents the perspective of chemical kinetics. In this approach, many parameters must be determined and most of them cannot be measured or validated. In addition, the most challenging issue regarding electrochemical modeling is that the electrochemical models cannot be evaluated in terms of long-term aging performance due to time-consuming and facility limitations. As a consequence of the merits and drawbacks of the aforementioned models, a semi-empirical long-term cycle life is developed based on an empirical cycle life model with 20 Ah NMC cells, whose information is summarized in Appendix A. Note that capacity degradation represents the total available discharging or charging capacity, while the cell is subjected to various operating conditions (different stress factors) that can affect its performance. An aging test is necessary to consider several stress conditions, known as external parameters, the most important of which are taken to be the following in this article:
- Depth of discharge (DOD), quantified as a percentage (%)
- Number of full equivalent cycles (FECs)
- Temperature (°C)
- Current rate (C-Rate)
NMC-type lithium-ion cells with a 20 Ah capacity are used to gain experimental data, which can consequently be used to develop a battery model. For this purpose, aging tests have been done to reach the “end of life,” which can be defined as 80% of the beginning-of-life, in automotive applications, determined by discharge capacity test at 25 °C. To model the stress factors on battery lifetime estimation, extensive testing is required; therefore, as can be seen in Table 1, various combinations of cycling conditions are quantified and considered. As the effect of capacity loss is of greater interest than the aging mechanism at the system level, the focus of the authors is mainly on capacity loss instead of aging mechanism. Nevertheless, further details and information on aging mechanisms and modeling can be found in our previous articles [32,35,36].
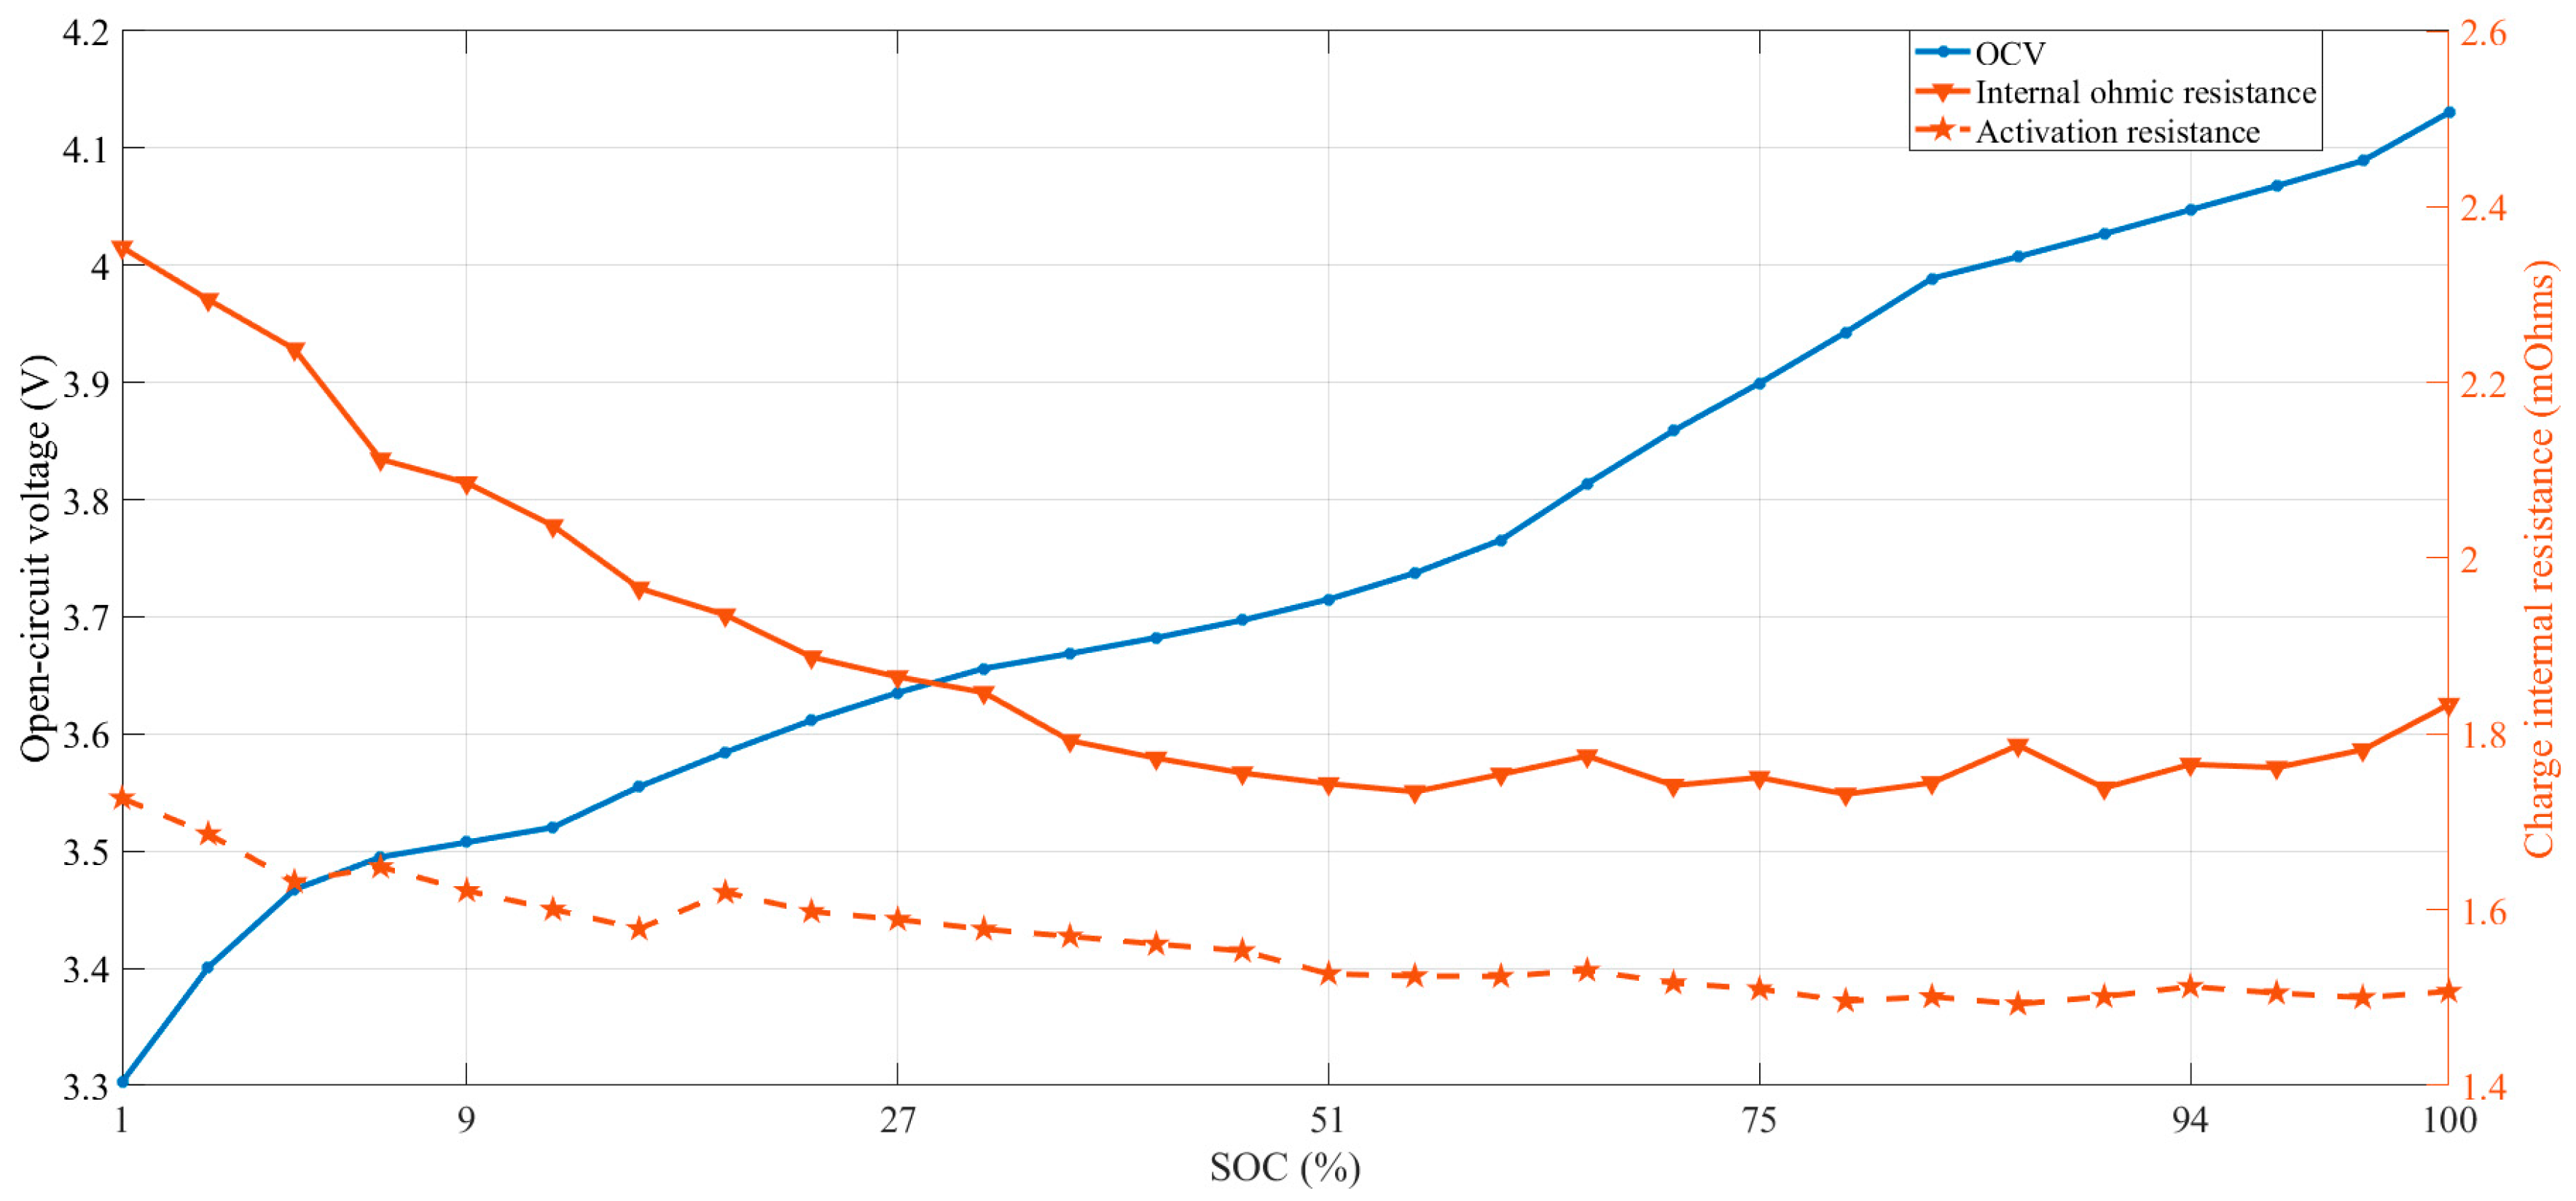
To extend the experimental data of the cell level to the battery pack level, the battery pack is modeled by the first-order model and its parameters were extracted from the Hybrid Pulse Power Characterization (HPPC) test by the recursive least square method. Figure 4 shows the behavior of internal Ohmic and activation resistances through different SoC windows. Afterwards the extracted parameters are embedded in the lookup tables, enabling simplification of the modeling of battery pack behavior and reducing the time use if a fleet of EVs is intended to be considered.
3. Results and Discussion
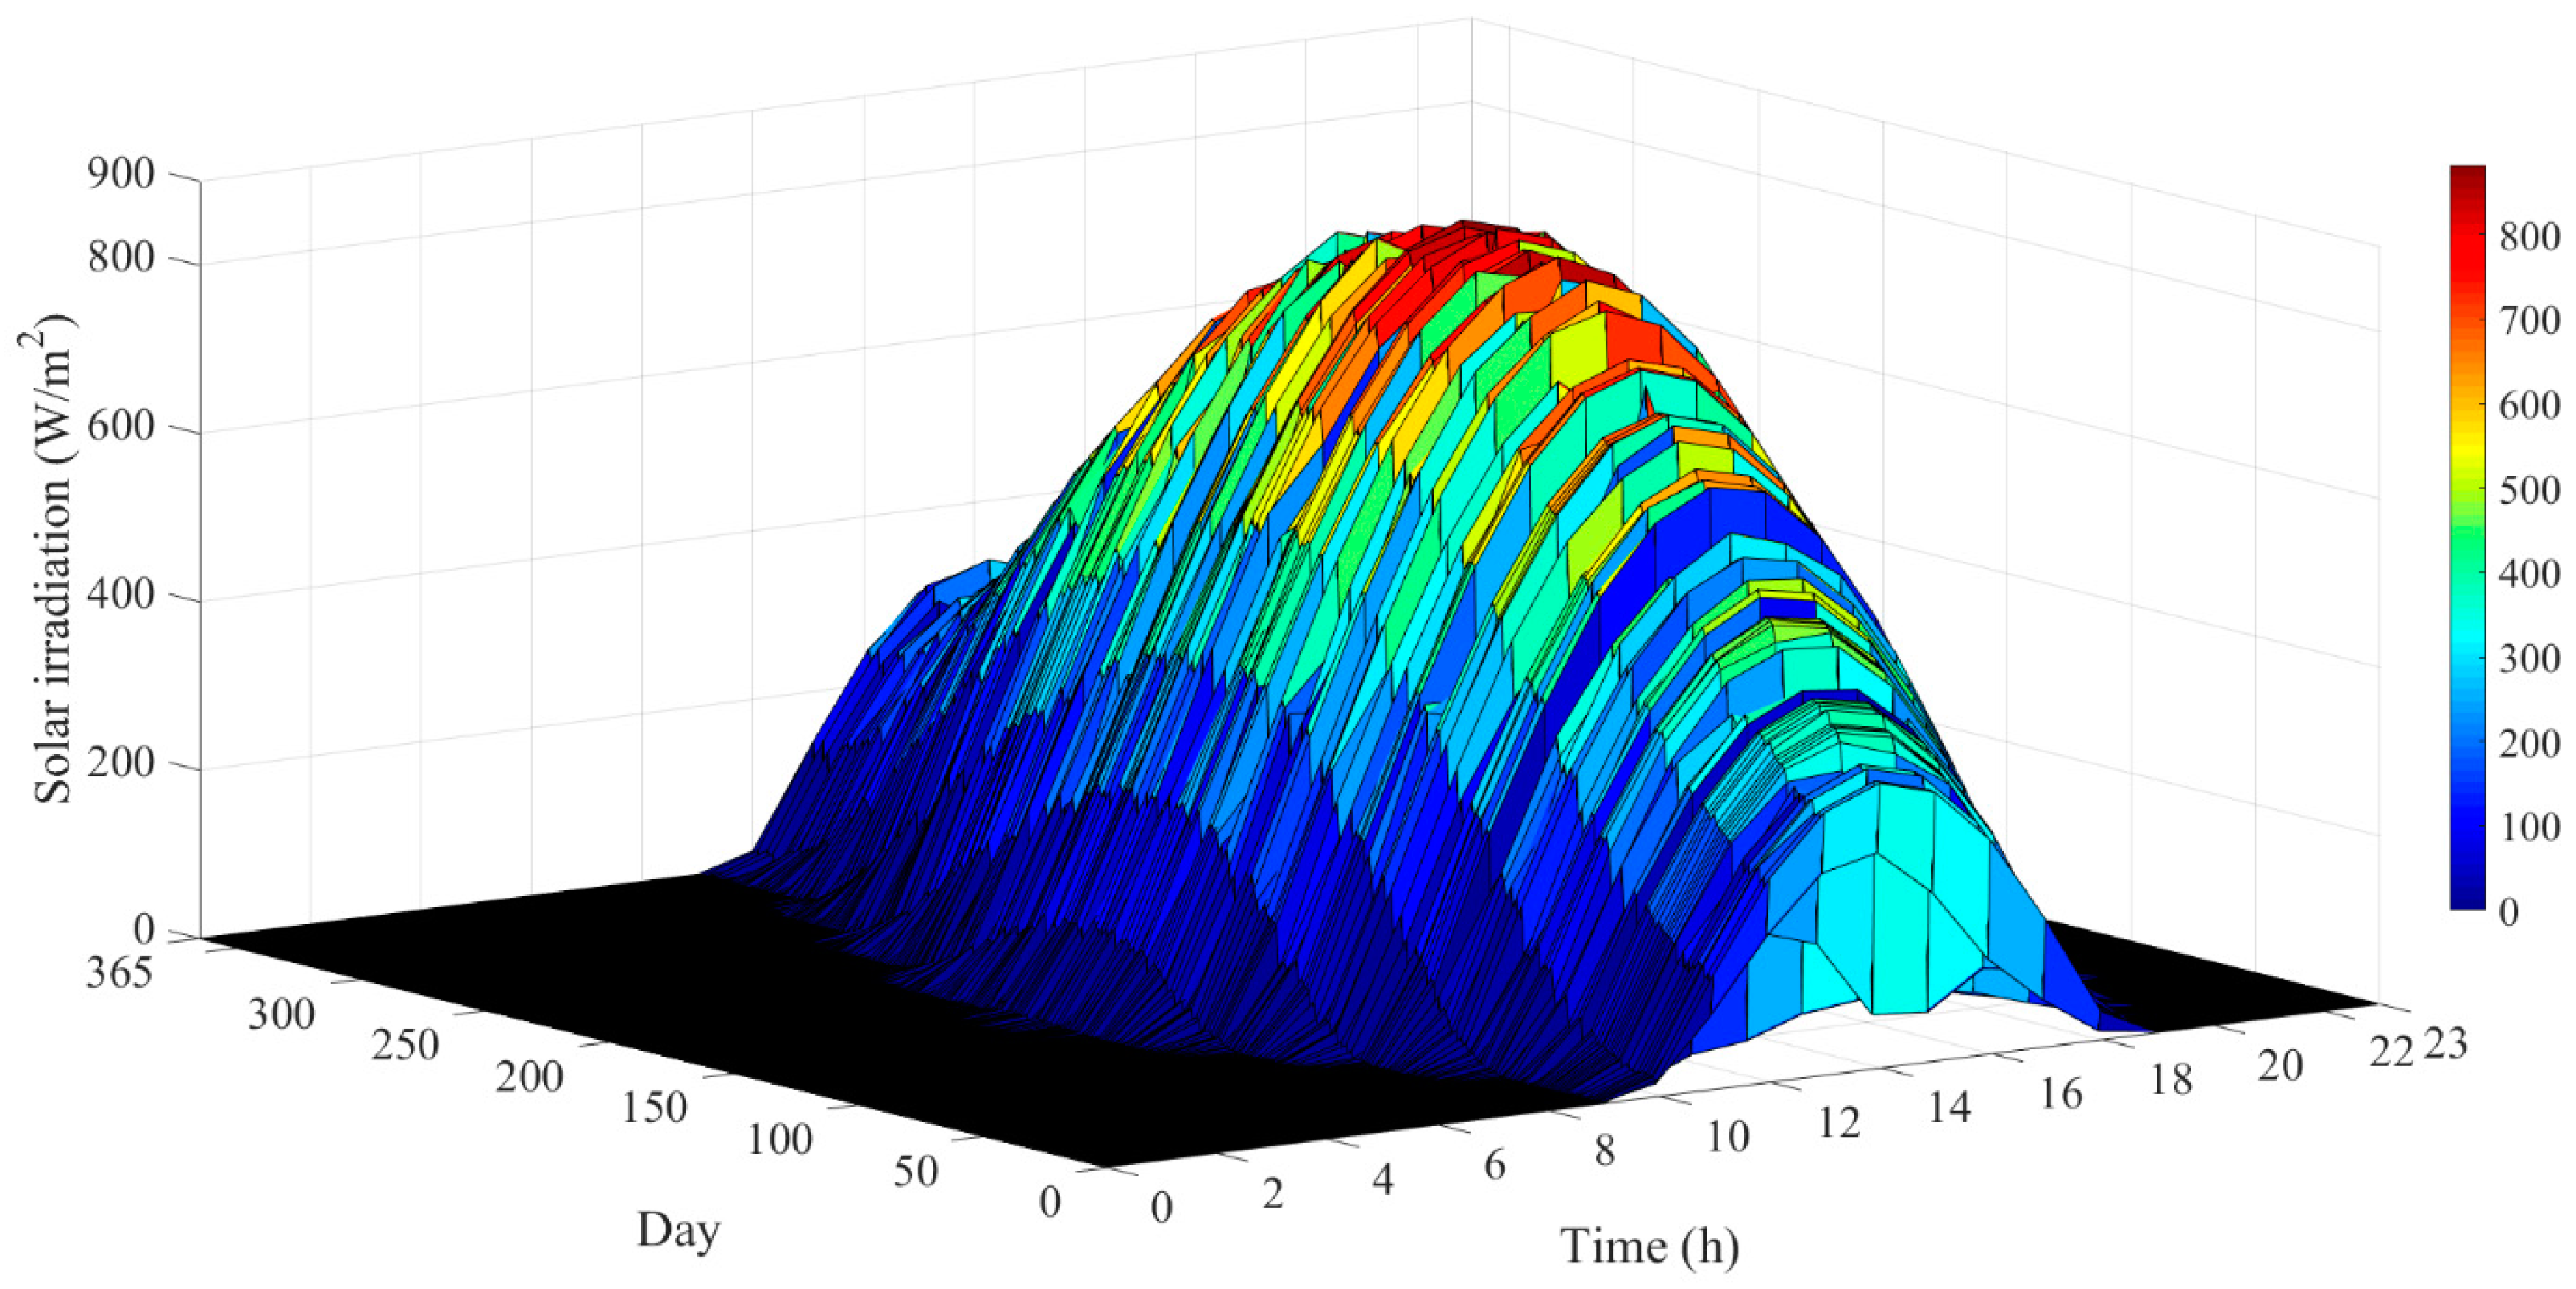
All simulations were run on a PC with 2.70 GHz Internal Core i7-6820HQ CPU and 16 GB of internal memory. The measured received solar irradiance on the horizontal surface for one year (8785 data points) are utilized. Figure 5 shows the solar irradiance dataset of the study located in Brussels, plotted in 24 h throughout the year. For the first step, the SVR was trained with the experimental data, depicted in Figure 5. Thereafter the SVR network was tested and evaluated via applying the common statistical indicators, the root mean square error (RMSE) with the forecasted and the actual test data. The inputs for the network are the temperature, relative humidity, and previous step irradiance data, collected from [37].
The size of input sample data for training the network and the data which was not used in the training process (test data, for validation) are 7028, and 1757, respectively. In the SVR, polynomial functions were adopted as the kernel functions to predict solar irradiance and demand one-step ahead. Considering the predicted and the actual test data, which were not utilized in the training process, this section compares the results of applying the SVR with actual data.
According to the results, the algorithm performs efficiently in forecasting of the solar irradiance from the input parameters described previously. As illustrated in Figure 5, the forecasted values (outputs) follow the complexities and nonlinearities of the actual test data (targets), even when sudden changes occur. Along the same line and as shown in Table 2, favorable RMSE values support efficient performance of the predictor system.
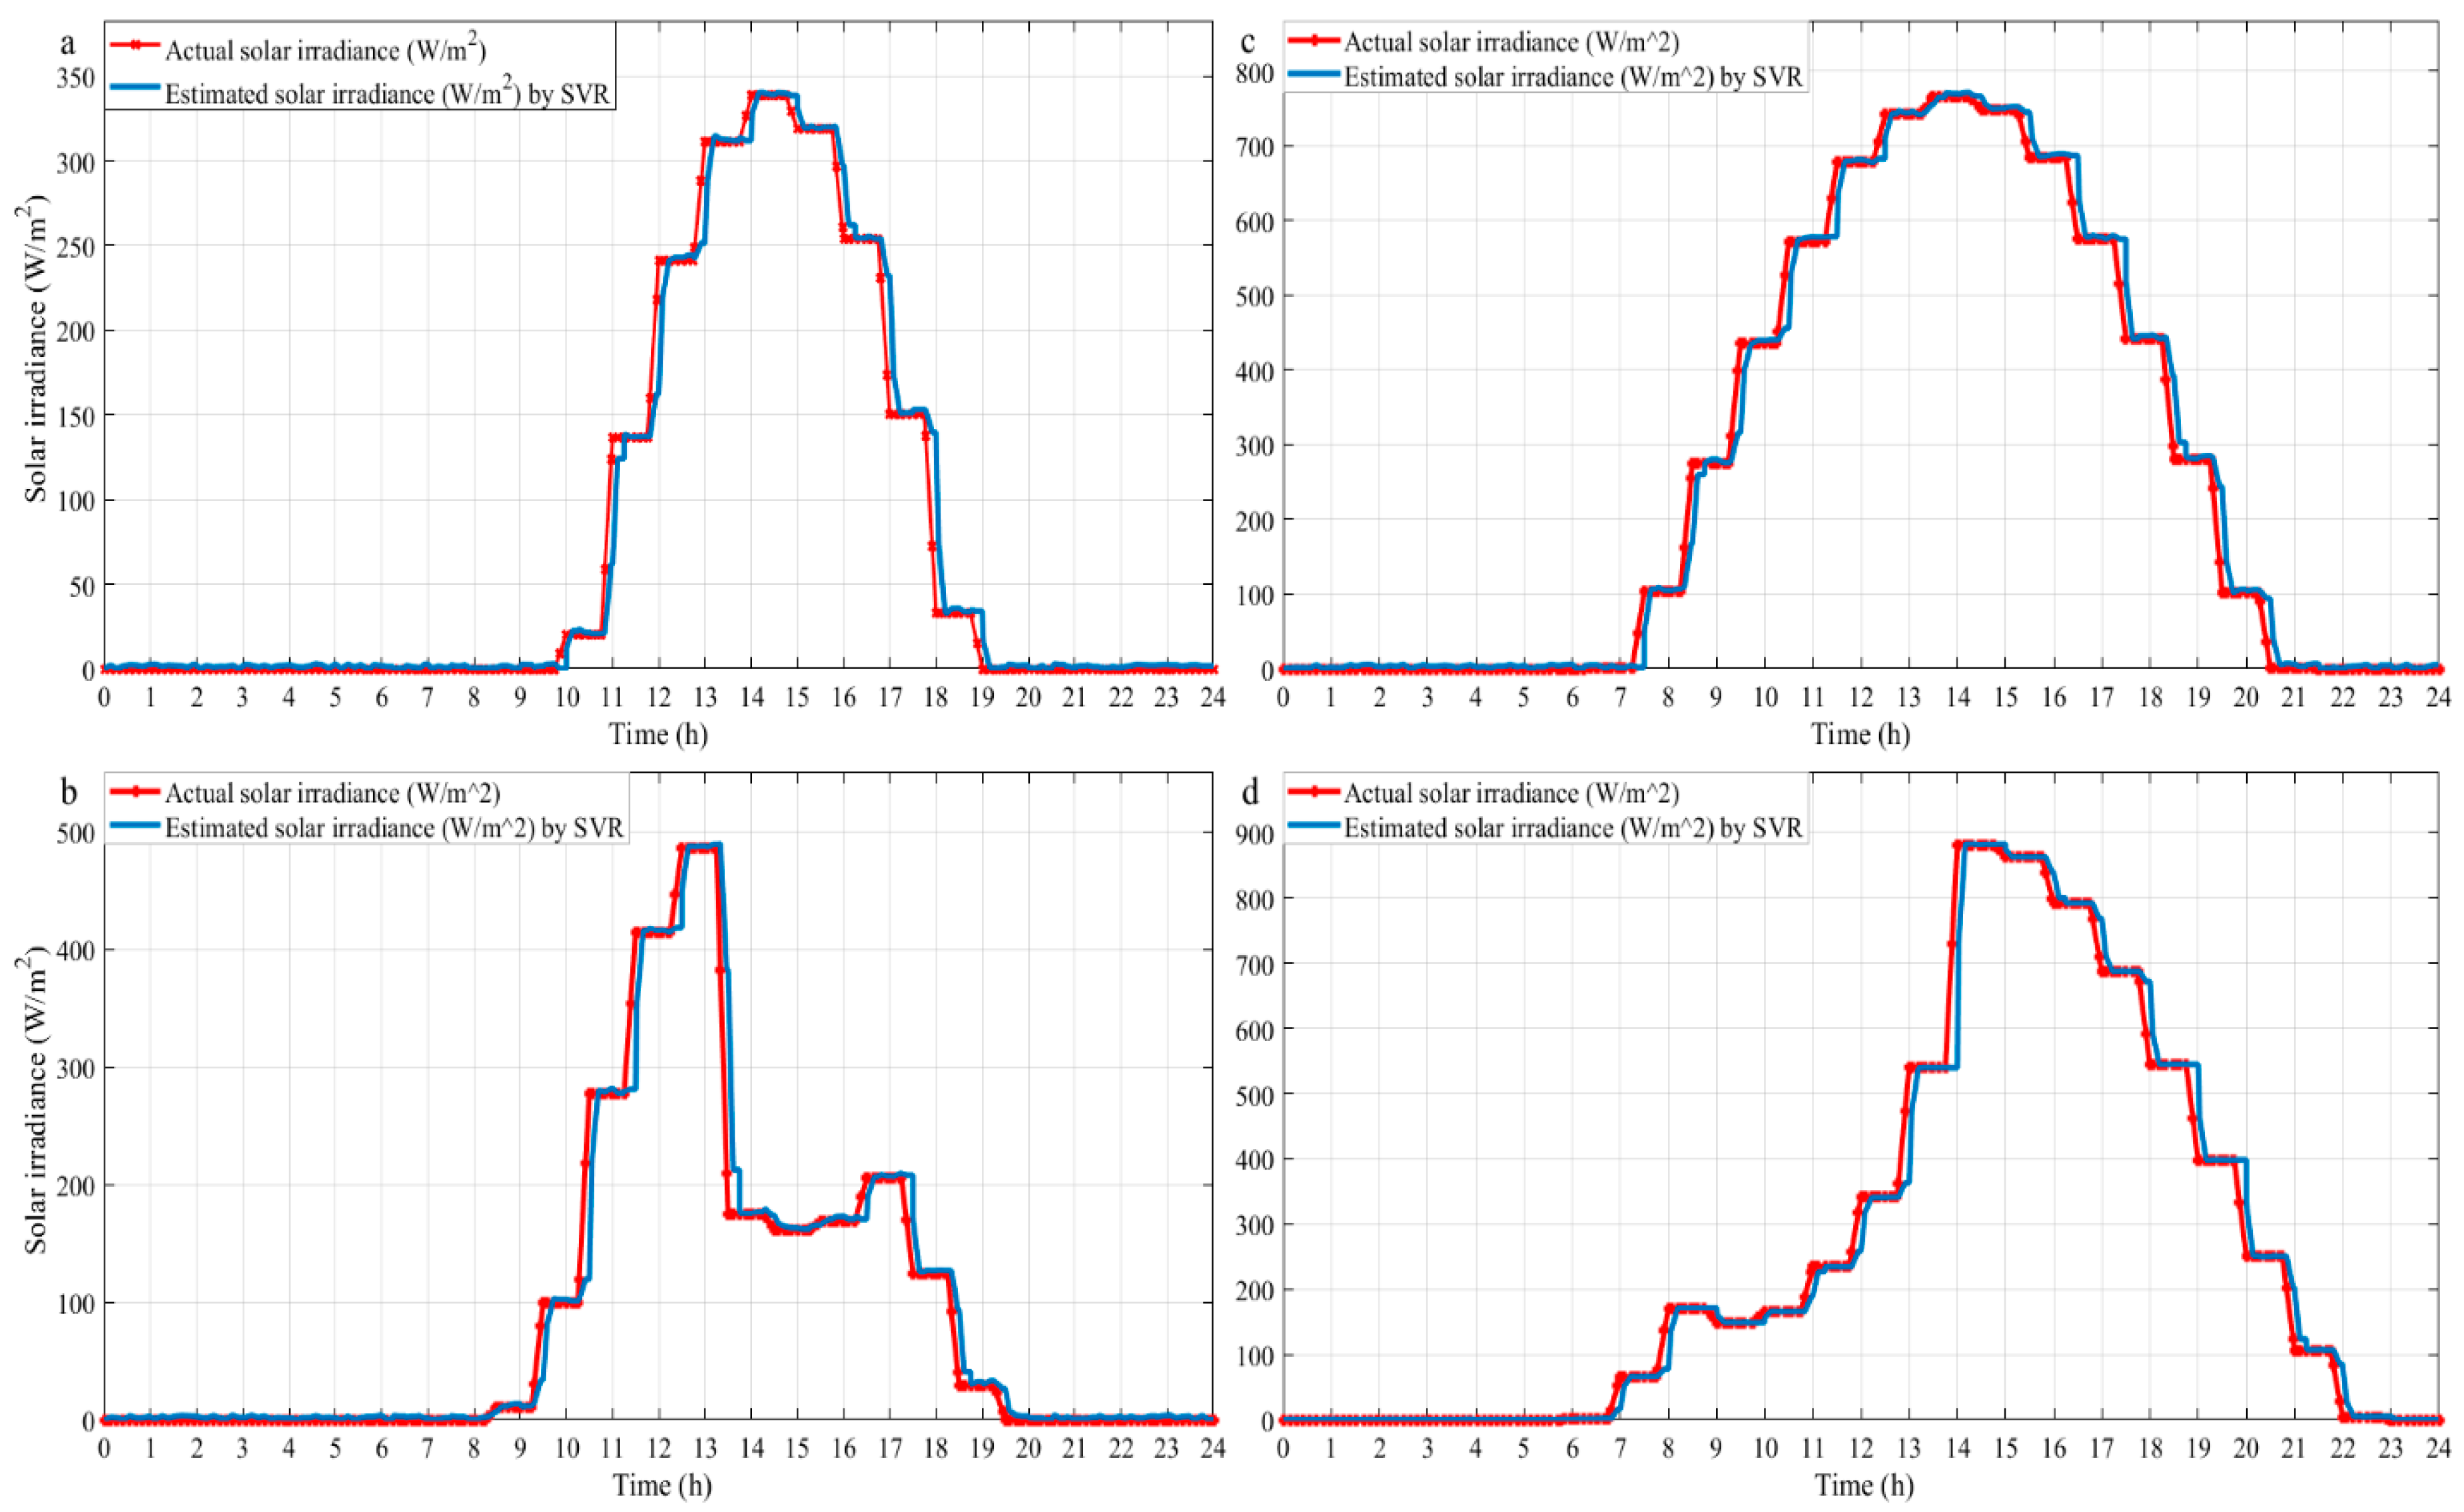
Figure 6 shows the prediction results of four days (1st, 50th, 100th, and 150th) of 2017, indicated by a,b,c, and d, respectively. The actual irradiance is highlighted by the red color, and the blue color indicates one-step-ahead prediction of irradiance. The horizontal axis is time, and vertical axis is solar irradiance (in W/m2). Figure 6 demonstrates that the SVR can predict irradiance accurately, showing its robustness and accuracy.
In order to assess the performance of the technique described in Section 2.2 and to show the effect of the predictive optimal power flow strategy on the characteristics of the power system and to demonstrate that the proposed strategy has the capability to handle the integrated fleet of EVs and PV farm to stabilize and deal with the aforementioned uncertainty, two scenarios are defined in this section to evaluate its capability. In the first scenario, EVs are individually charged based on their SoCs and discharged based on the availability of PV power generation to decrease the fluctuation of its output. For the second scenario, one-step-ahead solar irradiance is predicted, and thereafter bi-directional power flow between uncontrollable and controllable resources is optimized, and EVs are individually charged or discharged based on their SoC and capacity to stabilize voltage deviation.
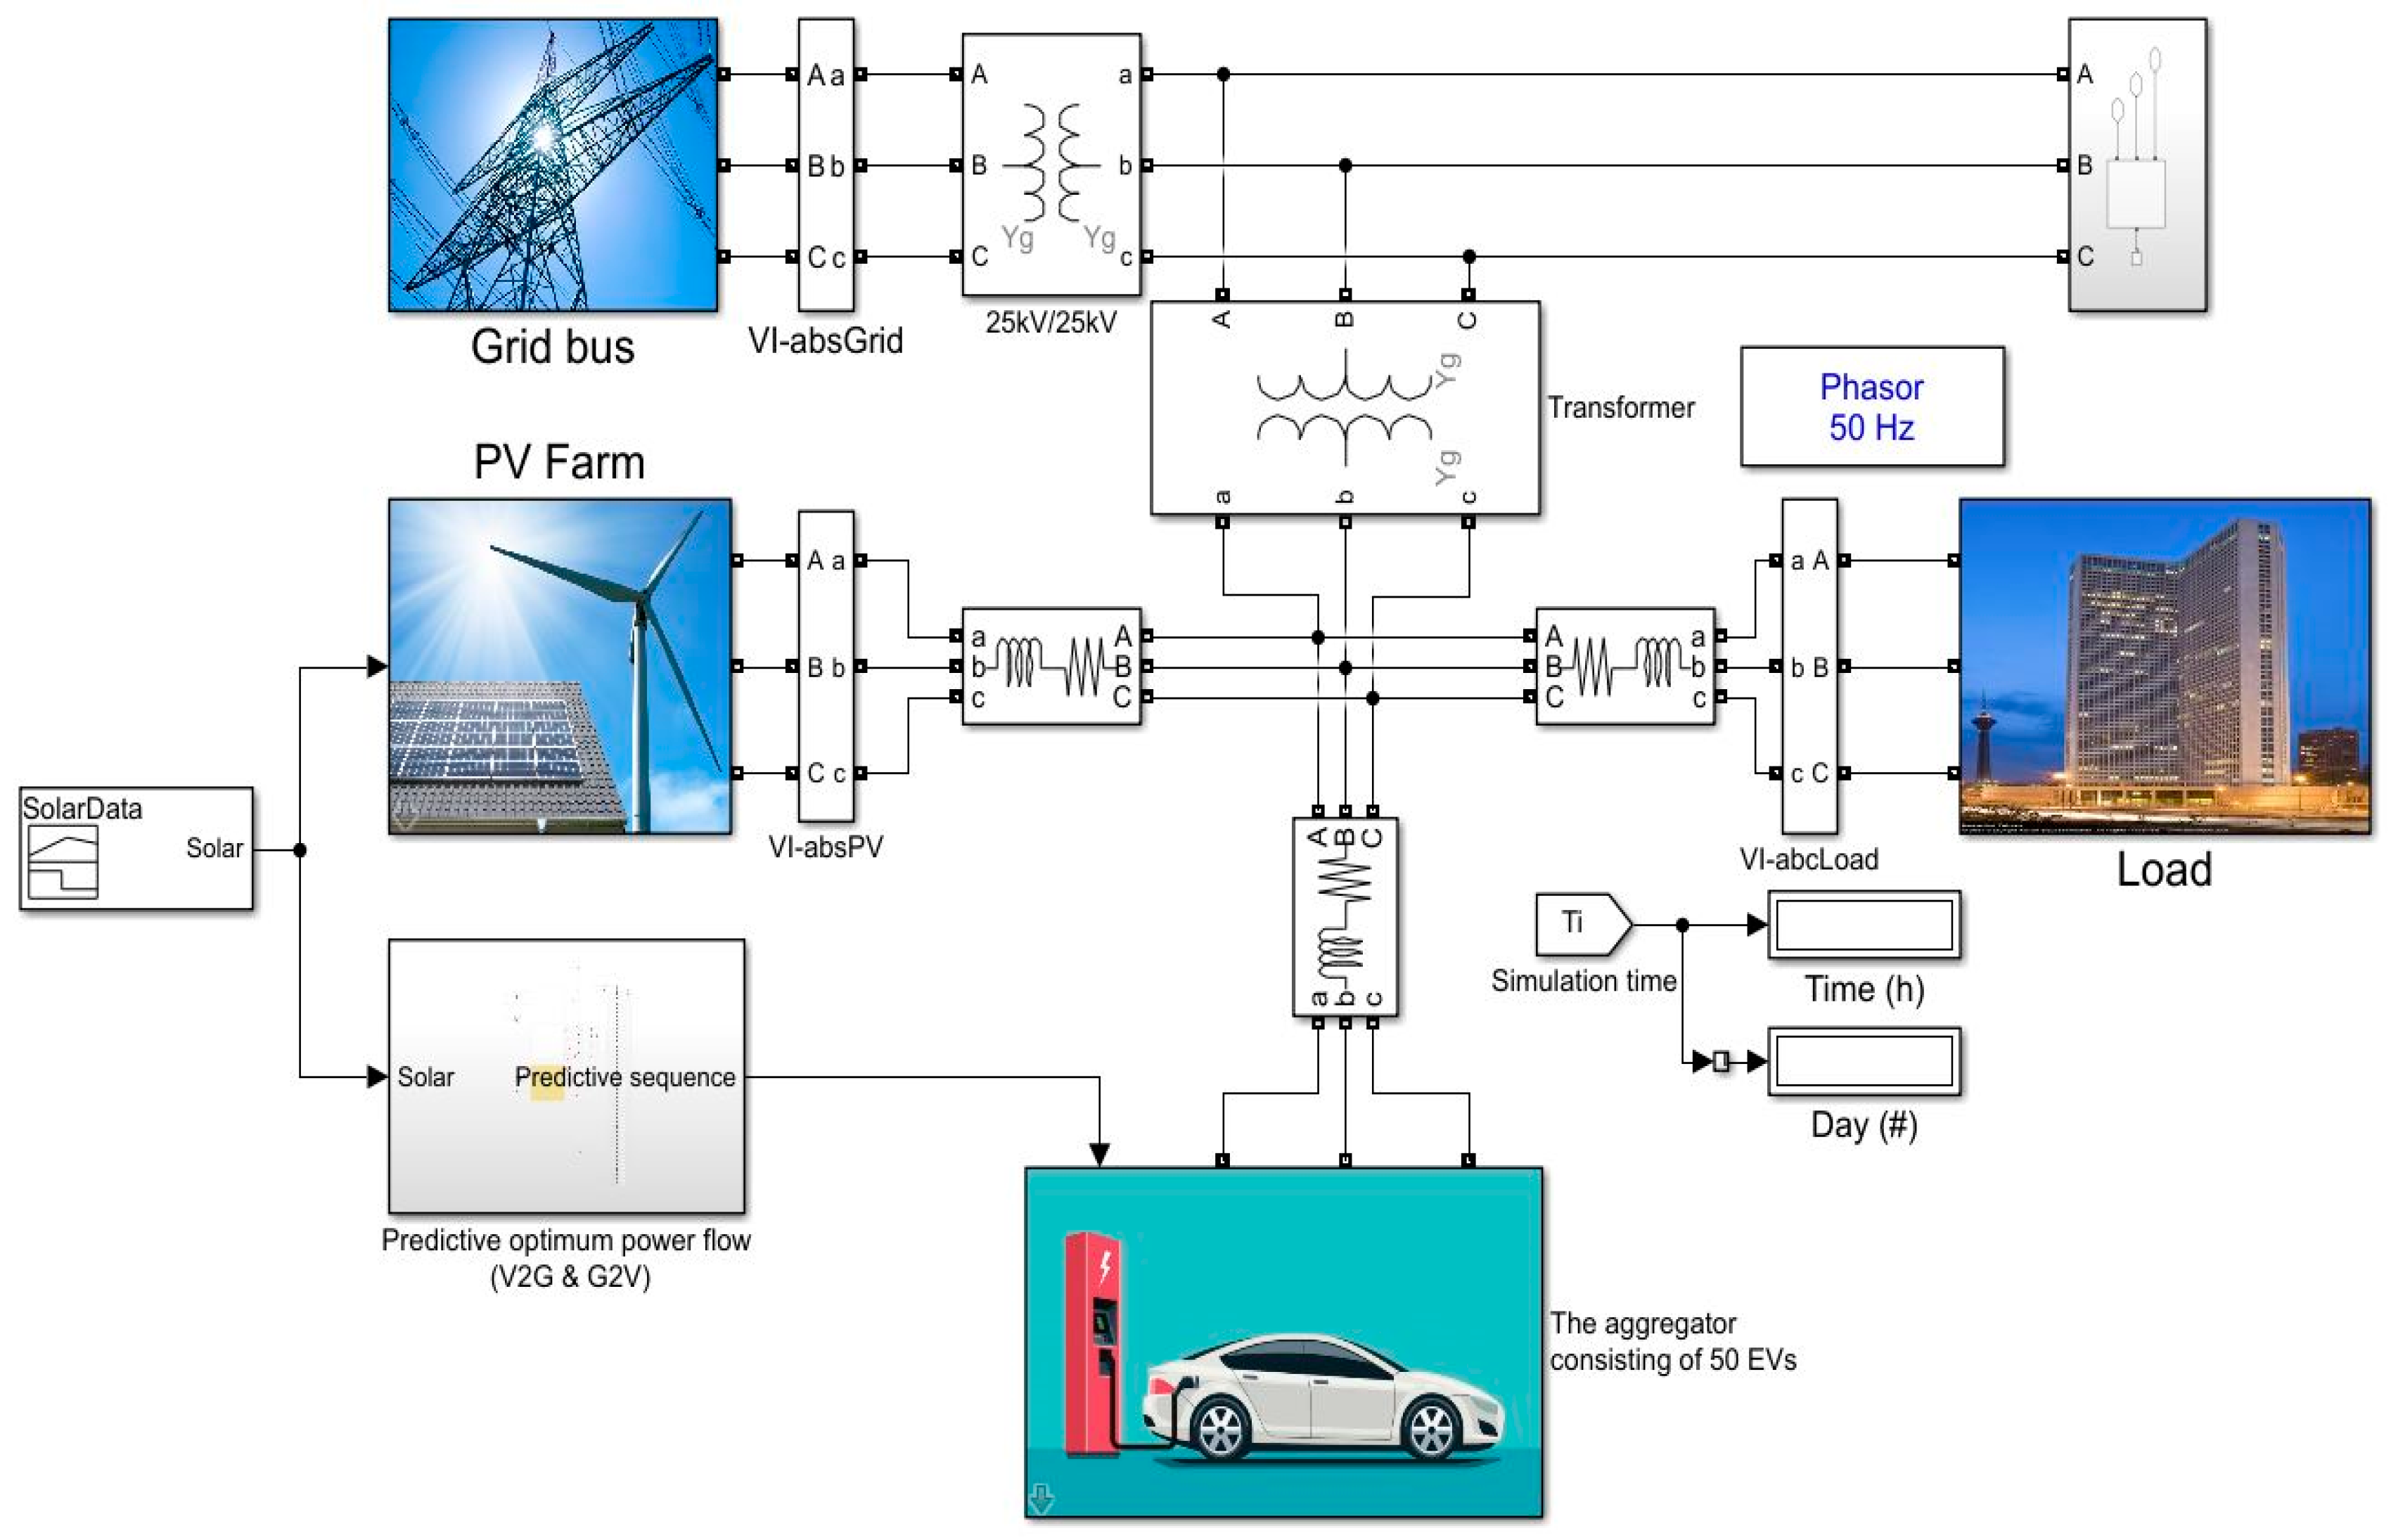
As mentioned before, the primary objective of prediction of renewable energy sources for near future is to determine how much power can be utilized from the controllable resources such as stationary energy storage systems or electric vehicles to stabilize the power system. As a consequence, an energy management system can attain the optimum solution for each time sequence in advance, reducing computational efforts. In this regard, the introduced predictor evaluated previously is implemented in the Matlab Simulink simulation platform. In the second step, the predictor model is connected to the grid architecture, as depicted in Figure 7. The OPF problem of the nano-grid has six decision variables; three of them represent the active power schedule of V2G, G2V, and grid bus, and two decision variables are allocated to the voltages of the grid and the aggregation of EVs. After, the controllable resources can be adjusted to the new operating conditions to reach the Pareto front for each sequence. In this step the OPF algorithm is known as the centralized controller. Indeed, the OPF is employed to predict how much power should be injected or drawn from the aggregator. Then the decentralized controller individually decides whether the EV should contribute to V2G, G2V, or standby phase based on its SoC and capacity.
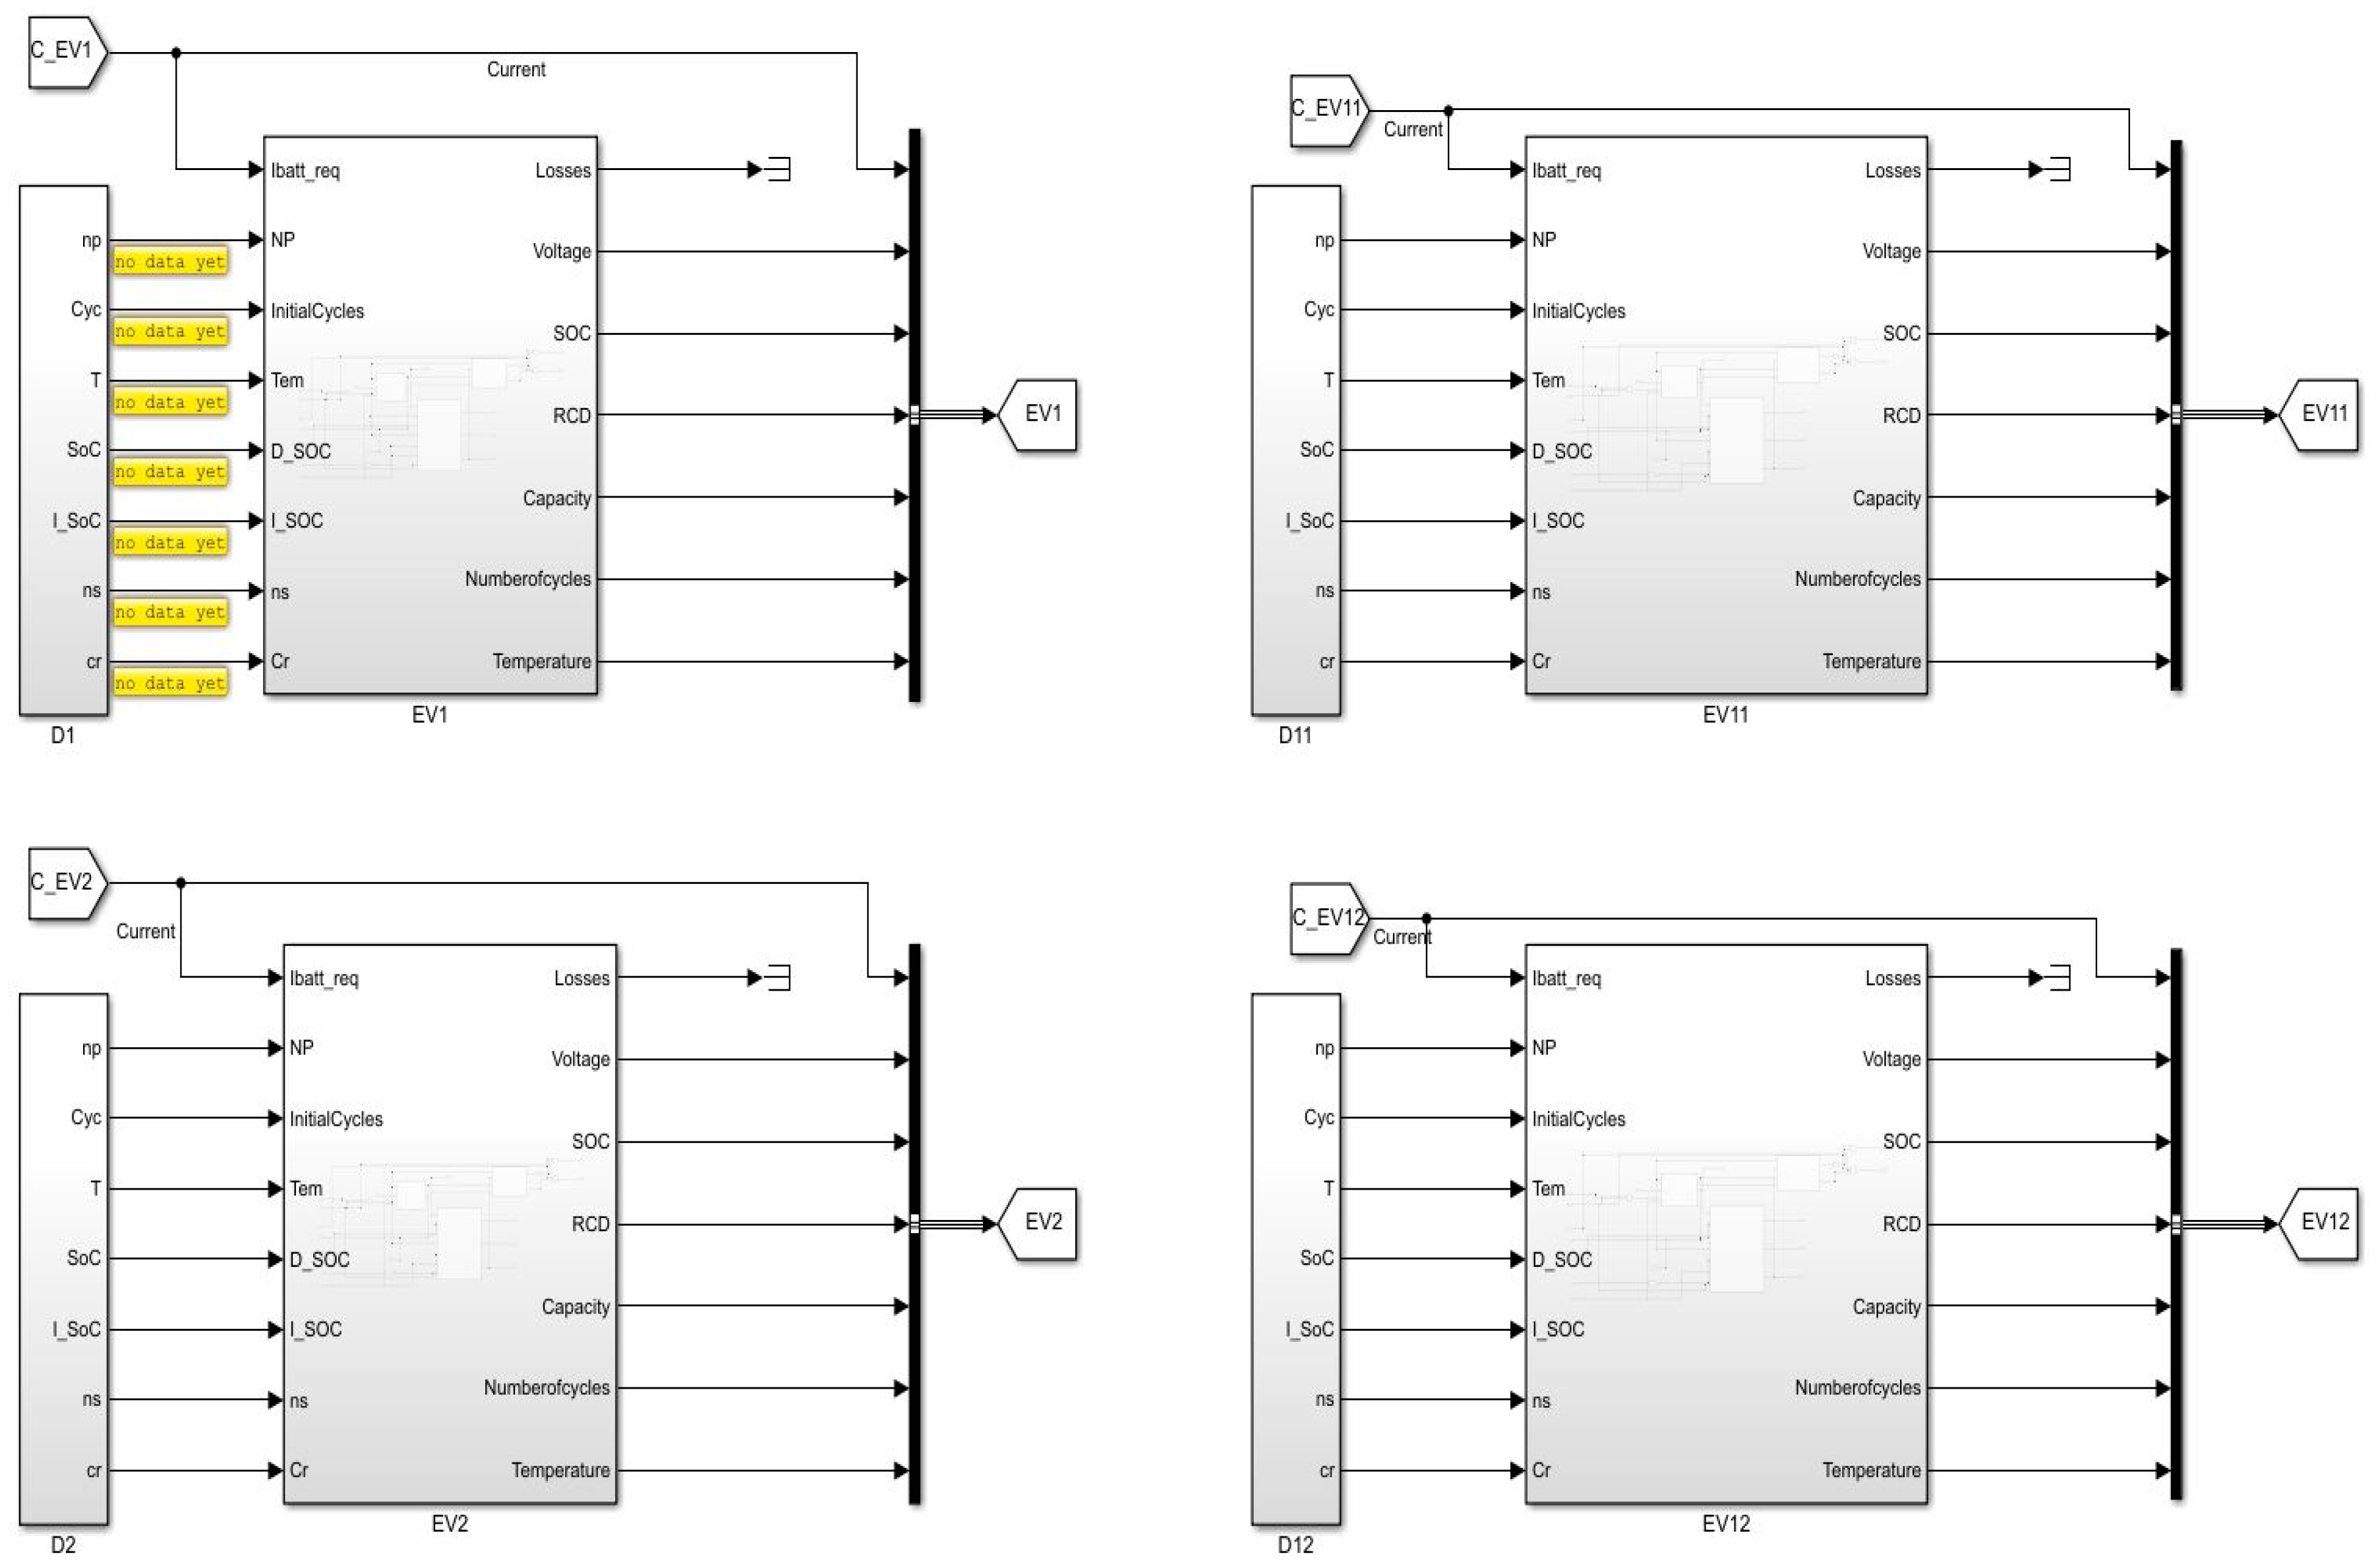
Figure 8 shows four EVs, controlled individually by a decentralized controller. This infrastructure enables engineers or designers to evaluate the effect of various EVs with different battery characteristics on the grid architecture, as the initial SoC, the initial number of cycle, initial capacity, and ambient temperature can be adjusted in this model. The output of the model is voltage, SoC, RCD, capacity, number of cycles, and battery pack temperature, which can provide the users or decentralized controller with valuable information as decision variables. Details on the degradation mechanism and semi-empirical aging model can be found in reference [32].
3.1. Scenario A
For the first scenario, the EVs are individually controlled, charged and discharged based on their SoC and practical capacity to stabilize voltage profile of the aggregator. In this regard, the predictive OPF is disabled. By an underlying assumption, there is always 10% of charge in the battery for emergency trips. Therefore, the EVs are not discharged below 10% SoC.
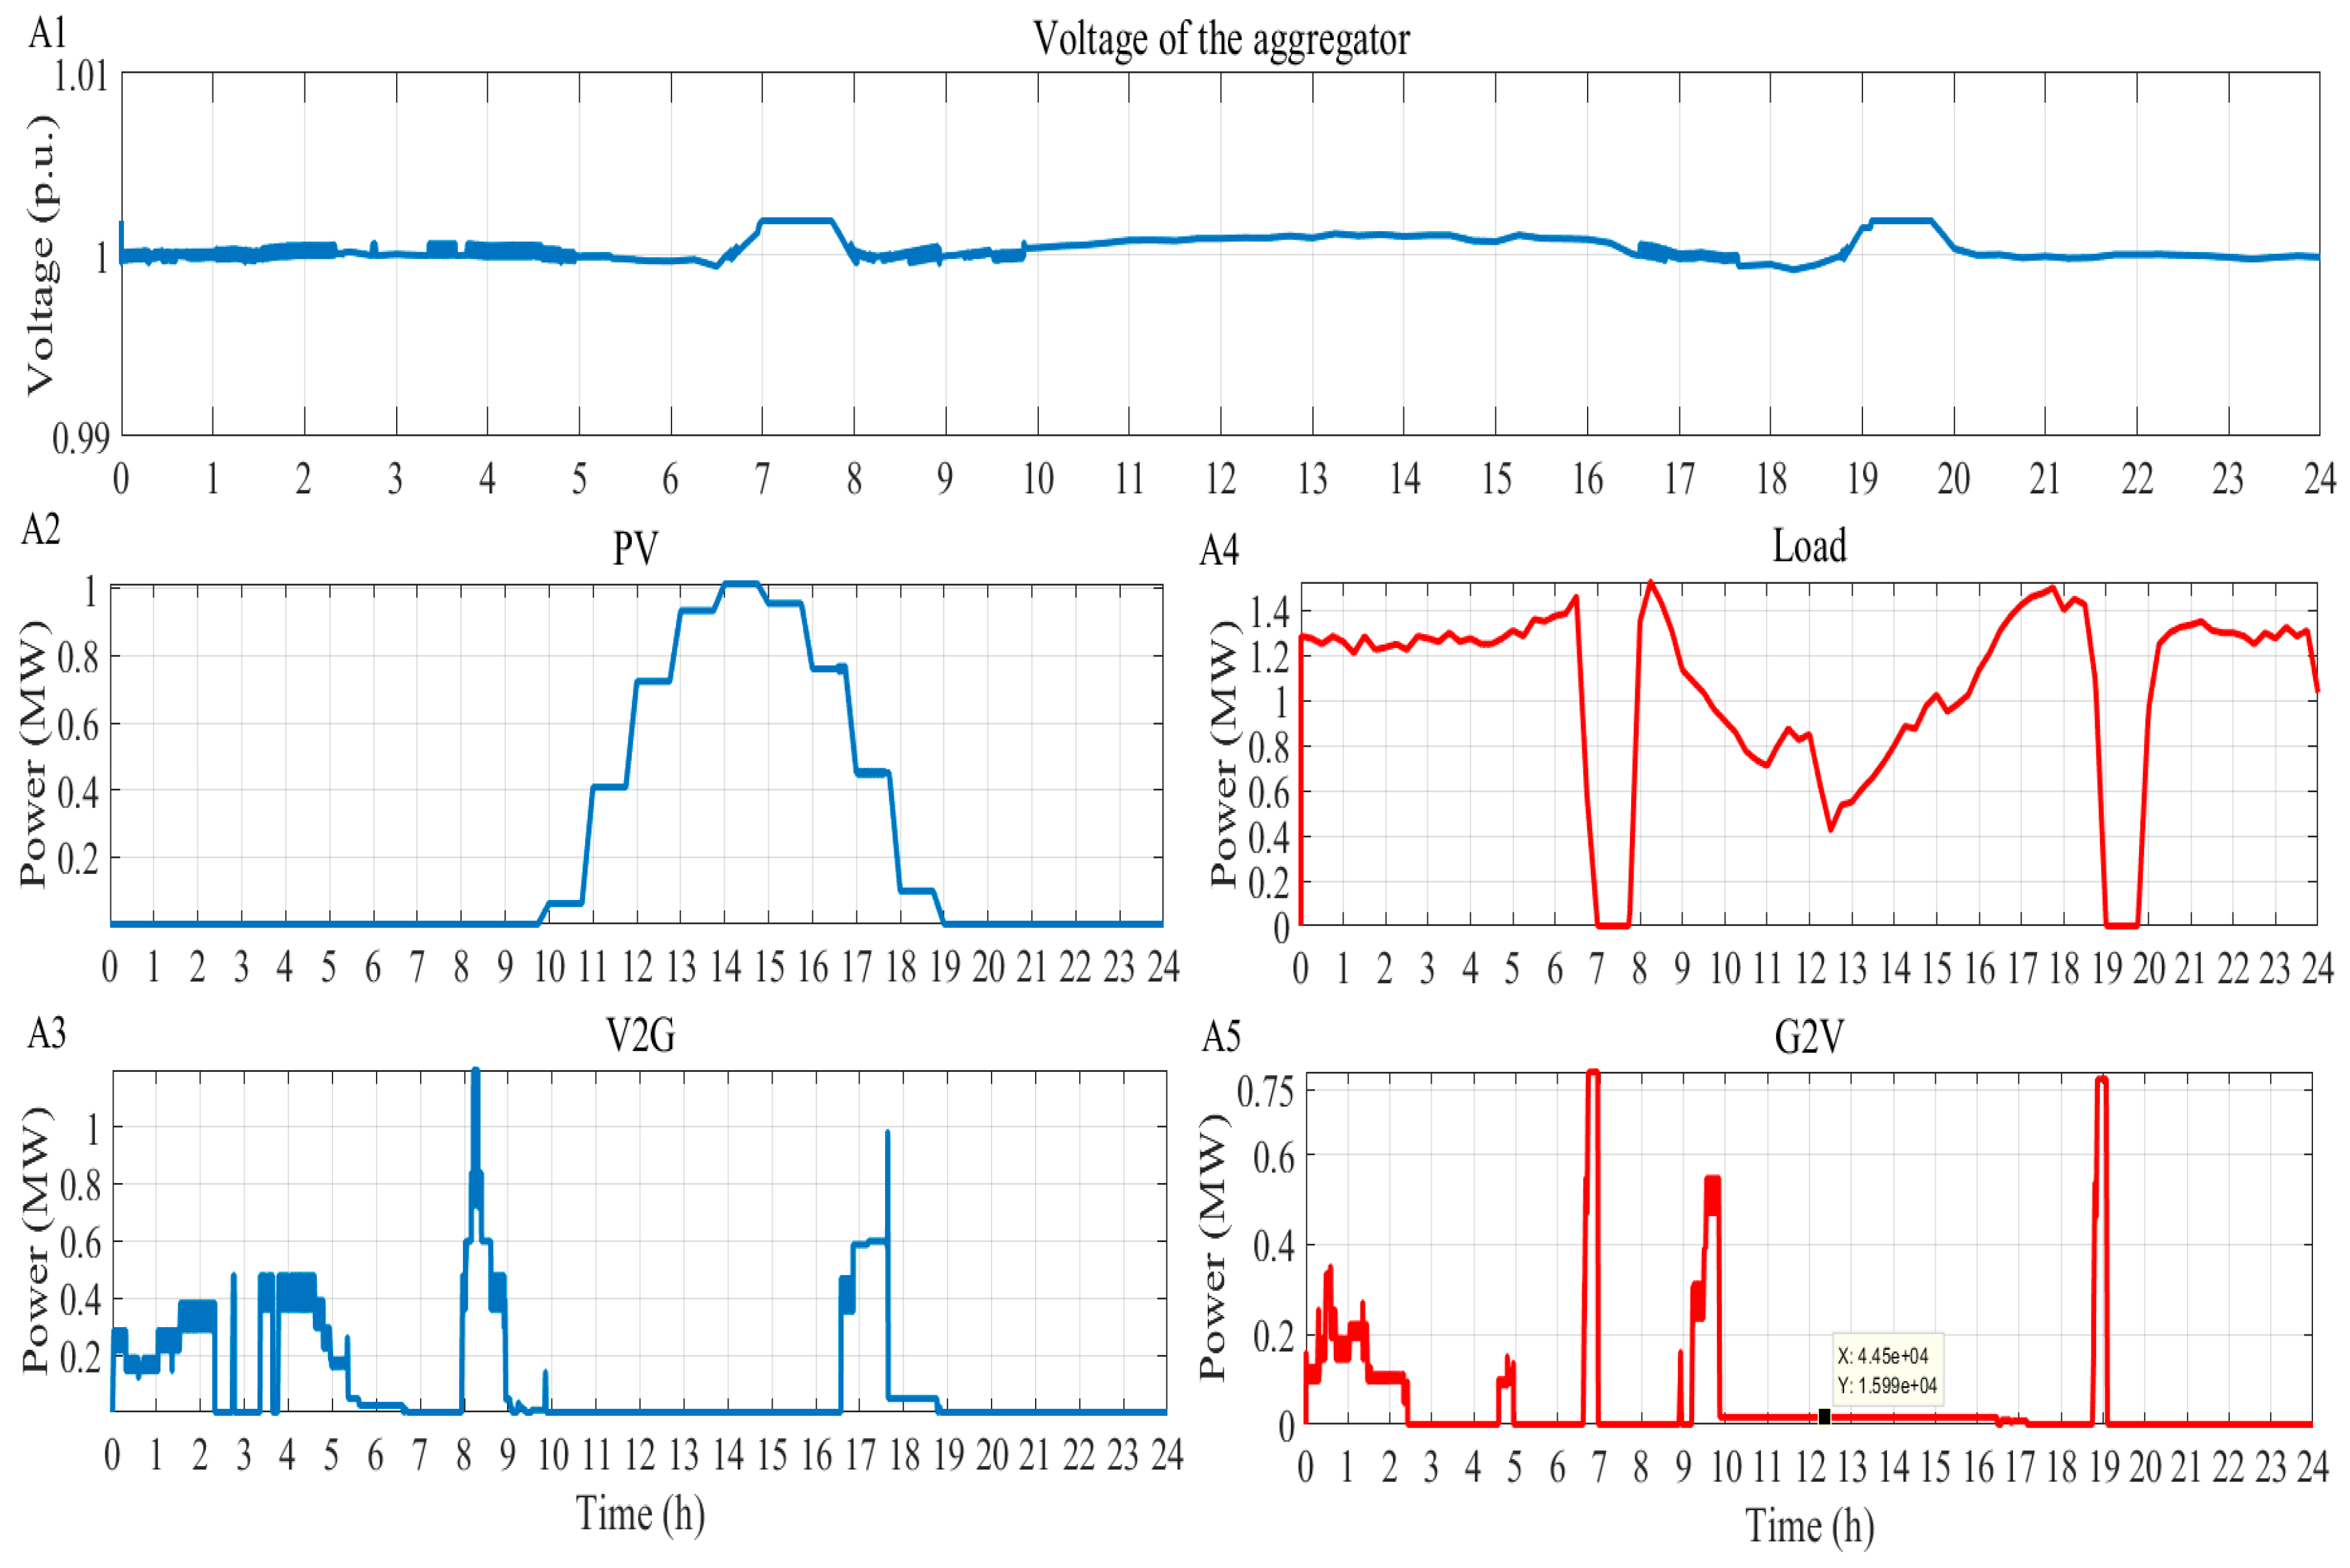
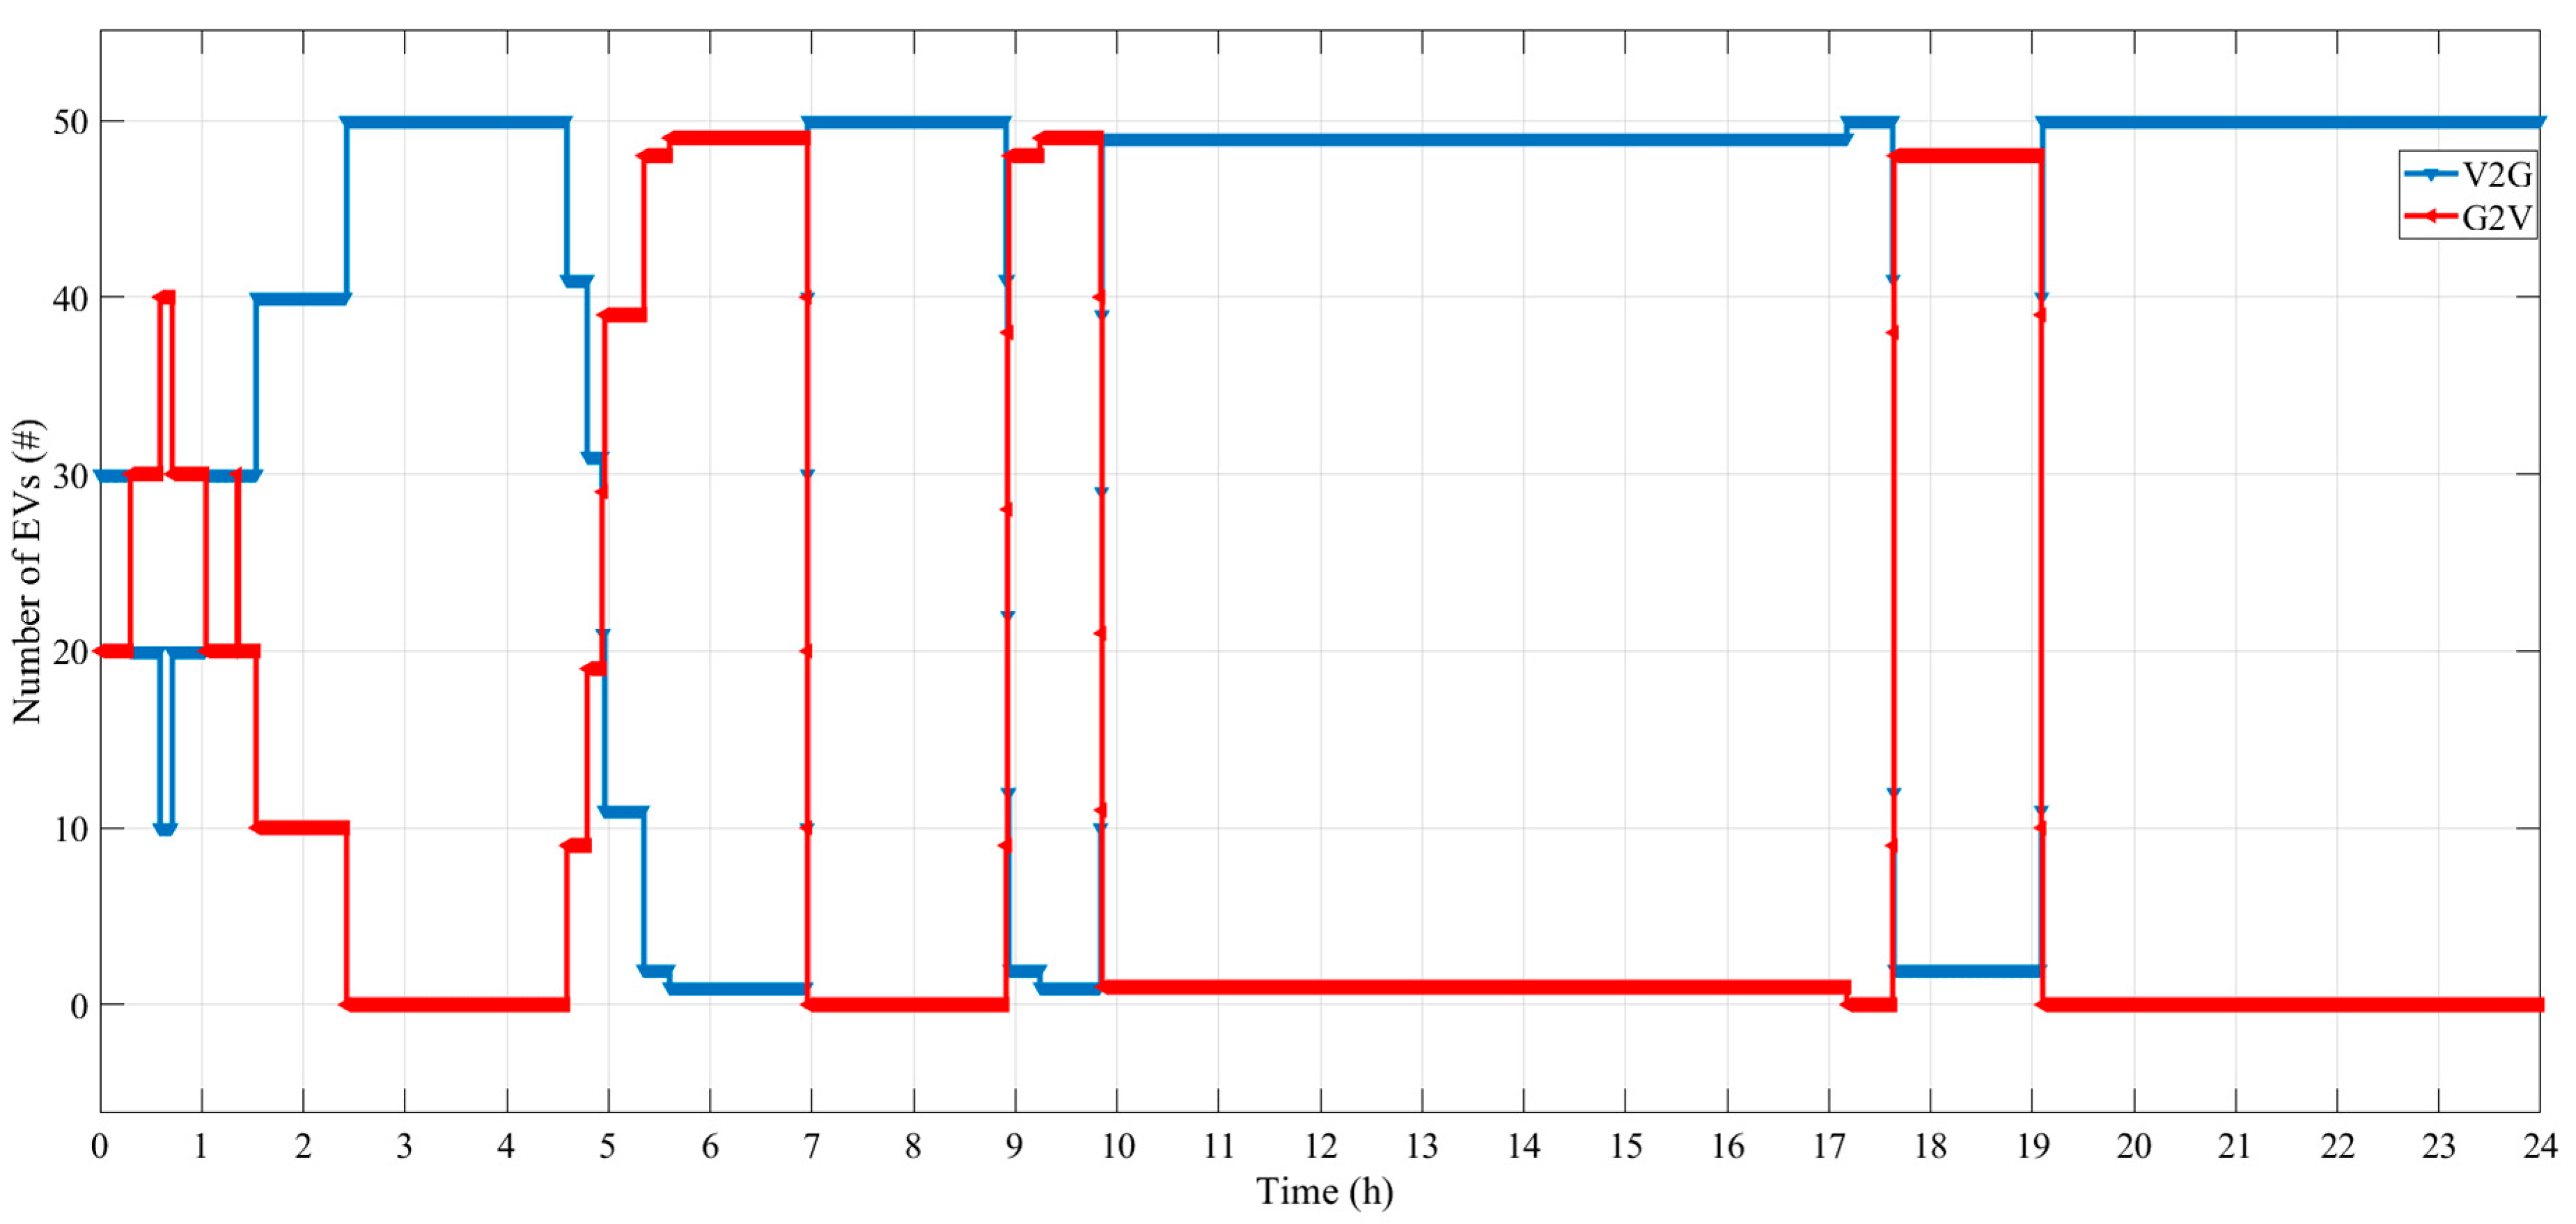
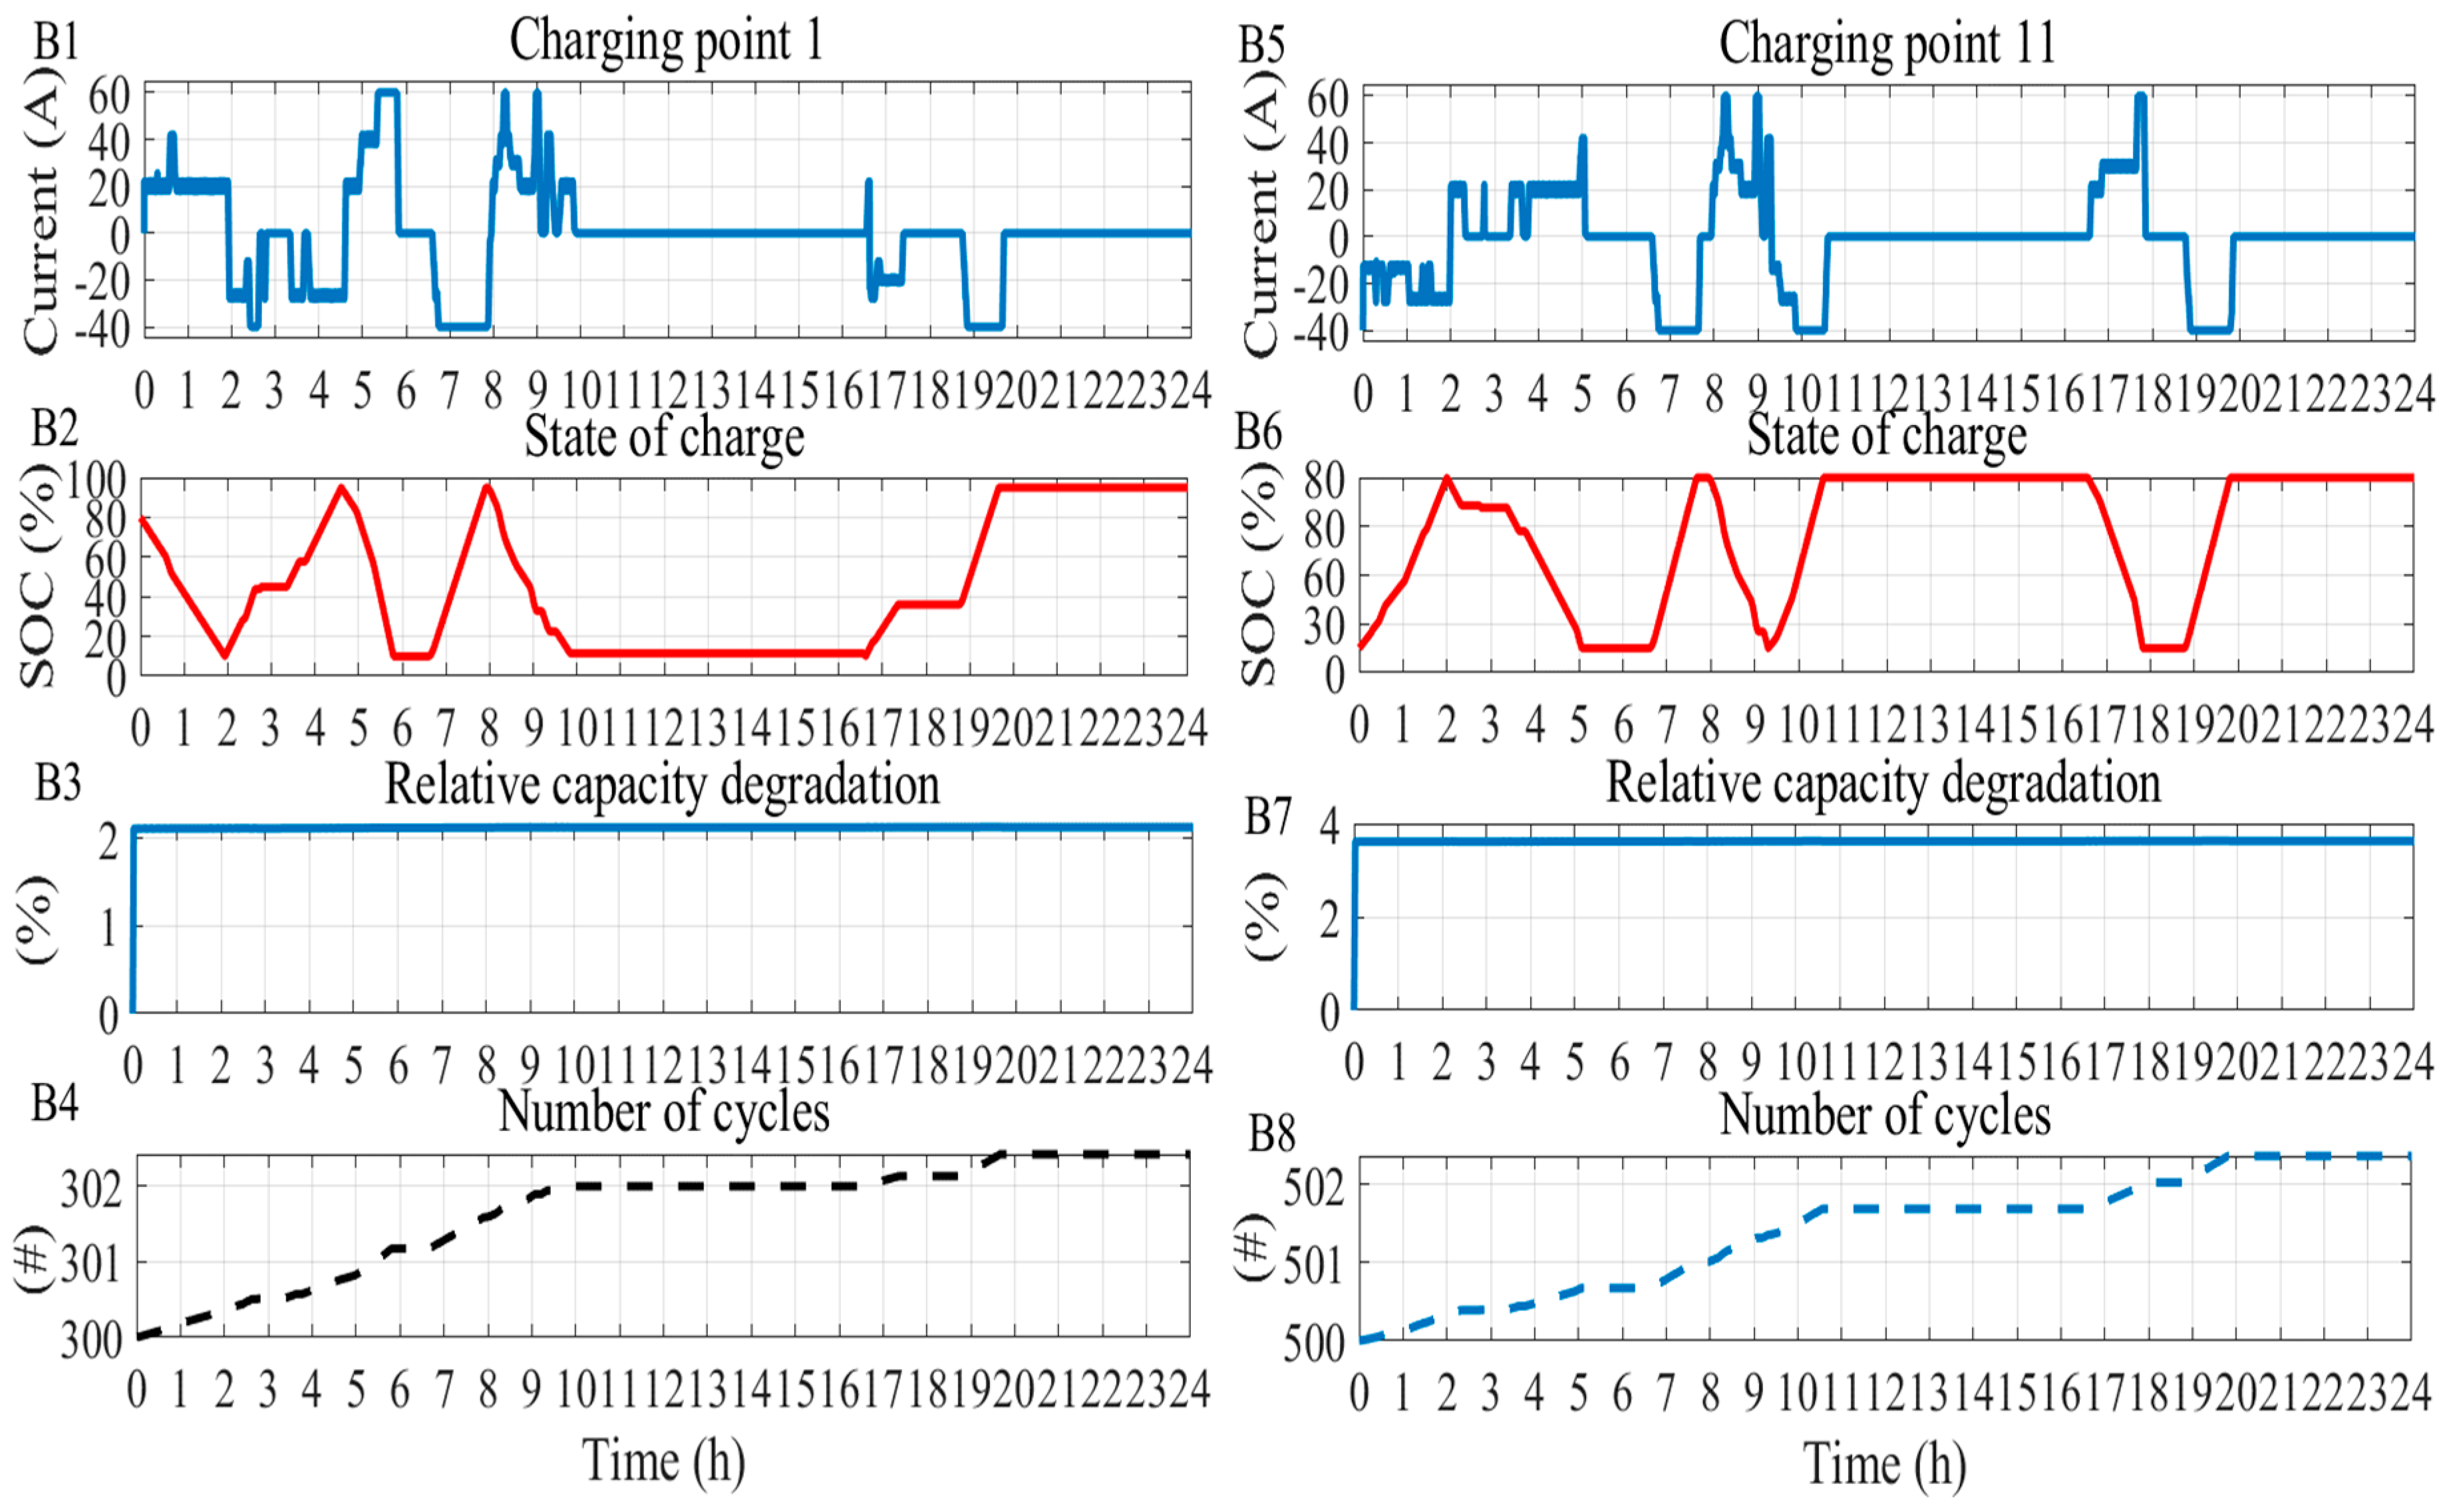
As shown in Figure 7, the system is three phases, and each EV equipped with a lithium-ion battery pack containing lithium-nickel-manganese-cobalt-oxide (NMC) cells with a capacity of 60 Ah, base voltage for the aggregator is 220 V, and 380 V in one and three phases, respectively. The capacity of each EV is 22.8 kWh, maximum power generation of PV is 1.2 MWp, and voltage is 380 V. Figure 9 shows the results of scenario A for a 24 h simulation. In (A4), it is seen that the total demand of active power is 1.282 MW at the start of the simulation. As the initial SoCs are randomly set from 80% to 10%, they contribute to the V2G and G2V phases, as can be seen in Figure 9(A3–A5). Figure 10 shows the number of EVs that can contribute to the V2G and G2V. After 30 min, the number of EVs in the V2G phase is reduced to 20 EVs. It means that 10 EVs are transited to G2V phase and the total number of G2V is 30. Indeed, only 10 EVs reach the SoC limitation after 30 min. For clarification, Figure 11 shows the results of EVs with IDs 1 and 11, for which the initial SoCs are set to 80% and 15%, respectively.
During hours 00:00–02:00, the total energy stored in EV1 in the aggregator is depleted and reaches the minimum allowable discharge level. In this regard, the grid is supposed to provide the required power for the load. Since the SoC of 40 EVs reached to the minimum value, the local controller starts to charge from 01:00 to 03:00. At 03:00, 50 EVs are standby to be discharged by different SoCs. Since the non-dispatchable source (PV) started injecting power from 10:00 to 18:00, none of EVs are discharged to the grid as the voltage is stable at 1 p.u. value. As can be seen in Figure 11(B1–B5), EV1 was charged from 16:45 to 17:30 and EV11 was discharged during this time; thereafter from 19:00 to 20:00, all EVs were charged to reach the desirable value which is 100 % SoC. As a consequence of not having an interactive controller between the decentralized and the centralized systems, it concludes that the injected and drown power to the system are not controlled. It means that controlling EVs in a local bus may lead to an undesirable charge and discharge in the aggregator. Indeed, it can be concluded that active power losses play an important role in V2G and G2V concept. Therefore, the number of cycles in this scenario is three based on the Ah throughput calculation. Also, with such charging and discharging profiles, the relative capacity degradation increases from 2% to 2.134% based on the initial number of cycles, which is set to 300 for EV1. Moreover, it is shown that charging and discharging EVs by the dependent voltage profile without considering the top state of system, a lack of information from top-system, can increase di-directional power flow. This means that uncoordinated charging and discharging strategies can lead to a reduction in penetration of PV and EVs.
3.2. Scenario B
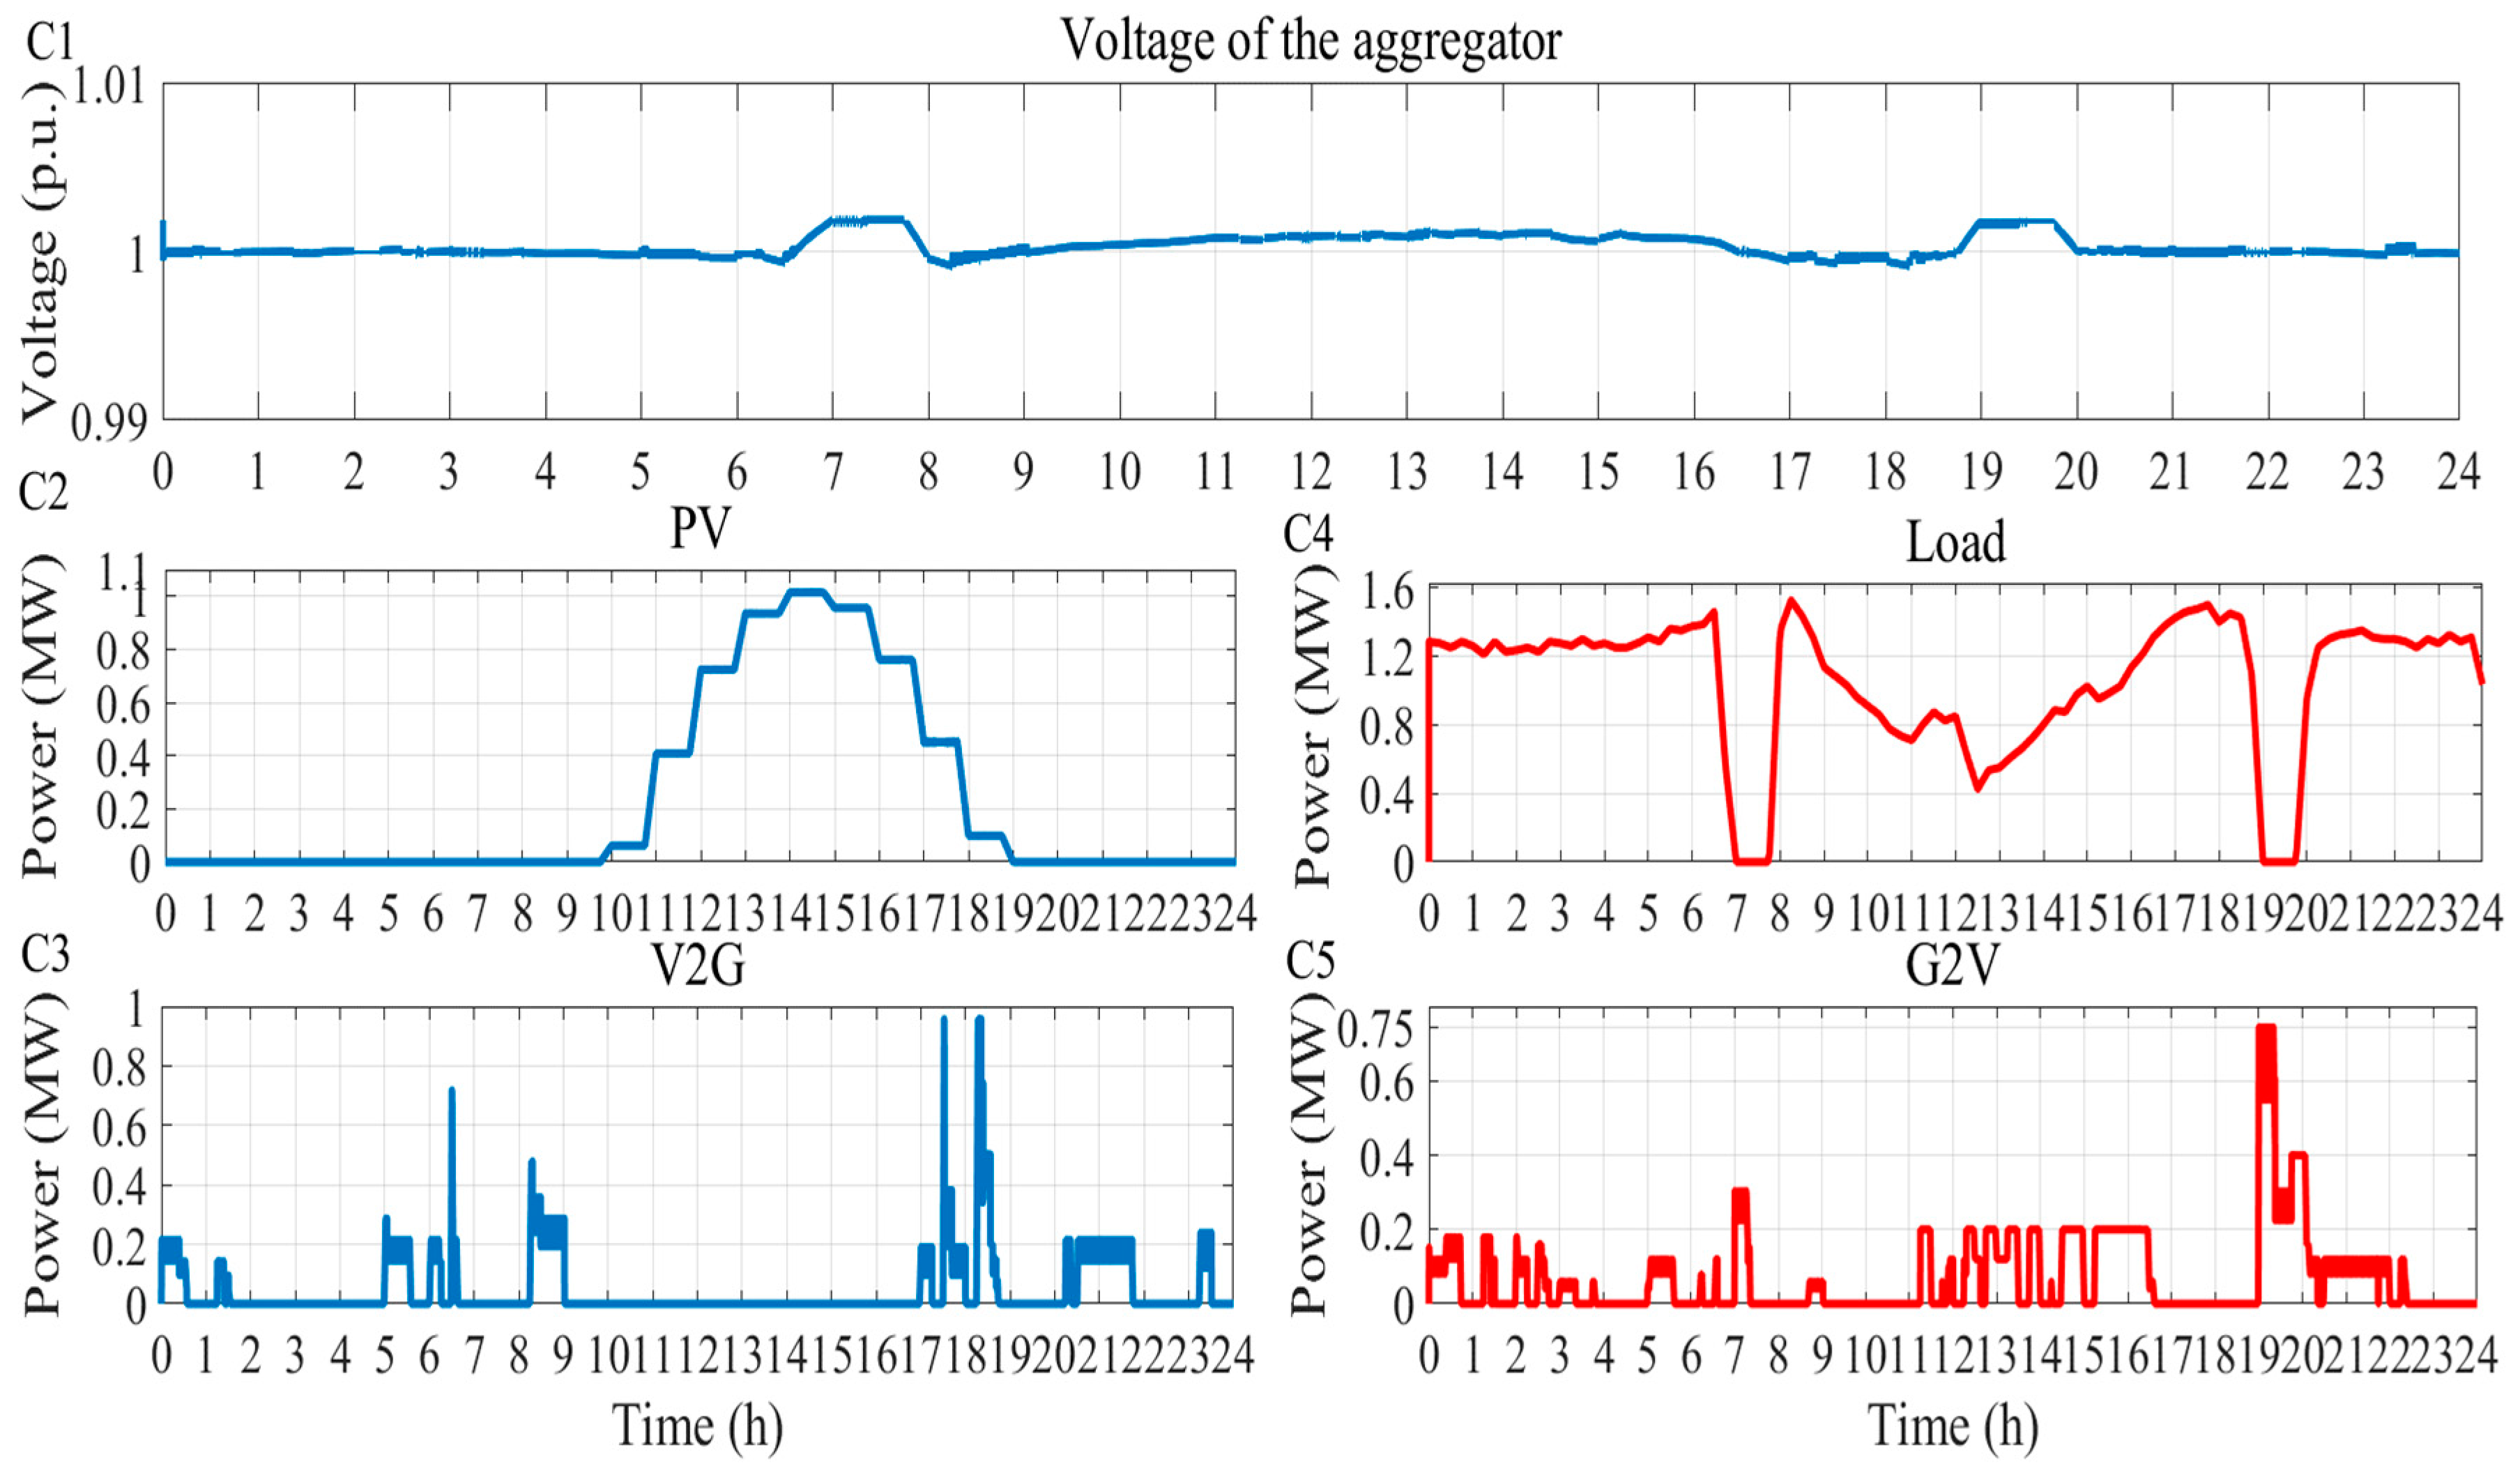
In this scenario, the predictive OPF algorithm is connected to the decentralized EVs’ controller. It is expected that the charge and discharge behavior could be smoother than for the previous profile. This means that charging and discharging decisions should prevent the nano-grid voltage from violating the defined upper or lower limits, and can be achieved by making a decision on charging and discharging at the proper time or by adjusting the current rate. Moreover, the active power losses should be minimized in this scenario. Indeed, scenario B can describe the importance of the bi-directional communication between different generation units and the load. The results of scenario B are depicted in Figure 12, Figure 13 and Figure 14.
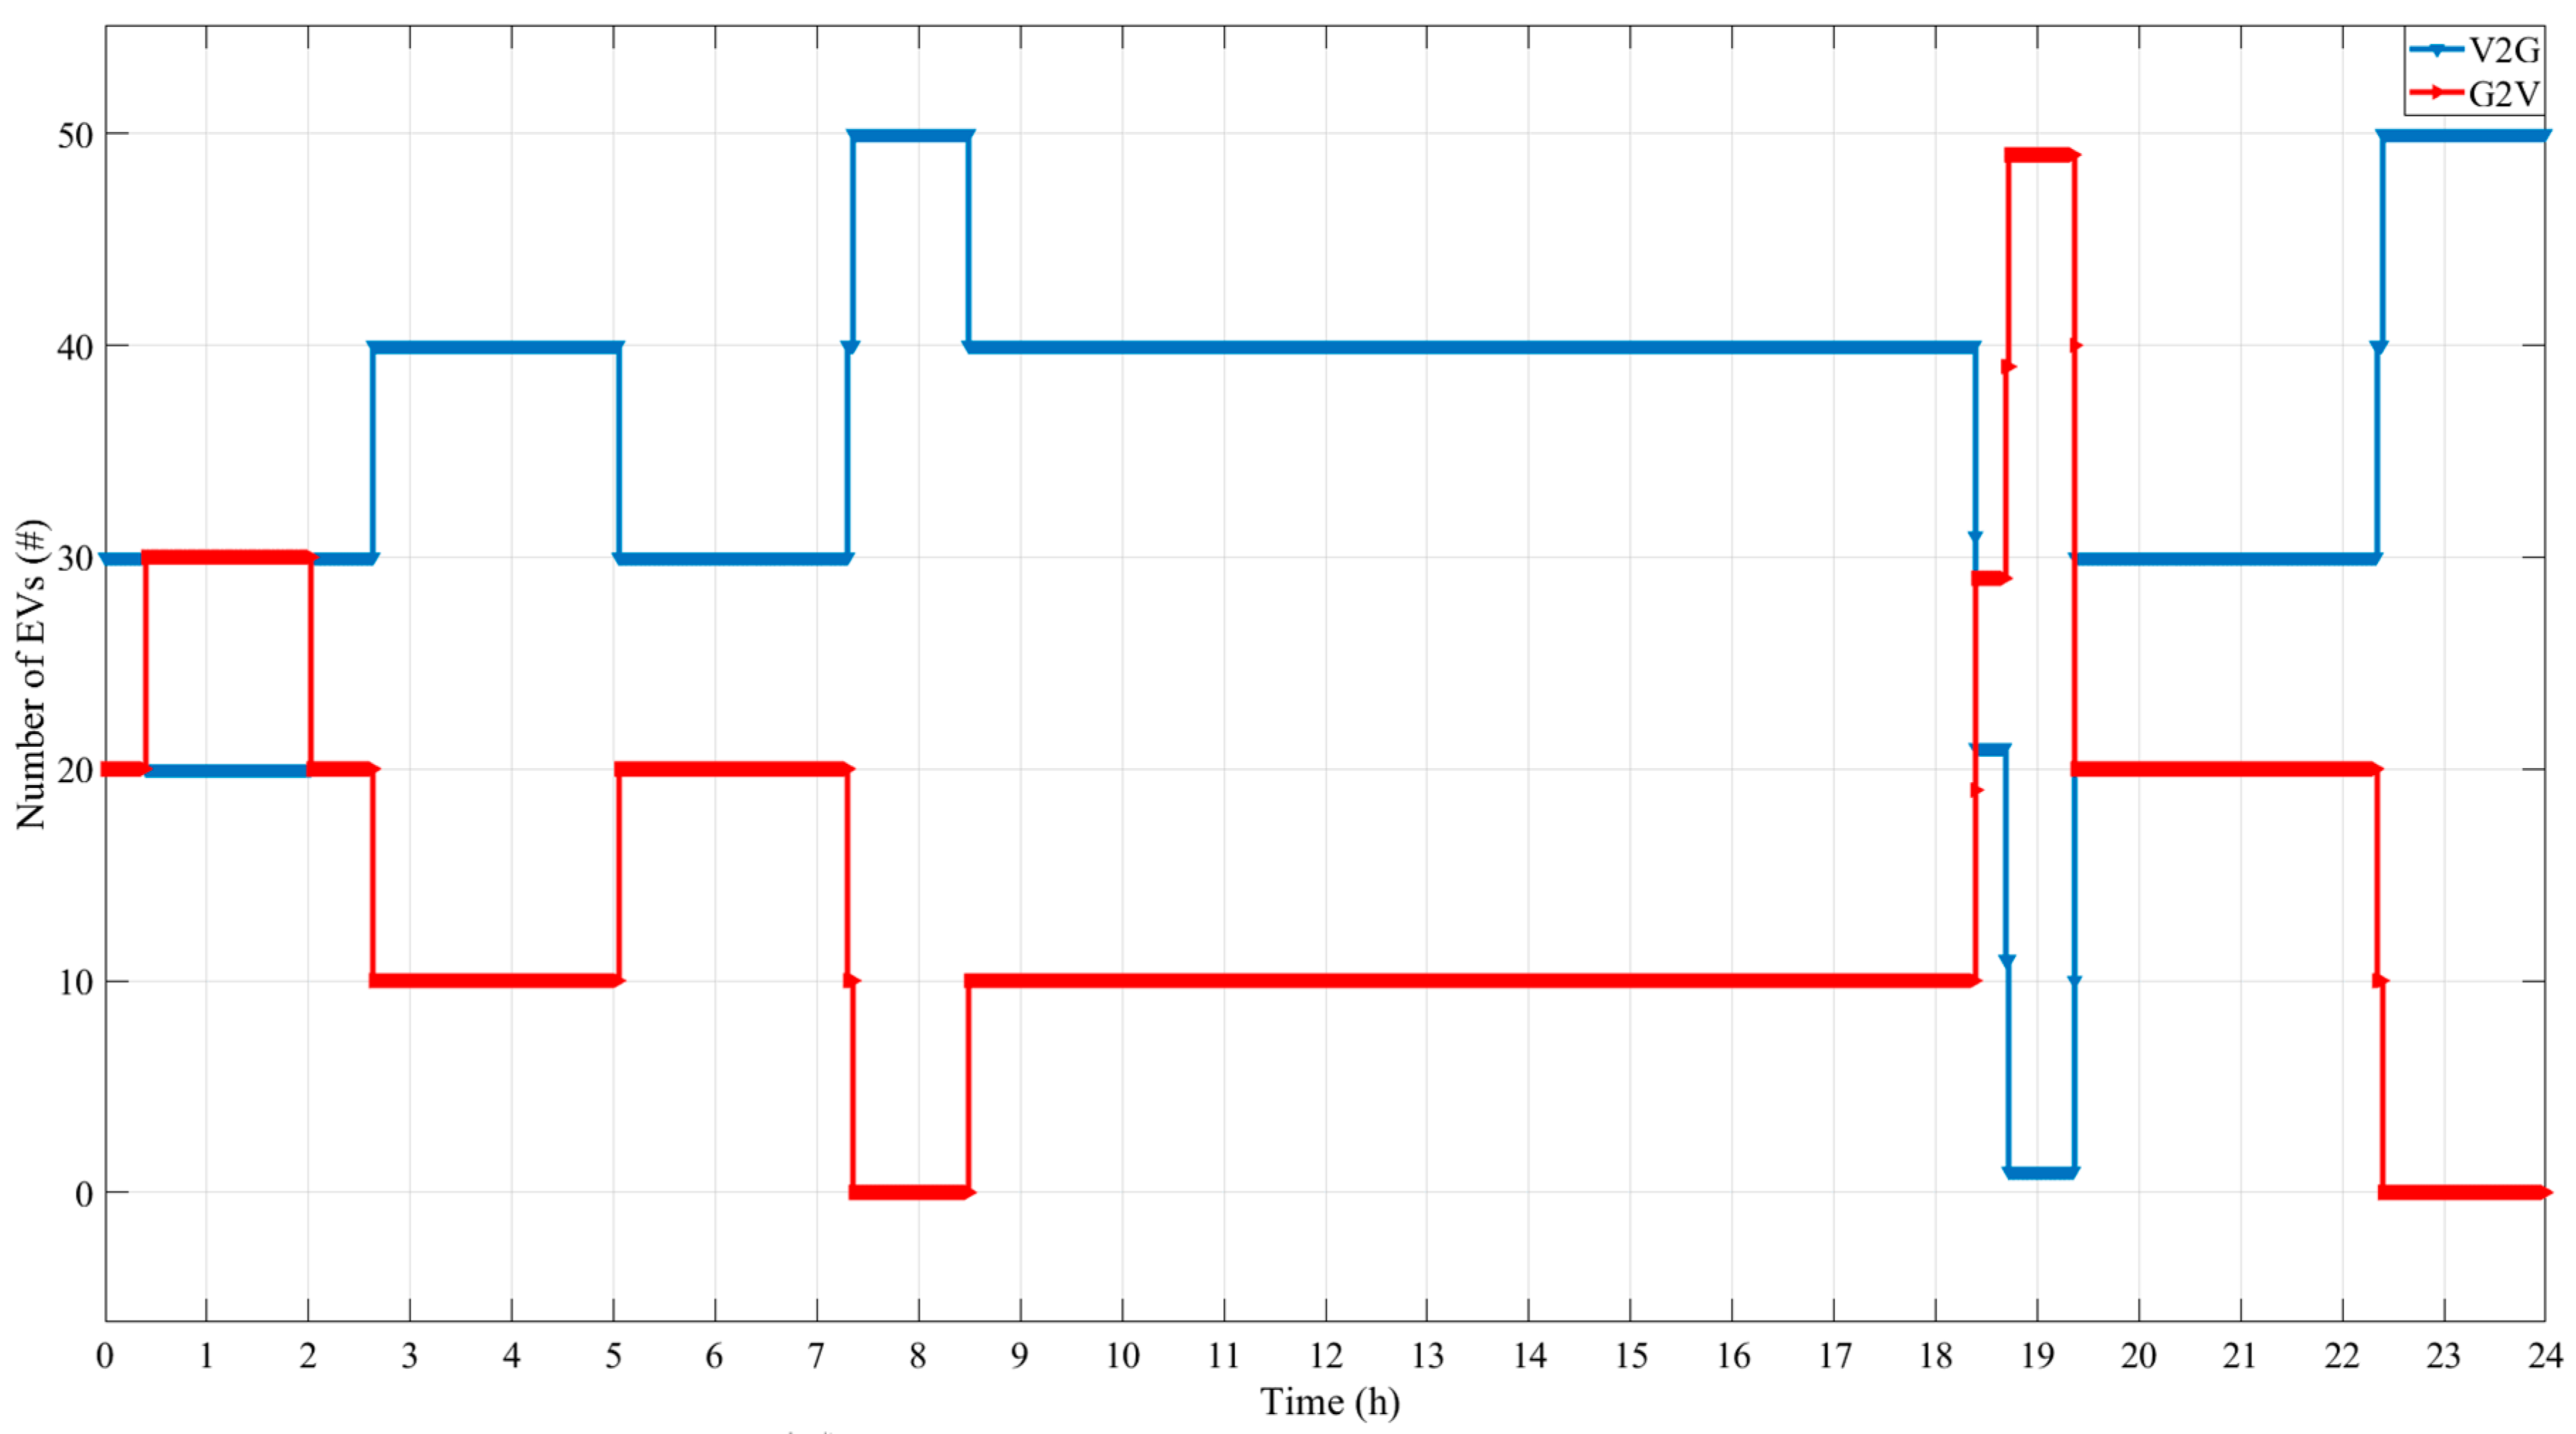
As can be seen in Figure 12, the EVs are being discharged to decrease power losses as the active load is 1.282 MW. Thereafter, the optimized control variables are forwarded to the decentralized control to transit the standby EVs to V2G phase to avoid a drop in voltage of the bus beyond the defined range. In this regard, the voltage drops from 1 to 0.999 p.u. at 04:00–06:30. Nevertheless, the minimum voltage limitation is not violated. The reason is to predict the load and the PV production; consequently, optimize charge and discharge rats. As soon as the load decreases to its minimum, the voltage of the bus increases to 1.002 from 0.999 p.u. during 06:30–07:00, and the states of the EVs are changed from standby to G2V phase as the demand increases to the maximum value at the time of 08:00, which can be seen in Figure 13. As the load increases to the maximum value and the voltage decreases, EVs as controllable energy sources are discharged to keep the voltage of the aggregator within the allowable boundaries. Since the demand decreases to its minimum from 19:00 to 20:00 and this information was provided by first layer of controller to the second layer, all EVs were charged as the total injected power from system to the aggregator is 1 MW during the time. As can be inferred from Figure 9 and Figure 12, the bi-directional power flow decreases substantially due to having information on the state of the system in advance.
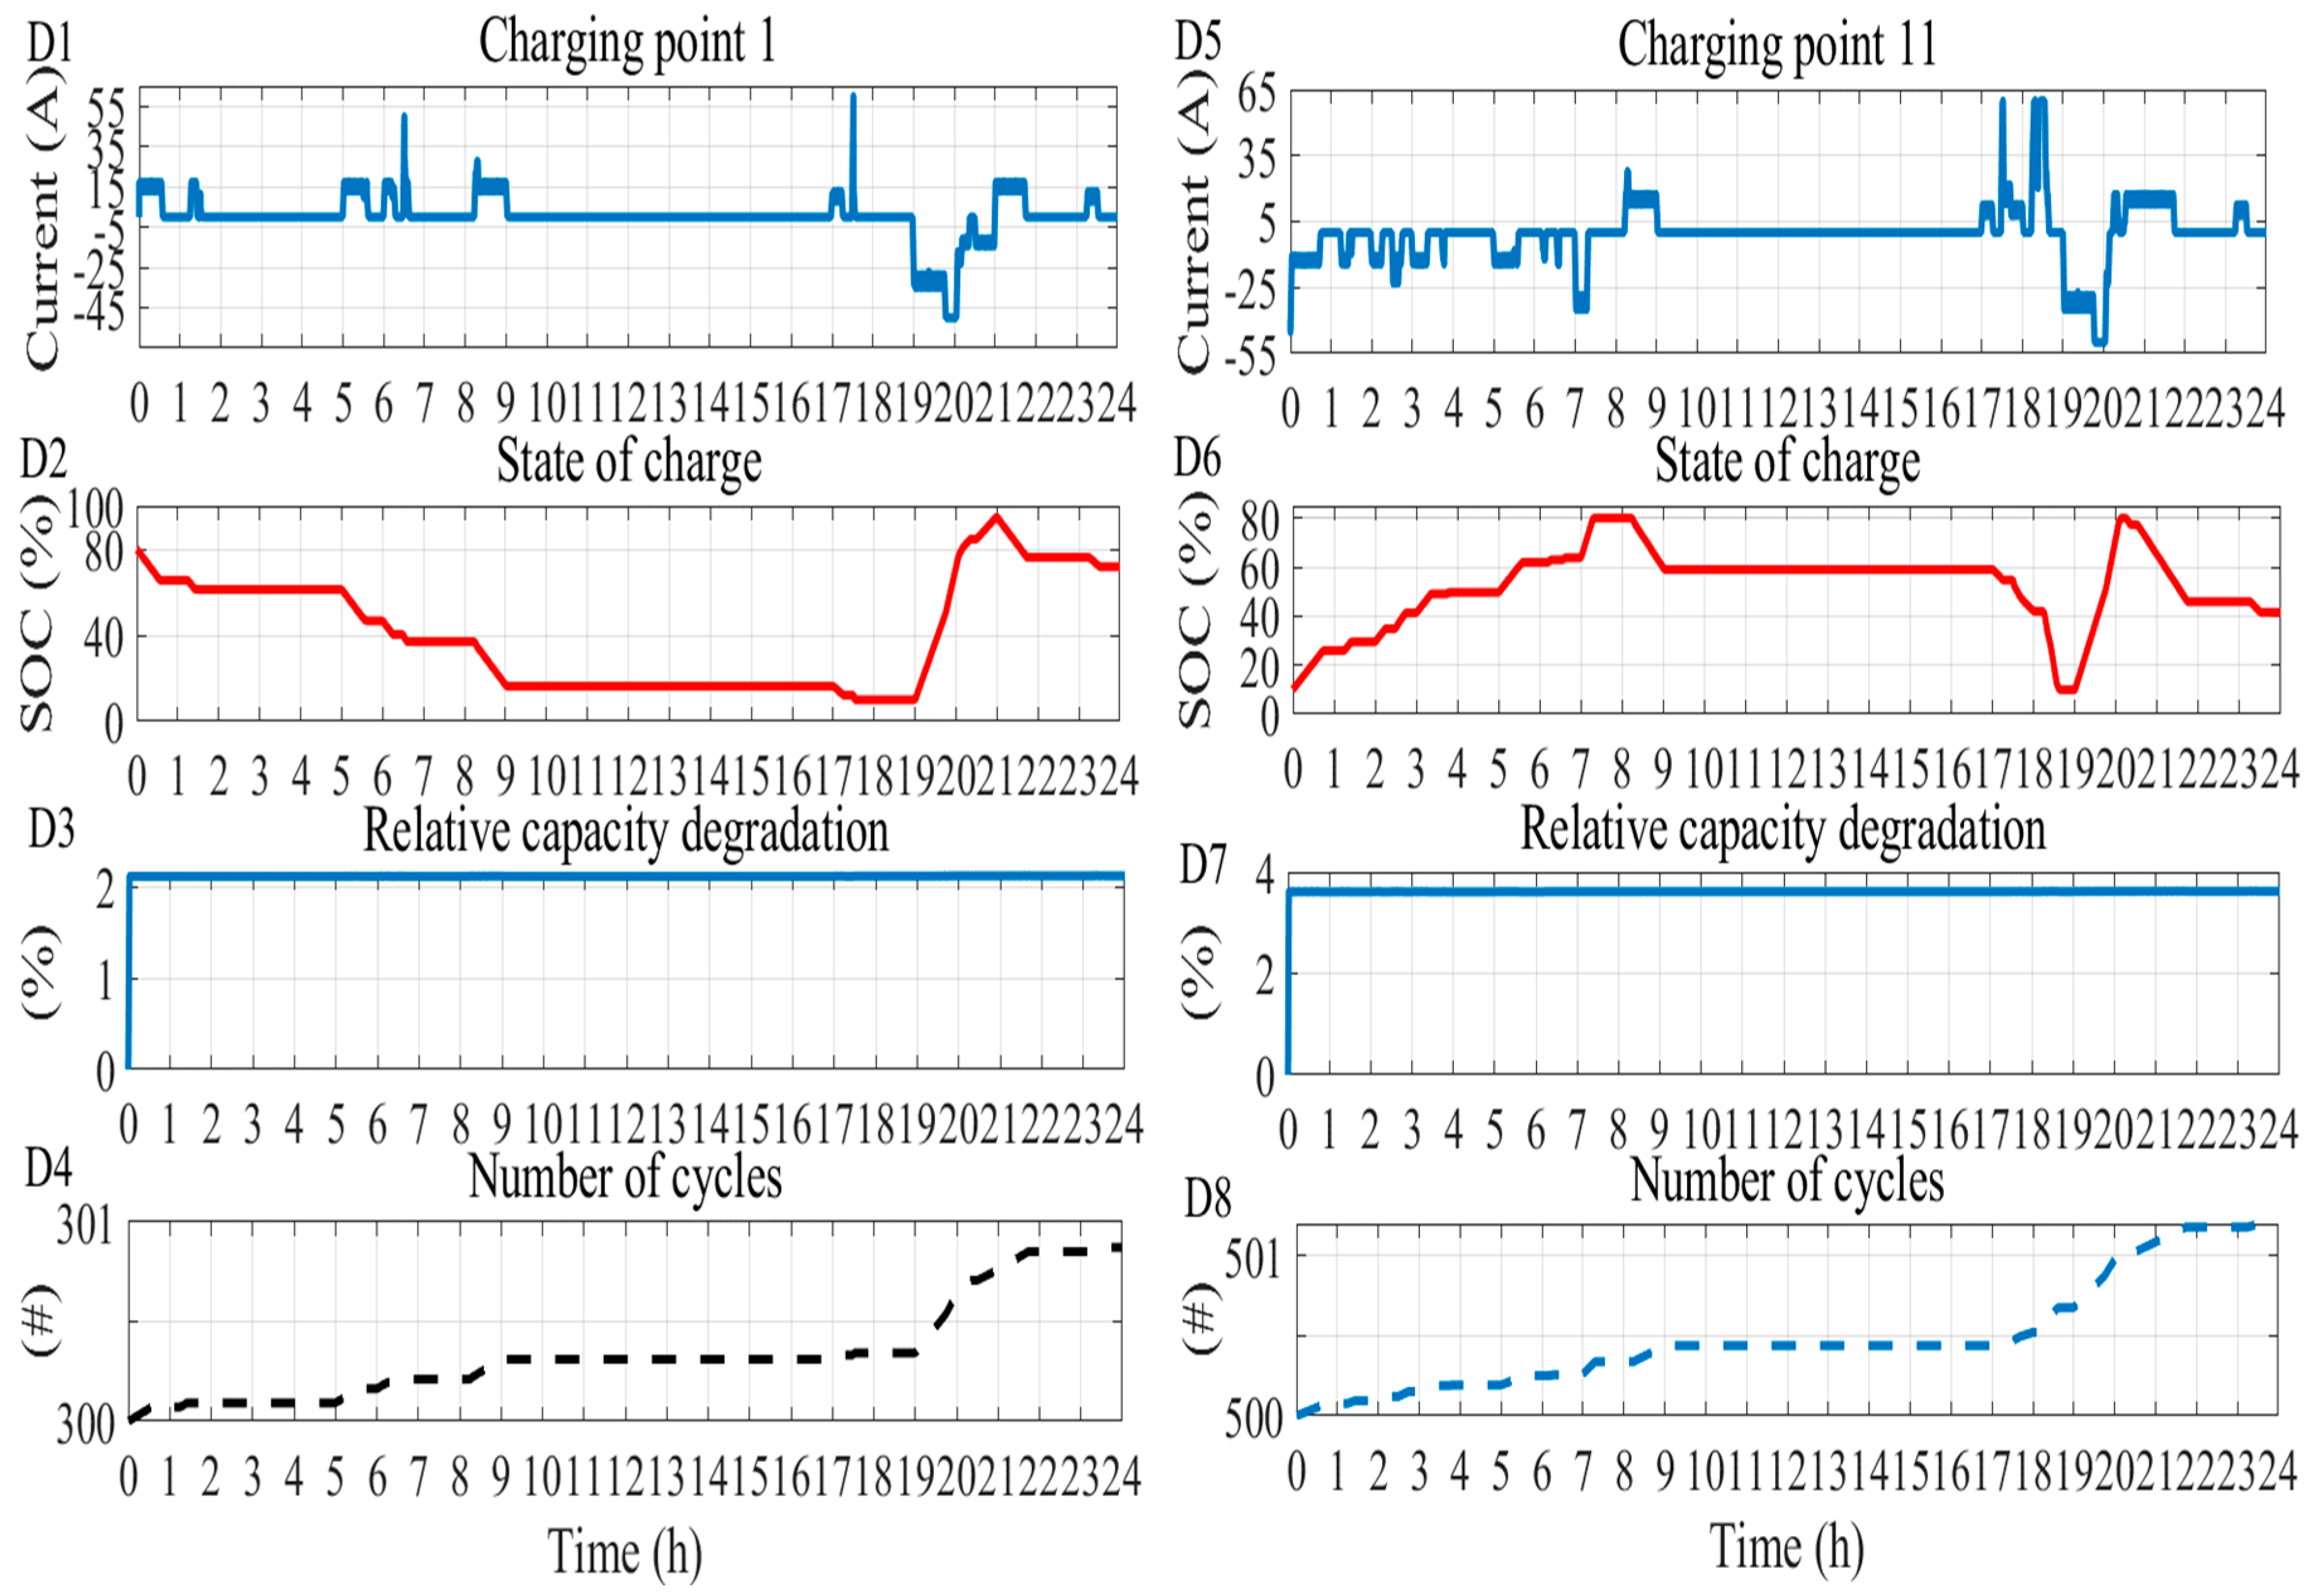
Figure 14 shows the result of scenario B. As can be inferred from subplots D4–D8, the average number of cycles is reduced from 3 in scenario A, to 1.2 in scenario B, demonstrating that the lifetime of the battery can increase substantially with such a control strategy. The degradation rate decreases from 2.134% in uncoordinated charging/discharging to 2.126% in the coordinated charging/discharging strategies for EV1 by comparison of two scenarios. As shown in Figure 14, fluctuations in the charging and discharging signals are lower than for scenario A due to the information on generation and demand being provided in advance and making a decision at the proper time. Yet stress factors for battery capacity degradation such as the number of cycles, average of current rate are lower in this scenario. As can be inferred from the Figure 12 and Figure 14, EVs are not charged or discharged when PV generation is high and are discharged at high demand periods to reduce the active power losses from the grid to the demand.
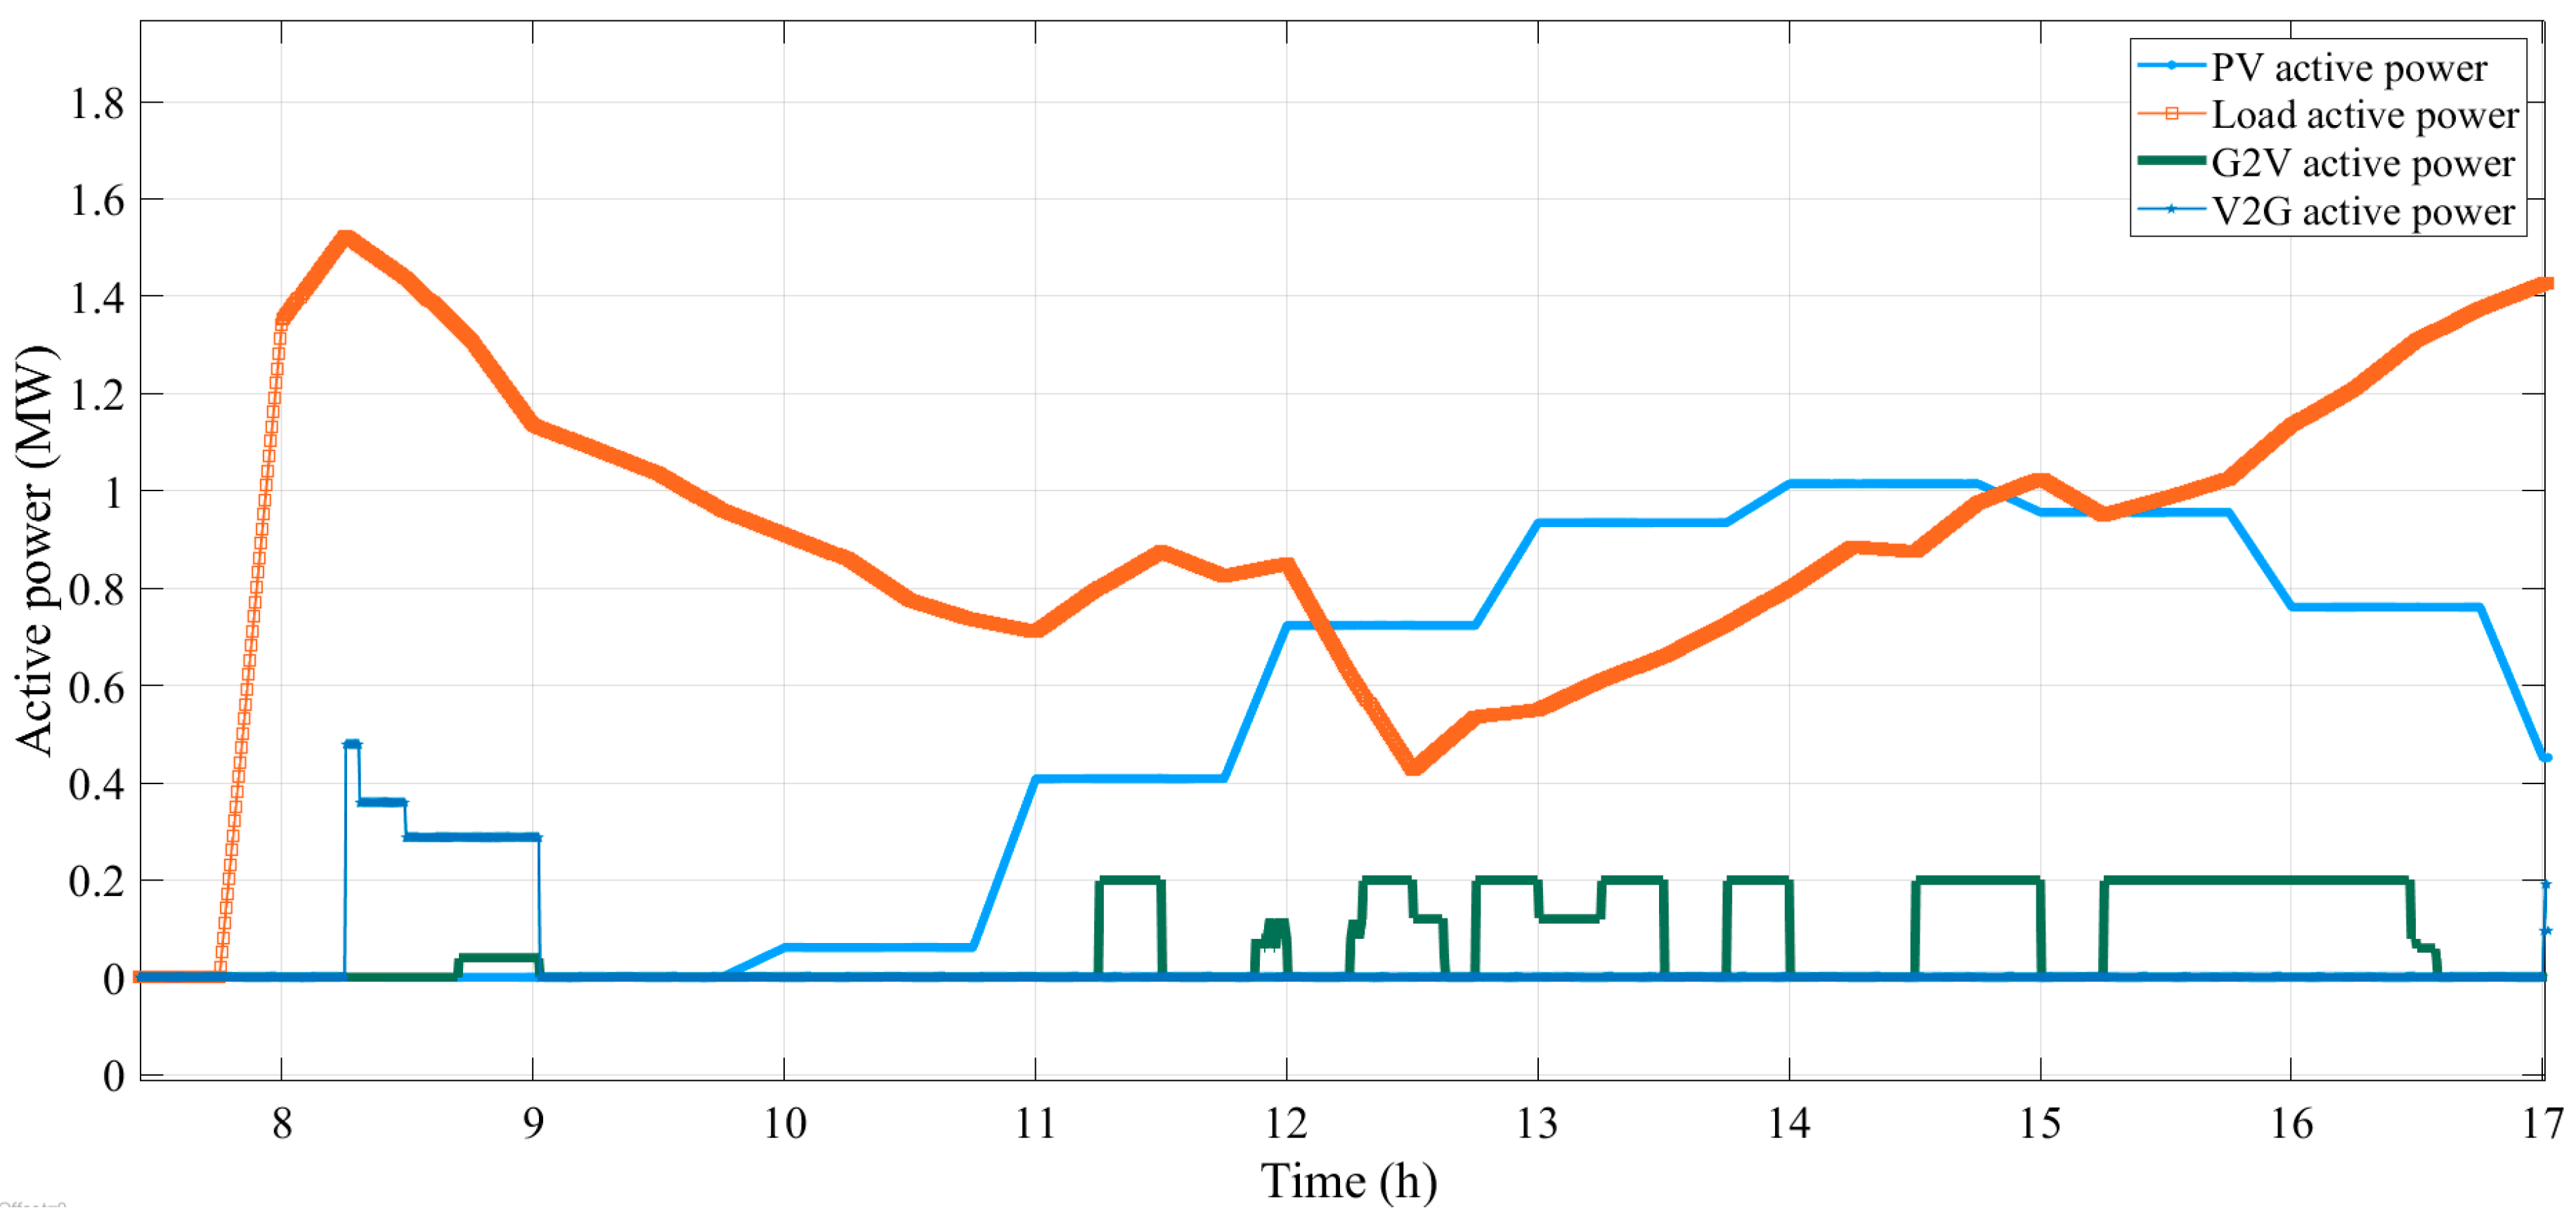
Figure 15 shows the active power of the grid, consumption, PV, G2V, and V2G of the scenario B. For better visibility, Figure 15 is a close up of parts of Figure 12. As can be inferred from Figure 15, by increasing active power demand, electric vehicles contribute to V2G phase, resulting the power reduction from grid to the load. Then, as soon as the PV production is injected to the system, electric vehicles are transited to G2V phases according to their SoC.
3.3. Long-Term Simulation
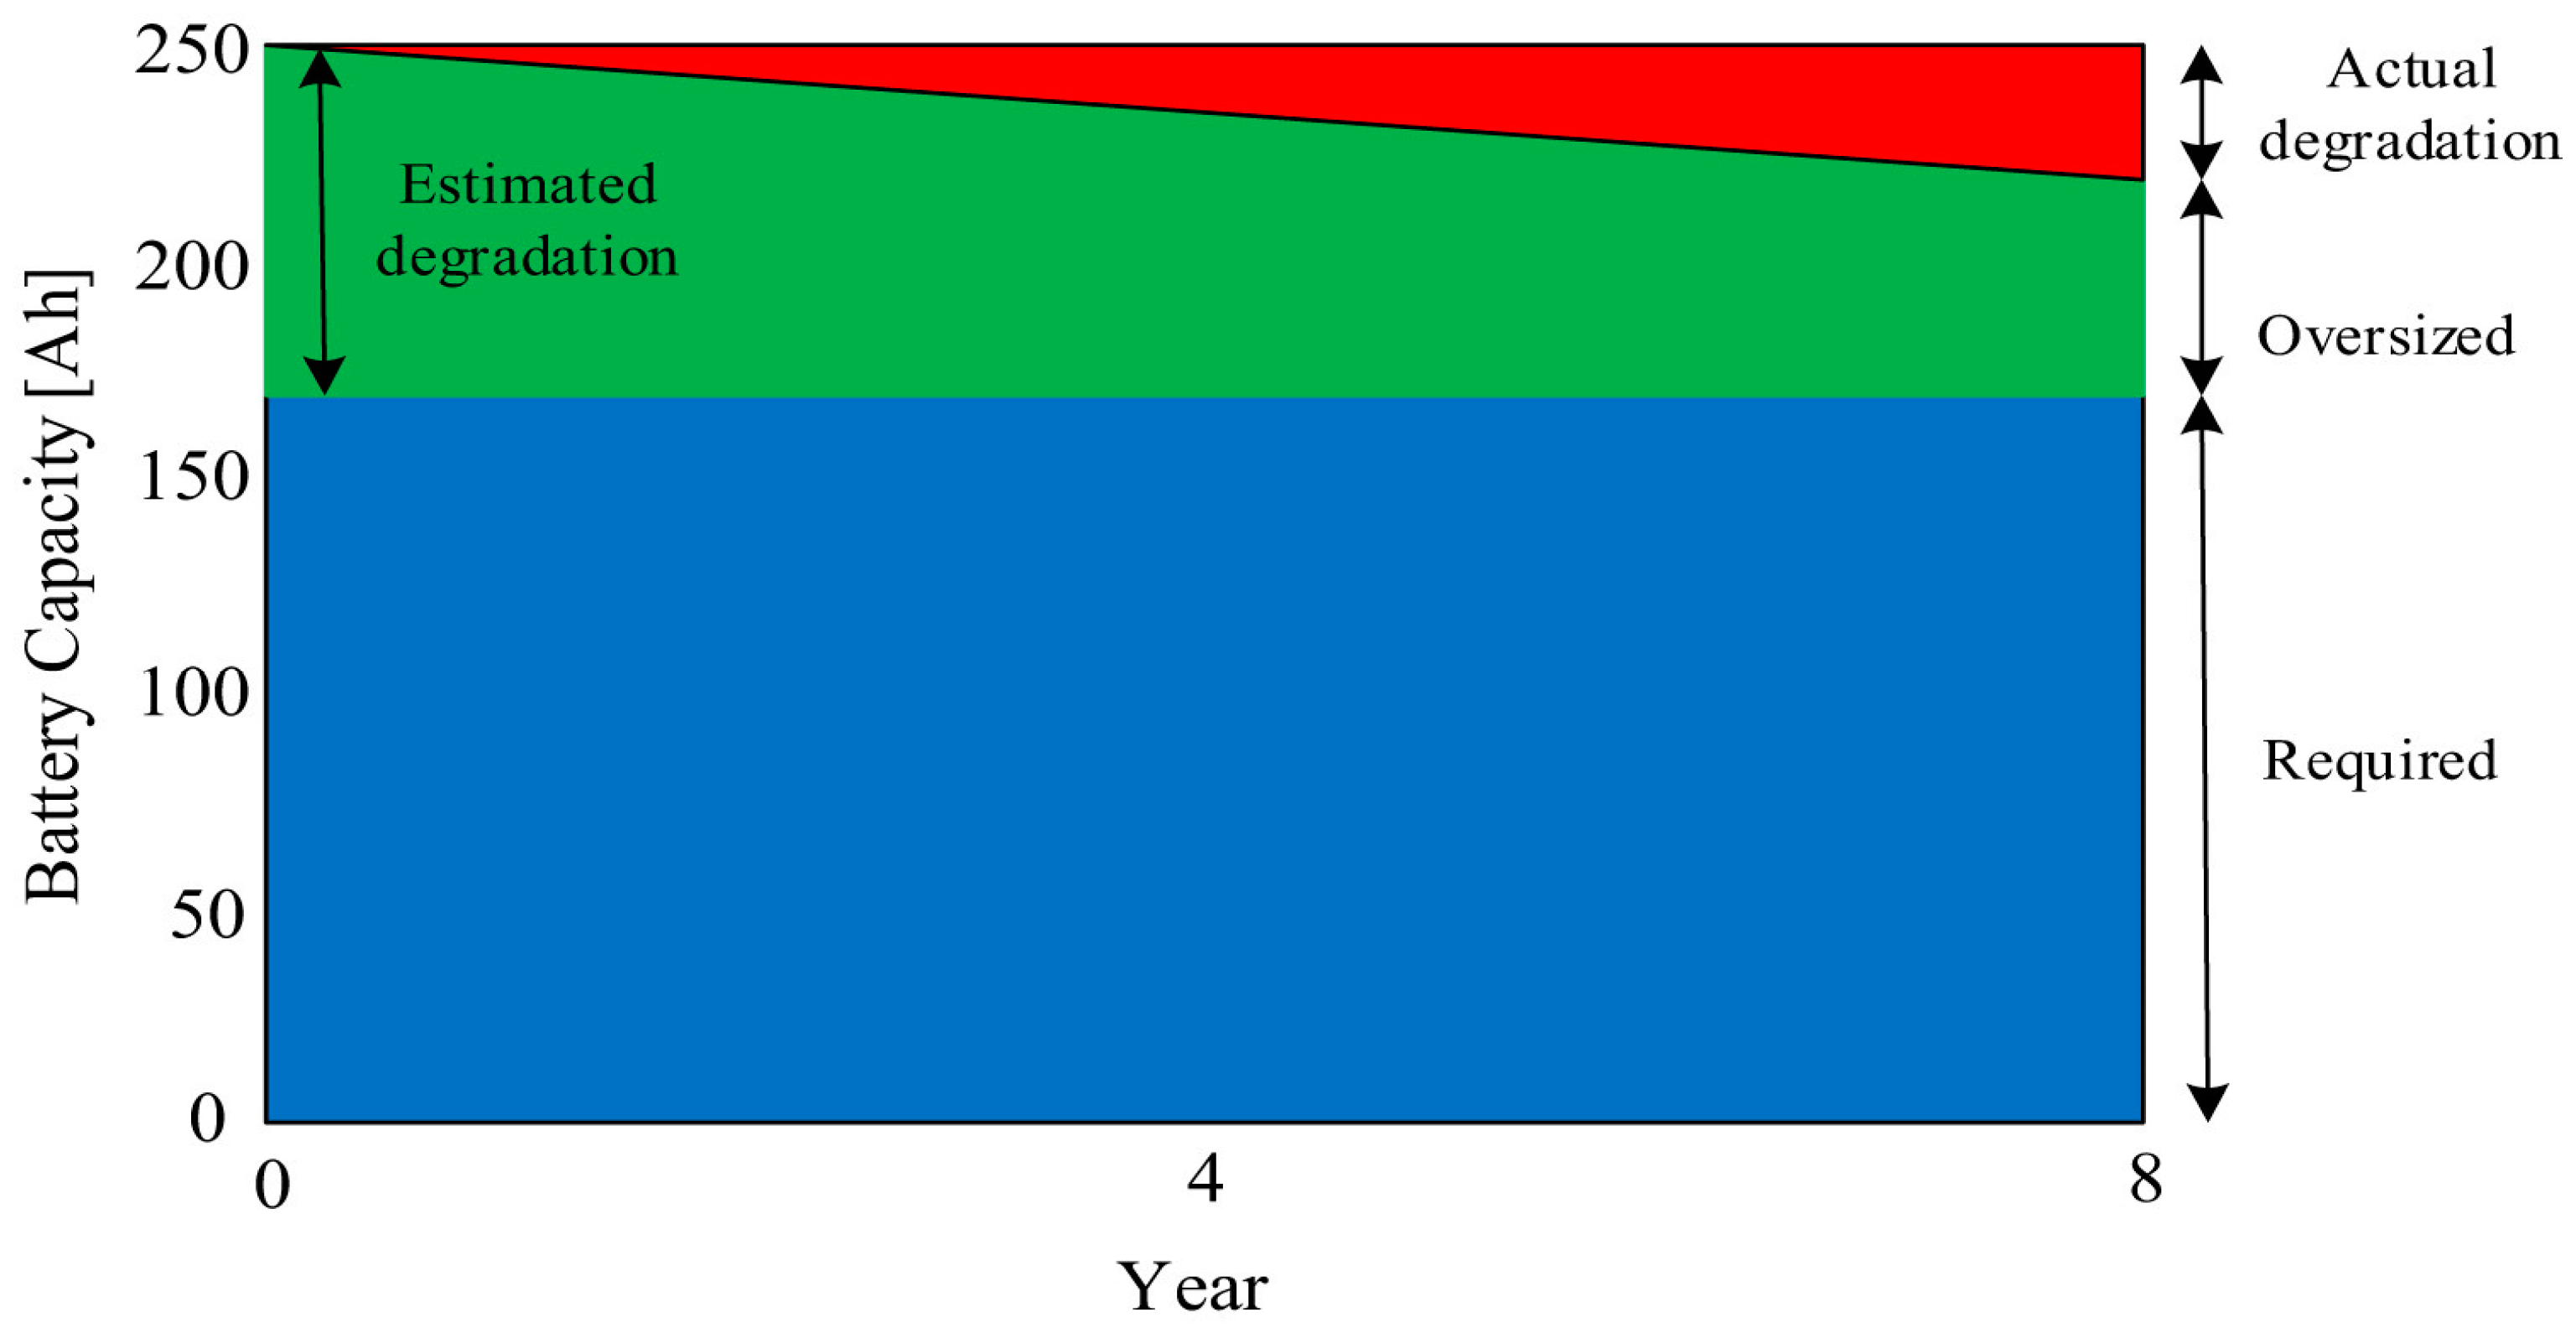
Due to the additional cycling operation in V2G technology, additional battery degradation is expected. Therefore, a long-term V2G and G2V analysis is of importance to the financial feasibility of EV smart charging and discharging. Simplistically, it is required that PEV-owners be acquainted and satisfied with the battery guarantee, as the battery plays a crucial role in PEV performance and the total cost of ownership. Moreover, the automotive industry oversizes the capacity of on-board battery packs in the design phase to allow for some capacity degradation and still meet guarantee obligations. This means that the total cost of ownership is consistently overestimated in the design and production phases [38].
As can be seen in Figure 16, the United States Advanced Battery Consortium states that 20% of battery capacity will fade if the battery cycles by 80% DOD over the lifetime of the vehicle. By considering battery capacity degradation in the V2G application, some oversized battery capacity may be acceptable for PEV owners and car manufacturers. Nevertheless, it still adds an additional cost in the retail chain and an additional weight burden on the EVs.
This raises a question regarding what the battery capacity should be or on how often the battery should be replaced, while the PEVs participate in V2G technology and meet warranty obligations. This means that the impact of V2G service should quantify more clearly this technology and battery replacement time. As stated before, the capacity degradation is the function of the number of cycles which iterates based on the Ah-throughput/energy throughput measurement, which in this article are DOD, temperature, and C-Rate. Unquestionably, the rate of PEVs contribution to V2G service relies on the state of demand, renewable energy generation, voltage deviation, power losses. Therefore, this subsection tries to answer the above question using reasonable assumptions, which are that the PEVs are connected to the grid through an aggregation, equipped with 50 charging points, the maximum PV generation is 1.2 MWp.
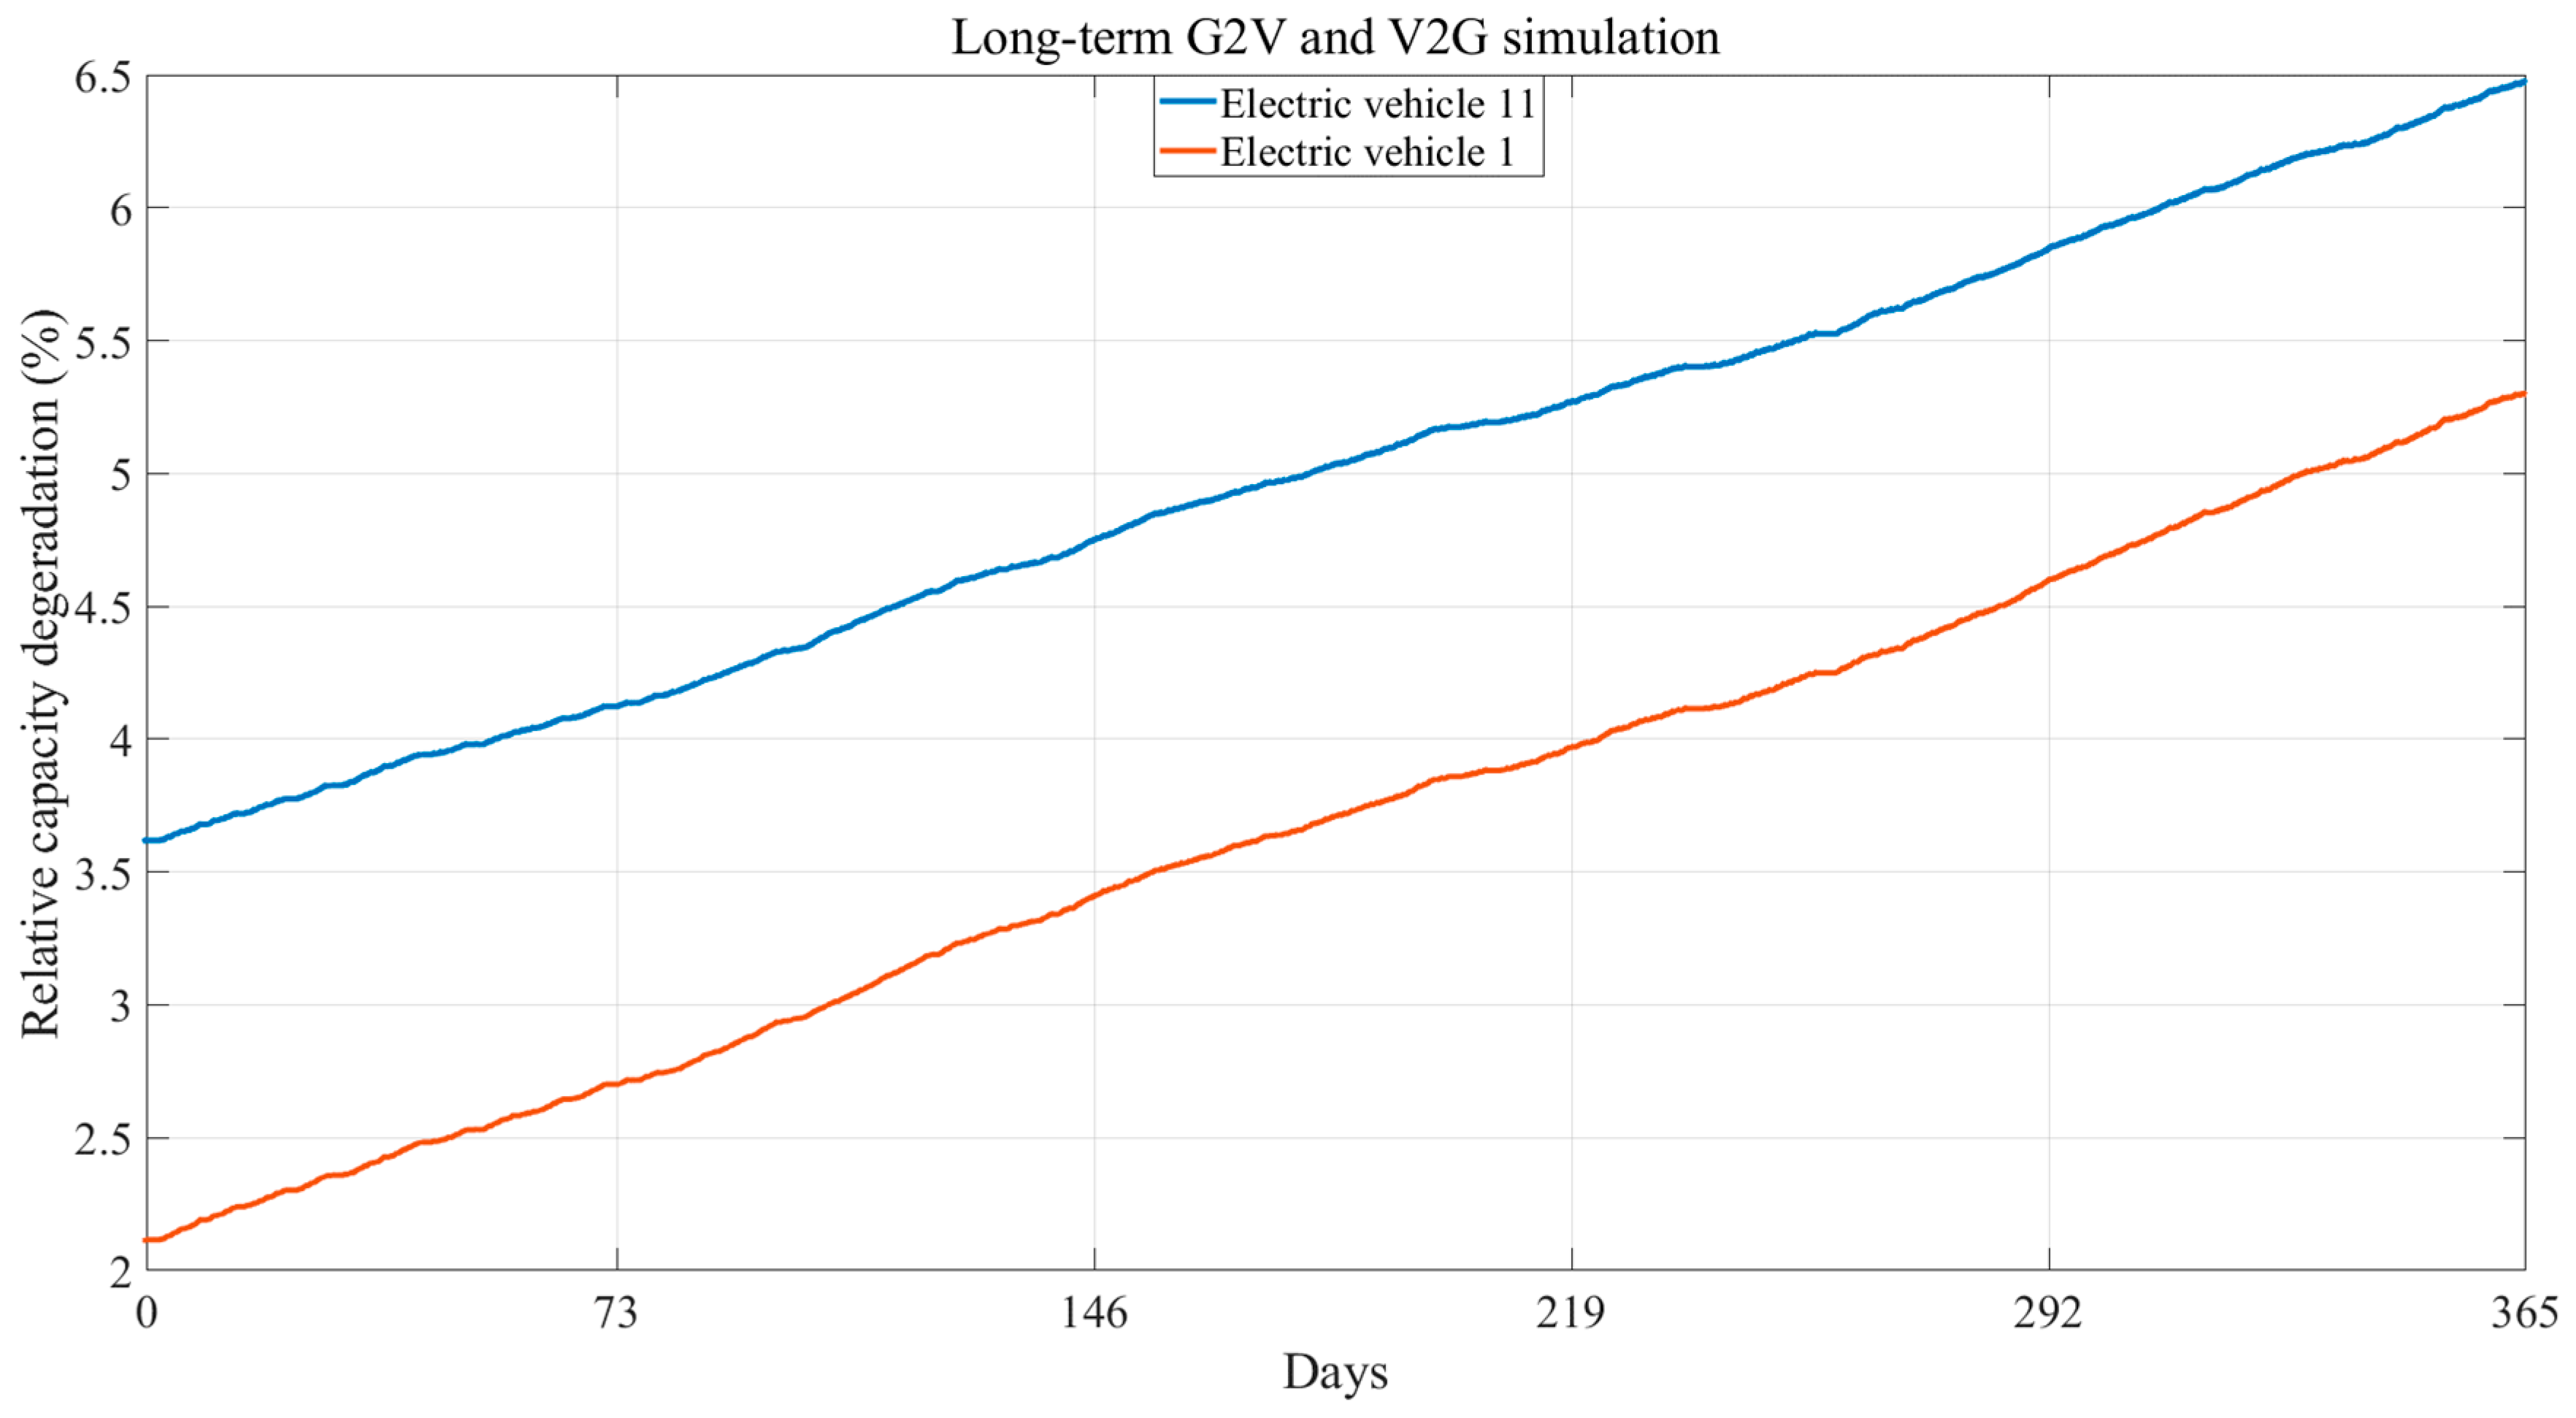
The simulation results demonstrate that the number of extra cycles for one-year is 400, and 350 for EV1 and EV11, respectively. More precisely, the percentage of capacity degradation increases from 2.2% to 5.3% for EV1, and from 3.6% to 6.5% for EV11, as shown in Figure 17. This means that within V2G technology extra cycles cause the battery to fade. Nevertheless, V2G strategies can assist the electrical designer to increase PV penetration into the power system, which can affect CO2 emissions reductions. Moreover, the simulation results show that in uncoordinated charging/discharging scenario, the percentage of capacity degradation increases from 2.20% to 5.64% for EV1, and from 3.6% to 6.8% for EV11. However, the results demonstrate that V2G technologies lead battery capacity degradation to an increase, it is shown that coordination between EVs charging/discharging protocols and state of power system can reduce the percentage of capacity degradation.
To compare the present results regarding battery capacity degradation rate in the framework of a smart gird environment, it is worth mentioning that the battery capacity degradation is dependent on C-Rate, DOD, Ah throughput, battery chemistry, and how long the EVs have contributed to grid services. Therefore, this comparison provides a general overview of how much different parameters can affect the battery degradation rate in V2G and G2V services. Reference [40] showed that the average EVs’ battery capacity degradation for grid services is 3.7% and 5.6% in “extreme” cases. Nevertheless, based on the proposed architecture, the average EV battery capacity degradation for EV1 and EV11 in the coordinated scenario is 3.1% and 2.9%, respectively. Furthermore, Ref. [23] showed that the smart-grid formulation can reduce the battery capacity fade of EVs by up to 9.1%. In comparison with the results of the C6/LiNiCoAlO2 battery degradation in the framework of a smart-gird, the present research attains a 6.41% capacity improvement in a smart-grid environment with NMC cell characteristics. Moreover, [41], proposed a distributed, multi-agent EV management system requiring less than 55 s to converge to equilibrium independently of the size of the EV fleet. Nonetheless, according to the proposed technique, the required information for the lower layer of controller is provided in advance, hence there is not a 55-s delay in control signals for convergence at a near optimal solution. Please refer to [42,43] for further information on multi-agent systems with nonlinear dynamics and uncertainties and group consensus control of multi-agent systems under directed topology.
4. Conclusions
A nano-grid, fed via photovoltaic panels and augmented with plug-in electric vehicles, acting not only as load but also as a storage device, is described. According to the added uncertainty caused by the intermittency and inconsistency of such integration, a double-layer control strategy is introduced and implemented in Simulink software. The first layer employs the optimal power flow algorithm to maintain the nominal operation of the nano-grid by predicting the PV output and demand one-step ahead; the second layer controls each EV individually, based on its battery SoC and capacity. The forecast-based renewable power generation can be perceived as more grid-friendly than the simple relay-based operation. Forecasting the behavior of solar resources can provide valuable information for energy managers, energy policy makers, and electricity traders, and can help identify appropriate times of operation, repair, and replacement of the wind and/or solar generators. To address the complexities caused by the stochastic nature of renewable energy sources, a robust method based on solar specifications of a given region is required. In this regard, the present paper utilizes measured temperature, humidity, and solar irradiance data (at one hour intervals) from a ground meteorological station to train and compare the performances of the robust artificial intelligence-based predictor system, SVR. For evaluation of its prediction performance, the trained system is deployed to the data that is not used in the training process. The proposed method is comprised of two levels: the upper level, enabling the nano-grid to be adapted to different power source structures and to deal with intermittent renewable energy generation units by optimizing the bi-directional power flow of the nano-grid. Nevertheless, the lower layer reserves and controls the contribution of EVs into V2G and G2V phases based on battery SoC and capacity. It is shown that the un-coordinated aggregator as a node of EV connection to the nano-grid, driven via PV, degrades not only technical characteristics of the power system such as voltage but also accelerates the battery aging mechanism. The efficiency of the proposed technique is shown by comparing two scenarios, the present research attains a 6.41% capacity improvement in a smart-grid. The results of scenario B demonstrates that, by proper coordination between PSs, renewable generation sources, and the aggregator, achieving high reliability of the grid is possible. But, it is inferred that, with the un-coordinated aggregator, with existing power infrastructure, and with high penetration of EVs, the power system will ultimately collapse due to the overloading (undesirable power flow); consequently, transformers thermal runaway. By expanding the use of renewable energy sources, the role of the energy storage system in overcoming power generation fluctuations is highlighted. Integrating PEVs and RESs is found to be profitable for electricity providers but not for PEV owners, with the existing battery technology and its normal degradation. Furthermore, as the grid consists of several nano-grids and micro-grids, due to the distributed optimization, with which all agents cooperate to reach a global optimum, it is reasonable to ask how vulnerable consensus-based distributed optimization algorithms are with respect to failure or malicious behavior by certain nodes. Therefore, multiscale consensus needs to be addressed in a smart grid environment.
Author Contributions
O.R. designed the study and mainly wrote the paper; N.O., J.V.M., M.A.R., T.C., and M.B. revised and proofread the article.
Funding
This research received no external funding.
Acknowledgments
We acknowledge the support of our research team from “Flanders Make”.
Conflicts of Interest
The authors declare no conflicts of interest.
Abbreviations
| Acronyms | |||
| ANN | Artificial neural network | PS | Power system |
| APF | Adaptive particle filter | PF | Particle filter |
| ANFIS | Adaptive neuro-fuzzy inference system | RMSE | Root mean square error |
| ARCE | absolute relative capacity error | RBC | Remaining battery capacity |
| ASMO | Adaptive sliding mode observer | SG | Smart grid |
| MGP-PF | Mixture of Gaussian process and particle filtering | TLBO | Teaching-learning based optimization |
| CC | Constant current | TOPF | Three-phase optimal power flow |
| CV | Constant voltage | SOC | State of charge |
| DG | Distributed generation | SOH | State of health |
| DHIF | Dual H infinity filter | SVR-PF | Support vector regression-particle filter |
| ESS | Energy storage system | UDDS | Urban Dynamometer Driving Schedule |
| EV | Electric vehicle | V2G | Vehicle-to-grid |
| EKF | Extended Kalman filter | Nomenclature | |
| G2V | Grid-to-vehicle | PM10 | Particulate matter of diameter less than 10 micrometers |
| GHG | Greenhouse gas | Output of kth layer for ith weight | |
| GMDH | Group method of data handling | y(.) | Output of system |
| GP | Gaussian process | k | Sampling time step |
| GQ | Gaussian quadrature | u(.) | Input to system |
| GR-PF | Generic resampling particle filter | nu | Maximum delay in input |
| HRES | Hybrid renewable energy system | ny | Maximum delay in output |
| H∞ | H-infinite | C | Maximum practical capacity |
| ITDNN | Input time-delayed neural network | i(t) | Battery current at time t |
| IM-PF | Interacting multiple model particle filter | SoC(t) | Approximate practical state of charge at time t |
| KF | Kalman filter | V(t) | Measured voltage |
| LS | Least squares | n | Number of learners or population |
| NN | Neural network | m or j | Number of decision making variables or classes |
| NEDC | New European Driving Cycle | Result of best student in sequence i | |
| NPF | Nonlinear predictive filter | x | Control variable |
| MSE | Mean square error | Weights of cost function | |
| OF | Object function | Minimum fluctuation of manipulated inputs | |
| PEV | Plug-in electric vehicle | Maximum fluctuation of manipulated inputs | |
| PHEV | Plug-in hybrid electric vehicle | Estimated voltage | |
| PSO | Particle swarm optimization | ||
Appendix A

Table A1.
Characteristics of NMC cells.
| Property | Value |
|---|---|
| Electrical | |
| Max discharge current (A) | 100 |
| Recommended charge current (A) | 10 |
| Nominal voltage (V) | 3.65 |
| End of charge voltage (V) | 4.2 |
| End of discharge voltage (V) | 3 |
| Nominal capacity (Ah) | 20 |
| Specific energy (W h/kg) | 174 |
| Energy density (W h/L) | 370 |
| Power density (DoD 50%, 10 s) (W/L) | 4600 |
| Specific power (DoD 50%, 10 s) (W/kg) | 2300 |
| Mechanical | |
| Width of tabs (mm) | 30 |
| Length of tabs (mm) | 40 |
| Length of cell (mm) | 217 |
| Thickness of cell (mm) | 7.1 |
| Width of cell (mm) | 130 |
| Weight of cell (g) | 428 |
References
- Rahbari, O.; Omar, N.; Firouz, Y.; Rosen, M.A.; Goutam, S.; Van Den Bossche, P.; Van Mierlo, J. A novel state of charge and capacity estimation technique for electric vehicles connected to a smart grid based on inverse theory and a metaheuristic algorithm. Energy 2018, 155, 1047–1058. [Google Scholar] [CrossRef]
- Independent Statistics & Analysis—U.S. Energy Information Administration. Energy Perspectives Figures, 2011. Available online: https://www.eia.gov/totalenergy/data/annual/pdf/aer.pdf (accessed on 1 March 2018).
- Rahbari, O.; Vafaeipour, M.; Omar, N.; Rosen, M.A.; Hegazy, O.; Timmermans, J.; Heibati, S.; Bossche, P. Van Den An optimal versatile control approach for plug-in electric vehicles to integrate renewable energy sources and smart grids. Energy 2017, 134, 1053–1067. [Google Scholar] [CrossRef]
- Amjad, M.; Ahmad, A.; Husain, M.; Umer, T. A review of EVs charging: From the perspective of energy optimization, optimization approaches, and charging techniques. Transp. Res. Part D 2018, 62, 386–417. [Google Scholar] [CrossRef]
- Dawoud, S.M.; Lin, X.; Okba, M.I. Hybrid renewable microgrid optimization techniques: A review. Renew. Sustain. Energy Rev. 2018, 82, 2039–2052. [Google Scholar] [CrossRef]
- Christian, J.; Lodberg, M.; Juhl, L.T.; Lindegaard, S.B. V2G—An Economic Gamechanger in E-Mobility? World Electr. Veh. J. 2018, 9, 35. [Google Scholar]
- Morse, S.; Malmgren, I.; Letendre, S.E.; Ruder, A. State Grid-Interactive Vehicle Roadmap. World Electr. Veh. J. 2016, 8, 587. [Google Scholar] [CrossRef]
- Mcpherson, M.; Ismail, M.; Hoornweg, D.; Metcalfe, M. Planning for variable renewable energy and electric vehicle integration under varying degrees of decentralization: A case study in Lusaka, Zambia. Energy 2018, 151, 332–346. [Google Scholar] [CrossRef]
- Rekioua, D.; Bensmail, S.; Bettar, N. Development of hybrid photovoltaic-fuel cell system for stand-alone application. Int. J. Hydrogen Energy 2013, 39, 1604–1611. [Google Scholar] [CrossRef]
- Drude, L.; Carlos, L.; Junior, P.; Rüther, R. Photovoltaics (PV) and electric vehicle-to-grid (V2G) strategies for peak demand reduction in urban regions in Brazil in a smart grid environment. Renew. Energy 2014, 68, 443–451. [Google Scholar] [CrossRef]
- Kemausuor, F.; Adkins, E.; Adu-poku, I.; Brew-hammond, A.; Modi, V. Energy for Sustainable Development Electri fi cation planning using Network Planner tool: The case of Ghana. Energy Sustain. Dev. 2014, 19, 92–101. [Google Scholar] [CrossRef]
- Peterson, S.B.; Whitacre, J.F.; Apt, J. The economics of using plug-in hybrid electric vehicle battery packs for grid storage. J. Power Sources 2010, 195, 2377–2384. [Google Scholar] [CrossRef]
- Rotering, N.; Member, S.; Ilic, M. Optimal Charge Control of Plug-In Hybrid Electric Vehicles in Deregulated Electricity Markets. IEEE Trans. Power Syst. 2011, 26, 1021–1029. [Google Scholar] [CrossRef] [Green Version]
- Seddig, K.; Jochem, P.; Fichtner, W. Integrating renewable energy sources by electric vehicle fl eets under uncertainty. Energy 2017, 141, 2145–2153. [Google Scholar] [CrossRef]
- Forrest, K.E.; Tarroja, B.; Zhang, L.; Shaffer, B.; Samuelsen, S. Charging a renewable future: The impact of electric vehicle charging intelligence on energy storage requirements to meet renewable portfolio standards. J. Power Sources 2016, 336, 63–74. [Google Scholar] [CrossRef]
- Aliasghari, P.; Mohammadi-ivatloo, B.; Alipour, M.; Abapour, M. Optimal scheduling of plug-in electric vehicles and renewable micro- grid in energy and reserve markets considering demand response program. J. Clean. Prod. 2018, 186, 293–303. [Google Scholar] [CrossRef]
- Shamshirband, M.; Salehi, J.; Gazijahani, F.S. Decentralized trading of plug-in electric vehicle aggregation agents for optimal energy management of smart renewable penetrated microgrids with the aim of CO2 emission reduction. J. Clean. Prod. 2018, 200, 622–640. [Google Scholar] [CrossRef]
- Fazelpour, F.; Vafaeipour, M.; Rahbari, O.; Rosen, M.A. Intelligent optimization to integrate a plug-in hybrid electric vehicle smart parking lot with renewable energy resources and enhance grid characteristics. Energy Convers. Manag. 2014, 77, 250–261. [Google Scholar] [CrossRef]
- Fazelpour, F.; Vafaeipour, M.; Rahbari, O.; Rosen, M.A. Intelligent optimization of charge allocation for plug-in hybrid electric vehicles utilizing renewable energy considering grid characteristics. In Proceedings of the 2013 IEEE International Conference on Smart Energy Grid Engineering (SEGE), Vancouver, BC, Canada, 21–24 October 2013; pp. 1–8. [Google Scholar]
- Sachan, S.; Adnan, N. Stochastic charging of electric vehicles in smart power distribution grids. Sustain. Cities Soc. 2018, 40, 91–100. [Google Scholar] [CrossRef]
- Abdi, H.; Derafshi, S.; La, M. A review of optimal power fl ow studies applied to smart grids and microgrids. Renew. Sustain. Energy Rev. 2017, 71, 742–766. [Google Scholar] [CrossRef]
- Chen, D.; Zou, F.; Lu, R.; Wang, X. A hybrid fuzzy inference prediction strategy for dynamic multi-objective optimization. Swarm Evol. Comput. 2018, 43, 147–165. [Google Scholar] [CrossRef]
- Uddin, K.; Jackson, T.; Widanage, W.D.; Chouchelamane, G.; Jennings, P.A.; Marco, J. On the possibility of extending the lifetime of lithium-ion batteries through optimal V2G facilitated by an integrated vehicle and smart-grid system. Energy 2017, 133, 710–722. [Google Scholar] [CrossRef]
- Klass, V.; Behm, M. Capturing lithium-ion battery dynamics with support vector machine-based battery model. J. Power Sources J. 2015, 298, 92–101. [Google Scholar] [CrossRef]
- Berecibar, M.; Devriendt, F.; Dubarry, M.; Villarreal, I.; Omar, N.; Verbeke, W.; Mierlo, J. Van Online state of health estimation on NMC cells based on predictive analytics. J. Power Sources 2016, 320, 239–250. [Google Scholar] [CrossRef]
- Zeng, J.; Qiao, W. Short-term solar power prediction using a support vector machine. Renew. Energy 2013, 52, 118–127. [Google Scholar] [CrossRef]
- Babu, N.R.; Mohan, B.J. Fault classification in power systems using EMD and SVM. Ain Shams Eng. J. 2017, 8, 103–111. [Google Scholar] [CrossRef] [Green Version]
- Grover-silva, E.; Girard, R.; Kariniotakis, G. Optimal sizing and placement of distribution grid connected battery systems through an SOCP optimal power fl ow algorithm. Appl. Energy 2018, 219, 385–393. [Google Scholar] [CrossRef]
- Roberge, V.; Tarbouchi, M.; Okou, F. Optimal power flow based on parallel metaheuristics for graphics processing units. Electr. Power Syst. Res. 2016, 140, 344–353. [Google Scholar] [CrossRef]
- El-zonkoly, A. Electrical Power and Energy Systems Optimal placement and schedule of multiple grid connected hybrid energy systems. Int. J. Electr. Power Energy Syst. 2014, 61, 239–247. [Google Scholar] [CrossRef]
- Li, J.; Adewuyi, K.; Lot, N.; Landers, R.G.; Park, J. A single particle model with chemical/mechanical degradation physics for lithium ion battery State of Health (SOH) estimation. Appl. Energy 2018, 212, 1178–1190. [Google Scholar] [CrossRef]
- De Hoog, J.; Timmermans, J.; Ioan-stroe, D.; Swierczynski, M.; Jaguemont, J.; Goutam, S.; Omar, N.; Van Mierlo, J.; Van Den Bossche, P. Combined cycling and calendar capacity fade modeling of a Nickel-Manganese-Cobalt Oxide Cell with real-life profile validation. Appl. Energy 2017, 200, 47–61. [Google Scholar] [CrossRef]
- Hoon, Y.; Soo, D.; Kim, M.; Sang, M.; Lee, Y.; Ho, K.; Tae, I.; Hur, J.; Geol, S. Investigation of electrochemical performance on carbon supported tin-selenium bimetallic anodes in lithium-ion batteries. Electrochim. Acta 2018, 266, 193–201. [Google Scholar]
- Gyan, P.; Baghdadi, I.; Briat, O.; Del, J. Lithium battery aging model based on Dakin’ s degradation approach. J. Power Sources 2016, 325, 273–285. [Google Scholar]
- Rahbari, O.; Mayet, C.; Omar, N.; Van Mierlo, J. Battery Aging Prediction Using Input-Time-Delayed Based on an Adaptive Neuro-Fuzzy Inference System and a Group Method of Data Handling Techniques. Appl. Sci. 2018, 8, 1301. [Google Scholar] [CrossRef]
- Berecibar, M.; Gandiaga, I.; Villarreal, I.; Omar, N.; Van Mierlo, J.; Van Den Bossche, P. Critical review of state of health estimation methods of Li-ion batteries for real applications. Renew. Sustain. Energy Rev. 2016, 56, 572–587. [Google Scholar] [CrossRef]
- Meteoblue 2017. Available online: https://www.meteoblue.com/en/weather/archive/export/brussels_belgium_2800866 (accessed on 30 January 2018).
- Ahmadian, A.; Sedghi, M.; Elkamel, A.; Fowler, M.; Aliakbar, M. Plug-in electric vehicle batteries degradation modeling for smart grid studies: Review, assessment and conceptual framework. Renew. Sustain. Energy Rev. 2018, 81, 2609–2624. [Google Scholar] [CrossRef]
- Finley, T.D. Battery Degradation Modeling For Vehicle Applications. Master’s Thesis, University of Waterloo, Waterloo, ON, Canada, 2014. [Google Scholar]
- Wang, D.; Coignard, J.; Zeng, T.; Zhang, C.; Saxena, S. Quantifying electric vehicle battery degradation from driving vs. vehicle-to-grid services. J. Power Sources 2016, 332, 193–203. [Google Scholar] [CrossRef] [Green Version]
- Karfopoulos, E.L.; Hatziargyriou, N.D. A multi-agent system for controlled charging of a large population of electric vehicles. IEEE Trans. Power Syst. 2013, 28, 1196–1204. [Google Scholar] [CrossRef]
- Shang, Y.; Ye, Y. Leader-Follower Fixed-Time Group Consensus Control of Multiagent Systems under Directed Topology. Complexity 2017, 2017, 3465076. [Google Scholar] [CrossRef]
- Shang, Y. Fixed-time group consensus for multi-agent systems with non-linear dynamics and uncertainties. IET Control Theory Appl. 2017, 12, 395–404. [Google Scholar] [CrossRef]
Figure 1.
Energy consumption of industrial, transportation, residential and commercial sectors in the US since 1950 [2].
Figure 1.
Energy consumption of industrial, transportation, residential and commercial sectors in the US since 1950 [2].

Figure 2.
Hierarchical control scheme and the aggregator.

Figure 3.
The low-layer of controller for each EV.

Figure 4.
Behavior of internal resistance at different SoC.

Figure 5.
Hourly received solar radiation on horizontal surface data for Brussels.

Figure 6.
Prediction result of four days: (a) first day, (b) 50th day, (c) 100th day, (d) 150th day.
Figure 6.
Prediction result of four days: (a) first day, (b) 50th day, (c) 100th day, (d) 150th day.

Figure 7.
Virtual nano-grid architecture.

Figure 8.
Individual EV model in the framework of an aggregator.

Figure 9.
Time-based active power and voltage profile through the architecture (Scenario A): (A1) voltage profile of the aggregator, (A2) generated active power from PV, (A3) injected active power from the aggregator (V2G), (A4) Demand side, (A5) the drawn active power from the architecture to the aggregator (G2V).

Figure 10.
Number of EVs for each phase that can countersuit to V2G and G2V for scenario A.

Figure 11.
Comparison of the 1st and 11st EVs with different initial SoCs and cycles: (B1) current profile of EV1, defined by the decentralized controller, (B2) time-based SoC of EV1, (B3) rate of capacity degradation of EV1, (B4) number of cycles of EV1, (B5) current profile of EV11, defined by the decentralized controller, (B6) time-based SoC of EV11, (B7) rate of capacity degradation of EV11, and (B8) number of cycles of EV11.

Figure 12.
Time-based active power and voltage profile through the architecture (Scenario B): (C1) voltage profile of the aggregator, (C2) generated active power from PV, (C3) injected active power from the aggregator (V2G), (C4) Demand side, (C5) the drawn active power from the architecture to the aggregator (G2V).

Figure 13.
Number of EVs for each phase that can countersuit to V2G and G2V for scenario B.

Figure 14.
Comparison of the 1st and 11st EVs with different initial SoCs and cycles: (D1) current profile of EV1, defined by the decentralized controller, (D2) time-based SoC of EV1, (D3) rate of capacity degradation of EV1, (D4) number of cycles of EV1, (D5) current profile of EV11, defined by the decentralized controller, (D6) time-based SoC of EV11, (D7) rate of capacity degradation of EV11, (D8) number of cycles of EV11.

Figure 15.
Active power flow of scenario B from 7 a.m. to 17 p.m.

Figure 16.
Battery pack oversizing due to unknown battery degradation for an 8-year lifetime [39].
Figure 16.
Battery pack oversizing due to unknown battery degradation for an 8-year lifetime [39].

Figure 17.
Long-term G2V and V2G simulation for EV1 and EV11.

Table 1.
Cycle aging test matrix, with the number of cells assigned to each test condition [32].
Table 1.
Cycle aging test matrix, with the number of cells assigned to each test condition [32].
| T (°C) | C-Rate | DOD (%) | ||||||
|---|---|---|---|---|---|---|---|---|
| 100 | 80 | 65 | 50 | 35 | 20 | 10 | ||
| 50 | C/3-1C | - | 3 | - | - | - | - | - |
| 45 | C/3-1C | 3 | 8 | 3 | 3 | 3 | 3 | 3 |
| 35 | C/3-2C | 3 | 8 | 3 | 14 | 3 | 15 | 9 |
| 25 | C/3-1C | 3 | 8 | 3 | 3 | 3 | 3 | - |
| 0 | C/3-1C | - | 3 | - | - | - | - | - |
| −10 | C/3-1C | - | 3 | - | - | - | - | - |
Table 2.
Performance comparison of predictor systems using predicted and actual data.
| Error | Solar Power Generation Predicted via SVR | |||
|---|---|---|---|---|
| Day | 1st | 50th | 100th | 150th |
| RMSE | 1.6693 | 2.2721 | 3.6625 | 0.5565 |
© 2019 by the authors. Licensee MDPI, Basel, Switzerland. This article is an open access article distributed under the terms and conditions of the Creative Commons Attribution (CC BY) license (http://creativecommons.org/licenses/by/4.0/).
Share and Cite
MDPI and ACS Style
Rahbari, O.; Omar, N.; Van Mierlo, J.; A. Rosen, M.; Coosemans, T.; Berecibar, M. Electric Vehicle Battery Lifetime Extension through an Intelligent Double-Layer Control Scheme. Energies 2019, 12, 1525. https://doi.org/10.3390/en12081525
AMA Style
Rahbari O, Omar N, Van Mierlo J, A. Rosen M, Coosemans T, Berecibar M. Electric Vehicle Battery Lifetime Extension through an Intelligent Double-Layer Control Scheme. Energies. 2019; 12(8):1525. https://doi.org/10.3390/en12081525
Chicago/Turabian StyleRahbari, Omid, Noshin Omar, Joeri Van Mierlo, Marc A. Rosen, Thierry Coosemans, and Maitane Berecibar. 2019. "Electric Vehicle Battery Lifetime Extension through an Intelligent Double-Layer Control Scheme" Energies 12, no. 8: 1525. https://doi.org/10.3390/en12081525
Note that from the first issue of 2016, this journal uses article numbers instead of page numbers. See further details here.