Comparative Study of Road Lighting Efficiency in the Context of CEN/TR 13201 2004 and 2014 Lighting Standards and Dynamic Control


Department of Applied Computer Science, AGH University of Science and Technology, Al.Mickiewicza 30, 30-059 Kraków, Poland
*
Author to whom correspondence should be addressed.
Energies 2019, 12(8), 1524; https://doi.org/10.3390/en12081524
Submission received: 28 February 2019
/
Revised: 15 April 2019
/
Accepted: 17 April 2019
/
Published: 23 April 2019
(This article belongs to the Section A: Sustainable Energy)
Abstract
:This paper presents a comparative study of differences in energy consumption while applying 2004 and 2014 releases of the CEN/TR 13201 standard for lighting designs. Street lighting optimal design and its optimization is discussed. To provide a reliable comparison, optimal designs for a given representative set of streets were calculated. The optimization was performed by newly developed software. As a test bed, a set of streets was selected with varying physical and traffic characteristics. The energy consumption was measured on the same set of streets both statically, which assumed the same lighting levels throughout night, and with a dynamic control, which adjusted lighting based on traffic intensity. For experiments with the dynamic control, one year of traffic intensity data were used. The findings confirm increased economical impact of dynamic control for the 2014 standard, which results in significant energy saving.
1. Introduction
Proper design of energy efficient outdoor lighting systems plays crucial role for sustainable economy. It is due to the effect of scale. Currently, 340 million street lights generate a cost of $23.9 billion, in terms of energy usage, worldwide. It is expected to grow up to $42.5 billion by 2025 [1]. On the other hand, proper lighting increases safety of both car and pedestrian traffic [2].
The CEN/TR 13201 lighting standard was updated in 2014 [3], and since then it has been recommended in most European countries. The standard defines how to properly design a lighting system in terms of light point placement and lighting properties. Comparing it with the previous version, referred to as CEN/TR 13201 2004 [4], there are substantial changes. It is a major revision that regards how lighting requirements are identified, light point parameters are established, and introduces new naming conventions as well.
This paper aims presents a comparison between 2004 and 2014 standards, in terms of lighting system energy usage. The comparison was twofold: static and dynamic. The static one regarded the design itself—verifying if compliance with the 2014 standard leads to energy consumption change. The dynamic one verified energy consumption for a dynamically controlled infrastructure that adjusts lighting levels to particular needs. The comparison was conducted on the same area for which both lighting design and control was carried out with respect of the aforementioned standards.
The methodology was based on a comparison of energy consumption for the most effective designs of the representative infrastructure in accordance to each of the standard releases. A challenge is in a proper definition of two terms:
- the assurance that a design is the most effective; and
- the designation of the representative area.
In the following sections, the problem of lighting design is introduced. The literature on optimizing lighting design with the help of AI are discussed. An infrastructure test bed and representative areas for further comparison are presented and discussed. The final sections present the energy usage comparison for static and dynamic situations, respectively, showing the direct influence of introducing the 2014 standard on energy consumption.
2. Street Lighting Design and Optimization
The main task of street lighting design is to provide information about luminaire distribution and properties. Luminaires of given types with properly adjusted light source power are placed on poles with specific height, overhang, tilt, rotation, etc. Increasing street lighting efficiency can by achieved by:
Assuming the above, a lighting designer’s objectives are to:
- optimize the design with respect to measurable criteria such as energy efficiency, investment costs or payback period; and
- achieve other subjective goals such as aesthetics.
Compliance with the standards is a prime objective, since it provides both safety and convenience. In particular, the CEN/TR 13201 lighting standard defines:
- how to divide city roads and streets into segments and conflict zones, where a segment is a uniform street length, in terms of its physical structure and traffic-related properties such as number of lanes, parked vehicles, traffic volume, etc., and a conflict zone is an area on which traffic streams might intersect;
- how lighting classes are assigned to the segments and conflict zones, where the lighting classes define exact lighting requirements that need to be met; and
- the proper value of the lighting infrastructure parameters for a given class at a given location, such as pole placement, its height, overhang, tilt, rotation, fixture make and model, light source power settings, etc., which are verified by photometric calculations.
Several photometric properties of an area, such as minimal average luminance maintained (), minimal overall uniformity (), minimal longitudinal uniformity (), minimal surround ratio (), and maximal threshold increment (), have to be verified. There are both minimal and range requirements for them established by the standard. The design process, having the area split into segments, and lighting classes assigned, is iterative. A designer identifies a lighting situation, being a topological characteristics of a given road segment, and based on his experience establishes lighting infrastructure parameters. Then, he runs photometric calculations to verify if the design complies with the photometric properties’ requirements. Normally, verification is performed using specialized software such as Dialux [26], Calculux [27] or Ulysse [28]. The mentioned software packages only verify if the design is compliant with the standard. This causes the designs to be consistent with the standard but far from being optimal in terms of over-lighting. Over-lighting results in light pollution [29,30] and increases both operational and investment cost.
It needs to be pointed out that reducing over-lighting without proper tools is a tedious process. Identifying optimal lighting parameters, even for a single situation, requires enormous number of trial-and-error attempts due to number of parameter combinations that have to be photometrically verified. For example, for a single light point, the following different parameter values: 11 pole locations, 6 arm lengths, 10 distances from neighbors, 2 neighboring poles to consider, 5 fixture inclinations, 5 fixture rotations, 500 fixture models, and 76 dimming levels, give 1,254,000,000 different combinations to consider and verify to be sure that everything is taken into consideration and calculated. A designer can intuitively suggest some solutions but he is unable to find an optimal one.
When effectiveness of design depends on the quality of designer work, it is impossible to compare the influence of different regulations on the final design effectiveness. We have to assure that the compared design it the most effective one. Such a guarantee can be given by an AI-based computer system that generates repeatable solutions. An AI system in comparison to human has no problem with the number of considered combinations. For the 2004 standard, such a unique solution has been developed [31].
To solve these problems, an AI-based computer system has been proposed [32]. The success of this approach is based on a new design paradigm, which is as follows.
- Prepare the formal specification of the environment that is to be designed.
- Identify and split the design into sub-problems with implicit synchronization, to enable concurrent design processing and speed up the process [33].
- Discover a set of graph transformations that automatically create a correct design and optimize it [31].
As a result of applying this technology, an optimal design can be established. The consequences of such an optimization results in increased energy efficiency of the lighting system by 15–37%, and investment cost reduction up to 9%.
To summarize, to compare energy efficiency of lighting infrastructure, there has to be an area selected for which optimal lighting designs are calculated. Furthermore, to enable dynamic control comparison, there has to be traffic intensity data available for it. For an actual comparison, there has to be a proper mathematical model that guarantees the optimal design is established. The model has to be processed by software, which performs the comparison. In our experiment, we compared static and dynamic energy usage (annual energy consumption) with compliance with two versions of the CEN/TR 13201 standard. However, there are other energy performance indicators that could also be considered [34].
3. Preparing Optimal Designs
A software environment supporting lighting design consistent with the 2004 standard was developed, as described in previous publications [8,31,35,36,37]. Adoption of the new 2014 standard required some technical software modification as well as updating the mathematical model.
Let us compare how lighting classes are identified for both standards. A lighting class assigned to an area defines the lighting parameters that must be fulfilled by installed infrastructure. When choosing the lighting class, maximum parameters such as traffic volume, composition, road type, etc., are taken into consideration. The 2014 standard introduces a new naming convention for the lighting classes [3], as well as an algorithm to identify them. Class M is intended for motorized traffic, C for conflict areas, and P for areas for pedestrians and cyclists.
Comparing the 2004 and 2014 standard in the scope of lighting class selection rules, one can observe that the 2014 standard provides more a algorithmic approach. The class evaluation is performed in an arithmetic manner. Table 1 shows an excerpt of parameters for the M lighting class selection.
For example, choosing an appropriate M class requires taking the following parameters under consideration:
- design speed or speed limit;
- traffic volume;
- traffic composition;
- separation of carriageway;
- junction density;
- parked vehicles;
- ambient luminosity;
- and navigational task.
The resulting class ranges from M1 to M6. It is calculated based on the formula:
where is a weighting value. It is calculated as a sum of weighting values for each of the parameters being in a defined range given by the standard. ranges from 0 to 5.
Because of the reasons mentioned above, the underlying data model for optimal design is different for the 2004 and 2014 standards. As a result, new, AI-based software was developed, which can calculate the optimal design, compliant with the requirements given by the 2014 standard.
To make the design process more automated and enable comparison between the standards, the following issues were addressed.
The first was an improvement of automatic lighting class identification. As mentioned above, the 2014 standard is more algorithmic; the parameters are evaluated as “weight value” represented by an integer number; and the final value of the lighting class is a result of arithmetic calculation. Moreover, most of the required parameter values can be obtained from open data repositories, such as Open Street Maps (OSM). Automatic recognition of a lighting class has been developed [38].
Secondly, a street segment quite often is identified to be relatively long or even extends to be a union of a few streets, which is a common oversimplification. This allows designing them as independent parts of the lighting system, which they are not. A more detailed and fine grained identification of a segment results in better suited lighting, but it is crucial for optimal design. On the other hand, it increases the workload. As an example, let us take a look at the mentioned pilot in Kraków, Poland. For 3768 light points, there are the following number of street segments:
- 99 initially identified and designed by a human designer;
- 677 if some of them are split due to the dynamic control requirements; and
- 2268 if the segments are automatically recognized based on actual physical characteristics of the streets and infrastructure.
The above numbers require some clarification. Even if a segment includes only a few lamps, most of the light points influence more than one segment, hence the average number of light points per segment is less than 2 (i.e., 3768/2268 = 1.66).
There are also some computational issues that do not influence design quality. Since lighting point influences on multiple segments prevents parallel execution of the design process and decreases its scalability, the time needed to generate an optimal design increases significantly. It has to be addressed by the model as well by influence separation. It is based on influence guidelines stating that a luminaire influences a square area, which is 12 times the lighting point height along the segment and five times across—as described in [39,40].
The next problem regards cyclic design influences. For example, if we consider four segments such that the end of segment is the beginning of segment and the end of segment is the beginning of segment , then we have to consider an iterative design process. It is caused by the fact that, when we start it at , no other segment influences it, but, when we generate design for , some of its lighting points influence so it will be possible to dim some lamps belonging to ; however, this causes the redesign value of dimming in segment and so on. Thus, the process has to be repeated to find proper values for the cycle.
Currently, these problems are being researched. However, the mentioned computational issues have no influence on the designs presented in this paper due to lack of impact on design quality.
To summarize, we designed and implemented a new software environment for photometric calculations and optimization, namely the GRADIS 3.0 Toolkit (European Funds POIR.01.01.01-00-0037/17 grant), to enable comparison between the lighting standards. It allows generating optimal designs according to both the 2004 and 2014 standards in a reasonable time.
4. Infrastructure Test Bed
Looking at the 2014 street lighting standard (CEN/TR 13201 2014), there is no information on how it really compares to the previously defined one, in terms of energy usage. We decided to verify what is the real effect of compliance with 2014 standard on energy consumption for optimal designs. The test bed consisted of 3768 lighting points in Kraków, Poland, however, for presentation purposes, we chose four streets located in the city center: Piastowska, Nawojki, Mickiewicza and Słowackiego streets. The first two are single-segment. the last two are divided into four segments each due to their structure, which is not homogeneous.
Our choice was also guided by dynamic control availability, in terms of both remote control of the luminaires and obtaining data from sensors. The dynamic control is based on real-time traffic intensity, thus we had to choose streets on which induction loops are installed and data can be read from them. Furthermore, we focused on lighting classes for urban environments, which require significant lighting levels, hence the comparison was performed on M2/ME2, M3/ME3c and M4/ME4b, since only in such situations dynamic control can lead to substantial economic gain. It needs to be pointed out that the dynamic control requires data sources regarding traffic intensity, or other parameters such as ambient lighting or parked vehicle detection. Deployment of such detectors increases cost of the entire installation. This cost has to be at least balanced by benefits such as energy saving and maintenance cost reduction. Thus, the control is usually beneficial for higher lighting classes only since they require more lighting power. Moreover, the higher is the class, the higher is the probability that traffic intensity detectors are already there due to prior triggered traffic light or Intelligent Transportation System deployment. In addition, there would be higher maximum capacity and higher traffic variability, which could result in more energy savings for such streets, as confirmed in Section 6.
New lighting classes have been appointed, based on CEN/TR 13201 2014 [3]. Statistical distribution of lighting class on the selected area is proportional to the entire project of lighting modernization. The proportions are as follows: 76% of lamps provide M2/ME2, 19% M3/ME3c (or equivalent) and 5% M4/ME4b (or equivalent) [11]. These are typical proportions for urbanized areas where control is available. The chosen streets approximate the above proportions as follows: M2/ME2, 70.39%; M3/ME3c, 24.58%; and M4/ME4b, 5.03%. We skipped M1, as being rare for urban areas, and M5 and M6, since streets with these classes are rarely equipped with traffic intensity detectors and potential energy saving is reduced due to low power installed. The shape and location of the streets are shown on the map in Figure 1.
Particular luminaire types installed on the researched streets are presented in Table 2. All chosen streets have traffic detectors built-in (induction loops), thus the traffic intensity data are precise, with measurements provided every 15 min. The actual comparison was based on historical data gathered over a period of one full year from 23 June 2015 to 22 June 2016. For each street, the normal lighting classes were assigned, as presented in Table 3, for both 2004 and 2014 standard. The normal class is a worst case scenario, i.e., the highest possible lighting class for a given segment.
The proposed analysis was carried out twofold:
- Static energy consumption was a comparison of energy consumption for 2004 and 2014 standards—taking into account only most optimal design.
- Dynamic energy consumption also considered adaptive control based on traffic intensity.
It is described in the following sections.
5. Static Energy Consumption Comparison
We already prepared optimal photometric designs to fulfill CEN/TR 13201 2004 standard for the given test bed. For the 2014 standard, we had to do the following:
- identify the 2014 lighting classes (see Table 3 for more details);
- using newly implemented software, prepare the optimal design compliant with 2014 standard; and
- calculate energy usage with basic light point configurations, i.e., without dynamic control.
The overall difference in yearly energy consumption between 2004 and 2014 standard, which is shown in Figure 2, was insignificant.
6. Dynamic Energy Consumption Comparison
The dynamic energy consumption comparison regarded a case when an adaptive control is applied. Every 15 min, traffic intensity counters are read. Then, the appropriate lighting class is chosen based on the readings and the aforementioned rules defined by the lighting standard. Pre-calculated power settings for each of the involved luminaries, provided by the lighting design, according to the required lighting class, is remotely set. This way, the control system maintains compliance with the CEN/TR 13201 standard at any time [12,41]. Thus, the system alternates among available lighting classes. Since the traffic intensity varies, the lighting classes are often lowered, which leads to energy savings.
By default, the design regards the so-called normal class. It is a worst case scenario, i.e., the highest possible lighting class for a given segment. The lighting standard allows downgrading the normal class, e.g., from M2 to M3 or even further to M4, or, in the case of the 2004 standard, from ME2 to ME3c or ME4b.
For our test bed, photometrically confirmed, optimal lighting designs were prepared with our AI-based system for each street segment and each admissible lighting class. The calculations were performed also taking ambient light into consideration. This results in obtaining power settings for each of the luminaires for each lighting class and ambient light level. Unfortunately, due to issues with ambient light data reliability, only traffic intensity was considered.
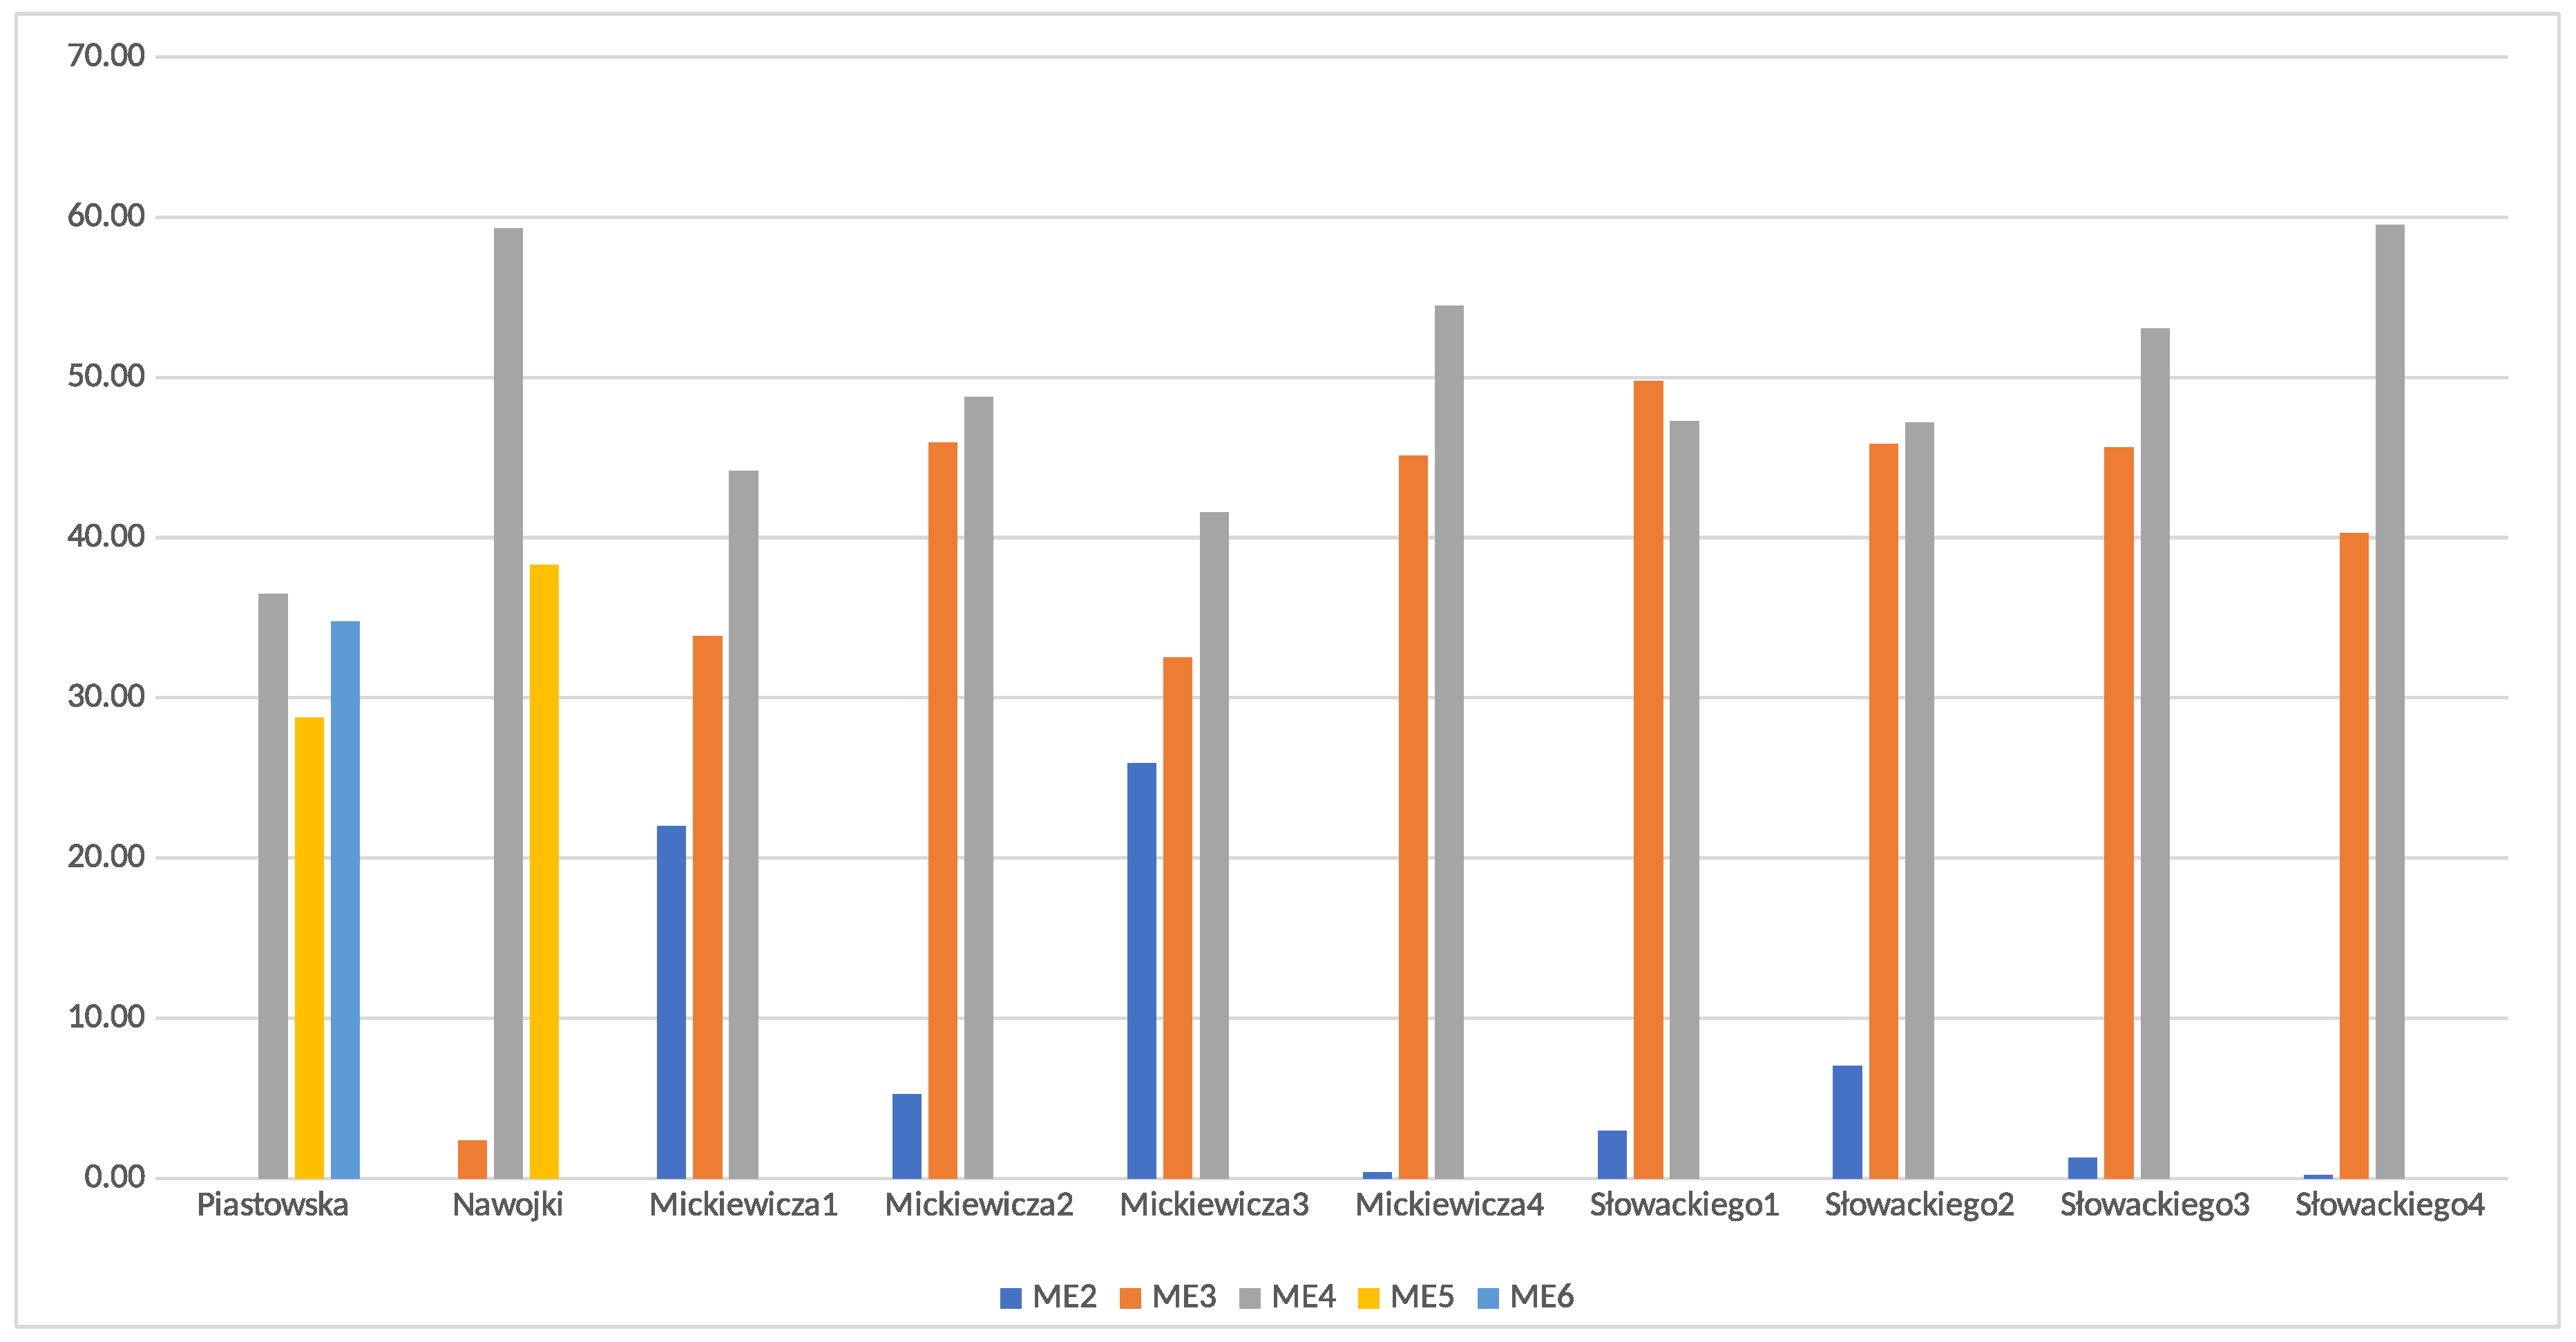
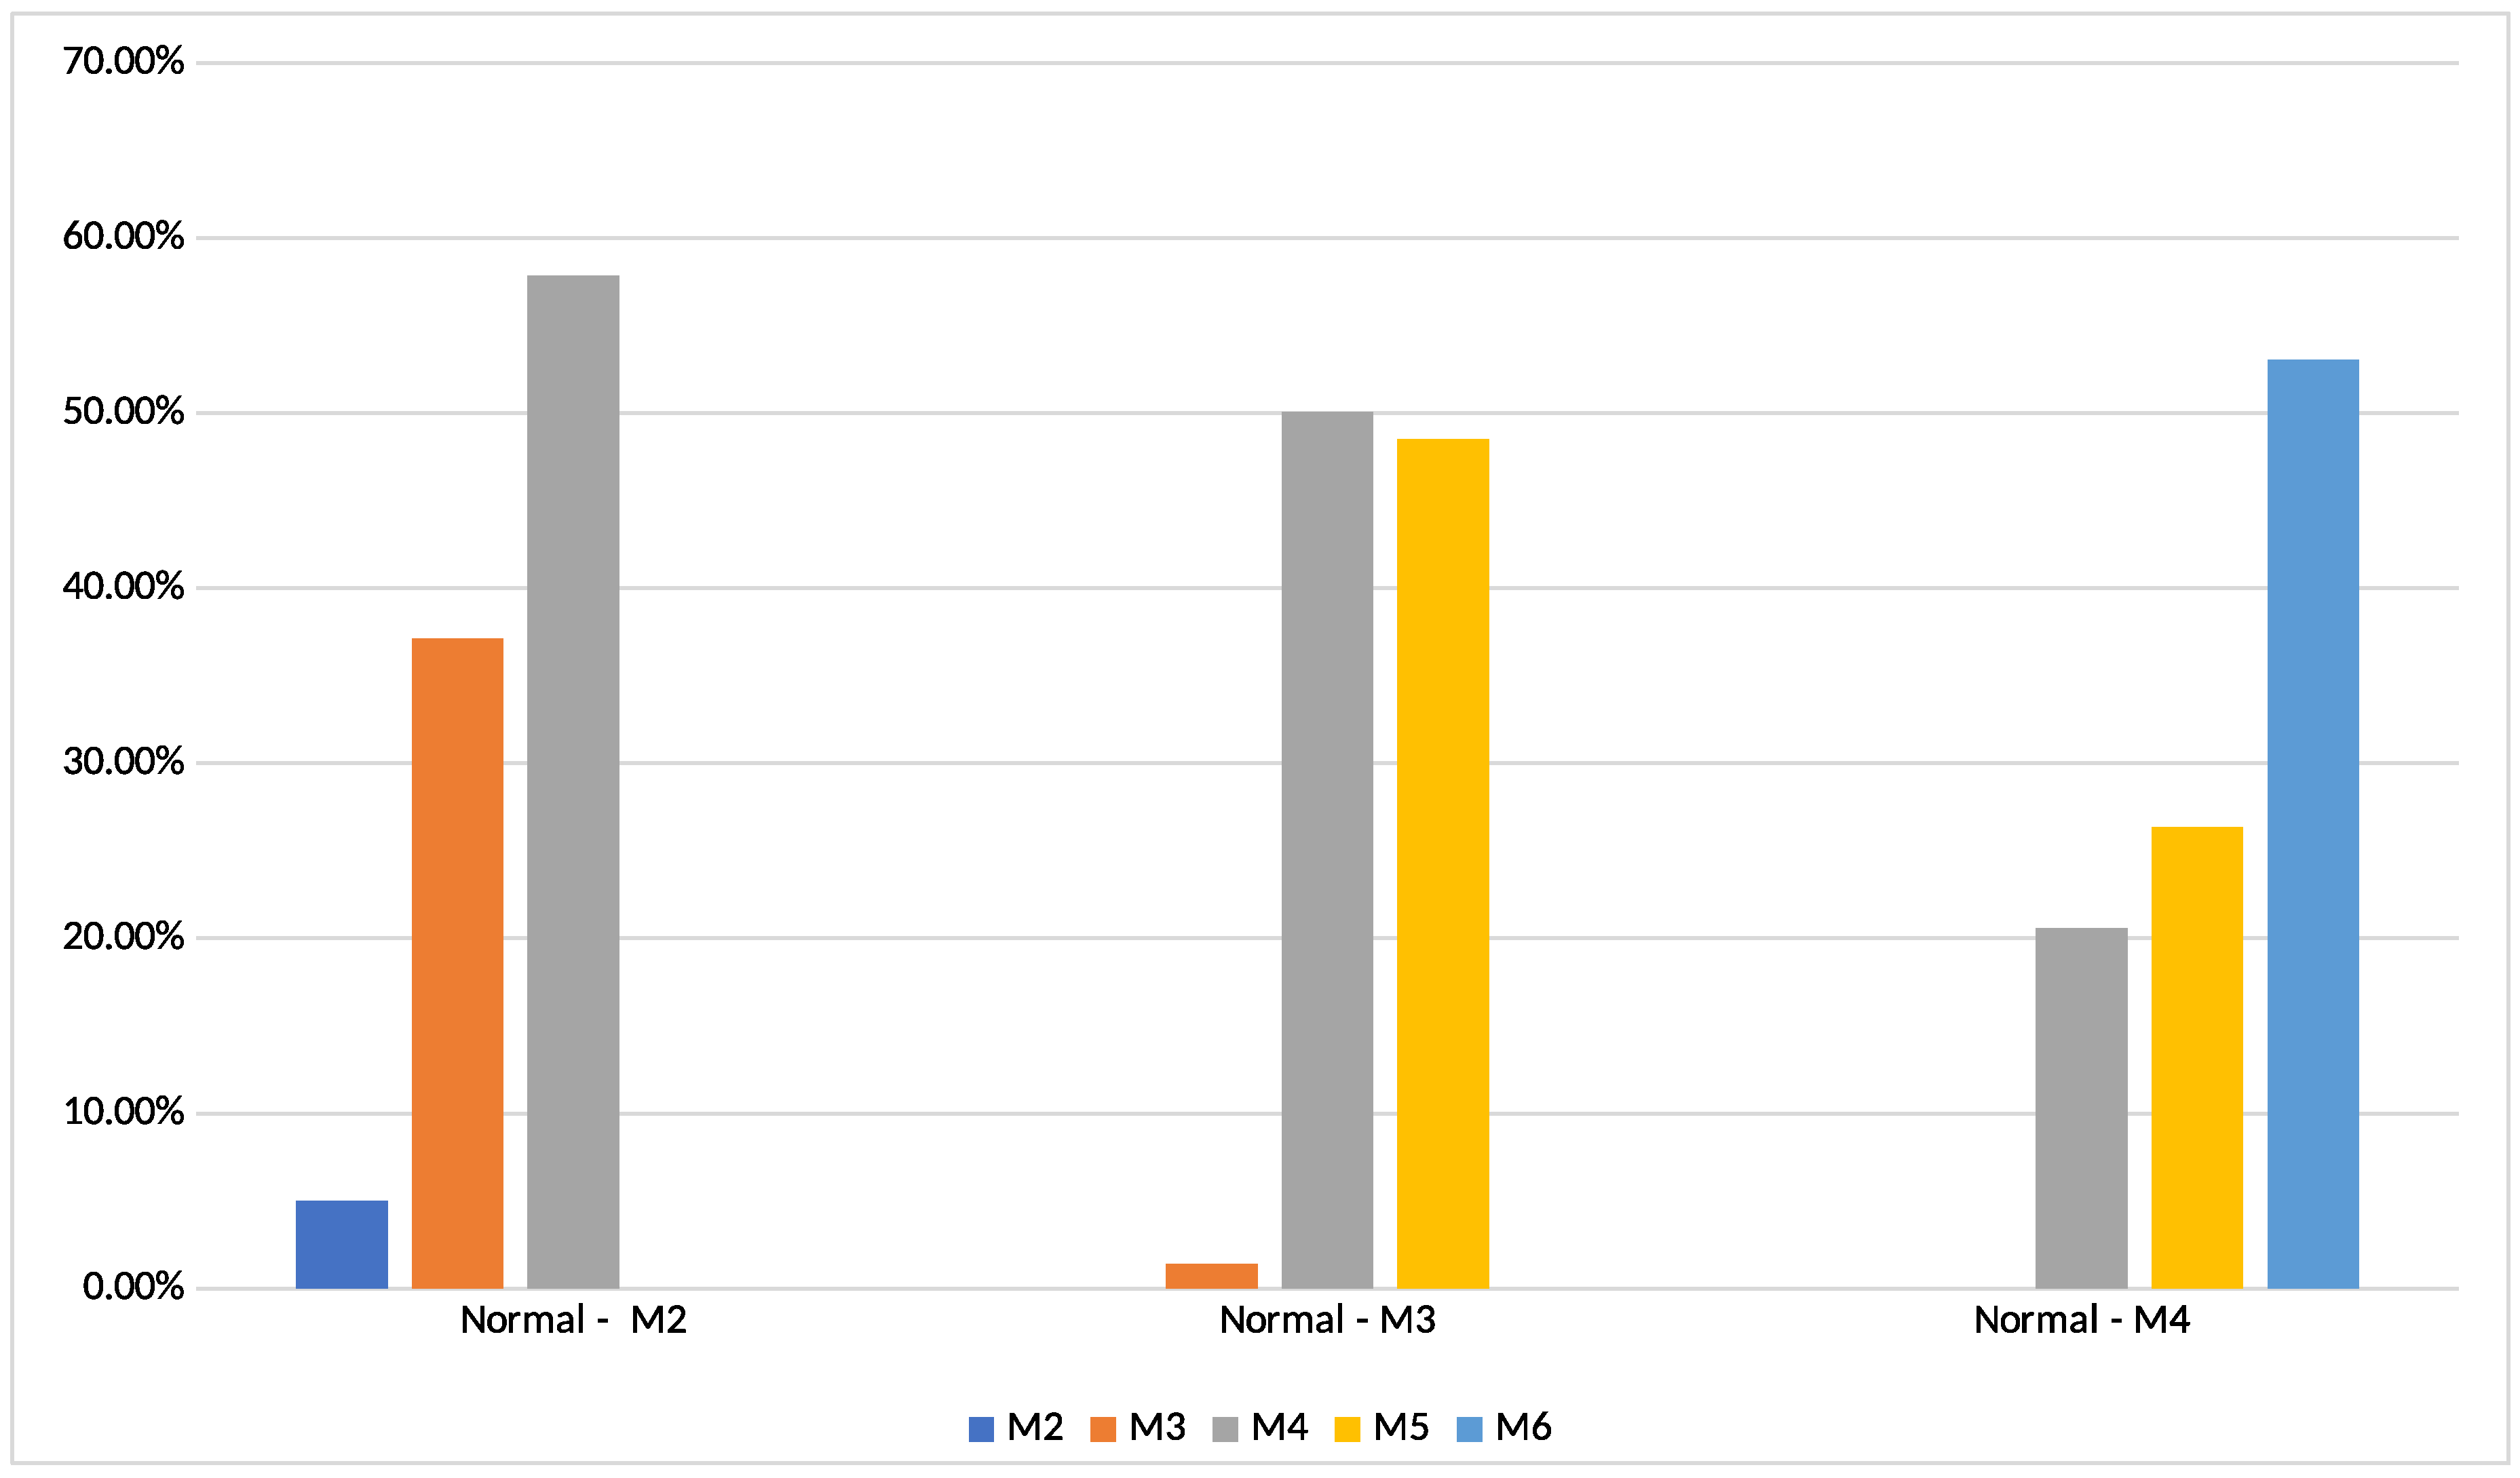
Figure 4 and Table 5 present energy consumption comparison for both 2004 and 2014 standards for each of the street segments. Energy saving for particular normal class is shown in Figure 5. The percentages are in reference to the lighting design compliant with the CEN/TR 13201 2004, which is 100%. It is noticeable that the most savings could be achieved using the 2014 standard and dynamic control, for which they were similar regardless of the normal class. For the 2004 standard, the most savings were achieved for ME2, which reflected the way in which class changes were allowed to change by the standard due to traffic intensity. To compare, a static design according to CEN/TR 13201 2014 is also presented. It indicates savings for the M3/ME3 normal classes only, while M2/ME2 and M4/ME4b resulted in increased energy usage. However, this was not a consistent dependency. For other streets and segments, savings fluctuate regardless of the normal class, from our experience.
Global energy usage for the dynamically controlled test bed, according to the 2014 standard, was significantly lower. It yielded 40.82% of savings.
A detailed observation of how long actual lighting classes were assigned to particular segments after applying the dynamic control compliant with the 2014 standard is presented in Figure 6. It shows that Mickiewicza4 and Słowackiego4 segments maintained the normal lighting class M2 for a very short period of time. On Mickiewicz4, M2 was active for 0.21% of the time and used 0.37% of all energy consumed by this segment for the year. For Słowackiego4, it was 0.10% of time and 0.19% of energy, respectively. Figure 7 presents activation time of each lighting class, grouped by main lighting class. As can be noticed, the main lighting class configurations were activated for less than 5% of the time for classes M2 and M3, proving the importance of dynamic control.
7. Results Discussion
The practical comparison of the designs prepared for the same geographical locations for equivalent lighting classes (e.g., and ) for both 2004 and 2014 standards indicates almost the same energy efficiency. However, applying the 2014 standard (CEN/TR 13201 2014) has more potential for energy saving, which is yet another motivation to update existing infrastructure to comply with it. There are a few reasons for this:
- Calculation of the lighting class based on traffic intensity allows downgrading it by more steps than the 2004 standard.
- The lighting class change depends on the maximum capacity, i.e., the maximum rate of flow at which vehicles can be expected to traverse a lighting segment, instead of fixed values as in the 2004 standard.
In addition to the above, to increase quality of the design itself, streets should be split into segments with increased granularity. It results in more segments, which in turn leads to more precisely adjusted lighting. For example, in a pilot reassignment of 2004 lighting classes to 2014 ones, in Kraków, Poland, for 3768 light points, the following numbers were achieved:
- A basic design performed by hand resulted in only 99 different lighting situations, thus 99 different lighting segments.
- An AI-based design, provided by the GRADIS 2.0 Toolkit (commercially available), resulted in 677 different lighting segments.
- A next generation AI-based design, with assisted lighting class identification and highly detailed geo-location, provided by the GRADIS 3.0 Toolkit (not commercially available yet), resulted in over 2268 segments.
We anticipate that having such small segments would allow for assigning lower lighting classes more often.
8. Conclusions
Applying dynamic control results in energy savings, which have been verified for both 2004 and 2014 standards. It is far greater for the 2014 one and reaches 40.82%. What is more important, with the 2014 standard, energy consumption saving is available regardless of the normal class. It enables using control not only on high capacity streets assigned M2 lighting class, but also on M3s or M4s.
Taking into consideration increasing price of energy (e.g., in Poland it increased by 70% [42] in 2019 comparing with 2018), dynamic street lighting control is becoming more and more important from an economic point of view. These findings are especially significant in the context of additional requirements, which are more and more often put forward by safety-related organizations. They concern increasing safety for non-motorized users addressing especially pedestrian and bicycle crossings and designating additional conflict zones such as in Belgium [15,16], Czech Republic [17], Germany [18], Italy [43], Norway [20], Poland [21], Sweden [22,23], Switzerland [24] and the U.K. [25]). They can significantly increase energy consumption due to additional lighting requirements for such areas. Thus, decreasing the consumption by the dynamic control becomes more and more important. This topic is the subject of further research to deliver reliable insights.
Author Contributions
I.W. and L.K. formulated and researched the problem; K.K. designed and conceived the experiments; and all authors wrote the paper and supervised the theoretical background.
Funding
This research was supported by the AGH University of Science and Technology grant number 11.11.120.859 and co-financed by GRADIS Ltd. from European Funds POIR.01.01.01-00-0037/17.
Conflicts of Interest
The authors declare no conflict of interest.
References
- Richon, C.; Mukish, P. LED in Road & Street LightingMarket Analysis, Applications, Technology Trends and Industry Status; Technical Report; Yole Développement SA and Lux Fit SAS: Villeurbanne, France, 2013. [Google Scholar]
- Pins, D.; Bonnet, C. On the relation between stimulus intensity and processing time: Piéron’s law and choice reaction time. Percept. Psychophys. 1996, 58, 390–400. [Google Scholar] [CrossRef]
- CEN. CEN/TR 13201-1:2014, Road Lighting—Part 1: Guidelines on Selection of Lighting Classes; Technical Report; European Commitee for Standardization: Brussels, Belgium, 2014. [Google Scholar]
- CEN. CEN/TR 13201-1:2004, Road Lighting. Selection of Lighting Classes; Technical Report; European Commitee for Standardization: Brussels, Belgium, 2004. [Google Scholar]
- Burgos-Payan, M.; Correa-Moreno, F.; Riquelme-Santos, J. Improving the energy efficiency of street lighting. A case in the South of Spain. In Proceedings of the 2012 9th International Conference on the European Energy Market, Florence, Italy, 10–12 May 2012; pp. 1–8. [Google Scholar] [CrossRef]
- Bhairi, M.N.; Kangle, S.S.; Edake, M.S.; Madgundi, B.S.; Bhosale, V.B. Design and implementation of smart solar LED street light. In Proceedings of the International Conference on Trends in Electronics and Informatics (ICEI), Tirunelveli, India, 11–12 May 2017; pp. 509–512. [Google Scholar] [CrossRef]
- Salata, F.; Golasi, I.; Bovenzi, S.; Vollaro, E.d.L.; Pagliaro, F.; Cellucci, L.; Coppi, M.; Gugliermetti, F.; Vollaro, A.d.L. Energy Optimization of Road Tunnel Lighting Systems. Sustainability 2015, 7, 9664. [Google Scholar] [CrossRef]
- Sędziwy, A. A New Approach To Street Lighting Design. LEUKOS 2016, 12, 151–162. [Google Scholar] [CrossRef]
- Gomez-Lorente, D.; Rabaza, O.; Estrella, A.E.; Pena-Garcia, A. A new methodology for calculating roadway lighting design based on a multi-objective evolutionary algorithm. Expert Syst. Appl. 2013, 40, 2156–2164. [Google Scholar] [CrossRef]
- Rabaza, O.; Pena-Garcia, A.; Perez-Ocon, F.; Gomez-Lorente, D. A simple method for designing efficient public lighting, based on new parameter relationships. Expert Syst. Appl. 2013, 40, 7305–7315. [Google Scholar] [CrossRef]
- Wojnicki, I.; Kotulski, L. Empirical Study of How Traffic Intensity Detector Parameters Influence Dynamic Street Lighting Energy Consumption: A Case Study in Krakow, Poland. Sustainability 2018, 10, 1221. [Google Scholar] [CrossRef]
- Wojnicki, I.; Kotulski, L. Improving Control Efficiency of Dynamic Street Lighting by Utilizing the Dual Graph Grammar Concept. Energies 2018, 11, 402. [Google Scholar] [CrossRef]
- Wojnicki, I.; Kotulski, L. Street Lighting Control, Energy Consumption Optimization. Artificial Intelligence and Soft Computing; Springer: Cham, Switzerland, 2017; pp. 357–364. [Google Scholar] [CrossRef]
- Bielecka, M.; Bielecki, A.; Ernst, S.; Wojnicki, I. Prediction of Traffic Intensity for Dynamic Street Lighting. In Proceedings of the Federated Conference on Computer Science and Information Systems (FedCSIS), Prague, Czech Republic, 3–6 September 2017. [Google Scholar] [CrossRef]
- NBN L 18-002: Recommendations for Special Cases of Public Lighting; Technical Report; Bureau voor Normalisatie: Brussel, Belgium, 1988.
- Ministerie van de Vlaamse Gemeenschap. Ontwerprichtlijnen Voor Voetgangersvoorzieningen. In Vademecum Voetgangersvoorzieningen; Ministerie van de Vlaamse Gemeenschap: Brussel, Belgium, 2003. [Google Scholar]
- Osvětlení Pozemních Komunikací. In Technické Kvalitativní Podmínky Staveb; Ministerstvo Dopravy: Prague, Czech Republic, 2015.
- DIN 67523-2:2010-06: Beleuchtung von Fußgängerüberwegen (Zeichen 293 StVO) Mit Zusatzbeleuchtung—Teil 2: Berechnung Und Messung; Technical Report; Deutsches Institut für Normung: Berlin, Germany, 2010.
- Linee Guida per La Progettazione Degli Attraversamenti Pedonali; Technical Report; Automobile Club d’Italia: Rome, Italy, 2011.
- Håndbok N100: Veg-Og Gateutforming; Technical Report; Statens Vegvesen: Oslo, Norway, 2014.
- Jamroz, K.; Tomczuk, P.; Mackun, T.; Chrzanowicz, M. Wytyczne Prawidłowego Oświetlenia Przejść Dla Pieszych; Technical Report; Ministerstwo Infrastruktury: Warszawa, Poland, 2018.
- Vägbelysningshandboken; Technical Report; Trafikverket: Stockholm, Sweden, 2014.
- Krav För Vägars Och Gators Utformning; Technical Report Trafikverkets Publikation 2015:086; Trafikverket, Sveriges Kommuner och Landsting: Stockholm, Sweden, 2015.
- Beleuchtung von Fussgänger-Überwegen. In SLG Richtlinie 202:2016; Schweizer Licht Gesellschaft: Bern, Switzerland, 2016.
- Technical Report 12: Lighting of Pedestrian Crossings; Technical Report; Institution of Lighting Professionals: Regent House, Great Britain, 2007.
- Dialux. Available online: https://www.dial.de/en/dialux/ (accessed on 22 April 2019).
- Calculux. Available online: http://www.lighting.philips.cz/podpora/podpora-vyrobku/calculux (accessed on 22 April 2019).
- Ulysse. Available online: https://www.schreder.com/ (accessed on 22 April 2019).
- Hölker, F.; Moss, T.; Griefahn, B.; Kloas, W.; Voigt, C.C.; Henckel, D.; Hänel, A.; Kappeler, P.M.; Völker, S.; Schwope, A.; et al. The Dark Side of Light: A Transdisciplinary Research Agenda for Light Pollution Policy. Ecol. Soc. 2010, 15, ES-2010-3685. [Google Scholar] [CrossRef]
- Hölker, F.; Wolter, C.; Perkin, E.K.; Tockner, K. Light Pollution as a Biodiversity Threat. Trends Ecol. Evolut. 2010, 25, 681–682. [Google Scholar] [CrossRef]
- Sędziwy, A. Sustainable Street Lighting Design Supported by Hypergraph-Based Computational Model. Sustainability 2015, 8, 13. [Google Scholar] [CrossRef]
- Wojnicki, I.; Sedziwy, A.; Kotulski, L. Outdoor Lighting Design Process Optimization. In SMARTGREENS 2013: 2nd International Conference on Smart Grids and Green IT Systems; SciTePress: Aachen, Germany, 2013; pp. 231–234. [Google Scholar]
- Kotulski, L.; Sędziwy, A.; Strug, B.; Wojnicki, I.; Ernst, S. Synchronisation methods in graph-based knowledge representation for large-scale design process. Int. J. Des. Eng. 2017, 7, 17–32. [Google Scholar] [CrossRef]
- Leccese, F.; Salvadori, G.; Rocca, M. Critical analysis of the energy performance indicators for road lighting systems in historical towns of central Italy. Energy 2017, 138, 616–628. [Google Scholar] [CrossRef]
- Sedziwy, A.; Kotulski, L. Graph-Based Optimization of Energy Efficiency of Street Lighting. In Artificial Intelligence and Soft Computing; Springer International Publishing: Berlin, Germany, 2015; Volume 9120, pp. 515–526. [Google Scholar] [CrossRef]
- Sedziwy, A.; Kotulski, L. Multi-Agent System Supporting Automated Large-Scale Photometric Computations. Entropy 2016, 18, 76. [Google Scholar] [CrossRef]
- Sędziwy, A.; Kotulski, L. Multi-agent System Supporting Automated GIS-based Photometric Computations. Procedia Comput. Sci. 2016, 80, 824–833. [Google Scholar] [CrossRef] [Green Version]
- Ernst, S.; Labuz, M.; Sroda, K.; Kotulski, L. Graph-Based Spatial Data Processing and Analysis for More Efficient Road Lighting Design. Sustainability 2018, 10, 3850. [Google Scholar] [CrossRef]
- CEN. CEN/TR 13201-3:2015, Road Lighting—Part 3: Calculation of Performance; Technical Report; European Commitee for Standardization: Brussels, Belgium, 2014. [Google Scholar]
- CEN. CEN/TR 13201-5:2015, Road Lighting—Part 5: Energy Performance Indicators; Technical Report; European Commitee for Standardization: Brussels, Belgium, 2015. [Google Scholar]
- Wojnicki, I.; Kotulski, L.; Sędziwy, A.; Ernst, S. Application of Distributed Graph Transformations to Automated Generation of Control Patterns for Intelligent Lighting Systems. J. Comput. Sci. 2017. [Google Scholar] [CrossRef]
- Energy Price Increase. Available online: https://energytransition.org/2018/11/polish-electricity-prices-on-the-rise/ (accessed on 27 December 2018).
- UNI. UNI 11248:2016, Illuminazione Stradale—Selezione Delle Categorie Illuminotecniche; Technical Report; UNI—Ente Italiano di Normazione: Milano, Italy, 2016. [Google Scholar]
Figure 1.
Area under consideration.

Figure 2.
Overall energy consumption when using 2004 and 2014 standards without dynamic control.

Figure 3.
Static energy consumption comparison, CEN/TR 2004 vs. 2014.

Figure 4.
Energy consumption with dynamic control for given street segments.

Figure 5.
Energy savings with dynamic control for the normal classes.

Figure 6.
Dynamic control lighting class participation on particular segments.

Figure 7.
Dynamic control lighting class participation for main lighting class.


Table 1.
Parameters for the selection of lighting class M (CEN/TR 13201 2014) [3].
Table 1.
Parameters for the selection of lighting class M (CEN/TR 13201 2014) [3].
| Parameter | Options | Description | Weighting Value | |
|---|---|---|---|---|
| Design speed or speed limit | Very high | V ≥ 100 km/h | 2 | |
| High | 70 < V < 100 km/h | 1 | ||
| Moderate | 40 < V ≤ 70 km/h | −1 | ||
| Low | V ≤ 40 km/h | −2 | ||
| Traffic volume | Motorways, multilane routes | Two lane routes | ||
| High | >65% of maximum capacity | >45% of maximum capacity | 1 | |
| Moderate | 35–65% of maximum capacity | 15–45% of maximum capacity | 0 | |
| Low | <35% of maximum capacity | <15% of maximum capacity | −1 | |
Table 2.
List of luminaires installed on streets.
| Segment | ELUMDAT File Describing Luminaire | Power |
|---|---|---|
| Piastowska | AMPERA MIDI 5068 48 Cree XP-G2 700 mA NW 351322 Flat Glass Extra Clear Smooth | 106 W |
| Nawojki | AMPERA MINI 5136 24 Cree XP-G2 700 mA NW 356642 Flat Glass Extra Clear Smooth | 55 W |
| Mickiewicza1 | AMPERA MIDI 5096 64 Cree XP-G2 700 mA NW 351332 Flat Glass Extra Clear Smooth | 139 W |
| Mickiewicza2 | AMPERA MIDI 5096 64 Cree XP-G2 700 mA NW 351332 Flat Glass Extra Clear Smooth | 139 W |
| Mickiewicza3 | AMPERA MAXI 5068 128 Cree XP- G2 500 mA NW 348482 Flat Glass Extra Clear Smooth | 198 W |
| Mickiewicza4 | AMPERA MIDI 5096 64 Cree XP-G2 700 mA NW 351332 Flat Glass Extra Clear Smooth | 139 W |
| Słowackiego1 | AMPERA MIDI 5096 64 Cree XP-G2 700 mA NW 351332 Flat Glass Extra Clear Smooth | 139 W |
| Słowackiego2 | AMPERA MIDI 5096 64 Cree XP-G2 700 mA NW 351332 Flat Glass Extra Clear Smooth | 139 W |
| Słowackiego3 | AMPERA MIDI 5096 64 Cree XP-G2 700 mA NW 351332 Flat Glass Extra Clear Smooth | 139 W |
| Słowackiego4 | AMPERA MIDI 5096 64 Cree XP-G2 700 mA NW 351332 Flat Glass Extra Clear Smooth | 139 W |
Table 3.
Normal lighting class assigned to the streets.
| Street | 2014 Lighting Class | 2004 Lighting Class |
|---|---|---|
| Piastowska | M4 | ME4b |
| Nawojki | M3 | ME3c |
| Mickiewicza | M2 | ME2 |
| Słowackiego | M2 | ME2 |
Table 4.
Energy consumption change after redesigning to 2014 standard.
| Street | Power Consumption Change |
|---|---|
| Piastowska | +7.35% |
| Nawojki | −3.19% |
| Mickiewicza1 | 0% |
| Mickiewicza2 | 0% |
| Mickiewicza3 | +1.22% |
| Mickiewicza4 | 0% |
| Słowackiego1 | 0% |
| Słowackiego2 | 0% |
| Słowackiego3 | +1.37% |
| Słowackiego4 | +2.94% |
Table 5.
Energy consumption (in kWh) when redesigned and with added dynamic control.
| Street | CEN/TR 13201 2014 with Control | CEN/TR 13201 2014 Static | CEN/TR 13201 2004 with Control | CEN/TR 13201 2004 Static |
|---|---|---|---|---|
| Piastowska | 1615.714 | 2861.938 | 2267.119 | 2665.915 |
| Nawojki | 4257.996 | 7219.211 | 6560.463 | 7614.784 |
| Mickiewicza1 | 5686.712 | 9125.072 | 6881.598 | 9125.072 |
| Mickiewicza2 | 4347.843 | 7433.153 | 5550.173 | 7433.153 |
| Mickiewicza3 | 8482.795 | 13,500.531 | 11,249.126 | 13,337.874 |
| Mickiewicza4 | 5016.716 | 8969.787 | 6226.224 | 8969.787 |
| Słowackiego1 | 3550.696 | 6154.507 | 4410.118 | 6154.507 |
| Słowackiego2 | 2636.149 | 4462.046 | 3204.570 | 4462.046 |
| Słowackiego3 | 3335.755 | 5882.923 | 4097.561 | 5803.424 |
| Słowackiego4 | 2300.151 | 4233.572 | 2797.397 | 4112.612 |
© 2019 by the authors. Licensee MDPI, Basel, Switzerland. This article is an open access article distributed under the terms and conditions of the Creative Commons Attribution (CC BY) license (http://creativecommons.org/licenses/by/4.0/).
Share and Cite
MDPI and ACS Style
Wojnicki, I.; Komnata, K.; Kotulski, L. Comparative Study of Road Lighting Efficiency in the Context of CEN/TR 13201 2004 and 2014 Lighting Standards and Dynamic Control. Energies 2019, 12, 1524. https://doi.org/10.3390/en12081524
AMA Style
Wojnicki I, Komnata K, Kotulski L. Comparative Study of Road Lighting Efficiency in the Context of CEN/TR 13201 2004 and 2014 Lighting Standards and Dynamic Control. Energies. 2019; 12(8):1524. https://doi.org/10.3390/en12081524
Chicago/Turabian StyleWojnicki, Igor, Konrad Komnata, and Leszek Kotulski. 2019. "Comparative Study of Road Lighting Efficiency in the Context of CEN/TR 13201 2004 and 2014 Lighting Standards and Dynamic Control" Energies 12, no. 8: 1524. https://doi.org/10.3390/en12081524
Note that from the first issue of 2016, this journal uses article numbers instead of page numbers. See further details here.