Energy Analysis of 4625 Office Buildings in South Korea

1
Institute of Engineering Research, Seoul National University, Seoul 08826, South Korea
2
Department of Architecture and Architectural Engineering, College of Engineering, Seoul National University, Seoul 08826, South Korea
3
Department of Architecture and Architectural Engineering, Institute of Construction and Environmental Engineering, Institute of Engineering Research, College of Engineering, Seoul National University, Seoul 08826, South Korea
*
Author to whom correspondence should be addressed.
Energies 2019, 12(6), 1114; https://doi.org/10.3390/en12061114
Submission received: 18 February 2019
/
Revised: 16 March 2019
/
Accepted: 20 March 2019
/
Published: 22 March 2019
(This article belongs to the Section G: Energy and Buildings)
Abstract
:The purpose of the present study was to investigate the relevance of building thermal performance and characteristics to building energy consumption. This paper reports an energy analysis of 4625 office buildings in Seoul, South Korea, using data from the Korean national building energy database and architectural database. The following four research questions were investigated: (1) Do old buildings consume more energy than new ones? (2) Have strict prescriptive building energy codes contributed to the reduction in energy use intensity (EUI, kWh/m2·year) over the past several decades? (3) What are the characteristics of building energy consumption in terms of season, age, and cooling system (electric chiller vs absorption chiller)? (4) Which factors in the Korean building energy database are relevant to building energy consumption? The analyses revealed that, contrary to common assumptions, new buildings did not always consume less energy than old buildings, and it may be wrong to attribute intensification of prescriptive building energy codes directly to building energy efficiency improvements. In addition, the building characteristics (i.e., district, year built, number of floors, number of elevators, and total floor area) available in the Korean building energy database do not adequately explain building energy consumption, and the existing data collection method needs further improvement.
1. Introduction
The energy consumed by existing buildings accounts for more than 30% of global energy use [1]. Given that the replacement rate of existing buildings by new buildings is only about 1.0–3.0% per annum [1], the building sector is expected to continue to be a major energy consumer in the coming decades [2]. Therefore, retrofitting existing older buildings is an important measure to reduce energy consumption in the building sector.
To improve the energy efficiency of existing buildings, a number of building energy codes, policies, and certifications have been developed during the past several decades, including LEED [3] and Energy Star [4] in the United States, BREEAM [5] in the United Kingdom, Energy Performance Certificate [6] in the European Union, and HK-BEAM [7] in Hong Kong. In addition, the International Energy Agency (IEA) has conducted several projects to improve the energy efficiency of existing buildings, including IEA Annex 46 [8], IEA Annex 50 [9], IEA Annex 55 [10], and IEA Annex 56 [11]. In parallel, various energy saving technologies have been developed, including high-performance windows, airtight building envelopes, efficient chillers and boilers, and advanced controls. Based on the intensification of building codes and certifications and use of improved energy saving technologies developed during the past decades, it is generally believed that new buildings have much better thermal performance, and thus use less energy, than older buildings.
To capture the energy use profiles of existing buildings, a number of large-scale databases of energy consumption for existing buildings have been published recently [12,13,14,15,16,17,18,19,20,21]. Examples in the United States, which are maintained by federal or state governments, include the Building Performance Database (BPD) [12], Commercial Building Energy Consumption Survey [13], Residential Energy Consumption Survey [14], and California Energy End-Use Survey [15]. Of these, the United States Department of Energy’s BPD [12] contains measurement data for over 750,000 existing commercial and residential buildings. The BPD has several mandatory data fields (e.g., location, building type, and energy use) but also accepts other records, with more than 350 available data fields, as specified in the Building Energy Data Exchange Specification [16]. Additional data fields include information on building systems, operation, and measured energy use at sampling times of 15 min, 1 h, and 24 h [17]. The BPD provides peer group analysis that compares a building’s energy use to other similar buildings in the building stock [17]. A multivariate linear regression model is also employed to estimate the expected reduction in energy use intensity (EUI) due to changes in operating hours, the number of occupants, U-values of walls, lighting, and climate zone [17]. Furthermore, as part of the European Union, the European Commission developed the EU Building Stock Observatory [18] to monitor buildings’ thermal performance and the impact on actual energy consumption within the building sector. The EU Building Stock Observatory includes over 250 indicators grouped within ten thematic areas, such as building stock characteristics, building renovation, zero-energy buildings, energy consumption, building shell performance, technical building systems, certification, financing, energy poverty, and energy market [19].
The Korean government provides two separate databases through the publicly available building data system: a building energy database and an architectural database [20]. The building energy database records building addresses and monthly electric and gas energy consumption. Meanwhile, the architectural database records building addresses, building names, building usage, total floor area, number of floors, number of elevators, number of parking lots, and year built.
The purpose of the present study was to investigate the issues surrounding and knowledge gaps related to building energy performance in Korea. To investigate this topic, with a focus on the relevance of building thermal performance and characteristics (e.g., size, age, and heating/cooling source) to building energy consumption, four research questions were addressed: (1) Do older buildings consume more energy than newer buildings? (2) Have strict prescriptive building energy codes contributed to the reduction in EUI over the past several decades? (3) What are the characteristics of building energy consumption in terms of season, age, and cooling system (electric chiller versus absorption chiller)? (4) Which factors in the Korean building energy database are relevant to building energy consumption? To answer these questions, the building energy database and architectural database [20] were integrated based on the building address, a data field common to both databases, from which 4625 office buildings located in 25 districts in Seoul, South Korea, were selected for analysis (Figure 1). For the purpose of this study, energy consumption in the year 2015 was investigated.
2. Question #1: Do Old Buildings Consume More Energy than New Buildings?
First, the common assumption that old buildings consume more energy than new buildings was assessed. Figure 2 shows maps of the year built versus annual electric energy consumption per unit floor area (kWh/m2·year), annual gas energy consumption per unit floor area (kWh/m2·year), and annual total (electric + gas) on-site energy consumption per unit floor area (kWh/m2·year) of the 4625 investigated office buildings in Seoul, Korea. Notably, the green dots in Figure 2a represent buildings built in 1970 or even earlier and are concentrated in Junggu district, the old downtown of Seoul (see Figure 1). No apparent spatial correlations between annual electric, annual gas, and annual total energy consumption of buildings versus building age were observed (Figure 2a vs. Figure 2b–d).
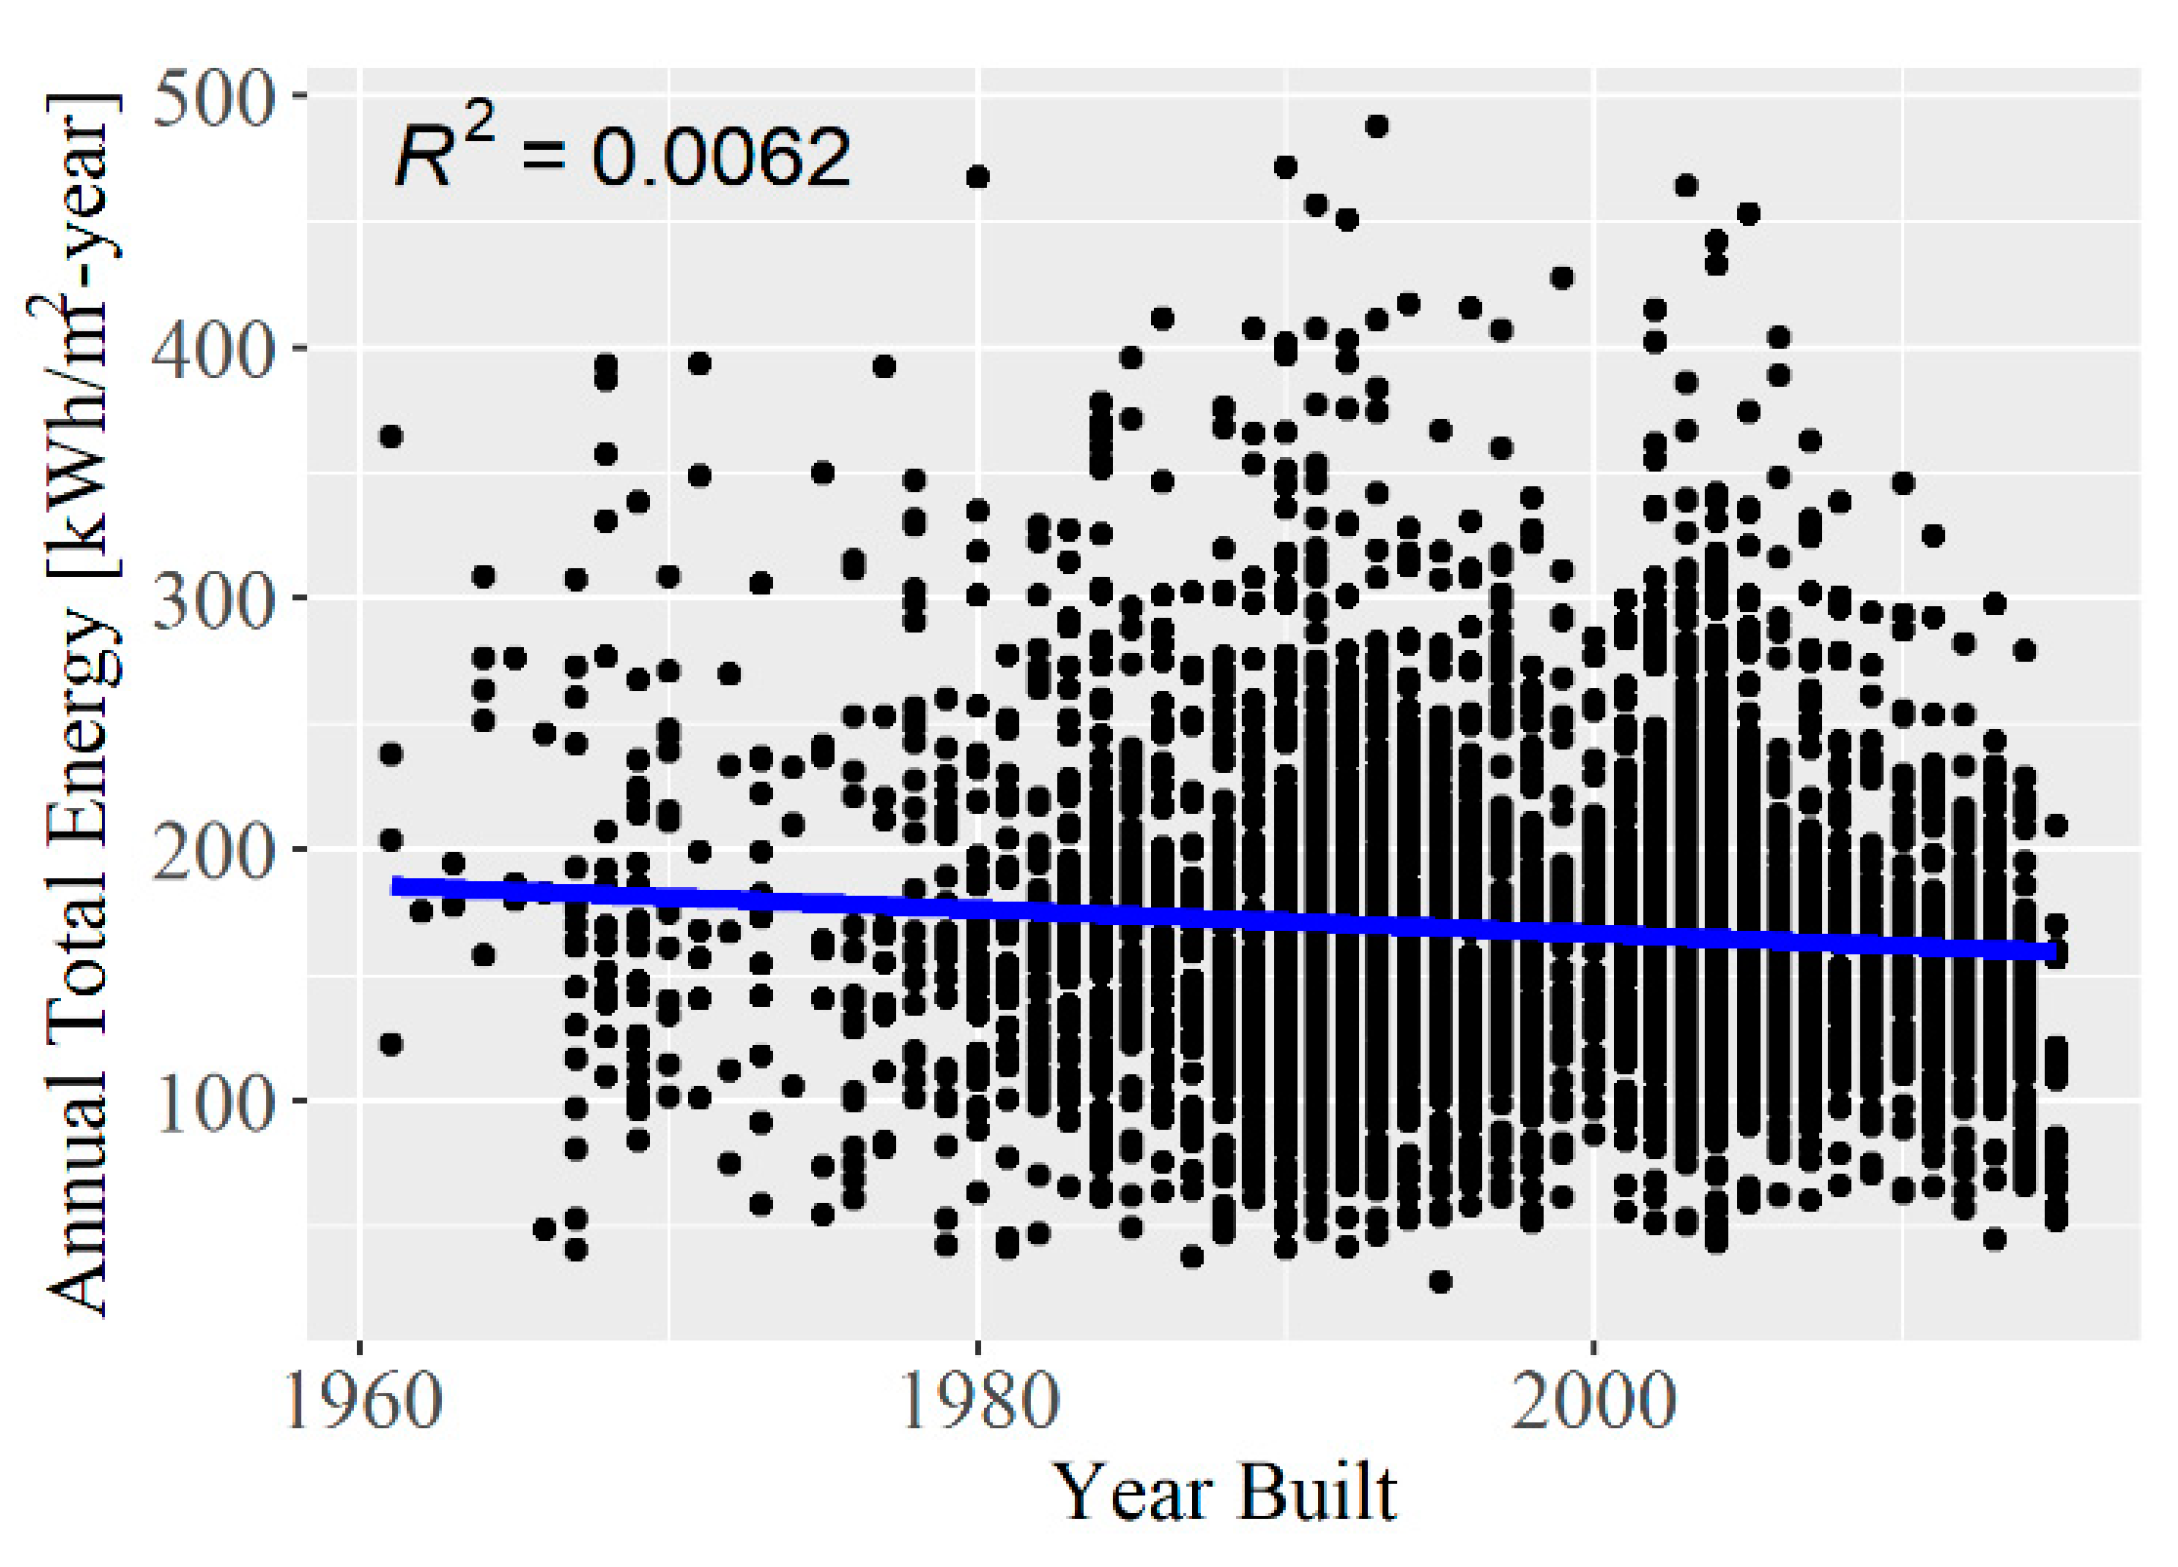
The mean year built of Junggu district was 1986, 11 years older than the mean year built (1997) of the 4625 office buildings undertaken in the present study (Table 1). No notable relationship between building age and annual building energy consumption could be discerned (Figure 2 and Table 1). For example, the 50th quantiles of year built for buildings in the Junggu district and Gangnam district were 1986 and 1995, respectively, although they had similar annual total energy consumptions (Junggu: 170 kWh/m2·year; Gangnam: 165 kWh/m2·year) (Table 1). By contrast, Eunpyeong and Gwanak districts, which contained the highest concentrations of newly built office buildings, shared identical mean and quantile values for year built (Table 1) but differed markedly in terms of annual total energy building consumption at the 50th quantile (Eunpyeong: 157 kWh/m2·year; Gwanak: 177 kWh/m2·year). In addition, the annual total energy consumption of buildings in Gwanak (50th quantile of year built: 2003) was 7 kWh/m2·year greater than that of Junggu (50th quantile of year built: 1986). These findings contradict the common assumption that the thermal performance, and thus energy efficiency, of new buildings is better than that of old buildings. Finally, Figure 3 presents the relationships between the year built and annual total energy consumption of office buildings by district in Seoul. As indicated in the coefficients of determination (R2), building age and annual total energy consumption showed poor correlations, ranging from 0.00019 (Yangcheon) to 0.13 (Jungnang) (Figure 3), in agreement with the data presented in Figure 2 and Table 1.
It is a widely accepted belief that newer buildings should have improved thermal performance owing to the use of newer energy-efficient materials and technologies (e.g., high-resistance insulation materials, building envelopes with better U-values, efficient cooling and heating systems, sophisticated controls, etc.) and, thus, should consume less energy. However, our findings indicated that the annual total EUI (kWh/m2·year) of new buildings was not always lower than that of old buildings, which contributed to the low R2 values.
3. Question #2: Have Strict Prescriptive Building Energy Codes Contributed to a Reduction in EUI over the Past Several Decades?
A number of prescriptive building energy codes have been enacted in South Korea since the 1980s, including building energy design standards [21], the energy performance index (EPI) [21], and the building energy use calculation for the Energy Performance Certificate [22]. Moreover, building energy design standards have been written in a prescriptive language to target architectural design (e.g., U-values for walls, roofs, and windows, airtightness of building envelopes), mechanical system design (e.g., insulation for ducts and pipes, installation of certified energy efficient pumps/fans), and electrical system design (e.g., installation of efficient lighting) [21]. The EPI is calculated based on 50 evaluation items with respect to architectural, mechanical, electrical, and renewable energy systems. The EPI score, which is the sum of credits from each evaluation item, must be greater than the reference value designated by the Korean Ministry of Land, Infrastructure and Transport. As shown in Table 2, building energy design standards have been intensified over time; only data on exterior building envelopes since 1992 are included as a representative example. However, such intensification of prescriptive codes for the thermal performance of building envelopes (Table 2) does not appear to have contributed to reductions in EUI (Figure 2, Figure 3 and Figure 4, Table 1). In light of this observation, it appears as though “blind belief” or “confirmation bias” has attributed the intensified prescriptive building energy codes (Table 2) directly to building energy efficiency improvements. Alternatively, it can be understood as a rebound effect. However, this needs further investigation with regard to thermal comfort and energy use in new and old buildings [23,24,25].
4. Question #3: What Are the Characteristics of Building Energy Consumption in Terms of Season, Age, and Cooling System?
The subsequent analysis aimed to investigate the relationships among building energy use, cooling system, building age, and energy source (e.g., electricity, gas). This analysis was performed via the following five steps:
- Step 1: Formulate two vectors of monthly electricity use (Ee,m) and monthly gas use (Eg,m), per building, where m = 1, 2,…, 12, representing the 12 months of the year.
- Step 2: Determine the electric and gas base energy (), respectively, where are defined as the minimum values of and , respectively. In other words, the electric and gas base energy are the lowest monthly electric and gas energy consumption amounts within a 12-month period, respectively. The base energies are assumed to represent plug load, lighting, elevators, etc. and are exclusive of heating and cooling energy.
- Step 3: Monthly cooling/heating electric energy () is defined as the difference between monthly electric energy consumption () and electric base energy (). Similarly, monthly cooling/heating gas energy () is defined as the difference between monthly gas energy consumption () and gas base energy ().
- Step 4: Because the Korean national building energy database does not include information on the type of chiller (electric versus absorption), the authors estimated the dominant cooling system per building based on the monthly gas energy consumption pattern (see panel (1) in Figure 5). If gas energy consumption during the cooling season (June to September) ( ) is greater than the median monthly gas energy consumption () over an entire year, building cooling is predominantly supported by absorption chiller(s). Otherwise, the dominant cooling system is assumed to be electric chiller(s). Based on the aforementioned assumption, the dominant cooling systems of 4625 office buildings were identified as shown in Figure 6 and Figure 7. For those buildings whose cooling was dominantly supported by electrical chillers, gas energy use from June to September was lower than in other months (Figure 6b) because gas was mainly used for domestic hot water in the heating season. In contrast, for buildings whose dominant cooling system was absorption chillers, gas energy consumption from June to September was far greater than in other months (Figure 7b). Although this provided a crude estimate, the results appeared to be reasonably acceptable for office buildings.
- Step 5: The authors categorized 4625 buildings into three groups based on the quantiles of the building ages of the 4625 investigated buildings: Vintage 1, 25% quantile (building age less than 15 years); Vintage 2, 25–75% quantile (15–29 years); and Vintage 3, 75% quantile (older than 29 years) (see panel (6) in Figure 5).
Figure 8 and Figure 9 show boxplots of monthly cooling and heating energy (, ) and monthly total energy () consumption for 3098 buildings with electric chillers as the dominant cooling system (Figure 8) and 1527 buildings with absorption chillers as the dominant cooling system (Figure 9). Table 3 shows the monthly cooling and heating energy (, which is the sum of the monthly electric and gas energy (Figure 8 and Figure 9) and the base energy ().
For buildings with electric chillers (3908 buildings), the monthly electric energy consumption () was proportional to building age (Vintage 3 > Vintage 2 > Vintage 1) (Figure 8a). In contrast, the relationship between monthly gas energy consumption () and building age was not proportional to building age (Figure 8b). The sum of monthly cooling and heating energy consumption followed the order of Vintage 2 (80.4 kWh/m2) > Vintage 1 (77.8 kWh/m2) > Vintage 3 (70.5 kWh/m2) (Table 3). However, the total base energy () of the three age groups followed the order of Vintage 3 (102.1 kWh/m2) > Vintage 2 (83.0 kWh/m2) > Vintage 1 (76.8 kWh/m2) (Table 3); in particular, that of Vintage 3 was substantially larger than those of the other vintages.
In contrast to Figure 8a, monthly electric energy use () for buildings with absorption chillers (1527 buildings) varied minimally (Figure 9a). The median monthly gas energy () followed the order of Vintage 2 > Vintage 3 > Vintage 1 (Figure 9b). Therefore, the average annual cooling and heating energy consumption () followed the order of Vintage 2 (90.0 kWh/m2) > Vintage 3 (88.2 kWh/m2) > Vintage 1 (77.2 kWh/m2) (Table 3). Similar to buildings predominantly cooled by electric chillers, the annual base energy () of Vintage 3 (126.0 kWh/m2) was substantially greater than those of the other vintages (101.4 kWh/m2 for both Vintage 1 and Vintage 2) (Table 3).
The annual sum of the total monthly energy consumption () increased proportionally with age group due to the increase in annual base energy (), not due to the annual sum of cooling and heating energy () (Table 3). Moreover, it was difficult to identify any relationship between building age and the annual sum of the cooling and heating energy consumption (). In the case of electric chiller buildings, the maximum difference in the annual sum of cooling and heating energy consumption () among age groups was only 9.9 kW/m2 (80.4 kW/m2 (Vintage 2) − 70.5 kW/m2 (Vintage 3)). However, the difference in the annual base energy () between Vintage 3 and Vintage 1 was 25.3 kW/m2 (= 102.1 kW/m2 − 76.8 kW/m2), and that of Vintage 3 and Vintage 2 was 19.1 kW/m2 (= 102.1 kW/m2 − 83.0 kW/m2). For absorption chiller buildings, the relationships between building age and the annual sum of the cooling and heating energy () showed weaker relationships than those for electric chiller buildings. In particular, the weak proportionality between building age and annual total energy consumption () was driven by the annual base energy. Overall, the results indicated a general lack of relationship between cooling and heating energy () and building age.
Figure 10 presents the correlations of total monthly energy, annual sum of monthly cooling, and heating energy, and the base energy is presented as scatter plots, histograms, and Gaussian kernel density estimates. Gaussian kernel density estimation was introduced to represent the probability density with correlation coefficients (R2) for the annual sums of monthly total monthly energy consumption (), monthly cooling and heating energy consumption (), electric cooling and heating energy consumption (), and gas cooling and heating energy consumption (), as well as base energy consumption (), electric base energy consumption (), and gas base energy consumption ().
The annual sum of the monthly total energy consumption () and base energy () showed the strongest correlation (R2 = 0.87), within which the base energy () was more correlated with electric base energy consumption () (R2 = 0.88) than with the gas base energy consumption () (R2 = 0.70). Meanwhile, the annual sum of the monthly cooling and heating energy consumption () was not strongly correlated with the base energy, including (R2 = 0.26), (R2 = 0.11), and (R2 = 0.35). As found in the earlier analyses, the annual sum of the monthly total energy consumption was more strongly related to base energy rather than to heating and cooling energy. In addition, no strong correlation between the base energy and the heating and cooling energy was identified. It is a common assumption that the annual energy of a building is related to the energy consumed for heating and cooling. However, according to these findings, it can be inferred that the annual sum of the monthly total energy consumption in office buildings is more influenced by base energy than by heating and cooling energy.
5. Question #4: Which Factors in the Korean Building Energy Database are Relevant to Building Energy Consumption?
The authors analyzed the correlations between building energy consumption and various building characteristics (e.g., district, year built, number of floors, number of elevators, and total floor area) available in the Korean building energy database. Even though some factors (e.g., number of elevators) were unlikely to be relevant to total building energy use, all factors provided in the Korean building energy database were assessed.
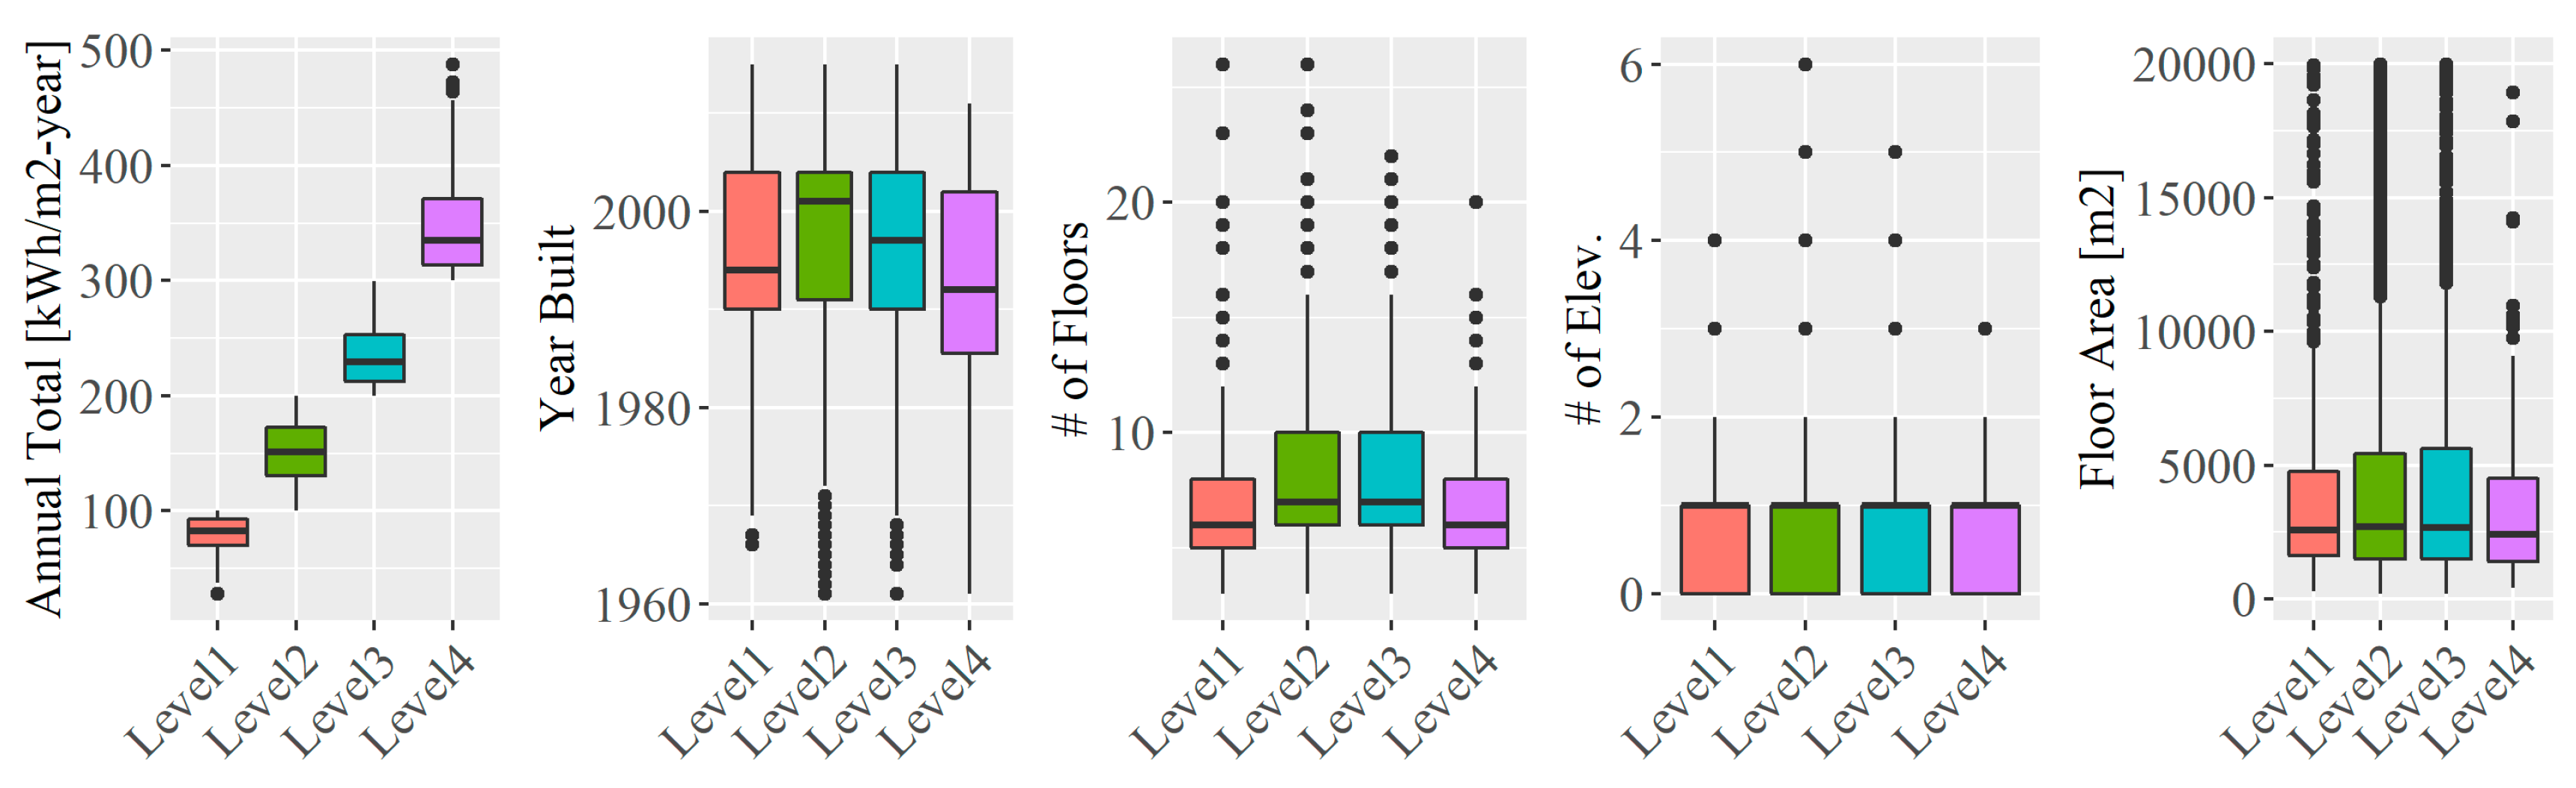
Figure 11 shows the relationships between the annual sum of monthly total energy consumption () versus the aforementioned building characteristics as scatter plots, distributions, and correlation coefficients. To investigate the relevance of energy use intensity to the building characteristics, annual total energy consumption () was classified into four levels: 0–100 kWh/m2 (represented in red in Figure 11), 100–200 kWh/m2 (green), 200–300 kWh/m2 (blue), and >300 kWh/m2 (violet). The four levels of annual total energy consumption () were evenly distributed in the scatter plots (Figure 11). However, the four distributions were not readily distinguished with regard to the four levels of annual total energy consumption () (Figure 11). The R2 values indicated near-negligible relationships of energy consumption with the building characteristics, and the variations in the R2 values with regard to the energy use levels were marginal. In other words, there appeared to be no distinct relationships between annual total energy consumption () and the district, year built, number of floors, number of elevators, and floor area. Figure 12 shows boxplots of annual total energy consumption (), year built, number of floors, number of elevators, and total floor area with regard to the four levels of annual total energy consumption (), and Table 4 presents the related descriptive statistics. Similar to Figure 11, no meaningful correlations were evident between the annual total energy consumption and year built, number of floors, number of elevators, and total floor area. This reveals that the building characteristics contained in the Korean building energy database should be improved accordingly, such as by including indoor temperatures, operational hours, plug load densities (lighting, equipment, W/m2), building orientation, window-to-wall ratios, shades, and controls of heating and cooling systems.
6. Conclusions
This study investigated energy use by office buildings in Seoul Korea using data from 4625 office buildings (Seoul, South Korea) extracted from the Korean national building energy database and architectural database. Using these data, four research questions were investigated: (1) Do old buildings consume more energy than new buildings? (2) Have strict prescriptive building energy codes contributed to the reduction in EUI over the past several decades? (3) What are the characteristics of the building energy consumption in terms of season, vintage, and cooling system? (4) Which factors in the Korean building energy database are relevant to building energy consumption?
The major findings of this study are summarized as follows:
- In contrast to the common assumption that newer buildings consume less energy in terms of EUI (kwh/m2.year) than do old buildings, the office building age in Seoul, Korea, showed a near-negligible relationship with EUI (R2 of building age versus EUI by district: 0.00019–0.13).
- Korean building energy codes have been intensified since the 1980s. However, the prescriptive building energy codes do not appear to have contributed to building energy reductions. Therefore, “blind belief” or “confirmation bias” appears to have attributed the intensification of prescriptive building energy codes directly to building energy efficiency improvements. Alternatively, it can be understood as a rebound effect. However, this needs further investigation with regard to thermal comfort and energy use in new and old buildings.
- The annual sum of the monthly total energy consumption is more correlated to base energy (e.g., energy used for plug load, lighting, and elevators, exclusive of heating and cooling energy) than to heating and cooling energy. In other words, the greater EUI is the result of greater base energy.
- The building factors (i.e., district, year built, number of floors, number of elevators, and total floor area) currently provided in the Korean building energy database do not adequately explain annual total energy consumption. Therefore, more meaningful information (e.g., net floor area, building orientation, window-to-wall ratios, U-values of building envelopes, operational hours, indoor temperatures, shades, and controls of heating and cooling systems) should be included in the database.
A recent important issue highlighted in building energy performance analyses is the performance gap [26], i.e., the difference between the expected simulation result and actual energy use. Because building energy simulation models are not sufficient to explain actual building energy consumption, building energy databases can represent a good source of empirical data to clarify causality between building energy use and influencing factors. Based on the present findings, the Korean building energy database contains insufficient information for investigating causality and should be redesigned to include more comprehensive information related to building energy consumption.
Author Contributions
K.U.A., H.S.S. and C.S.P. analyzed the data and described the issues presented in this paper.
Funding
This research received no external funding.
Acknowledgments
This research was supported by Institute of Construction and Environmental Engineering at Seoul National University. The authors wish to express their gratitude for the support. The Institute of Engineering Research at Seoul National University provided research facilities for this work.
Conflicts of Interest
The authors declare no conflict of interest.
References
- Wu, Z.; Wang, B.; Xia, X. Large-scale building energy efficiency retrofit: Concept, model and control. Energy 2016, 109, 456–465. [Google Scholar] [CrossRef] [Green Version]
- Liu, W.; Zhang, J.; Bluemling, B.; Mol, A.P.J.; Wang, C. Public participation in energy saving retrofitting of residential buildings in China. Appl. Energy 2015, 147, 287–296. [Google Scholar] [CrossRef]
- LEED. Available online: https://new.usgbc.org/leed (accessed on 23 January 2019).
- Energy Star. Available online: https://www.energystar.gov (accessed on 23 January 2019).
- BREEAM. Available online: https://www.breeam.com (accessed on 23 January 2019).
- E.U. Energy Performance Certificate. Available online: https://ec.europa.eu/energy/en/topics/energy-efficiency/buildings/certificates-and-inspections (accessed on 23 January 2019).
- HK-BEAM. Available online: https://www.beamsociety.org.hk (accessed on 23 January 2019).
- Annex 46, Holistic assessment tool-kit on energy efficient retrofit measures for government buildings. Available online: www.annex46.de/index_e.html (accessed on 23 January 2019).
- Annex 50, Prefabricated systems for low energy renovation of residential buildings. Available online: www.buildup.eu/en/explore/links/iea-ecbcs-annex-50-prefabricated-systems-low-energy-renovation-residential-buildings (accessed on 23 January 2019).
- Annex 55, Reliability of energy efficient building retrofitting-probability assessment of performance & cost. Available online: https://nachhaltigwirtschaften.at/en/iea/technologyprogrammes/ebc/iea-ebc-annex-55.php (accessed on 23 January 2019).
- Annex 56, Cost-effective energy and carbon emission optimizing in building renovation. Available online: http://www.iea-annex56.org (accessed on 23 January 2019).
- U.S. Department of Energy, Building Performance Database. Available online: https://energy.gov/eere/buildings/building-performance-database (accessed on 23 January 2019).
- U.S. Energy Information Administration, Commercial Building Energy Consumption Survey. Available online: https://www.eia.gov/consumption/commercial (accessed on 23 January 2019).
- U.S. Energy Information Administration, Residential Energy Consumption Survey. Available online: https://www.eia.gov/consumption/residential (accessed on 23 January 2019).
- California Energy End-Use Survey. Available online: https://www.energy.ca.gov/ceus (accessed on 23 January 2019).
- U.S. Department of Energy, Building Energy Data Exchange Specification. Available online: https://www.energy.gov/eere/buildings/building-energy-data-exchange-specification-bedes (accessed on 23 January 2019).
- Brown, R.E.; Walter, T.; Dunn, L.N.; Custodio, C.Y.; Mathew, P.A.; Berkeley, L. Getting real with energy data: Using the buildings performance database to support data-driven analyses and decision-making. In Proceedings of the ACEEE summer study on energy efficiency in buildings, Pacific Grove, CA, USA, 17 August 2014. [Google Scholar]
- E.U. Building Stock Observatory. Available online: https://ec.europa.eu/energy/en/eubuildings (accessed on 23 January 2019).
- Arcipowska, A.; Mariottini, F. Role of the EU building stock observatory in evaluation of the building policies. In Proceedings of the International Energy Policy & Programme Evaluation Conference, Amsterdam, The Netherlands, 7 June 2016. [Google Scholar]
- Building data public open system. Available online: http://open.eais.go.kr (accessed on 23 January 2019). (In Korean).
- KEMCO. Available online: http://www.kemco.or.kr/web/kem_home_new/ener_efficiency/building_03.asp (accessed on 23 January 2019). (In Korean).
- Park, D.J.; Yu, K.H.; Yoon, Y.S.; Kim, K.H.; Kim, S.S. Analysis of a Building Energy Efficiency Certification System in Korea. Sustainability 2015, 7, 16086–16107. [Google Scholar] [CrossRef] [Green Version]
- Galvin, R. Making the ’rebound effect’ more useful for performance evaluation of thermal retrofits of existing homes: Defining the ’energy savings deficit’ and the ’energy performance gap’. Energy Build. 2014, 69, 515–524. [Google Scholar] [CrossRef]
- Sunikka-Blank, M.; Galvin, R. Introducing the prebound effect: The gap between performance and actual energy consumption. Build. Res. Inf. 2012, 40, 260–273. [Google Scholar] [CrossRef]
- Guerra Santin, O. Occupant behavior in energy efficient dwellings: Evidence of a rebound effect. J. Hous. Built. Environ. 2013, 28, 311–327. [Google Scholar] [CrossRef]
- de Wilde, P. The gap between predicted and measured energy performance of buildings: A framework for investigation. Automat. Constr. 2014, 41, 40–49. [Google Scholar] [CrossRef]
Figure 1.
Questions addressed in this study based on 4625 office buildings located in 25 districts in Seoul, Korea.
Figure 1.
Questions addressed in this study based on 4625 office buildings located in 25 districts in Seoul, Korea.

Figure 2.
Maps of the (a) year built, (b) annual electric energy consumption (kWh/m2·year), (c) annual gas energy consumption (kWh/m2·year), and (d) annual total (electric + gas) on-site energy consumption (kWh/m2·year) of 4625 office buildings in Seoul, Korea, for the year 2015. (The ggmap package on R was used).

Figure 3.
Scatter plots of year built versus annual total energy consumption by district in Seoul, Korea, in 2015. (The ggplot2 package on R was used).
Figure 3.
Scatter plots of year built versus annual total energy consumption by district in Seoul, Korea, in 2015. (The ggplot2 package on R was used).

Figure 4.
Relationship between year built versus annual total energy consumption of 4625 office buildings in Seoul, Korea. (The ggplot2 package on R was used).
Figure 4.
Relationship between year built versus annual total energy consumption of 4625 office buildings in Seoul, Korea. (The ggplot2 package on R was used).

Figure 5.
Monthly energy use analysis and categorization of building age and chilling system. The subscript m represents the month (January to December) from 1 to 12.
Figure 5.
Monthly energy use analysis and categorization of building age and chilling system. The subscript m represents the month (January to December) from 1 to 12.

Figure 6.
Monthly (a) electric energy use (Ee,m) and (b) gas energy use (Eg,m) for buildings with electric chillers as the dominant cooling system (3098 out of 4625 buildings).
Figure 6.
Monthly (a) electric energy use (Ee,m) and (b) gas energy use (Eg,m) for buildings with electric chillers as the dominant cooling system (3098 out of 4625 buildings).

Figure 7.
Monthly (a) electric energy use (Ee,m) and (b) gas energy use (Eg,m) for buildings with absorption chillers as the dominant cooling system (1527 out of 4625 buildings).
Figure 7.
Monthly (a) electric energy use (Ee,m) and (b) gas energy use (Eg,m) for buildings with absorption chillers as the dominant cooling system (1527 out of 4625 buildings).

Figure 8.
Boxplots showing the monthly (a) electric energy consumption (), (b) gas energy consumption (), and (c) total energy consumption () of buildings predominantly cooled using electric chillers (n = 3908). (Boxplot in MATLAB was used).
Figure 8.
Boxplots showing the monthly (a) electric energy consumption (), (b) gas energy consumption (), and (c) total energy consumption () of buildings predominantly cooled using electric chillers (n = 3908). (Boxplot in MATLAB was used).


Figure 9.
Boxplots showing the monthly (a) electric energy consumption (), (b) gas energy consumption (), and (c) total energy consumption () of buildings predominantly cooled using absorption chillers (n = 1527). (Boxplot in MATLAB R2018b was used).
Figure 9.
Boxplots showing the monthly (a) electric energy consumption (), (b) gas energy consumption (), and (c) total energy consumption () of buildings predominantly cooled using absorption chillers (n = 1527). (Boxplot in MATLAB R2018b was used).


Figure 10.
Correlations between the annual sum of total monthly energy, annual sum of monthly cooling and heating energy, and base energy (unit: kWh/m2·year) shown as Gaussian kernel densities, histograms, and scatter plots. (Python library seaborn was used).
Figure 10.
Correlations between the annual sum of total monthly energy, annual sum of monthly cooling and heating energy, and base energy (unit: kWh/m2·year) shown as Gaussian kernel densities, histograms, and scatter plots. (Python library seaborn was used).

Figure 11.
Scatter plot matrix, distributions, and correlation coefficients between building characteristics available in the Korean building energy database: district (an index of the 25 districts in Seoul), year built, number of floors, number of elevators, and floor area. (The ggplot2 package on R was used).

Figure 12.
Boxplots of annual total building energy with respect to building characteristics in Seoul, Korea. (The ggplot2 package on R was used).
Figure 12.
Boxplots of annual total building energy with respect to building characteristics in Seoul, Korea. (The ggplot2 package on R was used).


Table 1.
Descriptive statistics of year built and annual energy consumption of 4625 office buildings in the 25 districts of Seoul, Korea, in 2015.
Table 1.
Descriptive statistics of year built and annual energy consumption of 4625 office buildings in the 25 districts of Seoul, Korea, in 2015.
| District | Number of Buildings | Year Built | Annual Total (Electric + Gas)Energy Consumption [kWh/m2·year] | ||||||||
|---|---|---|---|---|---|---|---|---|---|---|---|
| Quantile | Mean | Standard Deviation | Quantile | Mean | Standard Deviation | ||||||
| 25th | 50th | 75th | 25th | 50th | 75th | ||||||
| Dobong | 45 | 1996 | 2003 | 2005 | 2001 | 7 | 125 | 152 | 174 | 152 | 44 |
| Dongdaemun | 77 | 1987 | 1994 | 2004 | 1996 | 11 | 104 | 138 | 165 | 139 | 50 |
| Dongjak | 45 | 1990 | 1997 | 2003 | 1997 | 10 | 139 | 170 | 203 | 178 | 66 |
| Eunpyeong | 106 | 2002 | 2003 | 2004 | 2002 | 8 | 135 | 157 | 185 | 161 | 44 |
| Gangbook | 52 | 1990 | 1997 | 2003 | 1996 | 10 | 132 | 153 | 193 | 161 | 52 |
| Gangdong | 104 | 1992 | 1998 | 2004 | 1998 | 8 | 128 | 154 | 193 | 167 | 71 |
| Gangseo | 188 | 1997 | 2002 | 2004 | 2001 | 7 | 126 | 149 | 175 | 152 | 46 |
| Gangnam | 1024 | 1991 | 1995 | 2004 | 1997 | 9 | 129 | 165 | 209 | 176 | 66 |
| Geumcheon | 61 | 1996 | 2004 | 2007 | 2001 | 10 | 111 | 155 | 195 | 155 | 57 |
| Guro | 126 | 1991 | 2003 | 2008 | 2000 | 10 | 110 | 150 | 171 | 151 | 54 |
| Gwanak | 392 | 2002 | 2003 | 2004 | 2002 | 5 | 157 | 177 | 212 | 187 | 52 |
| Gwangjin | 96 | 1992 | 2000 | 2004 | 1999 | 9 | 113 | 143 | 169 | 150 | 60 |
| Jongro | 179 | 1983 | 1991 | 2002 | 1991 | 12 | 136 | 167 | 203 | 173 | 56 |
| Junggu | 282 | 1971 | 1986 | 1999 | 1986 | 15 | 132 | 170 | 217 | 179 | 70 |
| Jungnang | 43 | 1996 | 2003 | 2004 | 2000 | 7 | 139 | 166 | 189 | 162 | 46 |
| Mapo | 260 | 1991 | 2002 | 2004 | 1998 | 9 | 131 | 161 | 191 | 165 | 54 |
| Nowon | 54 | 1990 | 2000 | 2004 | 1998 | 7 | 131 | 164 | 205 | 178 | 69 |
| Seocho | 578 | 1991 | 1994 | 2003 | 1996 | 8 | 126 | 158 | 201 | 171 | 63 |
| Seodaemun | 70 | 1992 | 2003 | 2005 | 1999 | 10 | 130 | 160 | 198 | 167 | 58 |
| Seongbuk | 96 | 1988 | 2000 | 2004 | 1996 | 13 | 132 | 160 | 190 | 164 | 52 |
| Seongdong | 92 | 1990 | 1998 | 2006 | 1998 | 11 | 116 | 143 | 180 | 152 | 60 |
| Songpa | 240 | 1991 | 1994 | 2003 | 1996 | 7 | 130 | 157 | 195 | 166 | 62 |
| Yangcheon | 78 | 1996 | 2002 | 2004 | 2001 | 7 | 86 | 119 | 171 | 130 | 54 |
| Yeongdeungpo | 285 | 1991 | 2001 | 2005 | 1998 | 10 | 121 | 149 | 180 | 155 | 53 |
| Yongsan | 92 | 1988 | 1994 | 2004 | 1995 | 11 | 127 | 149 | 188 | 164 | 61 |
| Total (Seoul) | 4625 | 1991 | 1998 | 2004 | 1997 | 10 | 128 | 160 | 198 | 168 | 61 |
Table 2.
Changes to prescriptive building energy codes with regard to non-residential building envelopes (Seoul, South Korea).
Table 2.
Changes to prescriptive building energy codes with regard to non-residential building envelopes (Seoul, South Korea).
| Building Envelopes | Year | W/m2·K |
|---|---|---|
| U-values of exterior walls | 1992 | 0.58 |
| 2001 | 0.47 | |
| 2010 | 0.36 | |
| 2013 | 0.27 | |
| U-values of exterior windows | 2001 | 3.84 |
| 2008 | 3.40 | |
| 2010 | 2.40 | |
| 2013 | 2.10 |
Table 3.
Statistical data of cooling/heating energy and base energy (unit: kWh/m2).
| Dominant Cooling System | Building Age Group | Statistics | Base | Annual Total | |||||||||||||
|---|---|---|---|---|---|---|---|---|---|---|---|---|---|---|---|---|---|
| 1 | 2 | 3 | 4 | 5 | 6 | 7 | 8 | 9 | 10 | 11 | 12 | Sum | |||||
| Electric chiller | Vintage 1 | Median | 15.9 | 13.3 | 10.3 | 5.9 | 2.3 | 1.7 | 1.9 | 2.8 | 2.1 | 1.4 | 4.4 | 10.2 | 74.5 | 71.2 | 148.2 |
| Mean | 16.3 | 13.8 | 10.5 | 6.4 | 2.7 | 2.0 | 2.4 | 3.4 | 2.6 | 1.9 | 5.2 | 10.8 | 77.8 | 76.8 | 154.7 | ||
| Standard Deviation | 6.9 | 6.0 | 4.9 | 3.6 | 2.0 | 1.4 | 1.8 | 2.1 | 1.8 | 1.7 | 3.8 | 5.5 | 30.0 | 38.2 | 53.8 | ||
| Vintage 2 | Median | 17.1 | 14.5 | 10.8 | 6.3 | 2.1 | 1.7 | 2.1 | 3.1 | 2.3 | 1.3 | 3.6 | 9.7 | 78.8 | 71.6 | 156.4 | |
| Mean | 17.1 | 14.6 | 11.0 | 6.7 | 2.5 | 2.0 | 2.6 | 3.7 | 2.8 | 1.8 | 4.9 | 10.7 | 80.4 | 83.0 | 163.3 | ||
| Standard Deviation | 7.5 | 6.6 | 5.6 | 4.0 | 2.1 | 1.5 | 1.9 | 2.3 | 1.9 | 1.9 | 4.4 | 6.4 | 34.2 | 48.6 | 65.6 | ||
| Vintage 3 | Median | 13.7 | 11.1 | 7.9 | 3.8 | 1.0 | 2.0 | 3.3 | 4.4 | 3.1 | 0.9 | 2.5 | 7.7 | 65.5 | 86.1 | 154.5 | |
| Mean | 14.8 | 11.9 | 8.8 | 4.8 | 1.7 | 2.4 | 3.7 | 4.8 | 3.5 | 1.3 | 3.6 | 9.1 | 70.5 | 102.1 | 172.6 | ||
| Standard Deviation | 7.5 | 6.4 | 5.3 | 3.7 | 2.0 | 2.0 | 2.4 | 3.0 | 2.4 | 1.8 | 3.6 | 6.0 | 33.7 | 72.1 | 92.1 | ||
| Absorption chiller | Vintage 1 | Median | 11.0 | 9.4 | 6.0 | 3.1 | 0.8 | 3.3 | 6.2 | 7.8 | 6.0 | 1.9 | 1.8 | 5.5 | 67.9 | 90.4 | 165.9 |
| Mean | 12.1 | 10.6 | 7.1 | 4.7 | 1.7 | 4.2 | 7.3 | 9.0 | 7.7 | 3.3 | 2.7 | 6.7 | 77.2 | 101.4 | 178.6 | ||
| Standard Deviation | 8.1 | 7.7 | 5.9 | 5.2 | 2.7 | 3.8 | 5.3 | 6.1 | 5.9 | 3.6 | 3.2 | 4.8 | 43.6 | 74.2 | 97.1 | ||
| Vintage 2 | Median | 14.1 | 11.8 | 8.3 | 5.0 | 1.1 | 3.3 | 8.4 | 10.3 | 8.2 | 2.3 | 1.2 | 5.8 | 86.1 | 86.4 | 176.7 | |
| Mean | 14.7 | 12.5 | 8.9 | 5.8 | 1.8 | 4.5 | 9.0 | 11.0 | 9.3 | 3.4 | 2.1 | 7.0 | 90.0 | 101.4 | 191.4 | ||
| Standard Deviation | 6.8 | 6.8 | 5.4 | 5.0 | 2.8 | 3.8 | 5.4 | 5.9 | 5.9 | 3.5 | 2.7 | 4.8 | 41.5 | 77.3 | 96.3 | ||
| Vintage 3 | Median | 13.5 | 10.1 | 7.3 | 3.0 | 1.2 | 4.4 | 8.5 | 9.8 | 7.1 | 1.3 | 1.9 | 6.6 | 83.7 | 102.0 | 186.3 | |
| Mean | 14.1 | 11.3 | 8.3 | 5.0 | 2.4 | 5.6 | 9.0 | 10.5 | 8.0 | 2.8 | 3.0 | 8.3 | 88.2 | 126.0 | 214.2 | ||
| Standard Deviation | 7.7 | 6.9 | 5.9 | 5.6 | 3.5 | 4.6 | 6.0 | 6.4 | 5.9 | 3.7 | 3.5 | 6.6 | 47.6 | 107.9 | 132.7 | ||
Table 4.
Descriptive statistics of the data on annual total building energy with respect to building characteristics in Seoul, Korea.
Table 4.
Descriptive statistics of the data on annual total building energy with respect to building characteristics in Seoul, Korea.
| Data | Statistics | Level 1 0–100 kWh/m2·year | Level 2 100–200 kWh/m2·year | Level 3 200–300 kWh/m2·year | Level 4 > 300 kWh/m2·year |
|---|---|---|---|---|---|
| Annual total energy [kWh/m2·year] | Median | 82.6 | 151.4 | 229.3 | 335.1 |
| Mean | 80.1 | 151.4 | 234.9 | 347.0 | |
| Standard Deviation | 15.0 | 26.3 | 26.5 | 43.0 | |
| Year built | Median | 1994 | 2001 | 1997 | 1992 |
| Mean | 1996 | 1998 | 1996 | 1992 | |
| Standard Deviation | 11 | 10 | 10 | 11 | |
| Number of floors | Median | 6.0 | 7.0 | 7.0 | 6.0 |
| Mean | 7.2 | 8.3 | 8.2 | 6.8 | |
| Standard Deviation | 3.5 | 3.6 | 3.5 | 2.8 | |
| Number of elevators | Median | 1.0 | 1.0 | 1.0 | 1.0 |
| Mean | 0.7 | 0.9 | 0.9 | 0.7 | |
| Standard Deviation | 0.8 | 0.8 | 0.9 | 0.7 | |
| Total floor area [m2] | Median | 2563 | 2710 | 2675 | 2423 |
| Mean | 4214 | 4289 | 4284 | 3487 | |
| Standard Deviation | 4240 | 4205 | 4192 | 3150 |
© 2019 by the authors. Licensee MDPI, Basel, Switzerland. This article is an open access article distributed under the terms and conditions of the Creative Commons Attribution (CC BY) license (http://creativecommons.org/licenses/by/4.0/).
Share and Cite
MDPI and ACS Style
Ahn, K.U.; Shin, H.S.; Park, C.S. Energy Analysis of 4625 Office Buildings in South Korea. Energies 2019, 12, 1114. https://doi.org/10.3390/en12061114
AMA Style
Ahn KU, Shin HS, Park CS. Energy Analysis of 4625 Office Buildings in South Korea. Energies. 2019; 12(6):1114. https://doi.org/10.3390/en12061114
Chicago/Turabian StyleAhn, Ki Uhn, Han Sol Shin, and Cheol Soo Park. 2019. "Energy Analysis of 4625 Office Buildings in South Korea" Energies 12, no. 6: 1114. https://doi.org/10.3390/en12061114
Note that from the first issue of 2016, this journal uses article numbers instead of page numbers. See further details here.