Article

Strength Analysis of a PTO (Power Take-Off) Gear-Train of a Multi-Purpose Cultivator during a Rotary Ditching Operation

1
Department of Biosystems Machinery Engineering, Chungnam National University, Daejeon 34134, Korea
2
Convergence Agricultural Machinery Group, Korea Institute of Industrial Technology (KITECH), Gimje 54325, Korea
3
Korea Institute of Machinery &Materials (KIMM), Daegu 42994, Korea
4
Department of Rural & Bio-Systems Engineering, Chonnam National University, Gwangju 500-757, Korea
*
Author to whom correspondence should be addressed.
Energies 2019, 12(6), 1100; https://doi.org/10.3390/en12061100
Submission received: 8 February 2019 / Revised: 17 March 2019 / Accepted: 18 March 2019 / Published: 21 March 2019

Abstract

:
Optimal design of transmission gears is important to ensure product durability and reliability. This study measured a multi-purpose cultivator during a rotary ditching operation and analyzed the strength of the power take off (PTO) gear-train for the cultivator using analysis software (KISSsoft, KISSsoft AG—A Gleason Company, Bubikon, Switzerland) based on ISO 6336 standards and a modified Miner’s rule. A load measurement system was installed on the cultivator to measure the load on the PTO shaft. To measure the load on the PTO shaft, the load measuring system consisting of a data acquisition board (NI USB-6212, National Instruments, Austin, TX, USA) and a torque sensor was installed on the cultivator. Rotary ditching operations were conducted at two ground speeds and two PTO rotational speeds on a field with the same soil conditions. The measured load data were constructed using the rainflow-counting algorithm and the Smith-Watson-Topper equation. When the ground speed or PTO rotational speed increased, the average and maximum PTO torque increased significantly. The average measured torque ratio to rated torque of the PTO input shaft (19.6 Nm) was in the range of 50.1–105.9%. The simulation results using the actual measurement load indicated that the strength of the PTO gear-train tended to decrease with higher transmission gear stage and lower PTO gear stage except for the G2 and G3 gears. The simulation results of the safety factor for contact stress were lower than the minimum safety factor of ‘1.0’ at the T2P1 gear stage (G4 and G2). The simulation results of the fatigue life analysis showed fatigue life of less than service life (1000 h) at T2P2 (G2) and T2P1 (G2, G3, and G4). The simulation results indicate that there is a possibility of gear failure before service life at the T2P1 (G2, G3, and G4) and T2P2 (G2). It is known that the weak parts (G2, G3, and G4) should be the focus of design optimization through gear strength simulation to meet upward of a 1.0 safety factor and service life.

1. Introduction

In Korea, 42.7% of farmers were female in 2010, with an expected increase to 47.1% by 2050. On the other hand, farmers aged 65 years and over accounted for 6.7% of the total in Korea in 2010, and this percentage is expected to increase to 11.3% by 2050 in Korea [1]. With these demographic shifts, compact, easy-to-use machines are in continual demand on the worldwide agricultural market to accommodate female and elderly farmers. Multi-purpose cultivators are used in areas where farming mechanization using conventional machines is difficult, such as small plots of land and greenhouses. The overseas market for cultivators was $7.57 billion dollars in 2013, and is expected to reach $15.15 billion dollars in 2023 [2]. The agricultural market for cultivators is expected to steadily increase. Cultivators that operate using power take off (PTO) equipment are widely used for various field operations such as rotary ditching, plowing, and vinyl mulching. Given the increasing demand for such cultivators, they have been the subject of recent active research.
Park [3] concluded that the handle vibration of a walking type cultivator could be reduced by adding mass to the handle. This was determined by investigating nodal points of the handle vibration by an operational deflection shapes test to optimize the handle vibration. Sam [4] conducted experiments to measure vibration on walking and riding power tillers to assess the operator’s comfort. This paper addresses machine vibration, hand-transmitted vibration, and whole-body vibration during rototilling under various conditions. Chaturvedi [5] conducted experiments in three operational conditions, including transportation on farm roads, tilling with a cultivator, and tilling with a rotavator, in order to reduce the vibration of power tillers. The results show that the maximum vibration reductions were achieved with the rubber intervention in all three operational conditions. There are very few studies that have focused on the PTO gear-train of a cultivator. The PTO gear-train is used in most agricultural operations and is easily damaged by soil and working conditions, pointing to a need for design optimization. Additionally, load analysis for the major parts of the cultivator during field operation is important for its optimal design and proper service life [6].
There is much research pertaining to the PTO gear-train for agricultural tractors. Lee [7] examined the PTO load severity on a tractor during rotary tillage and baler operations. When the ground speed of the tractor or the PTO rotational speed increased, the damage to the PTO increased. Consequently, the design of the PTO gears should take into account the various loading conditions during operation. Jung [8] investigated the possibility of optimizing the PTO gears according to their face width. The optimal design of PTO gears enhances quality and reduces material cost by improving durability, stability, and reliability during product development. Shim [9] developed an anti-backlash gear to reduce noise in the PTO gearbox for an agricultural tractor. A model was developed, and the system performance was computer-simulated. This study optimizes the design parameters of the anti-backlash gear for the best performance according to the given conditions.
Recently, analysis and design optimization of PTO gears have been performed using analysis software. This type of design optimization has seen particular use in the automobile industry and for industrial and construction machinery. Demand for high load capacity, high speed, light weight, and safe products have increased as technology has advanced, and the accurate analysis of each component and design for reliability is critical [10]. Gear studies using analysis software have been performed to improve the quality and reliability of vehicle power transmission systems as well as to reduce development time [11]. Lisle [12] compared the bending stress of external spur gears established by ISO 6336, AGMA 2101 standards and numerical finite element analysis with experimental measurements. Wu [13] analyzed the transmission and load characteristics of a meshing helical gear pair with twist-free teeth using analysis software. When the proposed gear honing methodologies were applied to an external gear, an improvement in contact temperature and power loss was observed. Analysis software has been used for gear optimization in various fields, although there are very few studies that have applied analysis software to agricultural topics.
The goal of this study is to provide guidelines for the optimal design of the PTO gear-train, considering the measured work load on a cultivator during a rotary ditching operation. Specifically, this study (1) constructs a torque measurement system for a cultivator; (2) acquires the PTO torque during a rotary ditching that was mostly used in cultivator operation; and (3) analyzes the strength of the PTO gear-train using analysis software.

2. Materials and Methods

2.1. Multi-Purpose Cultivator

Multi-purpose cultivators (ASC-640, ASIAtech, Daegu, Korea) are generally used as a power source for various operations in the field and in greenhouse farming. The cultivator has a total mass of 93 kg (including the ditching rotor) and overall dimensions of 1530 × 610 × 960 mm (length × width × height). The rated output and the rated torque of the engine of the cultivator were 3.9 kW and 20.7 Nm, respectively, at an engine revolution speed of 1800 rpm. The power transmission efficiency of the belt pulley power transmission system used in this study was generally 95% [14]. Therefore, the rated output and rated torque of the PTO input shaft are 3.7 kW and 19.6 Nm, respectively, considering the power transmission efficiency of the belt pulley. The cultivator was equipped with a manual transmission and a PTO gearbox. The ground speeds of the cultivator at T1, T2, and T3 were 1.3, 1.8, and 4.0 km/h, respectively, and the PTO rotational speeds at P1 and P2 were 335 and 709 rpm, respectively. Figure 1 shows the power flow of the cultivator used in the study. The power from the engine is divided between the transmission and the PTO through the belt pulley. The transmission drives two wheels, and the PTO performs various operations such as rotary ditching, ridging, soil covering, ridge plowing, cultivation, and so on.

2.2. Torque Measurement

2.2.1. Torque Measurement System

A torque measurement system for the cultivator was constructed using torque sensors (T27 Hollow Flange, Interface Inc., Scottsdale, AZ, USA) to measure the PTO shaft torque as shown in Figure 2, and a measurement device (NI USB-6212, National Instruments) was used to acquire sensor signals. It was difficult to directly measure the load of the PTO shaft directly, because the PTO input shaft was connected to the engine by a belt pulley. The PTO output shaft was connected to the rotary ditching implement to deliver power. The transmission shaft and the PTO input shaft were coaxial. To determine the PTO torque, measured engine torque was used together with the overall reduction gear ratios of the transmission (T1: 0.012, T2: 0.016) and PTO (P1: 0.124, P2: 0.263). Data acquisition software was developed using LabVIEW (Version 2011, National Instruments). One-way ANOVA with gear setting and Duncan’s multiple range tests at a significance level of 0.05 were used to analyze the measured torque. SAS (version 9.4, SAS Institute, Cary, NC, USA) was used for the statistical analysis.

2.2.2. Field Experiment

The field experiment of the rotary ditching operation was repeated three times. The rotary ditching, which is mostly used in cultivator operations, digs and makes a long narrow trench or furrow. It is generally necessary to perform the rotary ditching operation before other agricultural operations such as planting, fertilizing, and so on [15]. The field test was performed on a field with similar soil conditions at two transmission gear stages (T1, 1.3 km/h and T2, 1.8 km/h) and two PTO gear stages (P1, 335 rpm and P2, 709 rpm). T3 (4.0 km/h) is the fastest ground speed, but it is only used for moving the cultivator. The working depth was set at 100 mm, based on a survey of cultivator users in Korea. The field experiment was conducted at a field in Dori 751, Gajo-myeon, Geochang-gun, Gyeongsangnam-do. The cone index (CI), depth, shear force, moisture content, electric conductivity (EC), and temperature were analyzed following the USDA (United States Department of Agriculture) standard for field sites (ASABE 2011a; ASABE 2011b). Environmental conditions of the field showed an average moisture content of 30.4%, an average EC of 1.75 dS/m, an average temperature of 28.9 °C, an average CI of 2605 kPa, an average soil shear force of 18.5 Nm, and an average depth of 12 cm.

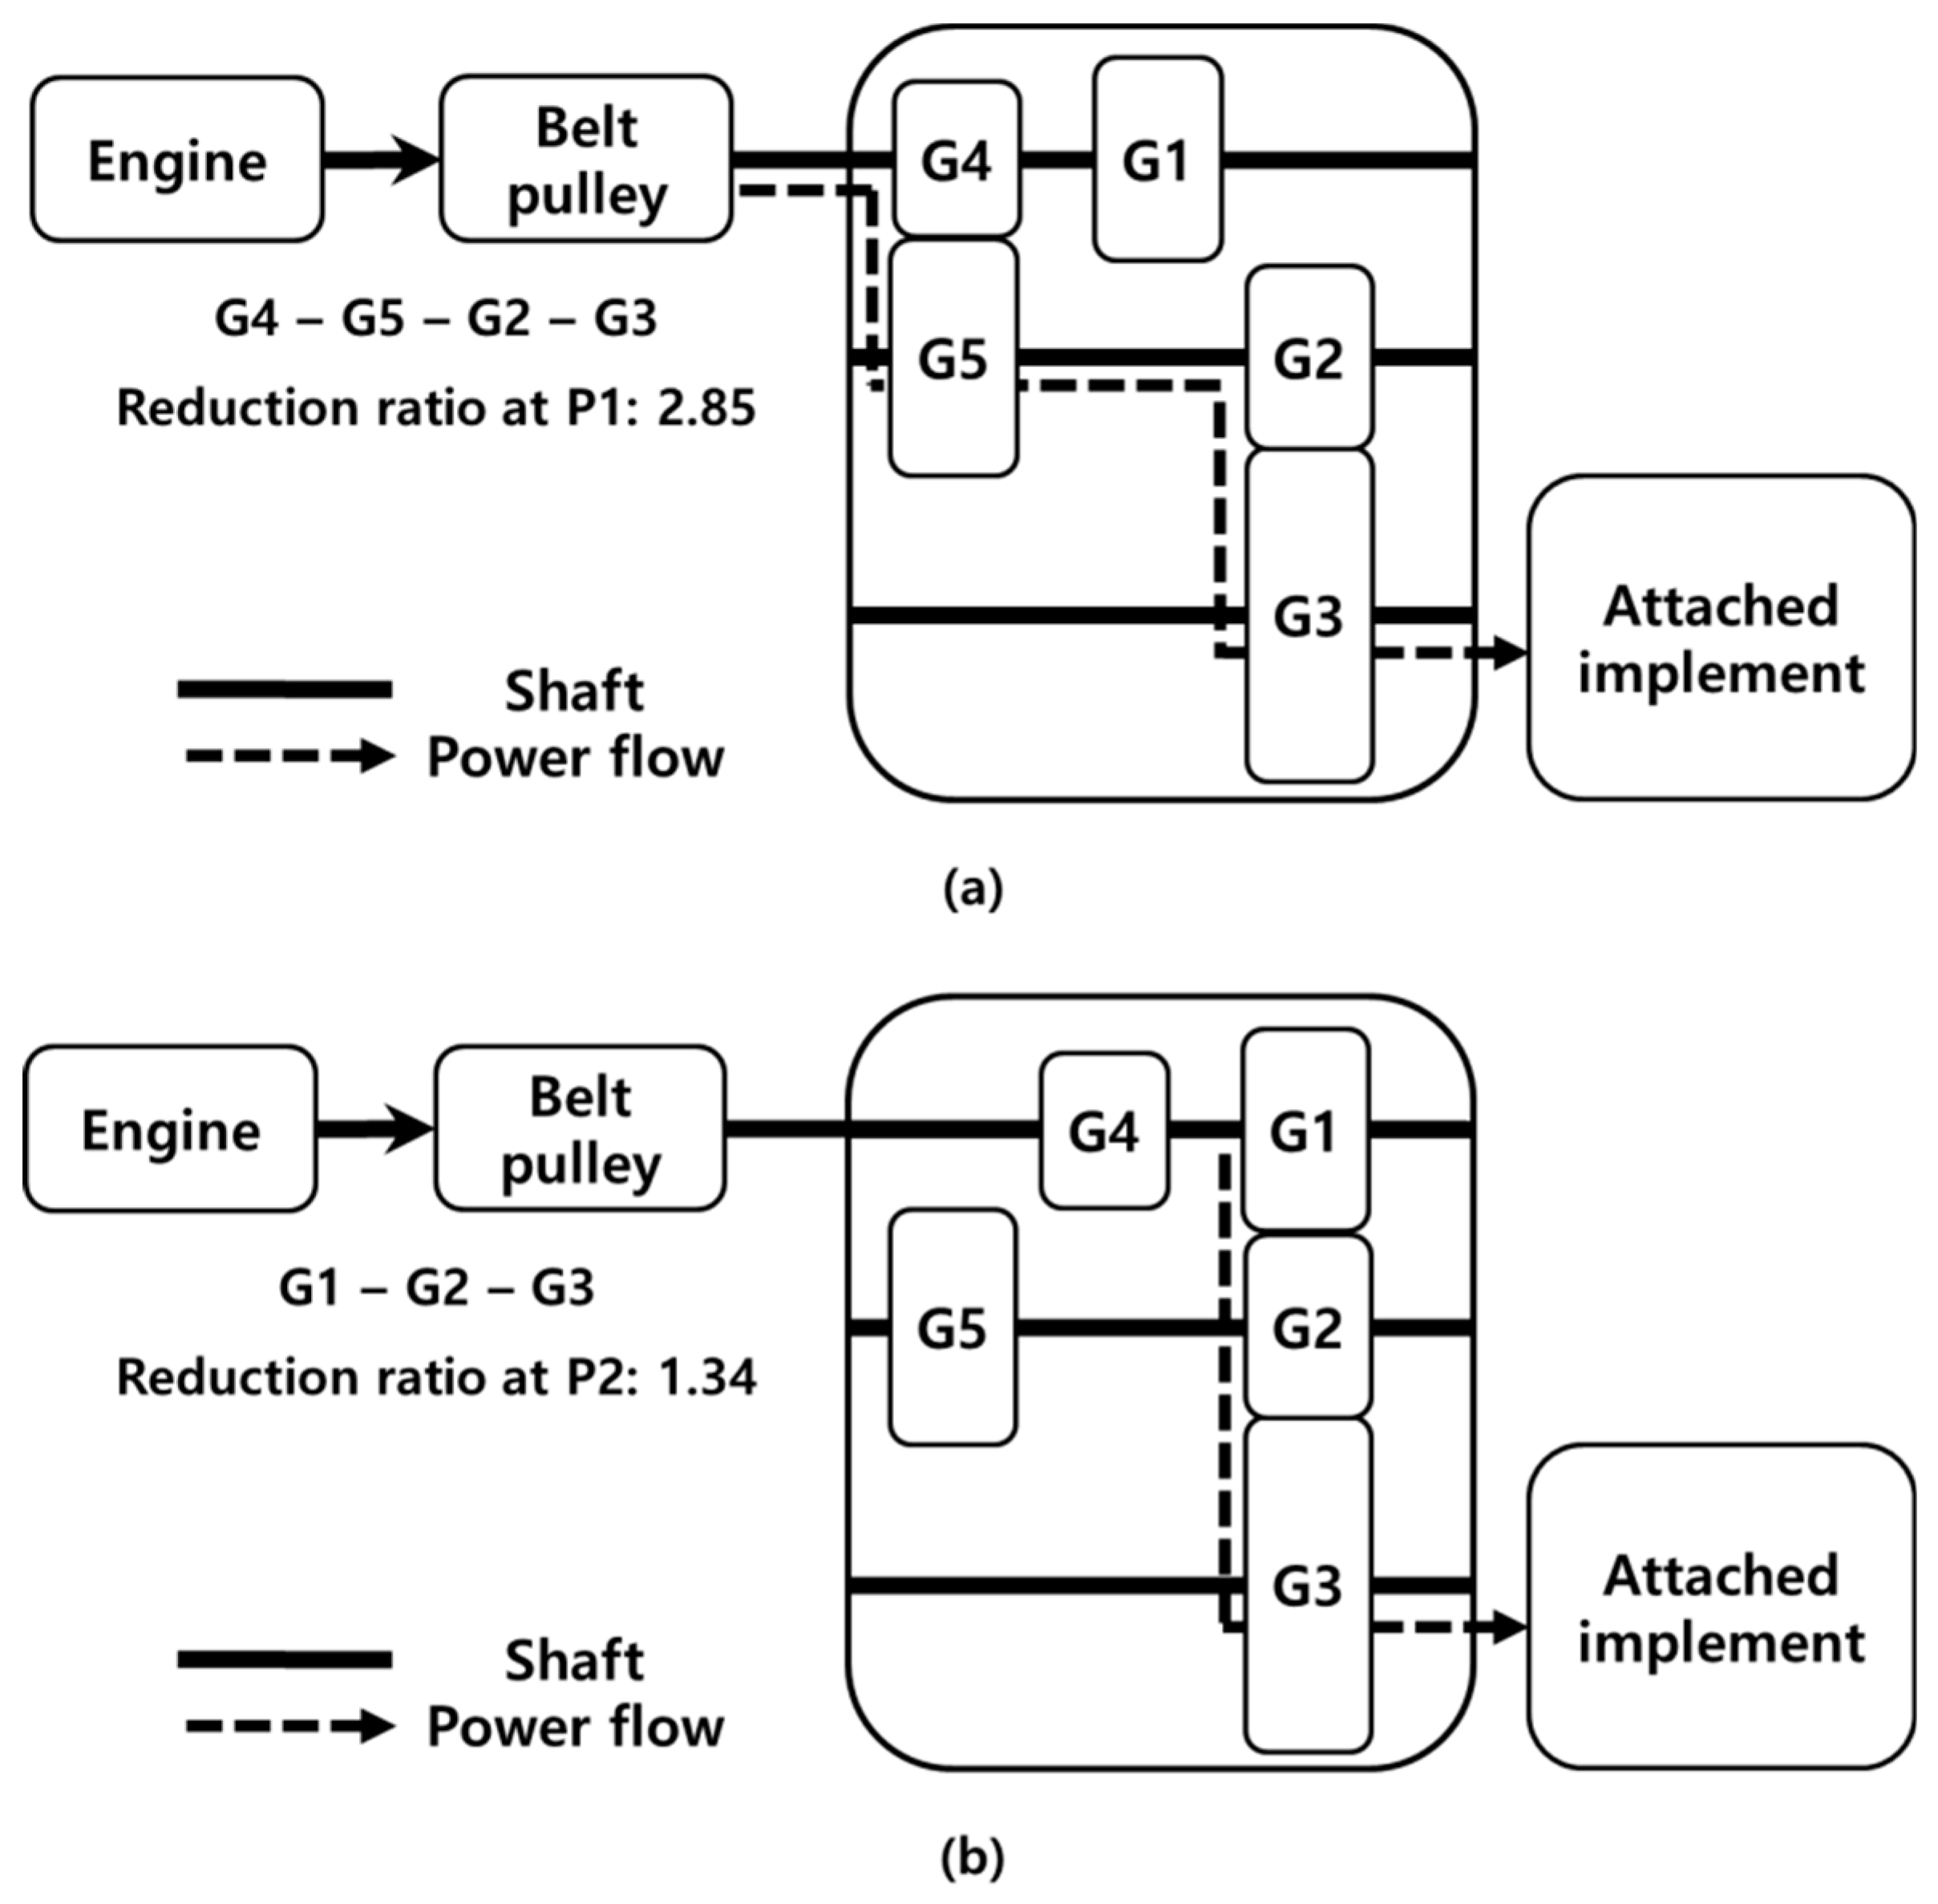
2.3. Simulation of the PTO Gear-Train

Figure 3 shows a driveline of the PTO gear-train according to the PTO gear stage in the cultivator. The PTO gear-train consists of five spur gears. The P1 stage is connected by a belt pulley and four spur gears: G4, G5, G2, and G3. The P2 stage is connected by a belt pulley and three spur gears: G1, G2, and G3. The number of teeth of the gears constituting the PTO gear train is 23 (G1), 21 (G2), 31 (G3), 15 (G4), and 29 (G5). Also, the tooth width is 13 mm for G1 and 6 mm for the other gears (G2, G3, G4, and G5). The center distance is half the sum of the reference diameters and is the distance between gears in the PTO gear-train. The center distances between G1 to G2, G2 to G3, and G4 to G5 are 57.03, 67.23, and 57.03 mm, respectively. The detailed specifications of the PTO gear-train used in this study are shown in Table 1. All PTO gears were made with SCM 440 low-alloy steel for structural machine use. The SCM 440 low-alloy steel is composed of 0.13–0.18% carbon (C), 0.15–0.35% silicon (Si), 0.60–0.90% manganese (Mn), 0.90–1.20% chromium (Cr), and 0.15–0.30% molybdenum (Mo). The surface was treated by carburizing and quenching to increase hardness and wear resistance. SCM 440 (SAE-AISI standard, AISI-4242) has a tensile strength of 1100 (N/mm2) and a yield point of 900 (N/mm2). The Young’s modulus for the material is 206,000 N/mm2, and Poisson’s ratio is 0.3. The module and pressure angle of the all the PTO gears were 2.5 mm and 20°, respectively. Also, the addendum coefficient and dedendum coefficient were 1.25 and 1.00, respectively.
To calculate the strength of the PTO gear-train, KISSsoft analysis software developed by KISSsoft AG—A Gleason Company was used in this study. This software can analyze mechanical components such as gears, shafts, bearings, and springs in various environments through virtual modeling. The software is available to analyze gears used in standards such as AGMA (USA), DIN 3990 (Germany), BS 436 (United Kingdom), JGMA 401 (Japan), and the international standards ISO 6336 published in 1996. ISO 6336 standards were used in this study, because ISO 6336 standards are used globally for gear design [16,17,18,19,20].

2.4. Analysis Method

2.4.1. Gear Strength of the PTO Gear-Train

Measured torque data in the agricultural field generally fluctuates [21]. Therefore, simplifying the measured torque data using the cycle counting method is required to determine the PTO gear stress and fatigue life. The rainflow cycle counting method is commonly considered to be the best cycle counting method for estimating fatigue damage. It is regarded as a good procedure for determining damaging events in randomly fluctuating loading conditions [22]. It can convert the measured torque data from the time domain to the frequency domain (ASTM, 1985) [23]. This will separate the individual simple stress cycles from complex irregular load history [24]. Mean torque can significantly affect the fatigue life of the PTO gear-train. Therefore, the effects of mean torque must be considered. Figure 4 shows the computation process for the safety factor and fatigue life of the PTO gear-train.
The Smith–Watson–Topper method is applied for the incorporation of mean torque effects as shown in Equation (1) [25]. The measured torque data were replaced by an equivalent torque.
T e = ( t a + t m ) t a
where, T e is the equivalent torque (Nm), t a is the torque amplitude (Nm), and t m is the mean torque (Nm).
Two causes of gear failure are bending stress and contact stress [26]. Bending stress is caused by repeated torque that is applied at the tooth root. When a stress over the fatigue limit is applied to the root, cracks at the tooth root occur and propagate to the breaking point. Contact stress is caused by rotational torque applied to the tooth surface. The tooth surface becomes damaged when repeated stress over the fatigue limit is applied to the surface, and the repeated load on the surface results in fatigue pitting. The bending stress was calculated using Equations (2) and (3), and the contact stress was calculated using Equations (4) and (5). All gear stresses and factors were calculated based on ISO 6336: 2006 under fluctuating PTO torque during the rotary ditching operation. The bending stress is based on the Lewis equations, and the contact stress is based on the Hertz equation. Both equations have many modifying factors as follows. These modifying factor values were suggested by the software (KISSsoft, L. Kissling and Co. AG) and were applied in this study.
σ F 0 = 2000 × T e d × b Y F Y S Y β Y B Y DT
σ F = σ F 0 K A K V K β K α
where, σ F 0 is the nominal bending stress (N/mm2), T e is the equivalent torque at the pinion or wheel (Nm), d is the pitch diameter of the pinion or wheel (mm), b is the face width (mm), Y F is the tooth form factor, Y S is the stress correction factor, Y B is the rim thickness factor, Y DT is the deep tooth factor, and Y β is the helix angle factor and was set to 1 because of the gear-train used consists of spur gears. σ F is the bending stress (N/mm2), K A is the application factor, K V is the dynamic factor, K β is the load factor, and K α is the transverse load factor.
σ H 0 = Z H Z E Z e Z β 2000 T e dd p b ( u + 1 u )
σ H = Z B σ H 0 K A K V K β K α
where σ H 0 is the nominal contact stress (N/mm2), Z H is the zone factor, Z E is the elasticity factor, Z e is the contact ratio factor, d p is the pitch diameter of the pinion (mm), and u is gear ratio. The helix angle factor Z β is considered to be 1 for spur gear-trains. σ H is the contact stress (N/mm2) and Z B is the pinion single pair tooth contact factor. The simulation-related coefficient input value was determined by KISSsoft.
The torque data calculated from the rainflow cycle counting method and the Smith–Watson–Topper (SWT) equation were input into KISSsoft. Also, the service life of the cultivator was selected to be equal to the service life, which enterprises generally define as 1000 h. Next, the safety factors for the bending stress and contact stress as well as the fatigue life were analyzed. The PTO gear-train should be designed to endure the load at the tooth root and the gear surface. An excessive safety factor will result in increased size and weight, which will lead to increased cost. Therefore, the proper safety factor should be calculated according to various fields. Safety factors are required depending on the material properties, load type, and application and generally have values larger than 1. A safety factor less than 1 could be dangerous because it could result in gear damage or reduced service life. According to the ISO 6336 standard [27], a safety factor of less than 1 indicates a high risk of pitting failure. The safety factor for bending stress was calculated using Equation (6). The safety factor for stress at a single tooth point of contact was calculated using Equation (7).
S F = σ FG / σ F
S H = σ HG / σ H
where S F is the safety factor for bending stress, σ FG is the tooth root stress limit (N/mm2), σ F is the bending stress (N/mm2), S H is the safety factor for contact stress, σ HG is the tooth flank stress limit (N/mm2), and σ H is the contact stress (N/mm2).

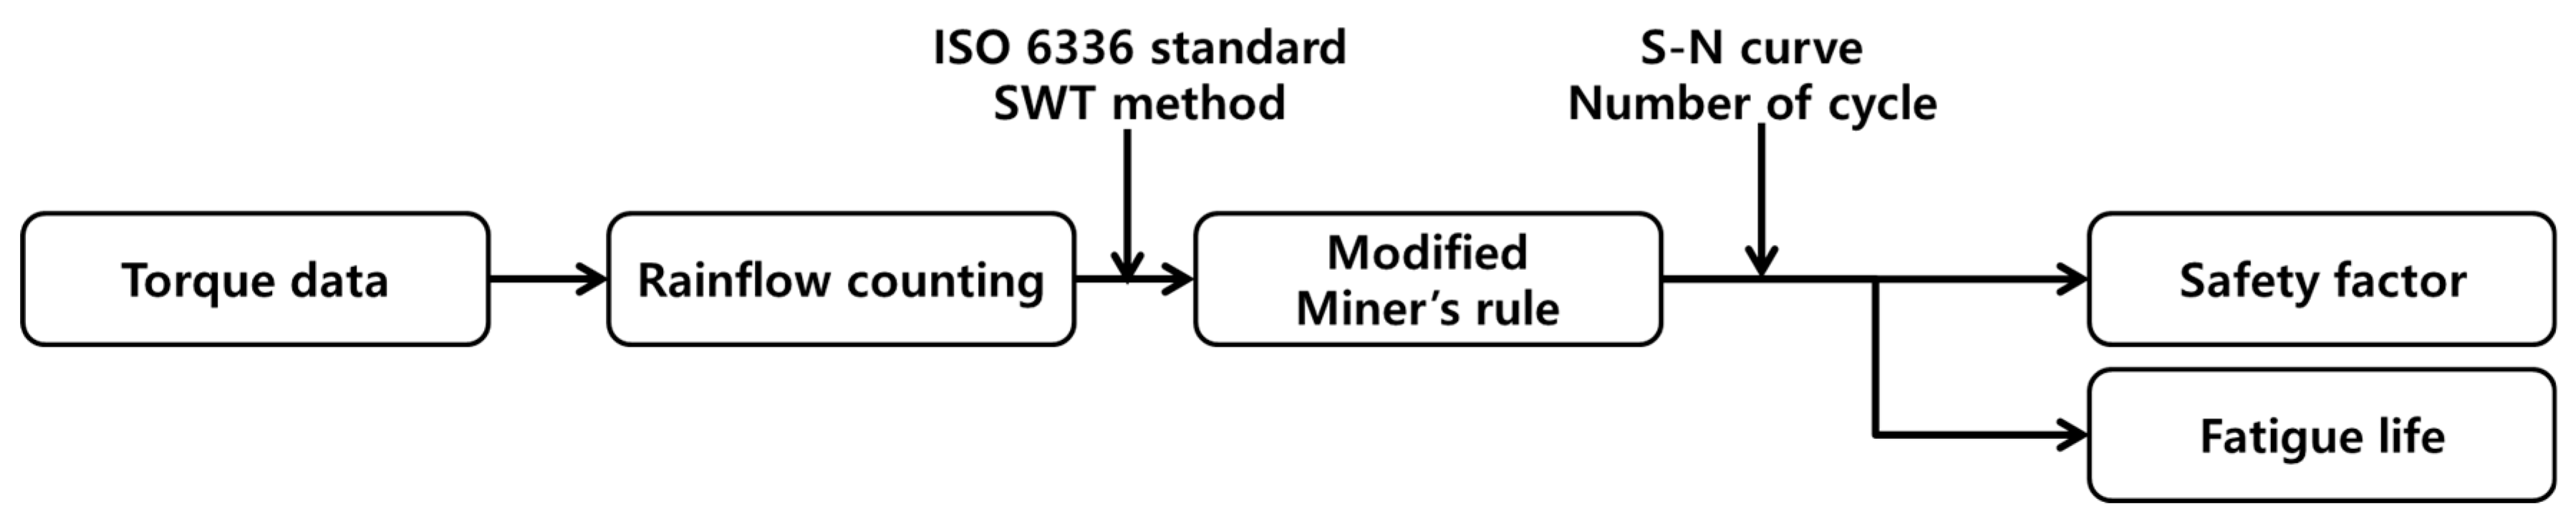
2.4.2. Fatigue Life of the PTO Gear-Train

The modified Miner’s rule [28] with S–N curves of SCM440 and ISO 6336 standards were used to predict the damage sum using Equation (8). The equations of the S–N curves of the PTO gears were Equations (9) and (10) from KISSsoft. The modified Miner’s rule is probably the simplest cumulative damage model, and it includes a procedure for estimating the fatigue life since the fatigue occurs in the number of cycles to failure when the damage sum obtained using the modified Miner’s rule is ‘1’. The number of cycles (n) is determined by an equivalent stress of the load data. The fatigue life cycle (N) is derived from the S–N curve of the PTO gear-train’s material. Then, the damage sum (D) aggregates the calculated 32 stress classes [29]. It can be thought of as assessing the proportion of life consumed at each stress level and then adding the proportions for all the levels together. In general, when the damage fraction reaches 1, failure occurs. The service life of each gear stage is assumed to be 1000 h, which is the manufacturer’s warranty time, because it is very difficult to accurately analyze the usage ratio of each gear stage (T1, T2, P1, P2).
D total = i = 1 k n i N i
where, D total is the damage sum, n i is the number of cycles at the ith stress class, and N i is the fatigue life at the ith stress class.
σ P = 2417.9   N i 0.068
σ P = 2858.8   N i 0.032
where Equation (9) is the S–N curve Equation of SCM440 at the PTO gear root, Equation (10) is the S–N curve equation of SCM440 at the PTO gear flank, σ P is the stress (N/mm2), and N i is the fatigue life at the ith stress class.

3. Results

3.1. Statistical Analysis
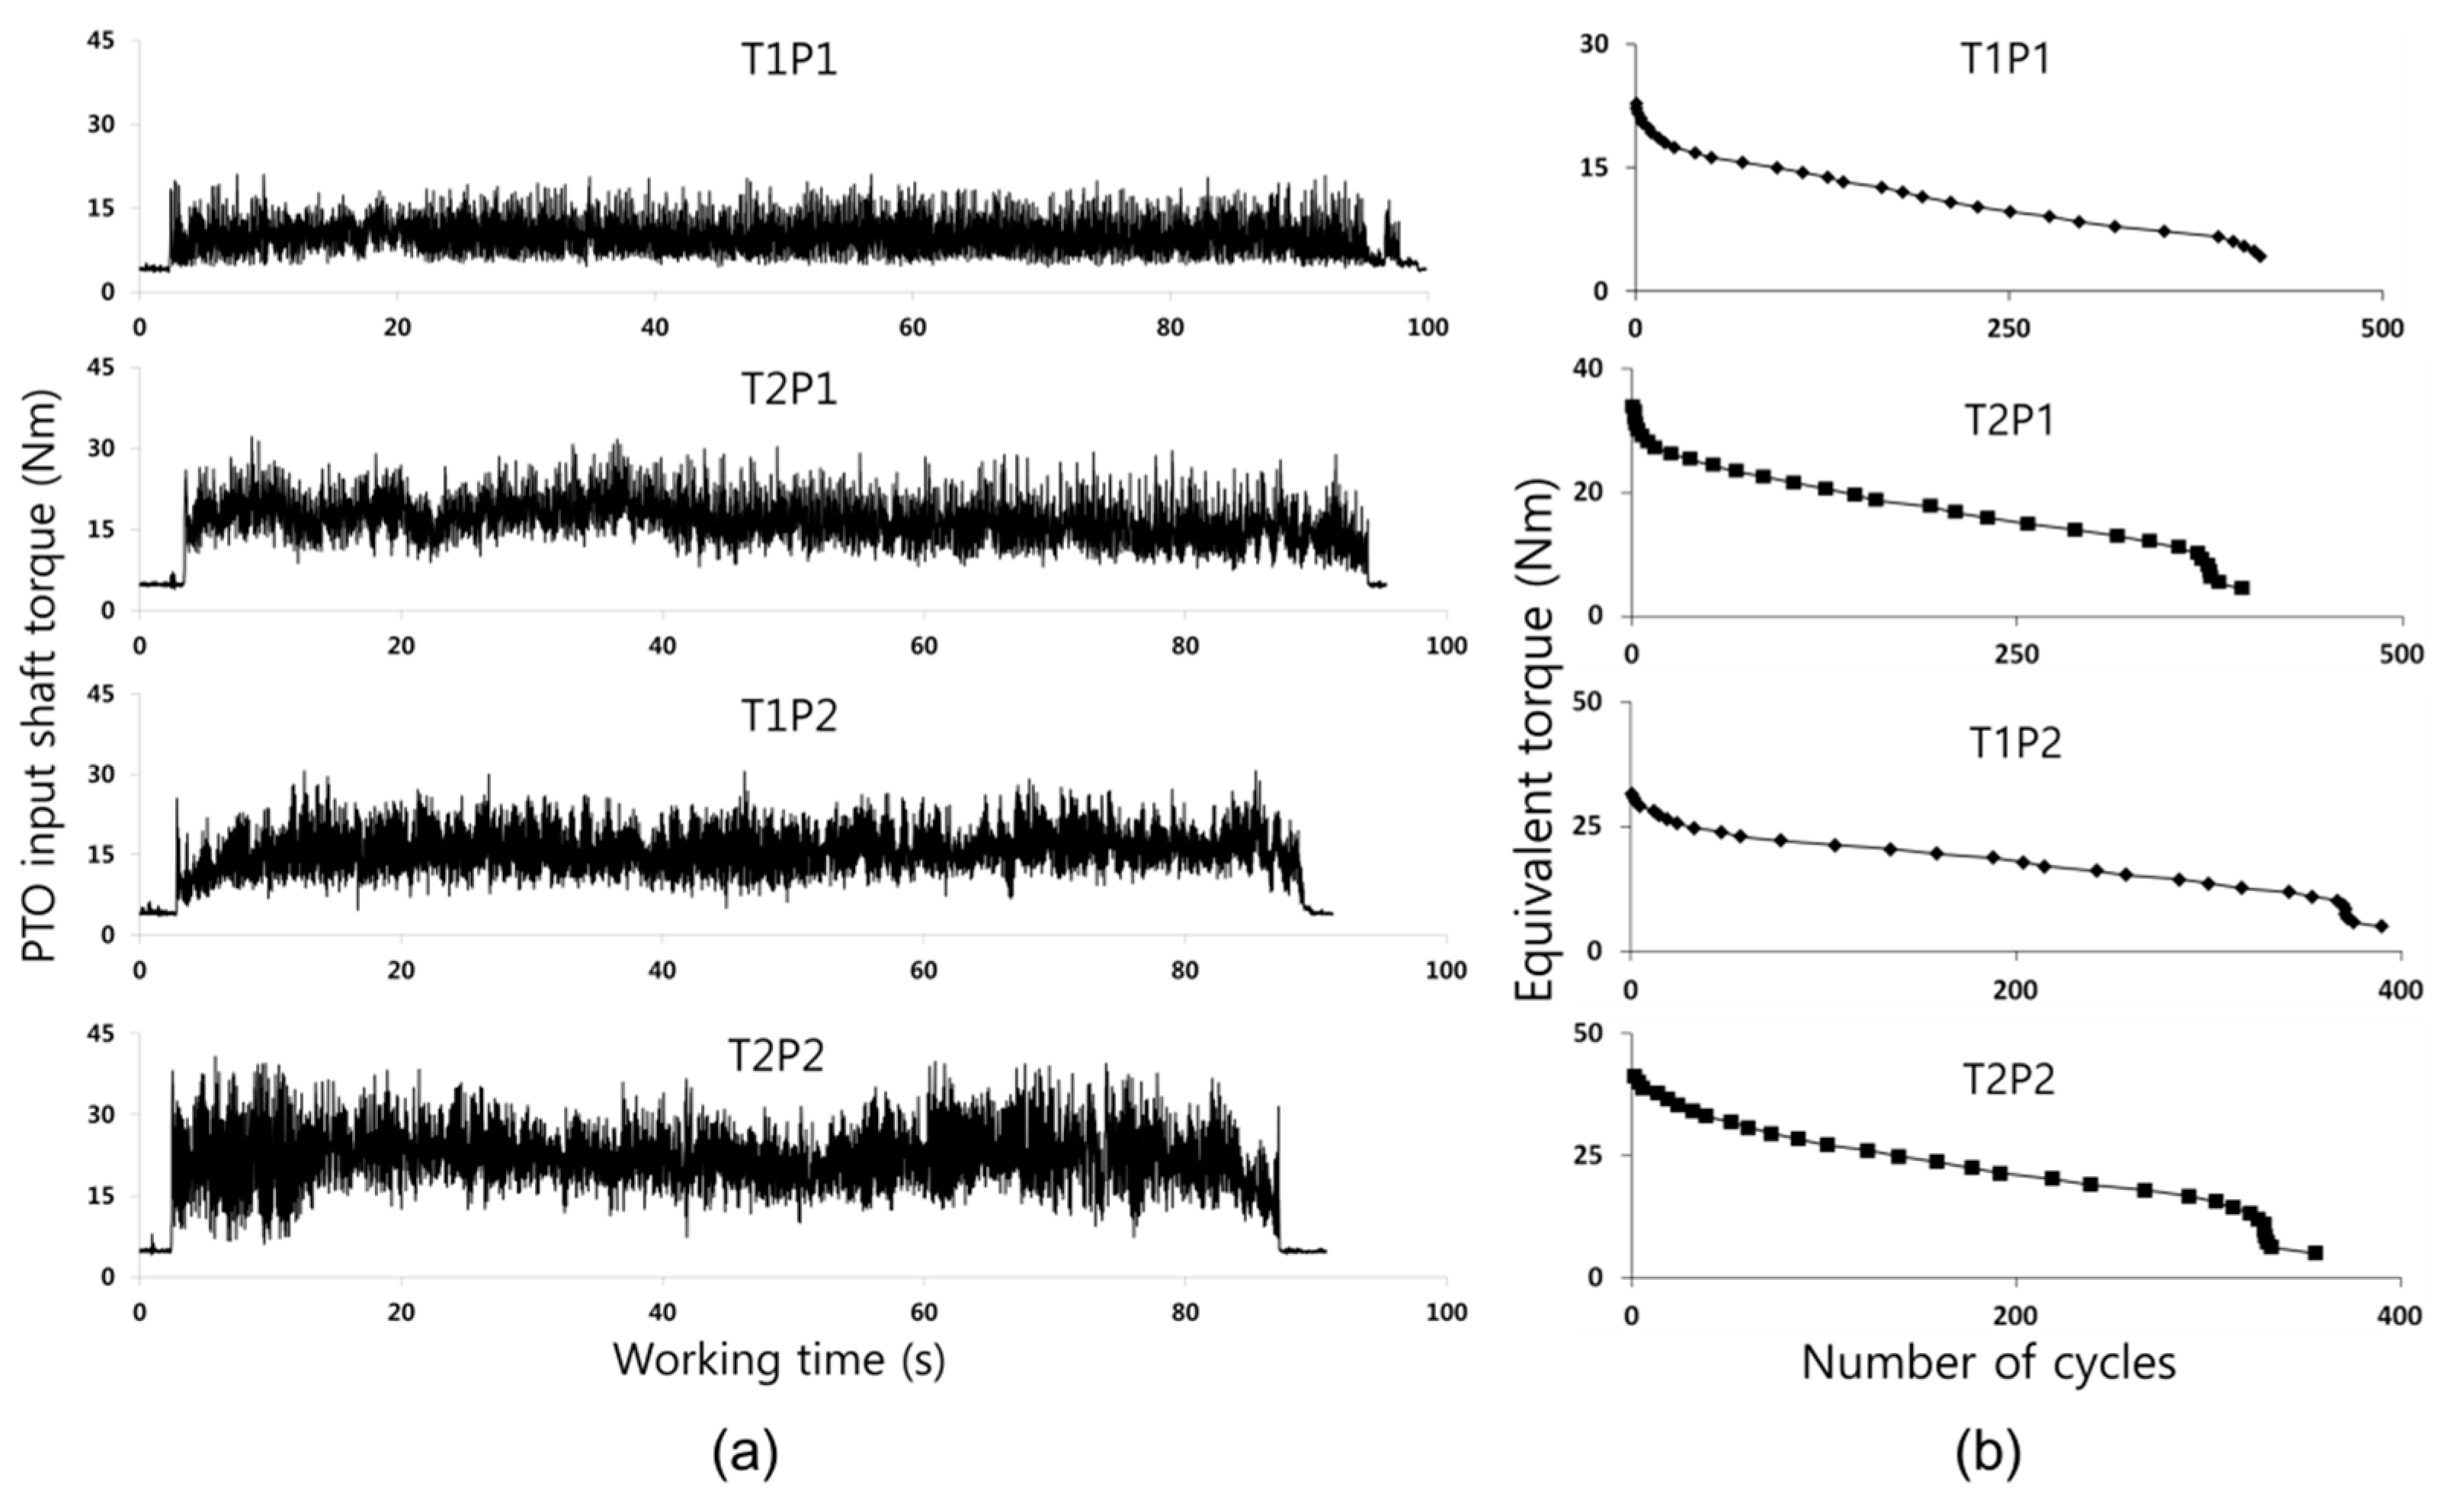
Analysis of variance (ANOVA) using statistical software SAS (version 9.4, SAS Institute, Cary, NC, USA) was conducted to compare and analyze the influence of each gear combination of the transmission and the PTO gear stages on the load of the PTO gear-train. In general, the measurement data in the field of agriculture, which is mainly concerned with the interaction with soil, tend to have non-normality. Therefore, the statistical analysis of the measurement data in this study was performed after assuming a normal distribution of the data using the Central Limit Theorem, which says that treatment means have an approximate normal distribution if the number of measured data is large enough [30,31]. There was a significant effect of gear combinations of transmission and PTO gear stages on torque of the PTO gear-train; F(3) = 3298.26, p = 0.0001. The results of the ANOVA analysis of the PTO torque by gear combination during the rotary ditching operation are shown in Table 2.
Test results of descriptive statistics and Duncan’s multiple range test showed that the mean score for the T2P1 (M = 16.32, SD = 4.80) was significantly different than that of the T1P1 (M = 9.87, SD = 3.35) and the T2P2 (M = 20.84, SD = 6.87). However, the T2P1 did not significantly differ from the T1P2 (M = 15.09, SD = 4.73). Thus, Duncan’s multi-range test results showed that T1P2 and T2P1 were classified in the same group. The results of descriptive statistics and Duncan’s multiple range test of the PTO torque by gear combination during a rotary ditching operation are shown in Table 3.

3.2. Load Analysis

Figure 5a shows the PTO torque at two ground speeds (T1 and T2) and two PTO rotational speeds (P1 and P2). The measured PTO torque shows irregular fluctuations during the rotary ditching operation. The PTO torque increased when the ground speed with the same PTO rotational speed increased. Also, the PTO torque increased when the PTO speed with the same ground speed increased. Figure 5b shows the load spectrum, which is used to analyze the load characteristics under soil and work conditions; it was constructed using the rainflow cycle counting and SWT methods. The maximum equivalent torque for speed combinations of T1P1, T2P1, T1P2, and T2P2 were measured as 22.8, 31.7, 33.9, and 41.3, respectively. When the ground speed increased, the equivalent torque on the PTO was increased. Also, when the PTO speed increased, the equivalent torque on the PTO was increased. The greatest equivalent torque was found at T2P2. The equivalent torque for speed combinations of T1P1, T2P1, T1P2, and T2P2 were similar in the high cycle region from 350 to 400. Relatively low equivalent torque can occur similarly regardless of ground speed and PTO rotational speed. Therefore, as the number of cycles increases, the equivalent torque tends to decrease. The load spectrum was used on KISSsoft for analysis of the PTO gears. The average torque for speed combinations of T1P1, T2P1, T1P2, and T2P2 were 9.87, 16.32, 15.09, and 20.84 Nm, respectively. The average measured torque ratio of each gear combination was 50.1% (T1P1), 82.9% (T2P1), 76.7% (T1P2), and 105.9% (T2P2), respectively, compared with the rated torque of the PTO input shaft of 19.6 Nm. The maximum torque on the PTO shaft for speed combinations of T1P1, T2P1, T1P2, and T2P2 were 21.02, 32.11, 30.61, and 40.79 Nm, respectively. The average torque increased by 38–65% when the ground speed increased by 39% as the transmission gear was shifted from T1 to T2 at the same PTO gear stage. At the same transmission gear stage, the average torque increased by 28–53% when the PTO rotational speed increased by 112% as the PTO gear-train was shifted from P1 to P2. The results show that the PTO torque increased as the ground speed and PTO rotational speed increased. The maximum PTO torque was at the highest speed combination with the transmission set to T2 and the PTO gear set to P2.

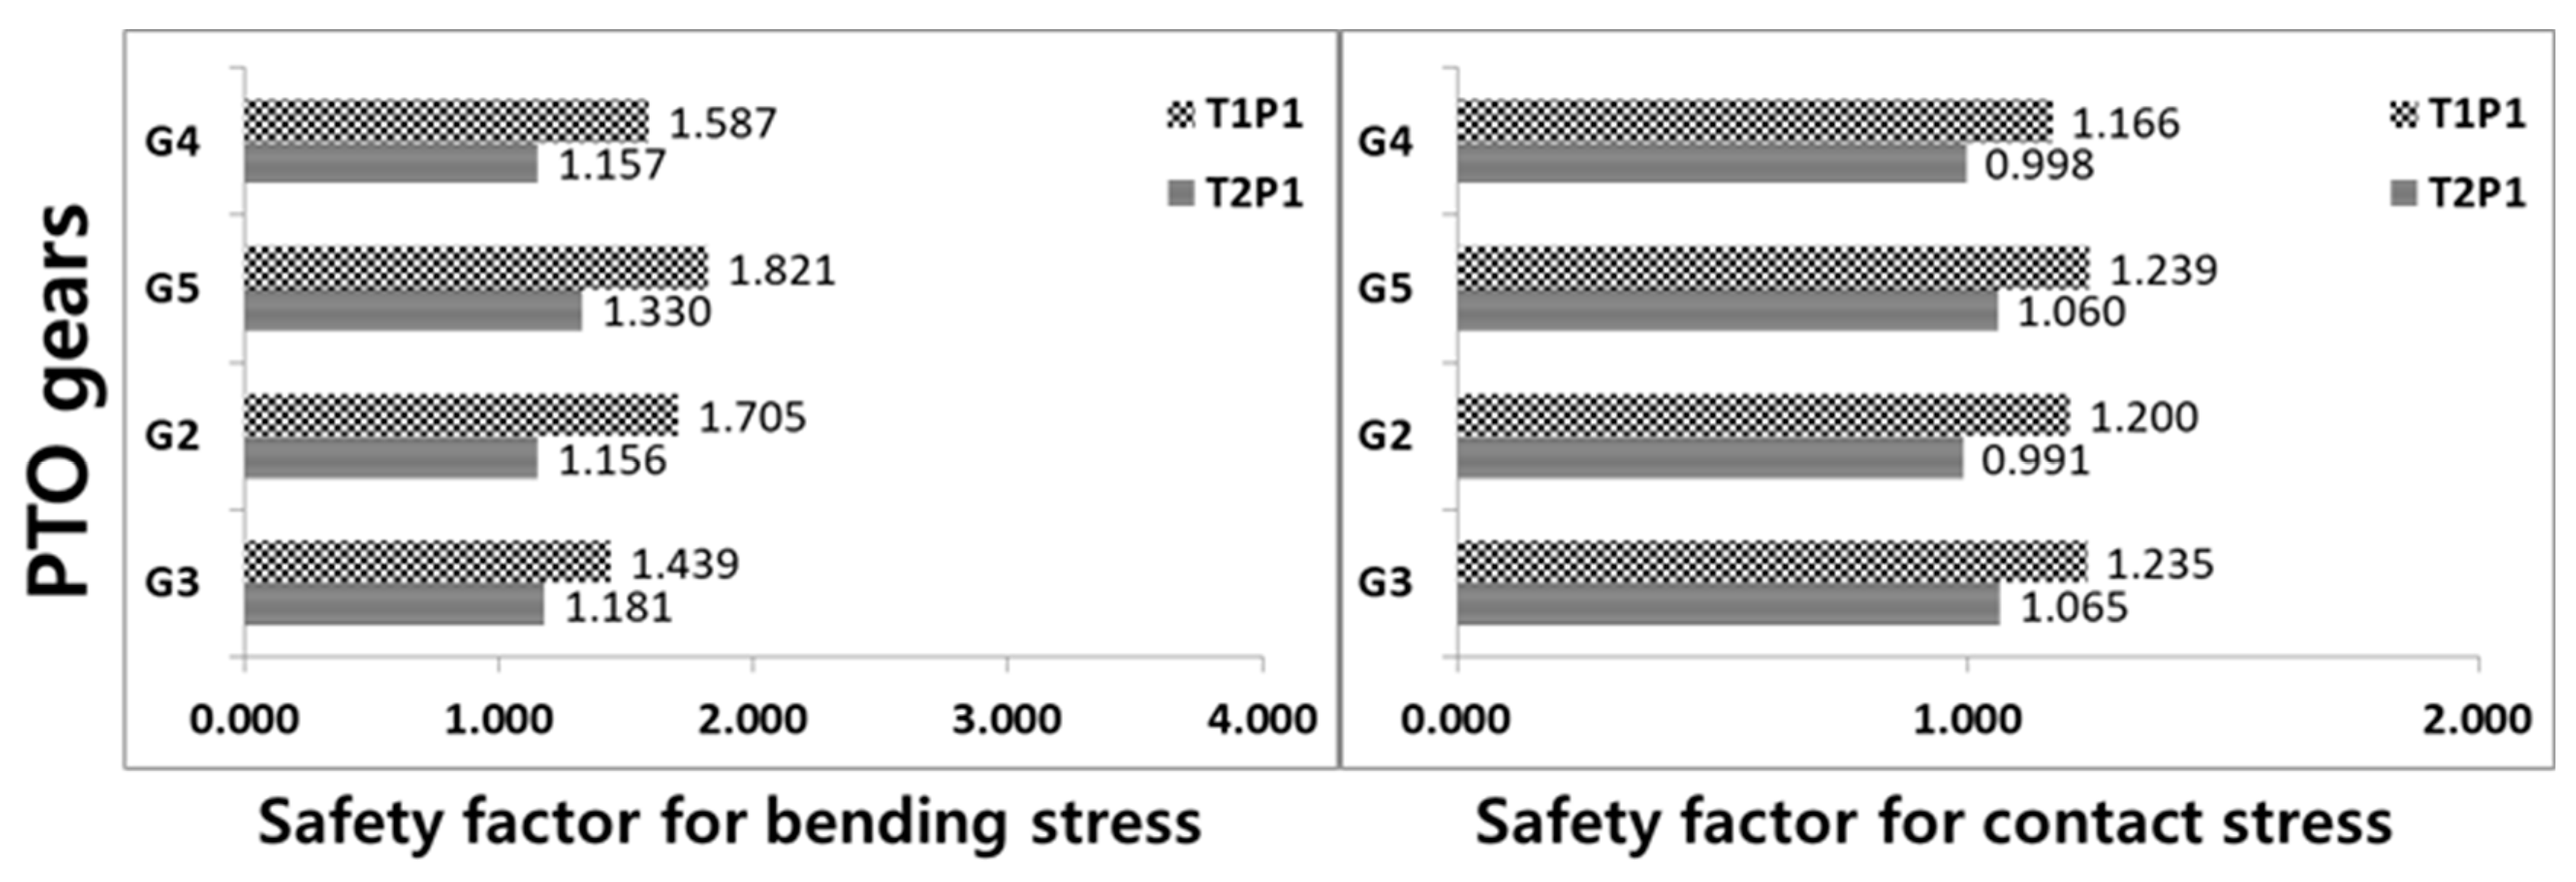
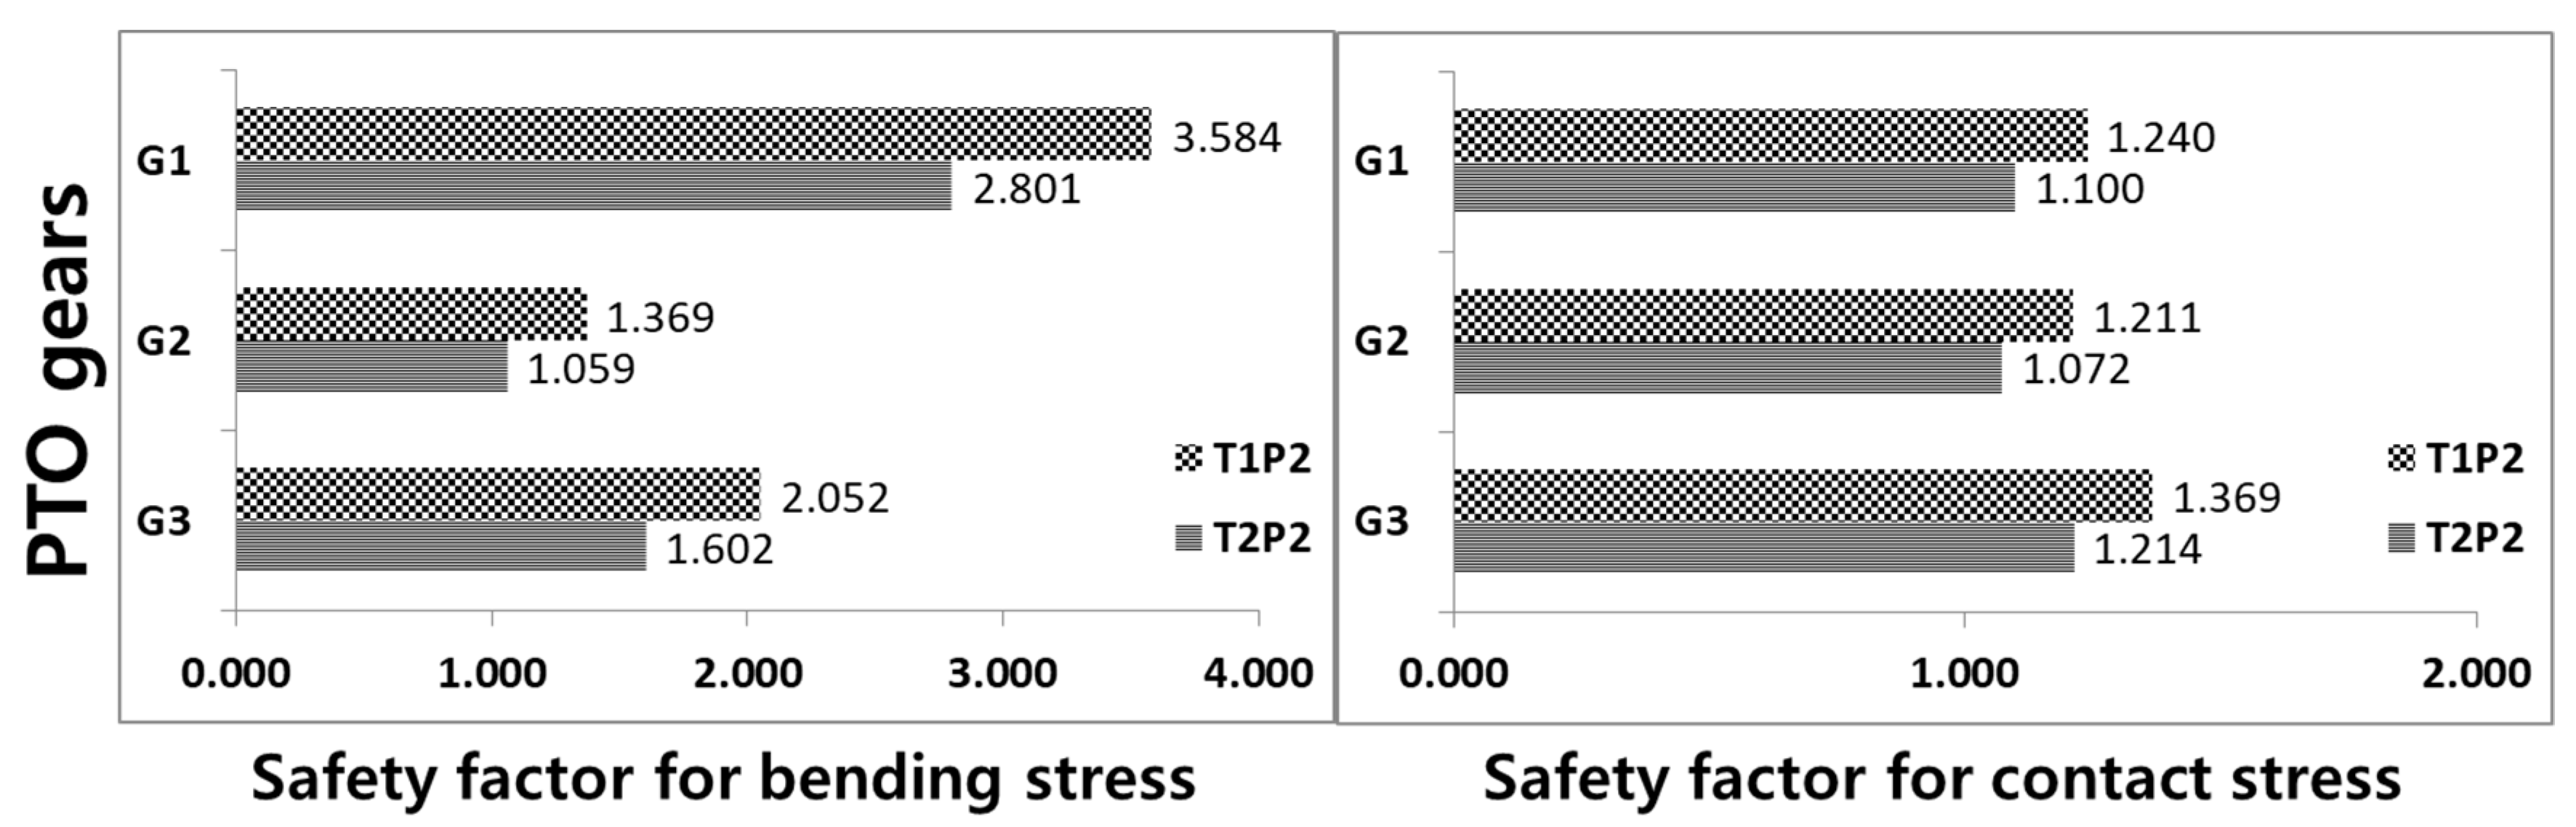
3.3. Strength Analysis

The strength of the PTO gears was evaluated in terms of contact stress and bending stress by calculating the safety factors during a rotary ditching operation. The safety factors for bending stress and contact stress are presented in Figure 6 and Figure 7. These results show that all safety factors for bending stress were higher than the minimum safety factor of 1.0, with the lowest safety factor (1.059) in the gear G2 for the T2P2 gear stage and the highest safety factor (3.584) in the G1 gear for the T1P2 gear stage. However, the safety factor for contact stresses of the G4 (0.998) and G2 (0.991) gears in the T2P1 gear stage were lower than the minimum safety factor of ‘1.0’. In general, the torque tends to increase as the combination of the transmission and the PTO gear is higher [32]. The overall simulation results of the safety factors show that the higher the combination of transmission and PTO gear stage, the lower the safety factor tended to be. However, the results of the safety factor of the G2 and G3 gears have no general tendency for the safety factor to decrease with higher PTO gear stages. It is considered that the safety factor of the G3 gear at P2 is increased because the reduction ratio of P2 (G1-G2-G3) is smaller than that of P1 (G4-G5-G2-G3). In addition, when the PTO gear shifts from P1 to P2, the safety factor of the G2 gear is greatly reduced. This seems to be due to the fact that the G2 gear is the only gear in the P2 gear stage that transmits power at the positions where the gears are in contact with both sides. The safety factor of contact stress had a lower tendency than the safety factor of the bending stress. Based on these results of the safety factors, the T2P1 gear stage (G4 and G2) is considered to be a weak combination of the transmission and PTO gear stage. Therefore, the T2P1 gear stage must be redesigned through the modification of the PTO gear train elements so that the safety factor for bending stress is higher than the minimum safety factor. In particular, the design modification of G2 and G4 gears in T2P1 should be considered.
When the transmission gear stage shifted from T1 to T2, the simulation results of the safety factor at the bending stress decreased by up to 32.1% at P1 (G2) and up to 22.6% at P2 (G2). The simulation results of the safety factor at the contact stress decreased by up to 17.4% at P1 (G2) and up to 11.4% at P2 (G2) when the transmission gear stage shifted from T1 to T2. The gear used for rotary ditching depends on the PTO gear stage (P1: G4-G5-G2-G3, P2: G1-G2-G3). For this reason, the simulation results of the effects of the PTO gear shift were conducted based on two gears (G2 and G3), which are used in all PTO gear stages. In the case of the G2 gear, when the PTO gear stage shifted from P1 to P2, the safety factor of bending stress decreased by up to 19.7% at T1 and up to 8.3% at T2. However, the safety factor of the bending stress increased by up to 42.5% at T1 and up to 35.6% at T2 in the case of the G3 gear because the reduction ratio of P2 is smaller than the reduction ratio of P1. In the case of the G2 gear, when the PTO gear stage shifted from P1 to P2, the safety factor of contact stress increased by up to 0.9% at T1 and up to 1.9% at T2. The simulation results of the safety factor for G3 at the contact stress increased by up to 10.8% at T1 (G3) and up to 13.9% at T2 (G3) when the PTO gear stage shifted from P1 to P2. From these simulation results, it is known that the transmission gear shift has a greater impact on the safety factor than does the PTO gear shift.

3.4. Fatigue Life

Table 4 shows the fatigue life of the PTO gear-train calculated by the modified Miner’s rule and the PTO rotational speed during a rotary ditching operation. In the T1P1, the minimum fatigue life is 10,410 h (G3) at the gear root and 11,790 h (G4) at the gear flank. The fatigue life of the G5 gear was more than 106 h. In addition, the fatigue life in T1P1 satisfied the service life in all gears. In the T2P1, the minimum fatigue life is 10,410 h (G3) at the gear root and 11,790 h (G4) at the gear flank. The fatigue life of the G5 gear was more than 106 h. In addition, the fatigue life in T1P1 satisfied the service life in all gears. In T2P1, the simulation results at the gear root showed that the fatigue life was shorter than the service life at the G4 gear (668 h), G2 gear (674 h), and G3 gear (884 h) but not at the G5 gear (3757 h). Of all the combinations of gear stages, it was determined that the fatigue life was lower than the service life in T2P1 at G4 gear (972 h), and G2 gear (889 h). In T1P2, fatigue life greater than service life was shown in all gears, and fatigue life was the longest of all combinations of transmission and PTO gear setting. In T2P2, the simulation results showed the lowest fatigue life at the G2 gear (258 h). As with the safety factor results, the G2 gear is located between the G1 and G3 gears and appears to be affected by the high torque at T2. In addition, the fatigue life of the results was analyzed according to the gear shift affect. In the case of the transmission gear shift (from T1 to T2), fatigue life at the gear root decreased by 93.8–95.8% and fatigue life at the gear flank decreased by 90–92.5%. In the case of the PTO gear shift (from P1 to P2), fatigue life at the gear root decreased by 41.8–61.8%, but fatigue life at the gear flank increased sharply by 141–221%. However, the fatigue life in the gear flank increased sharply when the PTO gears stage increased. The results of fatigue life show that the higher the combination of transmission and PTO gear stage, the shorter the fatigue life, similar to the safety factor. Based on these results of fatigue life, the simulation results show that the design of the gear-train should be modified to meet the service life (1000 h) of the weak gear combination (T2P1 and T2P2). Especially, the design modification of gears G2, G3, and G4 in T2P1 and G2 gear in T2P2 should be considered.

4. Discussion

The results for this study indicate that ground speed (transmission gear selection; T1, T2) and PTO rotational speed (PTO gear selection; P1, P2) impact the strength of the PTO gear-train. Therefore, we can analyze the weak points among the combinations of gear stages on a multi-purpose cultivator during a rotary ditching operation.
The average torque increased up to 65% when the ground speed increased by 39% as the transmission gear was shifted from T1 to T2 at the same PTO gear stage. At the same transmission gear stage, the average torque increased up to 53% when the PTO rotational speed increased by 112% as the PTO gear was shifted from P1 to P2. The results show that the measured torque tended to increase when the ground speed and PTO rotational speed were increased. The average measured torque ratio to rated torque of the PTO input shaft (19.6 Nm) was in the range of 50.1–105.9%. In particular, the T2P2 gear stage (105.9%) and T2P1 gear stage (82.9%) showed high torque ratios.
The analysis of the simulation results for the strength of the PTO gear-train are as follows: When the transmission gear level of the cultivator increased at the constant P1, the safety factor for bending stress decreased by as much as 47%, and the safety factor for contact stress decreased by as much as 21%. When the transmission gear stage of the cultivator increased at the constant P2, the safety factor for bending stress decreased by as much as 29%, and the safety factor for contact stress decreased by as much as 13%.
The results show that all safety factors for bending stress were higher than the minimum safety factor of ‘1.0’. Among the safety factors for contact stress, the safety factor at T2P1 (G4 and G2) was lower than the minimum safety factor of ‘1.0’. However, the gear strength of the G3 gear is affected by the reduction ratio of the PTO gear stage, so that the safety factor and fatigue life increase when the PTO gear stage increased. The results of the fatigue life at the PTO gear root showed fatigue life of less than service life at T2P1 (G2, G3 and G4) and T2P2 (G2). In addition, the results of the fatigue life analysis of the PTO gear flank showed fatigue life of less than service life at T2P1 (G2 and G4). Therefore, the weak gear combination T2P1 (gear root; G2, G3, and G4, gear flank; G2) and T2P2 (gear root; G2) should be considered as the weak parts that require redesigning in the PTO gear-train elements to meet and exceed the minimum safety factor and service life.

5. Conclusions

In this study, the strength analysis of a PTO gear-train of a multi-purpose cultivator was performed using actual measured loads during rotary ditching operation. The safety factor and fatigue life of a PTO gear-train were analyzed with respect to four gear combinations of transmission and PTO gear stages. The main conclusions are summarized as follows.
According to the simulation results about the strength of the gear-train of a multi-purpose cultivator, the safety factor and fatigue life of the PTO gear-train tend to decrease when the combination of gear stages are higher, except for the G2 and G3 gears. The strength of the PTO gear-train greatly depends on the combination of gear stages (transmission and PTO gear stages). Thus, to achieve the optimal design of a cultivator, the main gear selection of the cultivator must be considered depending on the various operations the cultivator will perform.
The results of this study provide a guide for predicting the life of the PTO gear-train and selecting the weak combination of gear stages using the measured fluctuating load during actual rotary ditching operation. Based on the results obtained according to this research method, it is expected that the life of the gear can be increased according to the designed purpose by modifying the gear material, the gear ratio, the center distance of gear, and the gear-train elements such as the number of teeth, face width, and gear-train modules [33].
Generally, farmers tend to conduct rotary ditching operations using a multi-purpose cultivator at higher gear combinations of transmission and PTO gear stages to reduce the total working duration. However, higher gear combinations cause greater load on the PTO input shaft, which affects the strength of the PTO gear-train. Therefore, farmers using multi-purpose cultivators need to select an appropriate gear combination considering soil conditions and the load severity of the PTO gear-train.
In this study, all combinations of gear stages were limited to a service life of a minimum of 1000 h. Therefore, it is necessary to calculate the service life by applying the actual usage ratio obtained through user surveys. It is possible to analyze the gear strength in various regions using the guidelines presented in this study.

Author Contributions

Conceptualization, Y.-J.K. and K.-H.L.; methodology, O.-W.K. and C.-W.K.; software, Y.-S.K. and W.-S.K.; formal analysis, Y.-S.K. and P.-U.L.; investigation, P.-U.L.; writing—original draft preparation, P.-U.L.; writing—review and editing, Y.-S.K.; supervision, Y.-J.K.; project administration, Y.-J.K.

Funding

This research received no external funding.

Acknowledgments

This research was supported by the Agriculture, Food and Rural Affairs Research Center Support Program, Ministry of Agriculture, Food and Rural Affairs.

Conflicts of Interest

The authors declare no conflict of interest.

References

  1. Statistics Korea (KOSTAT). Available online: http://kostat.go.kr/wnsearch/search.jsp (accessed on 17 November 2018).
  2. Kim, W.S.; Kim, Y.S.; Kim, Y.J.; Choi, C.H.; Inoue, E.; Okayasu, T. Analysis of the Load of a Transplanter PTO Shaft Based on the Planting Distance. J. Fac. Agric. Kyushu Univ. 2018, 63, 97–102. [Google Scholar]
  3. Park, S.B.; Park, Y.J.; Kim, K.U. Optimization of handle vibration of walking type cultivator. J. Biosyst. Eng. 2006, 31, 39–145. [Google Scholar] [CrossRef]
  4. Sam, B.; Kathirvel, K. Vibration characteristics of walking and riding type power tillers. Biosyst. Eng. 2006, 95, 517–528. [Google Scholar] [CrossRef]
  5. Chaturvedi, V.; Kumar, A.; Singh, J.K. Power tiller: Vibration magnitudes and intervention development for vibration reduction. Appl. Ergon. 2012, 43, 891–901. [Google Scholar] [CrossRef] [PubMed]
  6. Kim, W.S.; Chung, S.O.; Choi, C.H.; Cho, J.S.; Choi, D.S.; Kim, Y.J.; Lee, S.D.; Hong, S.J.; Kim, Y.J.; Koo, S.M. Analysis of the PTO Torque of a Transplanter by Planting Condition. J. Biosyst. Eng. 2016, 41, 313–318. [Google Scholar] [CrossRef] [Green Version]
  7. Lee, D.H.; Kim, Y.J.; Chung, S.O.; Choi, C.H.; Lee, K.H.; Shin, B.S. Analysis of the PTO load of a 75 kW agricultural tractor during rotary tillage and baler operation in Korean upland fields. J. Terramech. 2015, 60, 75–83. [Google Scholar] [CrossRef]
  8. Jung, J.W.; Kim, K.P.; Ji, H.C.; Moon, T.S. Design Improvement of the Driving Bevel Gearin Transmissions of a Tracked Vehicle. J. Korean Soc. Manuf. Process Eng. 2015, 14, 1–6. [Google Scholar] [CrossRef]
  9. Shim, S.B.; Park, Y.J.; Kim, K.U. Reduction of PTO rattle noise of an agricultural tractor using an anti-backlash gear. J. Biosyst. Eng. 2008, 100, 346–354. [Google Scholar] [CrossRef]
  10. Zhang, J.K.; Cheng, X.Q.; Li, Z.N. Total fatigue life prediction for Ti-alloys airframe structure based on durability and damage-tolerant design concept. Mater. Des. 2010, 31, 4329–4335. [Google Scholar] [CrossRef]
  11. Han, H.S.; Lee, J.K. Development of a Web-based Powertrain Performance Simulation System. J. Korean Soc. Precis. Eng. 2004, 21, 100–107. [Google Scholar]
  12. Timothy, J.L.; Brian, A.S.; Robert, C.F. External spur gear root bending stress: A comparison of ISO 6336:2006, AGMA 2101-D04, ANSYS finite element analysis and strain gauge techniques. Mech. Mach. Theory 2017, 111, 1–9. [Google Scholar] [CrossRef]
  13. Wu, Y.R.; Van, T.T. Transmission and load analysis for a crowned helical gear pair with twist-free tooth flanks generated by an external gear honing machine. Mech. Mach. Theory 2016, 98, 36–47. [Google Scholar] [CrossRef]
  14. Yoo, K.H.; Claude, E.B. Hydrology and Water Supply for Pond Aquaculture, 1st ed.; Springer Science & Business Media: New York, NY, USA, 2012; pp. 346–347. [Google Scholar]
  15. Yu, Y.; Zhang, S.; Li, H.; Wang, X.; Tang, Y. Modal and Harmonic Response Analysis of Key Components of Ditch device Based on ANSYS. Procedia Eng. 2017, 174, 956–964. [Google Scholar] [CrossRef]
  16. Standard ISO. 6336-1, Calculation of Load Capacity of Spur and Helical Gears; International Standard Organization: Geneva, Switzerland, 2006. [Google Scholar]
  17. Standard ISO. 6336-2, Calculation of Load Capacity of Spur and Helical Gears; International Standard Organization: Geneva, Switzerland, 2006. [Google Scholar]
  18. Standard ISO. 6336-3, Calculation of Load Capacity of Spur and Helical Gears; International Standard Organization: Geneva, Switzerland, 2006. [Google Scholar]
  19. Standard ISO. 6336-4, Calculation of Load Capacity of Spur and Helical Gears; International Standard Organization: Geneva, Switzerland, 2006. [Google Scholar]
  20. Standard ISO. 6336-5, Calculation of Load Capacity of Spur and Helical Gears; International Standard Organization: Geneva, Switzerland, 2006. [Google Scholar]
  21. Kim, J.H.; Kim, K.U.; Yong, G.W. Analysis of transmission load of agricultural tractors. J. Terramech. 2000, 37, 113–125. [Google Scholar] [CrossRef]
  22. Anthes, R.J. Modified rainflow counting keeping the load sequence. Int. J. Fatigue 1997, 19, 529–535. [Google Scholar] [CrossRef]
  23. Dowling, N.E. Fatigue failure predictions for complicated stress—Strain histories. J. Mater. 1971, 7, 71–87. [Google Scholar] [CrossRef]
  24. Marsh, G.; Wignall, C.; Thies, P.R.; Barltrop, N.; Incecik, A.; Venugopal, V.; Johanning, L. Review and application of Rainflow residue processing techniques for accurate fatigue damage estimation. Int. J. Fatigue 2016, 82, 757–765. [Google Scholar] [CrossRef] [Green Version]
  25. Smith, R.N.; Wastson, P.; Topper, T.H. A stress-strain parameter for the fatigue of metals. J. Mater. 1970, 5, 767–778. [Google Scholar]
  26. Park, D.B.; Sung, S.M.; Hwang, P.; Hong, D.K.; Kim, J.M. Design and analysis for a direct-axis drive of electric car. J. Korean Soc. Precis. Eng. 2014, 31, 544–545. [Google Scholar]
  27. McVittie, D. ISO 6336-5: Strength and quality of materials. Gear Technol. 1999, 16, 20–23. [Google Scholar]
  28. Miner, M.A. Cumulative damage in fatigue. J. Appl. Mech. 1945, 12, 159–164. [Google Scholar]
  29. Kim, D.C.; Ryu, I.H.; Kim, K.U. Analysis of tractor transmission and driving axle loads. Trans. ASAE 2001, 44, 751–757. [Google Scholar] [CrossRef]
  30. Stroup, W.W. Rethinking the analysis of non-normal data in plant and soil science. Agron. J. 2015, 107, 811–827. [Google Scholar] [CrossRef]
  31. Glancey, J.L.; Upadhyaya, S.K. An improved technique for agriculture implement draught analysis. Soil Tillage Res. 1995, 35, 175–182. [Google Scholar] [CrossRef]
  32. Kim, Y.J.; Chung, S.O.; Choi, C.H. Effects of gear selection of an agricultural tractor on transmission and PTO load during rotary tillage. Soil Tillage Res. 2013, 134, 90–96. [Google Scholar] [CrossRef]
  33. Nenad, M.; Biserka, I.; Vesna, M.; Zoran, M.; Mirko, B.; Milorad, B. A practical approach to the optimization of gear trains with spur gears. Mech. Mach. Theory 2012, 53, 1–16. [Google Scholar] [CrossRef]
Figure 1. Schematic diagram of the power flow for the cultivator. PTO = power take off.
Energies 12 01100 g001
Figure 2. Torque measurement system for the cultivator.
Energies 12 01100 g002
Figure 3. Driveline of the PTO (power take off) gear-train of the cultivator; (a) in PTO gear stage 1 (P1) and (b) in PTO gear stage 2 (P2).
Energies 12 01100 g003
Figure 4. Computation process for safety factor and fatigue life of the PTO (power take off) gear-train.
Energies 12 01100 g004
Figure 5. (a) PTO torque and (b) load spectrum during a rotary ditching operation.
Energies 12 01100 g005
Figure 6. Safety factor at P1 during a rotary ditching operation.
Energies 12 01100 g006
Figure 7. Safety factor at P2 during a rotary ditching operation.
Energies 12 01100 g007
Table 1. Specifications used to study the PTO gear-train.
ItemGear 1Gear 2Gear 3Gear 4Gear 5
Number of teeth2321311529
Face width (mm)136666
Pitch diameter (mm)57.552.577.537.572.5
Module (mm)2.52.52.52.52.5
Profile shift coefficient0.450.470.530.60.3
Table 2. ANOVA analysis of the PTO torque by gear combination during a rotary ditching operation.
VariationDegrees of FreedomSum of SquaresMean SquaresF-Valuep-Value
Between Groups3.00293,269.7797,756.593298.260.00 *
* There are significantly different at p < 0.05.
Table 3. Descriptive statistic results of the PTO torque by gear combination during a rotary ditching operation.
ParameterT1P1T2P1T1P2T2P2
Number of data (n)4833456647674539
Min. (Nm)3.584.013.534.16
Avg. (Nm)9.87 a16.32 b15.09 b20.84 c
Max. (Nm)21.0232.1130.6140.79
Std. Dev. (Nm)3.354.804.736.87
a,b,c Means with different superscripts in each column are significantly different at p < 0.05 according to Duncan’s multiple range tests.
Table 4. Simulation results of the fatigue life of the PTO gear-train.
Gear SettingGearFatigue Life at PTO Gear Root (h)Fatigue Life at PTO Gear Flank (h)
T1P1G4114,44011,790
G5>106 *29,440
G2283,10016,090
G310,41023,840
T2P1G4668972
G537572269
G2674889
G38442367
T1P2G1>106 *45,950
G2606728,500
G3>106 *498,400
T2P2G1>106 *4294
G22582854
G3583,00023,260
* Means with different superscripts in each column are those with a service life >106 h.

