Space/Interface Charge Analysis of the Multi-Layer Oil Gap and Oil Impregnated Pressboard Under the Electrical-Thermal Combined Stress


State Key Laboratory of Power Transmission Equipment & System Security and New Technology, Chongqing University, Chongqing 400044, China
*
Author to whom correspondence should be addressed.
Energies 2019, 12(6), 1099; https://doi.org/10.3390/en12061099
Submission received: 31 January 2019
/
Revised: 6 March 2019
/
Accepted: 18 March 2019
/
Published: 21 March 2019
(This article belongs to the Special Issue High Voltage Engineering and Applications)
Abstract
:In oil-paper insulation systems, it is easy to accumulate space/interface charge under a direct current (DC) electrical field. At present, direct measurement of space/interface charge for a thick multi-layer insulation system is not possible. It is necessary to study the multi-layer oil-paper insulation system via simulation method. In this paper, the space/interface charge simulation based on the bipolar charge transport model and a simulation parameter using FEM for the multi-layer oil–paper insulation system was proposed. The influence of electrical field strength, temperature, and the combined influence of the electrical field strength and temperature on the space/interface charge behaviors were analyzed, respectively. A new method for calculating the space/interface charge density and the total charge quantity of the multi-layer oil-paper insulation under the combined action of electrical field strength and temperature was presented. Results show that the interface charge density absolute value and the total charge quantity at steady state both increases with the electrical field strength and temperature in an exponential way, respectively. Besides, temperature has a more significant influence on the charge density and the total charge quantity than the electrical field strength. The electrical field strength–temperature shifting factor αT’ was introduced for the translation of the charge density curves or the total charge quantity curves to construct the charge density main curve or the total charge quantity main curve under the combined action of electrical field strength and temperature. The equations for calculating the charge density or the total charge quantity of the multi-layer oil-paper insulation was provided, which could be used to calculate the charge density or the total charge quantity under the combined action of electrical field strength and temperature.
1. Introduction
Converter transformer is the key equipment of the high voltage direct current (HVDC) power grid. The outlet device of a converter transformer is mainly used to connect winding coil and bushing. The stable insulation performance of the outlet device on the valve side of the converter transformer plays a key role in the safe operation of a converter transformer [1]. The outlet device is mainly composed of a multi-layer oil-paper insulation system. Under DC voltage, the oil-paper insulation system is easy to accumulate space/interface charge. The accumulation of space/interface charges is a key factor affecting the oil-paper insulation performance of an outlet device. Space/interface charge can distort the local electrical field of the oil-paper insulation system, which will lead to insulation breakdown or cause material degradation [2,3,4,5,6].
At present, two types of model have been applied to describe space charge movement in insulation dielectrics, these being a unipolar charge transport model and bipolar charge transport model. Space/interface charge simulation provides an efficient way to understand the mechanism of space/interface charge migration and accumulation [7]. Guochang Li used the unipolar charge transport model to simulate the free/entrapped charge carriers’ density and their effect on the electric field distribution of a single layer LDPE [8]. Shuo Jin used the bipolar charge transport model to simulate the space charge density change with the variation of applied voltage time for a single layer oil-impregnated insulation paper [9]. Kai Wu also used the bipolar charge transport model to simulate the space charge density change with the variation of temperature for a double layer oil-impregnated insulation paper [10]. S Le Roy used a bipolar charge transport model to simulate the space charge characteristics of LDPE under three different DC voltage application protocols and compared the simulation results with the experimental results attained by three different measurement methods to validate the correctness [11]. B. B. Alagoz et al. used a bipolar charge transport model to investigate the space charge’s behaviors in the corona electrostatic fields and estimated the basic electrical characteristics of the system such as current draw and voltage drops [12]. B. Hamed used this model to simulate the space charge dynamic in low-density polyethylene under high DC voltage and found the appearance of a negative packet-like space charge [13].
Now the direct measurement of space/interface charge for the thick multi-layer insulation system is not possible due to the fact that the signal will decay with the increase of sample thickness [14]. A current study on space charge simulation mostly focused on a single-layer structure or a two-layer structure with the same kind of material, while the study on the multi-layer structure with an oil gap and oil-impregnated pressboard system is lack of research. Therefore, it is necessary to study the multi-layer oil impregnated pressboard and oil gap system via a simulation method.
In this paper, the bipolar charge transport model was used to simulate the space/interface charge behaviors for multi-layer oil-paper insulation using upstream finite element method (FEM). The influence of electrical field strength, temperature, and the combined action of the electrical field strength and temperature on the space/interface charge behaviors were analyzed, respectively. A new method for calculating the space/interface charge density and the total charge quantity of the multi-layer oil-paper insulation under the combined action of electrical field strength and temperature is presented.
2. Simulation Method
2.1. Charge Injection
The injection of the space charge is usually assumed to be a Schottky injection, as shown in Equations (1) and (2) [15]. Where jh stands for the flux of holes at the anode side, je stands for the flux of electrons at the cathode side, A stands for the Richardson constant, 1.2 × 10⁶ A/m2·K2. We and Wh are the injection barriers for electrons and holes. kb is the Boltzmann constant, 1.38 × 10⁻²³ J/K. E (0,t) and E (d,t) are the electric field intensity at the anode and cathode, respectively. ε0 is the permittivity of vacuum and εr is the relative dielectric constant of the insulating material. e stands for the charge quantity of one charge carrier which is 1.6 × 10⁻¹⁶ C.
2.2. Charge Carriers Movement
The charge movement in the insulation is governed by a set of self-consistent equations. Equation (3) is the Poisson equation describing the electric field distribution; Equation (4) is the transport equation which describes the migration of charge carriers; and Equation (5) is the convection equation which describes the variation of charge density.
There are a large number of traps existing within the insulation materials [16]. Those traps are caused by the physical and chemical defects [17,18,19,20,21]. When charge carriers move in the medium, it is possible to be entrapped. Meanwhile, those entrapped charge carriers have a certain possibility to be detrapped. There are four types of charge carriers named free holes, free electrons, trapped holes, and trapped electrons [16]. Therefore, the variation of charge density can be described by the following Equations (6)–(9).
In the equations above, Bef,hf, Bef,ht, Bet,ht, and Bet,hf are the recombination coefficient for free electrons/free holes, free electrons/trapped holes, trapped electrons/trapped holes, and trapped electrons/free holes, respectively. Beft, Betf, Bhft, and Bhtf represent the movement of free electrons to be trapped, trapped electrons to be detrapped, free holes to be trapped, and trapped holes to be detrapped, respectively. Nt,e is the trap quantity for electrons, and Nt,h is the trap quantity for holes. Sef is the density for free electrons, Shf is the density for free holes, Set is the density for trapped electrons, and Sht is the density for trapped holes. Then the total density variation is the sum of those four kinds of charge carriers’ change, as shown in Equation (10).
2.3. Space Charge Movement at the Interface Between Oil gap and Oil Impregnated Pressboard
The space charge could accumulate at the interface between two different insulation materials. The discontinuity of permittivity and conductivity will cause space charge polarization, which is called Maxwell-Wagner (M-W) polarization [22]. The M-W polarization diagram is shown in Figure 1 and Equations (11)–(14). In the following equations, U stands for the electric potential, E1 stands for the electrical field strength for dielectric 1; E2 stands for the electrical field strength for dielectric 2; ε1 is the relative dielectric constant for dielectric 1 while ε2 is the relative dielectric constant for dielectric 2; l1 and l2 are the conductivities for dielectric 1 and 2 respectively; and is the charge density. Part of the polarized charge at the interface will move into the layer structures on both sides of the interface. In order to move into the layer, charges have to overcome the energy barrier of the layer structure. This movement is described by Equation (15), which is called the Poole–Frenkel equation. In the equation, Wi stands for the barrier’s energy level, which is set to 1.2 eV; A’ is the probability of injection which is set to 0.4 here.
The model in Figure 1 illustrates that the difference of ε2l1−ε1l2 will determine whether the polarity at the interface will be the same as the polarity on the left or right side. In this case, since the relative dielectric constant of both dielectrics is relatively close compared with the conductivity, the charges polarity at the interface is largely determined by the conductance of dielectrics. In order to solve Equations (3)–(5) with the consideration of Equations (6)–(9) and obtain the space charge density of each point at each time step, the model was meshed with a unit length ratio of 0.1009 and then the upstream finite element method was applied [23,24,25]. The flow chart for simulation is shown in Figure 2. The parameters for simulation were set with the reference from literature [16,26], which is shown in Table 1.
3. Simulation Results and Discussions
3.1. Verification of Simulation Method
The three-layer “oil impregnated pressboard (OIP) + oil gap (OG) + oil impregnated pressboard (OIP)” can be considered as the simplest structure for a thick multi-layer oil gap and oil impregnated pressboard for converter transformer’s insulation. There are two interfaces in the three-layer “OIP + OG + OIP” sample. One interface has positive charge carrier accumulation while the other one has negative charge carrier accumulation, which will be helpful for analyzing both kinds of charge carriers under DC voltage. The simulation result and PEA measurement result for three-layer “OIP + OG + OIP” under DC 15 kV/mm are shown in Figure 3a,b.
The space charge injection is a homo-charge injection. The space charge carriers on both electrodes were injected into the bulk with the increase of voltage applied time, causing the space charge density in the bulk of the sample to increase, especially the charge density of the charges accumulated at the interface. The interface adjacent to the cathode has a positive charge accumulation, while the interface adjacent to the anode has negative charge accumulation. Figure 3b is the experimental result for three-layer “OIP + OG + OIP” under DC 15 kV/mm [27]. It can be seen that the simulation result shown in Figure 3a matches with the experimental result shown in Figure 3b. Figure 3c shows the charge density of the charges accumulated at both interfaces and variation with time for the three-layer “OIP + OG + OIP” sample. It can be observed that the interface charge density increases rapidly from 0 s to 600 s, the increment begins to slow down after 1200 s until it reaches saturation. This phenomenon is consistent with the charge accumulation behaviors presented in Reference [27]. The total charge amount Q of the three-layer “OIP + OG + OIP” during the DC voltage applied process was calculated based on Equation (16). Where S stands for the area of the electrode, l stands for the thickness of the sample, and q(x) means the charge density at position x, 0 ≤ x ≤ l. Figure 3d shows that the total charge amount Q of the three-layer “OIP + OG + OIP” during the DC voltage applied process increases quickly and then reaches a saturation value. This changing law is also the same as the result shown in Reference [27].
3.2. Electrical Field Strength Influence on the Space/Interface Charge Behavior
Figure 4 shows the space/interface charge simulation results for three-layer “OIP + OG + OIP” under different electrical field strengths at 20 °C. By comparing Figure 4a,b, it can be observed that the increase of electrical field strength will increase the charge density apparently. However, the polarity of the charges trapped at the interface does not change. The increase of electrical field strength from 15 kV/mm to 40 kV/mm will increase the interface charge density at a steady state from 2.4 C/m3 to 11.5 C/m3. Figure 4 shows that the electrical field strength has great influence on the space/interface charge density values.
Figure 4c is the charge density of the positive and negative charges accumulated at both interfaces under different field strengths. It can be observed that with a lager electrical field strength applied, the increment speed of charge density before 1200 s is significantly larger. However, from 1200 s to 1800 s, the increment speed of charge density under each electrical field strength is almost identical. Figure 4d shows the charge density at steady state for the positive charges accumulated at the interface adjacent to the cathode under different electrical field strengths. The charge density at steady state also increases with the electrical field strength in an exponential way.
The oil-insulation structure of two-layer “OG + OIP”, three-layer “OIP + OG + OIP”, four-layer “OG + OIP + OG + OIP”, five-layer “OIP + OG + OIP + OG + OIP”, six-layer “OG + OIP + OG + OIP + OG + OIP”, and seven-layer “OIP + OG + OIP + OG + OIP + OG + OIP” is shown in Figure 5. The oil gap thickness is 500 μm, and the oil impregnated insulation pressboard thickness is 1000 μm. The charge density absolute values of the charges accumulated at the first interface adjacent to the cathode for the oil-insulation structure of different layers were analyzed here, as shown in Figure 6. It can be found that the charge density absolute values at the steady state increase exponentially with the electrical field strength.
The fitting formula is shown in Equation (17) and Table 2. Dsteady stands for the charge density absolute value at steady state, C/m3. E stands for the electrical field strength, kV/mm. AE, BE and CE are the fitting coefficients. At high electrical field strength, the structure’s influence becomes remarkable. At 15 kV/mm, the charge density absolute value at steady state for all structures was all about 2.5 C/m3. While at 40 kV/mm, the charge density absolute value at steady state for the two-layer structure is 19.3 C/m3; for the three- and six-layer structures, the charge density absolute value at steady state is about 12.5 C/m3; for the four-, five- and seven-layer structures, the charge density absolute value at steady state is about 9.5 C/m3.
The charges accumulated at the interface are dependent on the charge injection from the electrode, the polarized charges determined by the conductivity, permittivity and thickness of dielectrics on both sides of the interface, the charge injection from the electrode, and also the charges migrated from the dielectrics and other interfaces. The interface charge migration and accumulation is illustrated in Figure 7. The accumulated charge density at the interface presents a dynamic change until the accumulated and dissipated charge tends to balance and the density value does not change. The structure of different layers contains different number of interfaces, and the distance of charge migration within the system is different, which leads to the difference of charge at the interface. In this paper, the simulation electric field strength was 15 kV/mm, 25 kV/mm, 30 kV/mm, 35 kV/mm, and 40 kV/mm, respectively. For any same electrical field strength, because of the above reasons for the generation and transfer of charges, the charge density at the interface is different for different layers of the oil-paper insulation structure, and the difference is more significant under higher electrical field strength, as shown in Figure 8.
The presence of space/interface charge in a multi-layer insulation system is able to enhance locally the electrical field. Nevertheless, in real applications, at the interface, the presence of voids is always at the origin of the partial discharges phenomena, which have a very large influence on the same electrical field [28,29]. In the present model, the defects in the oil-paper insulation are characterized by trap density shown in Table 1. The trap density here is the overall characterization of defects in the oil-paper system, not local defects. In the future, it is necessary to further study the relationship between charge accumulation at the interface and partial discharge.
The relationship between the total charge quantity and electrical field strength for different layers of the oil-paper insulation system is shown in Figure 8. It can be observed, that with the increase of electrical field strength, the total charge quantity for each multi-layer oil-paper insulation system increases in an exponential way, as described in Equation (18). The fitting coefficients for the results in Figure 8 are shown in Table 3. In Equation (18), Qe stands for the total charge quantity at steady state, and E stands for the electrical field strength, kV/mm. Ae, Be and Ce are the fitting coefficients. From Figure 8, it can also be observed that the increase layer of the oil-impregnated pressboard will bring a bigger increment of total charge quantity than the increase layer of the oil gap.
Since the fact that total charge quantity is the sum of the charge quantity of the whole system, the larger the system, the larger the total charge quantity. Therefore, for the simulation electric field strength at 15 kV/mm, 25 kV/mm, 30 kV/mm, 35 kV/mm and 40 kV/mm, respectively, the total charge quantity increases with the increase of insulation layers. Compared with the oil gap layer, adding an oil-impregnated pressboard layer will bring a bigger total charge quantity increase because the pressboard layer can cause more charge accumulation than the oil gap layer.
3.3. Temperature Influence on the Space/Interface Charge Behavior
Figure 9 shows the space/interface charge simulation result for the three-layer “OIP + OG + OIP” sample under DC 15 kV/mm at 40 °C and 60 °C, respectively. It can be observed that the increase of temperature significantly increased the charge density of the charges accumulated at the interfaces. High temperature brings about more charged injected into the sample. The reason for this phenomenon is mainly because the increase of temperature will give charge carriers more energy to overcome the barrier in the sample, and thus more charges will be injected into layers not only from electrodes, but also from interfaces.
The relationship between the charge density at the interface adjacent to the cathode for the oil-insulation structure with different layers at steady state and the temperature is shown in Figure 10. It can be found that the charge density absolute values at steady state increase exponentially with the temperature, as shown in Equation (19) and Table 4. In Equation (19), DTsteady stands for the charge density absolute values at steady state, C/m3. T stands for the temperature, °C. AT, BT and CT are the fitting coefficients. The charge density value increases by about 200 to 400 times when the temperature increases from 20 °C to 60 °C. Due to the fact that the interface charge density values become very large at 50 °C and 60 °C, the charge density values from 20 °C to 40 °C begin to overlap with each other. At 20 °C, the charge density absolute values at steady state for all structures are about 2.5 C/m3. At 50 °C, the difference of charge density between different layers is between 5–20 C/m3, at 60 °C, the difference of charge density between different layers is between 30–80 C/m3. In addition to the injection of electrode charges, this is mainly due to the more prominent behavior of charge dissipation and accumulation at the interface under high temperature. For all systems with different layer numbers, the interface charge density also increases with the increase of field strength; however, the interface charge density increases only about 5 to 10 times when the field strength increases from 15 kV/mm to 40 kV/mm. By comparing the simulation results, it can be seen that temperature has a more significant influence on the space/interface charge characteristics of the system than the electrical field strength. This trend is in accordance with the phenomenon mentioned in the literature [2,20].
The relationship between the total charge quantity and temperature for the multi-layer oil-paper insulation system is shown in Figure 11. It can be observed that with the increase of temperature, the total charge quantity for any kind of multi-layer oil-paper insulation system increases in an exponential way, which is described in Equation (20) and Table 5. In Equation (20), QQT stands for the total charge quantity at steady state with the unit C; T stands for the temperature with the unit °C. AQT, BQT and CQT are the fitting coefficients. From Figure 11, it can be observed that at each temperature under the same DC electrical field strength 15 kV/mm, the increase of the oil-impregnated pressboard layer will bring a greater increment of total charge quantity than the increase of the oil gap layer.
4. Space/Interface Charge Behavior Under the Electrical-Thermal Combined Stress
4.1. Charge Density Calculation Method for the Electrical-Thermal Combined Stress
If the electrical field strength and temperature combined effect on the charge density could be quantified, it will be of great significance to understand the charge distribution of the multi-layer oil-paper insulation system used in the converter transformer. In this paper, the charge density under the combined action of electrical field strength and temperature was calculated by the translation of the charge density curves. Here, the three-layer “OIP + OG + OIP” sample was selected to illustrate the proposed method.
The charge density absolute values of the charges accumulated at the interface adjacent to the cathode for the three-layer “OIP + OG + OIP” sample at steady state (applied DC voltage for 1800 s) under the combined effect of electrical field strength and temperature is shown in Figure 12. At each temperature, the interface charge density absolute values at steady state increase with the electrical field strength in an exponential way, as described in Equation (17).
The interface charge density absolute values at steady state under 40 °C is taken as the reference temperature. The curve of the charge density changing with electrical field strength under 40 °C is called the reference curve. Then the curve of the charge density changing with the electrical field strength under 20 °C and 30 °C was moved along the x axis to the reference curve horizontally. The combination of the three curves is called the charge density main curve, as shown in Figure 12. The ratio of the electrical field strength of a point on the original curve at temperature T’ (T’ = 20 °C, 30 °C or 40 °C) before and after being moved to the main curve is defined as the electrical field strength-temperature shift factor αT’, which is defined in Equation (21). Where ET’ is the electrical field strength of a point on the original curve at temperature T’ before being moved. Eref-T is the electrical field strength of that point after the curve at temperature T’ is moved to the reference temperature T. The αT’ value of the reference temperature T = 40 °C is defined as α40 = 1. The αT’ values for temperatures 30 °C and 20 °C are defined as α30 and α20, respectively. Based on the electrical field strength values of a point before and after being moved to the main curve, the α30 and α20 were calculated, where α30 = 2 and α20 = 4, as shown in Figure 12.
The electrical field strength-temperature shift factor αT’ can also be expressed with an Arrhenius equation, as shown in Equation (23). Where R is the Boltzmann constant, 8.314J K−1 mol−1. Ea is the activation energy, KJ/mol. T is the temperature before shifting, and Tref is the reference temperature, K. Based on the αT’ results shown in Figure 12, the calculated activation energy of the three-layer “OIP + OG + OIP” sample is 55 kJ/mol, which is similar to the value given by Stanmm in the literature [30], which indicates that the above calculation method for the charge density under the combined action of electrical field strength and temperature is correct. Therefore, by fitting the charge density data of the main curve at the reference temperature, the formula for calculating the charge density under the combined action of electrical field strength and temperature for the three-layer “OIP + OG + OIP” sample is obtained, as shown in Equation (22). The charge density under the combined action of electrical field strength and temperature can be obtained by removing the main curve according to the translation factor αT’.
With the translation method shown above, the charge density main curves for a multi-layer oil-paper insulation system were obtained, as shown in Figure 13. The equations for calculating the steady state charge density at the interface are shown in Table 6. By using the equations in Table 6, the steady state interface charge density can be calculated under the combined action of electrical field strength and temperature for different layers of a oil-paper insulation system.
4.2. Total Charge Quantity Calculation Method for the Electrical-Thermal Combined Stress
By using the translation method proposed above, the main curves for the total charge quantity under the combined action of electrical field strength and temperature for different layers of oil-paper insulation system can be attained, as shown in Figure 14. The equations for calculating the total charge quantity under the combined action of electrical field strength and temperature for different layers of oil-paper insulation system are shown in Table 7. By using the equations from Table 7, total charge quantity for different layers of the oil-paper insulation system can be calculated under any temperature or any electrical field strength.
5. Conclusions
The interface charge density absolute values at steady state increase with the electrical field strength and temperature in an exponential way, respectively. Temperature has a more significant influence on the charge density than the electrical field strength. The total charge quantity of the multi-layer oil gap and oil-impregnated insulation pressboard system also increases in an exponential way with the electrical field strength and temperature increases, respectively. The temperature has a more significant influence on the total charge quantity than the electrical field strength.
A new method for calculating the space/interface charge density or the total charge quantity of the multi-layer oil-paper insulation under the combined action of electrical field strength and temperature was proposed using the translation of the charge density curves or the total charge quantity curves. The electrical field strength-temperature shifting factor αT’ was introduced in this paper. The equations for calculating the charge density or the total charge quantity of the multi-layer oil-paper insulation under the combined action of electrical field strength and temperature were provided.
Author Contributions
R.Z. analyzed the simulation model, did the simulation and wrote the paper. J.H. analyzed the data, wrote and revised the paper. R.L. contributed in the discussion.
Acknowledgments
This work was supported by the National Key R&D Program of China (2017YFB0902704), the National Natural Science Foundation of China (51707022), China Postdoctoral Science Foundation (2017M612910) and Chongqing Special Funding Project for Post-Doctoral (Xm2017040).
Conflicts of Interest
The authors declare no conflict of interest.
References
- Lu, W.X.; Ooi, B.T. Optimal acquisition and aggregation of offshore wind power by multi terminal voltage-source HVDC. IEEE Trans. Power Deliv. 2003, 18, 201–206. [Google Scholar]
- Tang, C.; Huang, B.; Hao, M.; Xu, Z.Q.; Hao, J.; Chen, G. Progress of space charge research on oil-paper insulation using pulsed electroacoustic techniques. Energies 2016, 9, 53. [Google Scholar] [CrossRef]
- Du, B.X.; Zhang, J.G.; Liu, D.S. Interface charge behavior of multi-layer oil-paper insulation under DC and polarity reversal voltages. IEEE Trans. Dielectr. Electr. Insul. 2015, 22, 2628–2638. [Google Scholar] [CrossRef]
- Huang, B.; Hao, M.; Hao, J.; Fu, J.; Wang, Q.; Chen, G. Space charge characteristics in oil and oil-impregnated pressboard and electric field distortion after polarity reversal. IEEE Trans. Dielectr. Electr. Insul. 2016, 23, 881–891. [Google Scholar] [CrossRef]
- Ciobanu, R.; Schreiner, C.; Pfeiffer, W.; Baraboi, B. Space charge evolution in oil-paper insulation for DC cables application. In Proceedings of the 2002 IEEE 14th International Conference on Dielectric Liquids, Graz, Austria, 7–12 July 2002; pp. 321–324. [Google Scholar]
- Hao, J.; Chen, G.; Liao, R.J. Influence of moisture on space charge dynamics in multilayer oil-paper insulation. IEEE Trans. Dielectr. Electr. Insul. 2012, 19, 1456–1464. [Google Scholar] [CrossRef]
- Jin, S.; Ruan, J.; Du, Z.; Huang, G.; Zhu, L.; Guan, W.; Li, L.Y.; Yang, Z.F. Charge transport simulation in single-layer oil-paper insulation. IEEE Trans. Magn. 2016, 52, 1–4. [Google Scholar] [CrossRef]
- Li, G.; Li, S.; Min, D.M.; Zhao, N.; Zhu, Y. Influence of trap depths on space charge formation and accumulation characteristics in low density polyethylene. In Proceedings of the 2013 IEEE International Conference on Solid Dielectrics (ICSD), Bologna, Italy, 30 June–4 July 2013; pp. 698–701. [Google Scholar]
- Jin, S.; Ruan, J.; Du, Z. Charge transport in oil impregnated paper insulation under temperature gradient using transient upstream FEM. CSEE J. Power Energy Syst. 2015, 1, 3–8. [Google Scholar]
- Zhu, Q.D.; Wu, K.; Zhu, W. Numerical simulation of space charge property in oil-paper insulation space under temperature gradient. High Volt. Eng. 2016, 42, 923–930. [Google Scholar]
- Roy, S.L.; Teyssedre, G.; Laurent, C.; Montanari, G.C. Description of charge transport in polyethylene using a fluid model with a constant mobility: Fitting model and experiments. J. Phys. D Appl. Phys. 2006, 39, 1427–1433. [Google Scholar] [CrossRef]
- Alagoz, B.B.; Alisoy, H.Z.; Alagoz, S.; Hansu, F. A space charge motion simulation with FDTD method and application in negative corona electrostatic field analysis. Appl. Math. Comput. 2012, 218, 9007–9017. [Google Scholar] [CrossRef]
- Boukhari, H.; Rogti, F. Simulation of space charge dynamic in polyethylene under DC continuous electrical stress. J. Electron. Mater. 2016, 45, 5334–5340. [Google Scholar] [CrossRef]
- Hao, M. Space Charge Behavior in Thick Oil Pressboard Insulation System for Converter Transformers. Ph.D. Thesis, Southampton University, Southampton, UK, 2015. [Google Scholar]
- Roy, S.L.; Segur, P.; Teyssedre, G.; Laurent, C. Description of bipolar charge transport in polyethylene using a fluid model with a constant mobility: Model prediction. J. Phys. D Appl. Phys. 2004, 37, 298–305. [Google Scholar] [CrossRef]
- Alison, J.M.; Hill, R.M. A model for bipolar charge transport, trapping and recombination in degassed cross-linked polyethene. J. Phys. D Appl. Phys. 1994, 27, 1291–1299. [Google Scholar] [CrossRef]
- Wu, S.; Li, J.; Zhao, L.; Wang, Y.; He, Z.; Bao, L. The properties of space charge in oil-paper insulation during electrical-thermal aging. In Proceedings of the 2012 International Conference on High Voltage Engineering and Application, Shanghai, China, 17–20 September 2012; pp. 269–273. [Google Scholar]
- Zhou, Y.; Huang, M.; Chen, W.J.; Sun, Q.H.; Wang, Y.S.; Zhang, L. Space charge characteristics of interface in oil-paper insulation under DC voltage. High Volt. Eng. 2011, 37, 2417–2423. [Google Scholar]
- Wang, S.Q.; Zhang, G.J.; Mu, H.B.; Wang, D.; Lei, M.; Suwarno, S.; Tanaka, Y.; Takada, T. Effect of paper-aged state on space charge characteristics in oil-impregnated paper insulation. IEEE Trans. Dielectr. Electr. Insul. 2012, 19, 1871–1878. [Google Scholar] [CrossRef]
- Tang, C. Studies on the DC Space Charge Characteristics of Oil-Paper Insulation Materials. Ph.D. Thesis, Department of Electrical Engineering, Chongqing University, Chongqing, China, 2010. [Google Scholar]
- Hao, J.; Zou, R.H.; Liao, R.J.; Yang, L.J.; Liao, Q. New method for shallow and deep trap distribution analysis in oil impregnated insulation paper based on the space charge de-trapping. Energies 2018, 11, 271. [Google Scholar] [CrossRef]
- Delpino, S.; Fabiani, D.; Montanari, G.C. Polymeric HVDC cable design and space charge accumulation. Part 2: Insulation interfaces. IEEE Electr. Insul. Mag. 2008, 24, 14–24. [Google Scholar] [CrossRef]
- Takuma, T.; Ikeda, T.; Kawamoto, T. Calculation of ion flow fields of HVDC transmission lines by the finite element method. IEEE Trans. Power Appar. Syst. 1981, PAS-100, 4802–4810. [Google Scholar] [CrossRef]
- Du, Z.Y.; Huang, G.D.; Ruan, J.J.; Wang, G.L.; Yao, Y.; Liao, C.B.; Yuan, J.X.; Wen, W. Calculation of the ionized field around the DC voltage divider. IEEE Trans. Magn. 2013, 49, 1933–1936. [Google Scholar] [CrossRef]
- Huang, G.D.; Ruan, J.J.; Du, Z.Y.; Liao, C.B.; Jin, S.; Wang, G.L. Improved 3-D upwind FEM for solving ionized field of HVDC transmission lines. Proceeding CSEE 2013, 33, 152–159. [Google Scholar]
- Boufayed, F.; Teyssèdre, G.; Laurent, C.; Le Roy, S.; Dissado, L.A.; Ségur, P.; Montanari, G.C. Models of bipolar charge transport in polyethylene. J. Appl. Phys. 2006, 100, 826–856. [Google Scholar] [CrossRef]
- Hao, J.; Huang, B.; Chen, G.; Fu, J.; Wu, G.; Wang, Q. Space charge accumulation behavior of multilayer structure oil-paper insulation and its effect on electric field distribution. High Volt. Eng. 2017, 43, 1973–1979. [Google Scholar]
- Pompili, M.; Mazzetti, C.; Libotte, M. The effect of the definition used in measuring partial discharge inception voltages. IEEE Trans. Electr. Insul. 1993, 28, 1002–1006. [Google Scholar] [CrossRef]
- Calcara, L.; Pompili, M.; Muzi, F. Standard evolution of partial discharge detection in dielectric liquids. IEEE Trans. Dielectr. Electr. Insul. 2017, 24, 2–6. [Google Scholar] [CrossRef]
- Stamm, A.J. Theraml degradation of wood and cellulose. Ind. Eng. Chem. 1956, 48, 413–417. [Google Scholar] [CrossRef]
Figure 1.
Diagram for Maxwell–Wagner polarization.

Figure 2.
Flow chart for space/interface charge movement simulation.

Figure 3.
Space/interface charge simulation and PEA measurement result for three-layer “OIP+ OG + OIP” (15 kV/mm, 20 °C).
Figure 3.
Space/interface charge simulation and PEA measurement result for three-layer “OIP+ OG + OIP” (15 kV/mm, 20 °C).

Figure 4.
Space/interface charge simulation for three-layer “OIP + OG + OIP” under different electrical field strengths (20 °C).
Figure 4.
Space/interface charge simulation for three-layer “OIP + OG + OIP” under different electrical field strengths (20 °C).


Figure 5.
The oil-paper insulation structures with different layers.


Figure 6.
Interface charge density at steady state under different electrical field strengths (20 °C).
Figure 6.
Interface charge density at steady state under different electrical field strengths (20 °C).

Figure 7.
Schematic diagram of interfacial charge accumulation and migration.
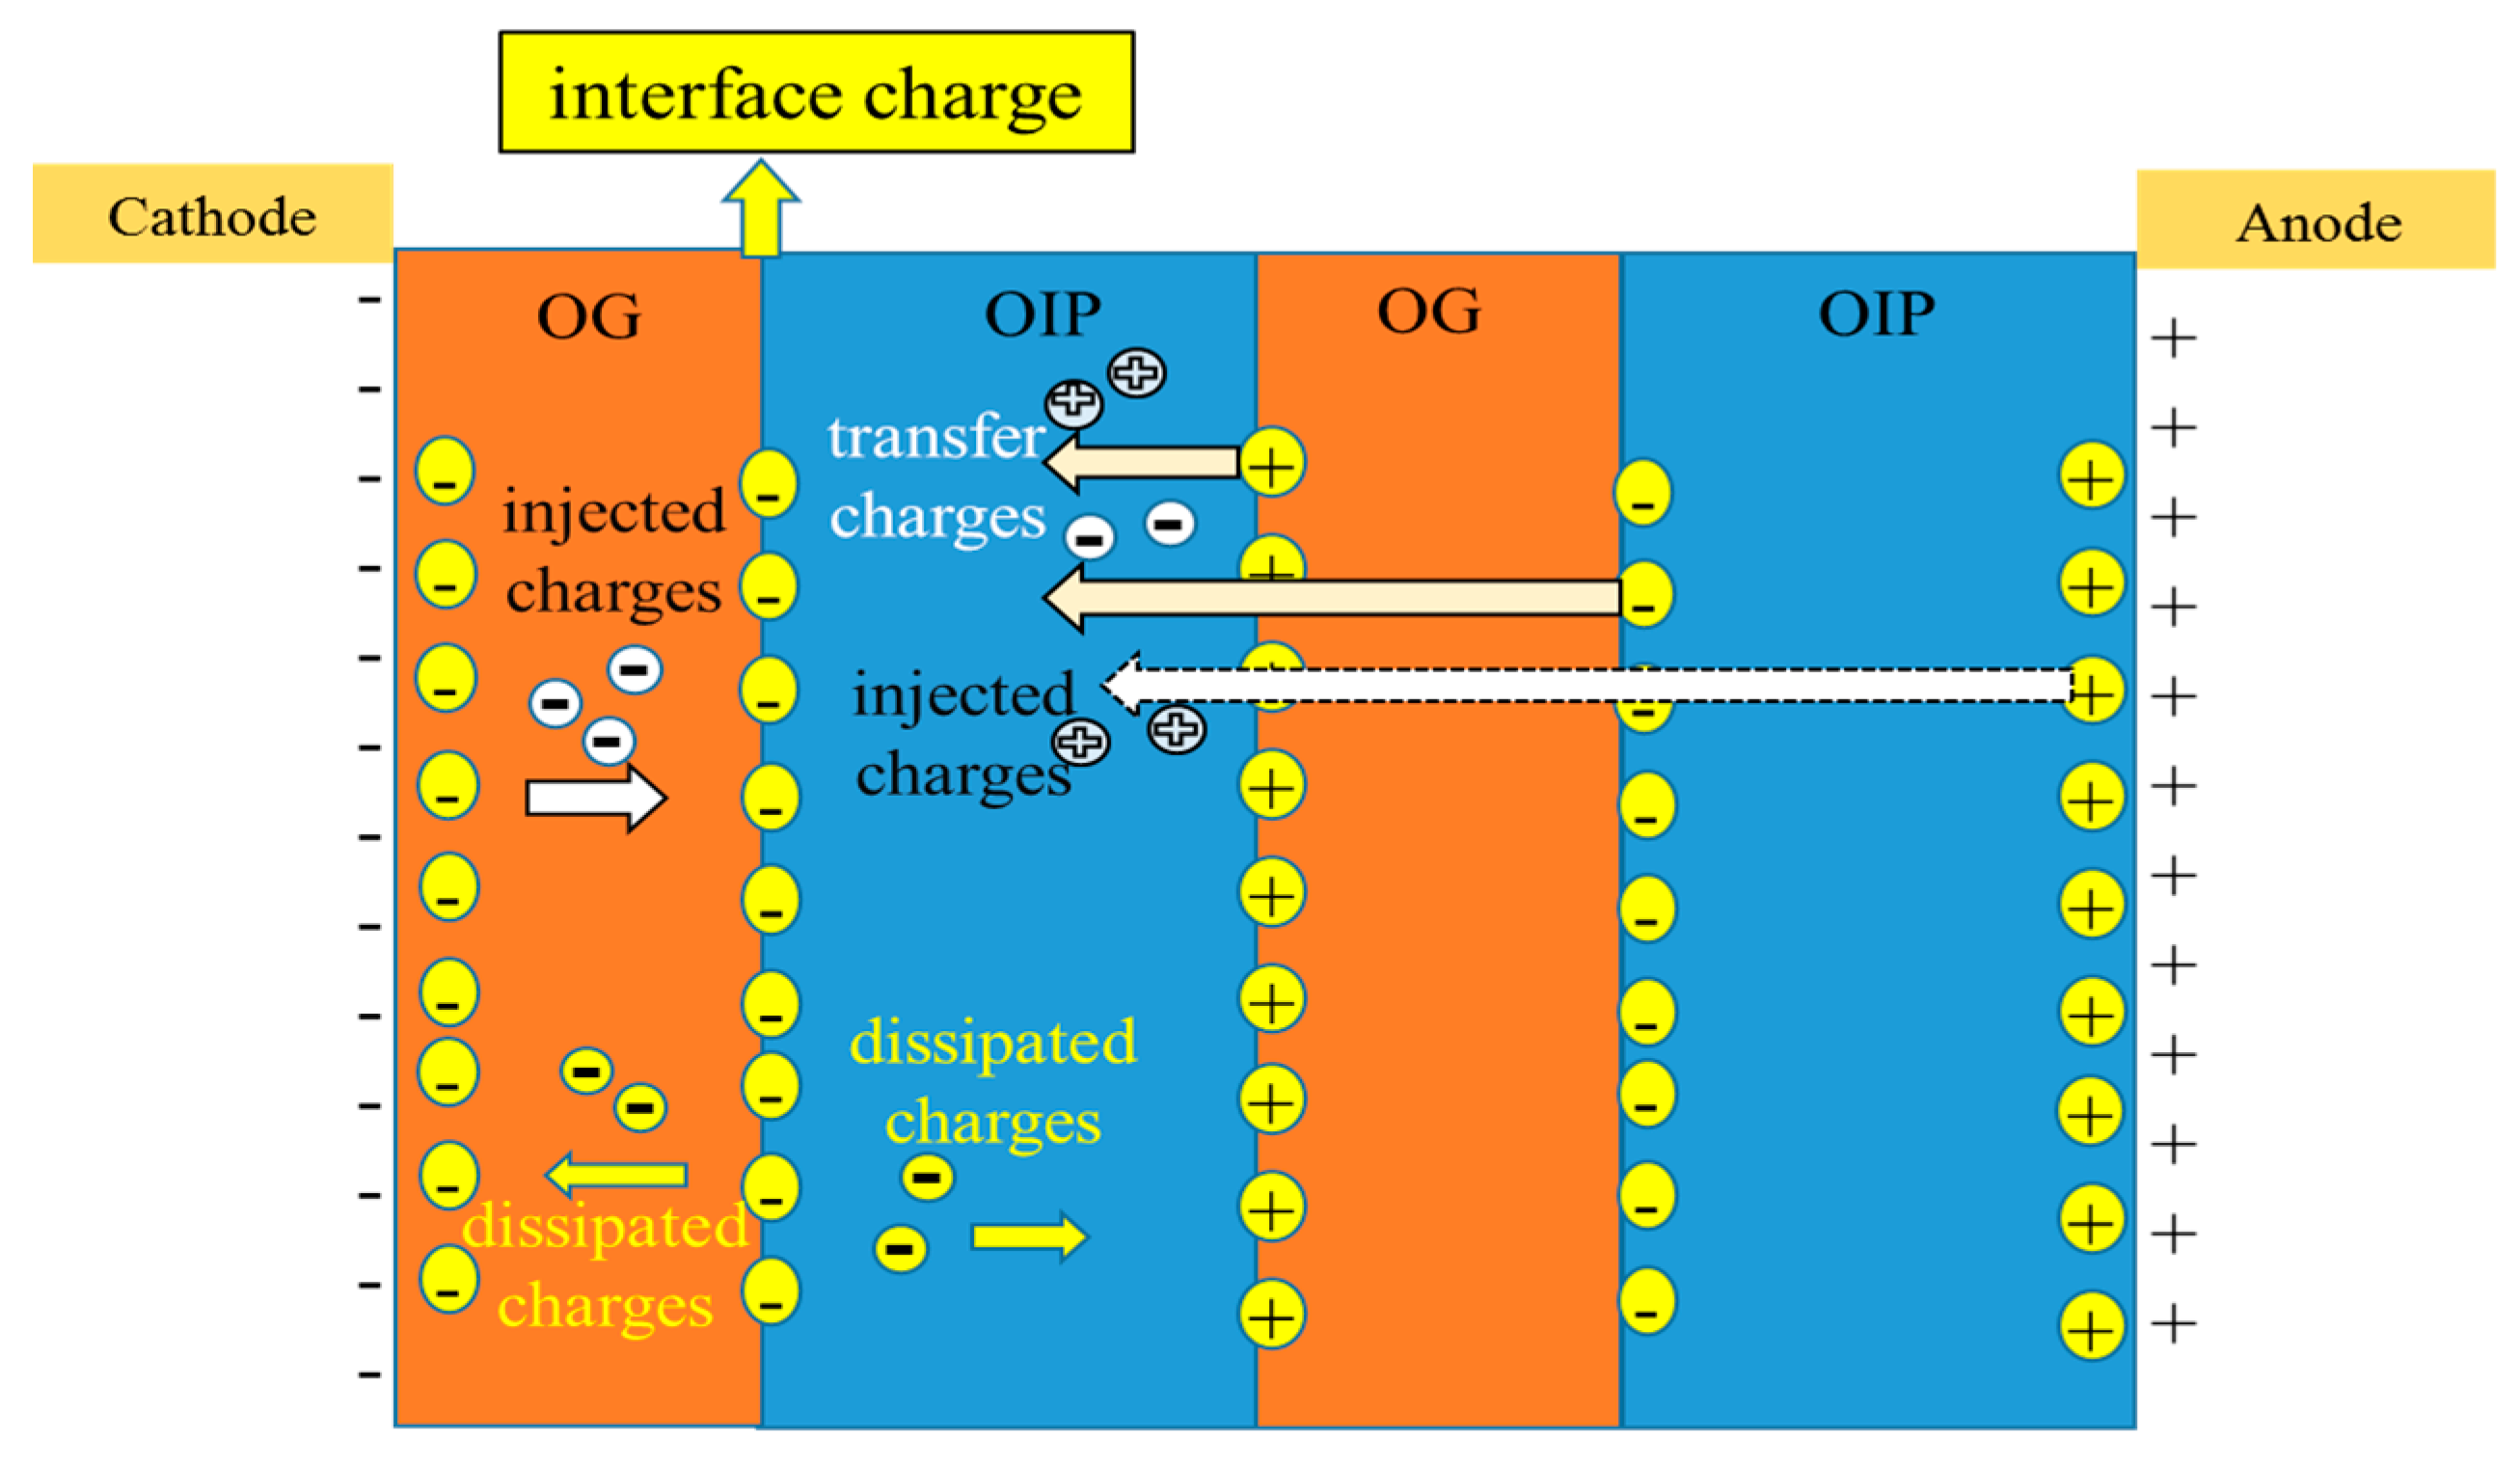
Figure 8.
Total charge quantity under different electrical field strengths (20 °C) for multi-layer oil-paper insulation.
Figure 8.
Total charge quantity under different electrical field strengths (20 °C) for multi-layer oil-paper insulation.

Figure 9.
Space charge simulation of three-layer “OIP + OG + OIP” system under different temperatures.
Figure 9.
Space charge simulation of three-layer “OIP + OG + OIP” system under different temperatures.

Figure 10.
Absolute value of interface steady state charge density with different temperatures (15 kV/mm).
Figure 10.
Absolute value of interface steady state charge density with different temperatures (15 kV/mm).

Figure 11.
Total charge quantity under different temperature for multi-layer oil-paper insulation (15 kV/mm).
Figure 11.
Total charge quantity under different temperature for multi-layer oil-paper insulation (15 kV/mm).

Figure 12.
Interface charge density absolute values at steady state under different electrical field strengths with different temperatures.
Figure 12.
Interface charge density absolute values at steady state under different electrical field strengths with different temperatures.

Figure 13.
Interface charge density absolute values at steady state under different electrical field strengths with different temperatures for multi-layer oil-paper insulation.
Figure 13.
Interface charge density absolute values at steady state under different electrical field strengths with different temperatures for multi-layer oil-paper insulation.


Figure 14.
Total charge quantity at steady state under different electrical field strengths with different temperatures for multi-layer oil-paper insulation.
Figure 14.
Total charge quantity at steady state under different electrical field strengths with different temperatures for multi-layer oil-paper insulation.


Table 1.
Parameters for simulation.
| Parameters | Assigned Value for Simulation |
|---|---|
| Mobility for electrons | 1 × 10⁻¹⁶ m2/(V×s) |
| Mobility for holes | 1 × 10⁻¹⁹ m2/(V×s) |
| Trapping coefficient—electron (Beft) | 5 × 10⁻³/s |
| Trapping coefficient—hole (Bhft) | 5 × 10⁻³/s |
| Detrapping coefficient—hole (Bhtf) | 5 × 10⁻⁶/s |
| Detrapping coefficient—electron (Beft) | 5 × 10⁻⁶/s |
| Trap concentration-e (Nt,e) | 100 C/m3 |
| Trap concentration-hole (Nt,h) | 100 C/m3 |
| Recombination coefficient for free electrons/free holes (Bef,hf) | 5 × 10⁻³ m3/(C×s) |
| Recombination coefficient for free electrons/trapped holes (Bef,ht) | 1 × 10⁻³ m3/(C×s) |
| Recombination coefficient for trapped electrons/free holes (Bet,hf) | 1 × 10⁻³ m3/(C×s) |
| Recombination coefficient (Bet,ht) | 0 |
| Barrier height for Schottky injection of electrons (We) | 1.2 eV |
| Barrier height for Schottky injection of holes (Wh) | 1.2 eV |
| Temperature (T) | 293.15 K |
| Sample thickness for oil gap | 500 μm |
| Sample thickness for oil impregnated pressboard | 1000 μm |
| Relative dielectric constant for oil gap | 2.2 |
| Relative dielectric constant for oil impregnated pressboard | 3.7 |
Table 2.
Fitting coefficients for interface charge density absolute value at steady state (1800 s) under different electrical field strengths for multi-layer oil-paper insulation.
Table 2.
Fitting coefficients for interface charge density absolute value at steady state (1800 s) under different electrical field strengths for multi-layer oil-paper insulation.
| Coefficients | Two Layers | Three Layers | Four Layers | Five Layers | Six Layers | Seven Layers |
|---|---|---|---|---|---|---|
| AE | −2.63 | −2.96 | −2.77 | −3.12 | −1.88 | −2.91 |
| BE | 1.56 | 2.36 | 2.31 | 2.6 | 1.55 | 2.43 |
| CE | 0.066 | 0.048 | 0.043 | 0.041 | 0.057 | 0.043 |
| R2 | 0.99 | 0.99 | 0.99 | 0.99 | 0.99 | 0.99 |
Table 3.
Fitting coefficients for total charge quantity at steady state (1800 s) under different electrical field strengths for multi-layer oil-paper insulation.
Table 3.
Fitting coefficients for total charge quantity at steady state (1800 s) under different electrical field strengths for multi-layer oil-paper insulation.
| Coefficients | Two Layers | Three Layers | Four Layers | Five Layers | Six Layers | Seven Layers | Eight Layers | Nine Layers | Ten Layers | Eleven Layers |
|---|---|---|---|---|---|---|---|---|---|---|
| Ae | −0.16 | −0.30 | −0.34 | −0.40 | −0.66 | −0.46 | −0.37 | −0.54 | −0.44 | −0.62 |
| Be | 0.14 | 0.28 | 0.33 | 0.38 | 0.58 | 0.42 | 0.36 | 0.48 | 0.41 | 0.55 |
| Ce | 0.04 | 0.04 | 0.04 | 0.04 | 0.03 | 0.04 | 0.05 | 0.04 | 0.05 | 0.05 |
| R2 | 0.999 | 0.995 | 0.994 | 0.996 | 0.994 | 0.993 | 0.995 | 0.994 | 0.992 | 0.993 |
Table 4.
Fitting parameters for charge density at steady state (1800 s) under different temperatures for multi-layer oil-paper insulation.
Table 4.
Fitting parameters for charge density at steady state (1800 s) under different temperatures for multi-layer oil-paper insulation.
| Parameters | Two Layers | Three Layers | Four Layers | Five Layers | Six Layers | Seven Layers |
|---|---|---|---|---|---|---|
| AT | 0.062 | 0.083 | 0.094 | −0.004 | 0.232 | 0.018 |
| BT | 0.089 | 0.106 | 0.088 | 0.102 | 0.084 | 0.098 |
| CT | 0.144 | 0.143 | 0.144 | 0.142 | 0.146 | 0.143 |
| R2 | 0.99 | 0.99 | 0.99 | 0.99 | 0.99 | 0.99 |
Table 5.
Fitting parameters for the total charge quantity at steady state (1800 s) under different temperatures for multi-layer oil-paper insulation.
Table 5.
Fitting parameters for the total charge quantity at steady state (1800 s) under different temperatures for multi-layer oil-paper insulation.
| Coefficients | Two Layers | Three Layers | Four Layers | Five Layers | Six Layers | Seven Layers | Eight Layers | Nine Layers | Ten Layers | Eleven Layers |
|---|---|---|---|---|---|---|---|---|---|---|
| AQT | −0.67 | −0.95 | −1.2 | −0.98 | −1.00 | −1.02 | −0.99 | −0.88 | −1.01 | −0.88 |
| BQT | 0.10 | 0.12 | 0.18 | 0.11 | 0.13 | 0.11 | 0.13 | 0.12 | 0.13 | 0.13 |
| CQT | 0.09 | 0.10 | 0.09 | 0.10 | 0.10 | 0.11 | 0.11 | 0.11 | 0.11 | 0.11 |
| R2 | 0.99 | 0.99 | 0.99 | 0.99 | 0.99 | 0.99 | 0.99 | 0.99 | 0.99 | 0.99 |
Table 6.
Calculation equations for the charge density under the combined action of electrical field strength and temperature for multi-layer oil-paper insulation.
Table 6.
Calculation equations for the charge density under the combined action of electrical field strength and temperature for multi-layer oil-paper insulation.
| Sample | Equations for Charge Density |
|---|---|
| two layers | |
| three layers | |
| four layers | |
| five layers | |
| six layers | |
| seven layers |
Table 7.
Calculation equations for the total charge quantity under the combined action of electrical field strength and temperature for multi-layer oil-paper insulation.
Table 7.
Calculation equations for the total charge quantity under the combined action of electrical field strength and temperature for multi-layer oil-paper insulation.
| Sample | Equations for Total Charge Quantity |
|---|---|
| two layers | |
| three layers | |
| four layers | |
| five layers | |
| six layers | |
| seven layers |
© 2019 by the authors. Licensee MDPI, Basel, Switzerland. This article is an open access article distributed under the terms and conditions of the Creative Commons Attribution (CC BY) license (http://creativecommons.org/licenses/by/4.0/).
Share and Cite
MDPI and ACS Style
Zou, R.; Hao, J.; Liao, R. Space/Interface Charge Analysis of the Multi-Layer Oil Gap and Oil Impregnated Pressboard Under the Electrical-Thermal Combined Stress. Energies 2019, 12, 1099. https://doi.org/10.3390/en12061099
AMA Style
Zou R, Hao J, Liao R. Space/Interface Charge Analysis of the Multi-Layer Oil Gap and Oil Impregnated Pressboard Under the Electrical-Thermal Combined Stress. Energies. 2019; 12(6):1099. https://doi.org/10.3390/en12061099
Chicago/Turabian StyleZou, Runhao, Jian Hao, and Ruijin Liao. 2019. "Space/Interface Charge Analysis of the Multi-Layer Oil Gap and Oil Impregnated Pressboard Under the Electrical-Thermal Combined Stress" Energies 12, no. 6: 1099. https://doi.org/10.3390/en12061099
Note that from the first issue of 2016, this journal uses article numbers instead of page numbers. See further details here.